

The information in this publication is the result of checkoff investments in soybean research. We hope you find this information valuable and wish you a successful 2026 soybean crop.

Like most years, this growing season began with optimism and well-developed plans for a successful soybean crop. It didn’t take long for those plans to require adjustment. Most soybeans have been planted later than planned; some into seedbeds that were less than ideal conditions. We don’t yet know what the rest of the growing has in store for us, but it will likely require more judgment calls and adjustments. Our hope is this guide will help with some of those adjustments and judgment calls by offering tips to protect your yields from weeds and white mold and offering ways to execute pest control with precision.



our Research subcommittee
The farmer directors on the Michigan Soybean Committee board acknowledge the need for soybean growers to be especially efficient under these market conditions. The information in this guide is a result of production research funding of projects with a common goal of finding practical applications that will benefit soybean growers across the state. We will continue to fine tune our research portfolio to address your most critical needs. Please provide input to your local farmer director or staff if you have ideas for improvement.
John Burk

DR. CHRISTY SPRAGUE
PROFESSOR AND WEED EXTENSION SPECIALIST, MICHIGAN STATE UNIVERSITY
Despite continued advances in soybean herbicide technologies, postemergence (POST) weed control remains one of the most failure-prone steps in soybean production. Herbicide resistance, variable weather and extended weed emergence patterns mean there is little room for error. The following checklist highlights the most critical factors for successful POST weed control in soybeans in 2026.
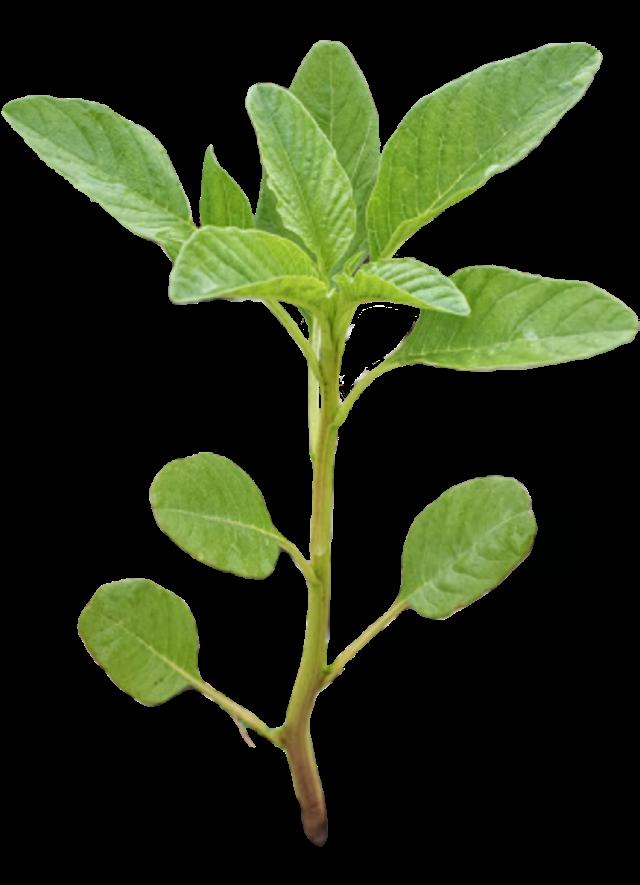
Across all POST herbicides, the single most important factor influencing control is weed size at application. Target weeds when they are 2-4 inches tall. Control declines rapidly as weeds grow larger, even when using full, labeled rates. Delayed applications are one of the most common causes of poor POST performance and often cannot be corrected later in the season.
POST applications must also comply with soybean growth stage restrictions to avoid crop injury and off label use.
Key examples include:
• Liberty Ultra (glufosinate): Apply up to R1 (beginning bloom) soybean
• Enlist One and Enlist Duo: Apply through R1 soybean
• Roundup PowerMax 3 (glyphosate): Apply through full flower (R2) soybean
Applications made beyond these stages should not be treated as rescue options and often provide inconsistent weed control.
Use full, effective herbicide rates, especially where weed populations and resistance are high. Below are examples of POST herbicides and recommended application rates.
• Liberty Ultra performs best when applied to small, actively growing weeds under warm, sunny conditions. Reduced rates or delayed applications can result in regrowth. The recommended use rate for Liberty Ultra is 24 fl oz/A with a maximum rate of 34 fl oz/A.
• Glyphosate (Roundup PowerMax 3) maximum rates depend on weed size and susceptibility. The recommended rate is 1.13 lb ae/A (≈ 30 fl oz/A). For
tougher to control and larger weeds, increase the rate to 1.5 lb ae/A (≈ 40 fl oz/A). Lower rates may still be effective on susceptible grass species, but no glyphosate rate will overcome glyphosate resistance.
Adjuvant selection and sprayer setup frequently determine success or failure.
• Ammonium sulfate (AMS) is strongly recommended with both glyphosate and glufosinate (Liberty) to improve uptake.
• Follow the label for adjuvant type and rate for each product and tank mix. This is especially important for Enlist products.
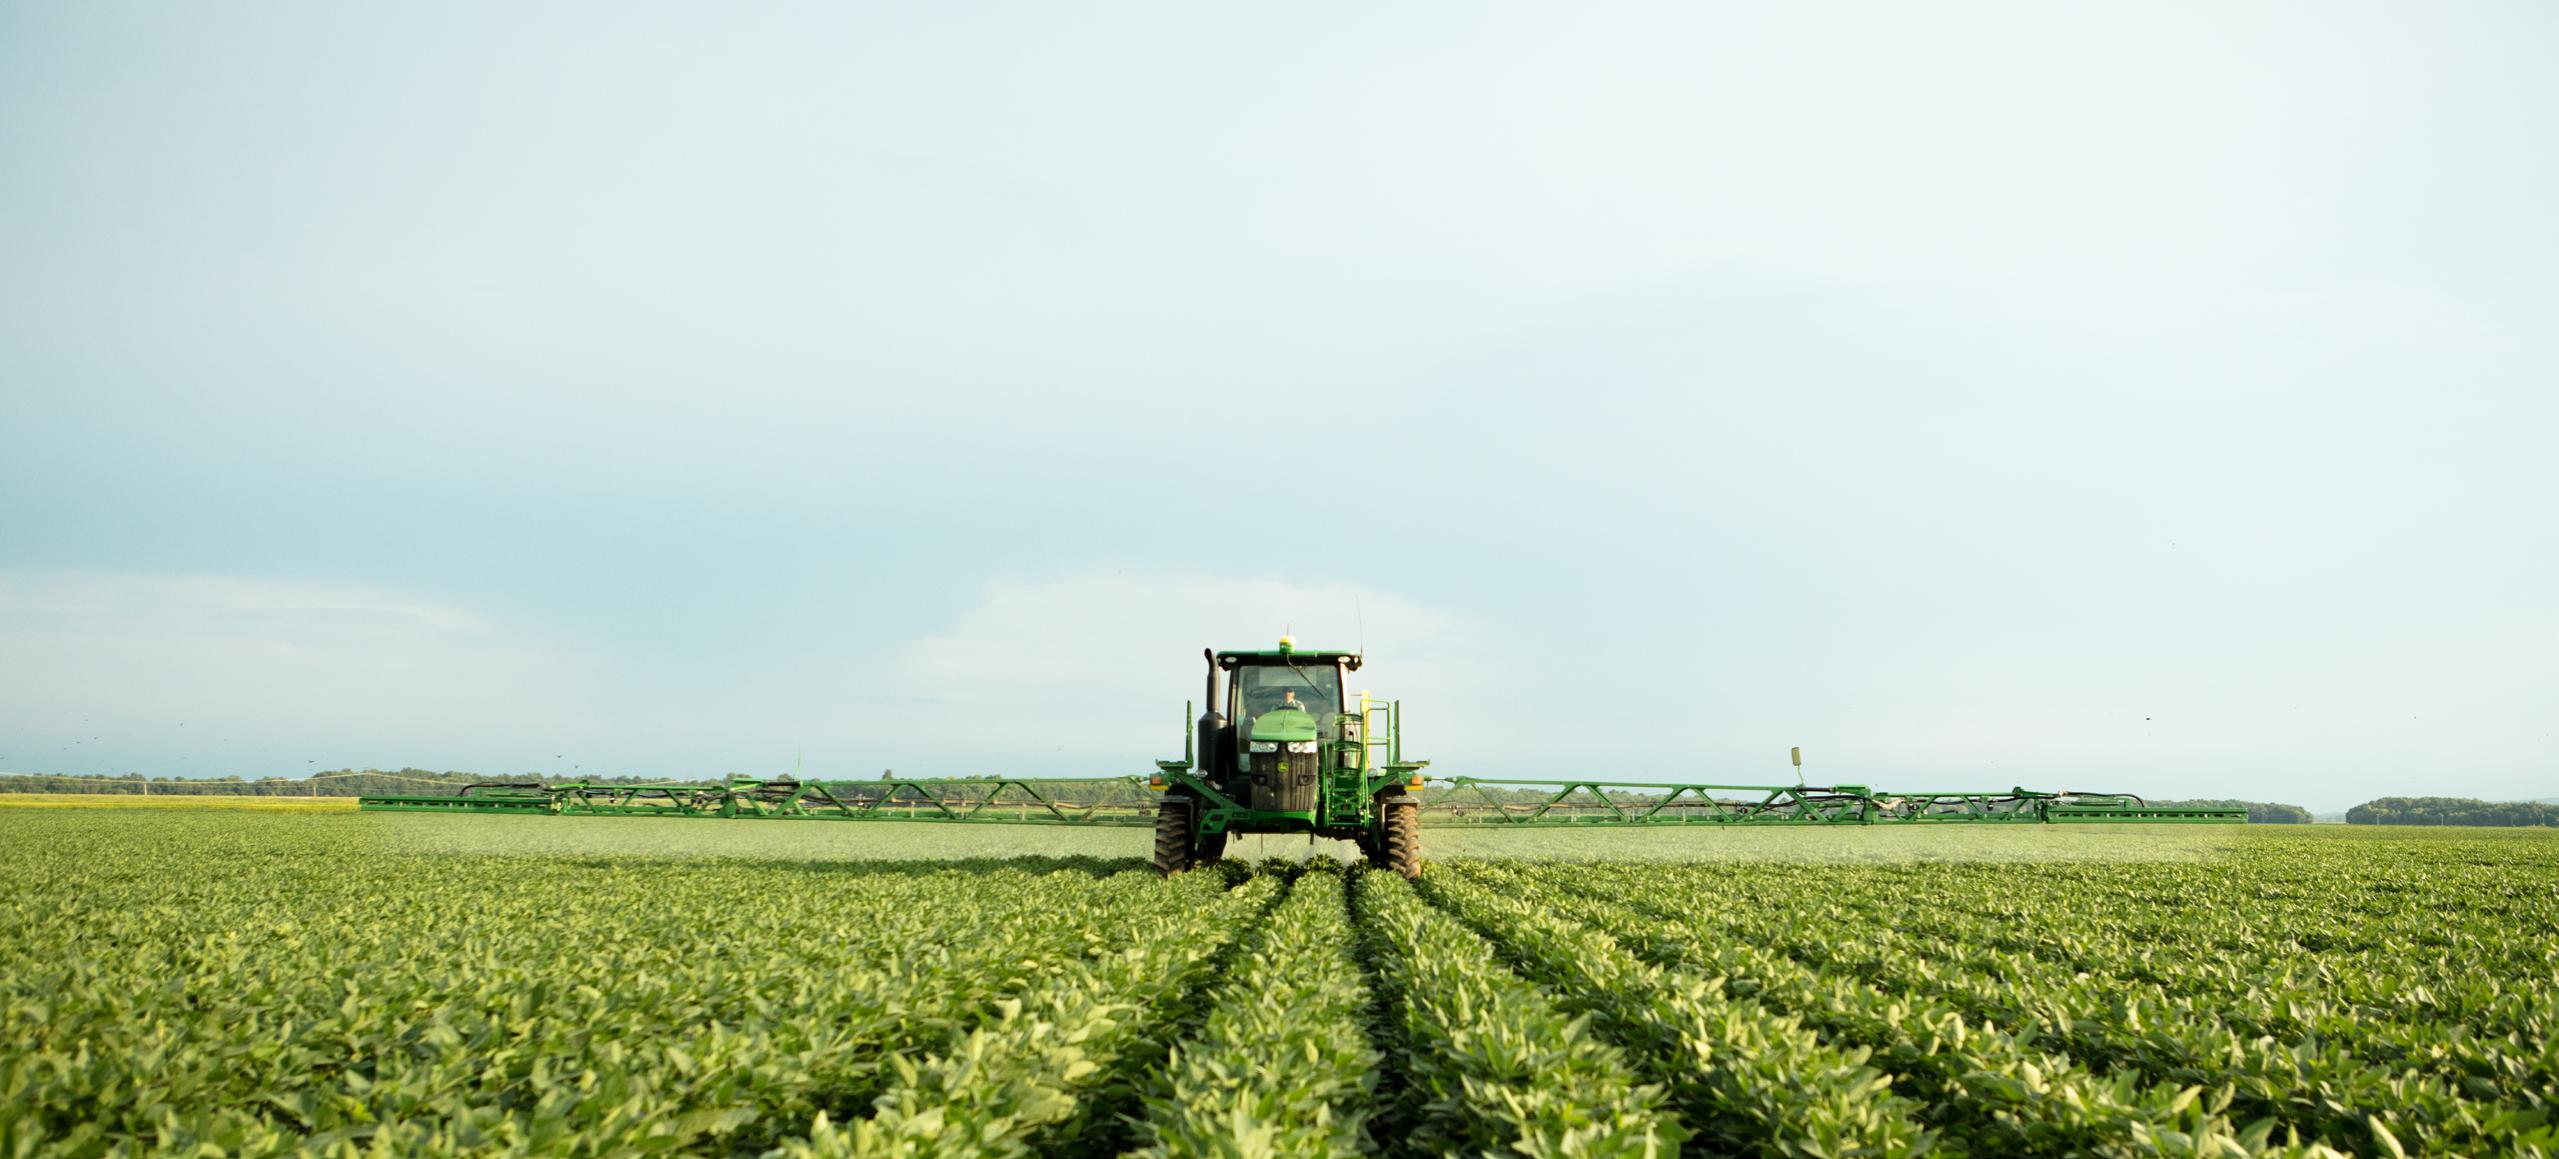
• Contact herbicides (Liberty, PPOs) require a minimum of 15 GPA and good spray coverage, while systemic herbicides can be applied with coarse droplets and at lower spray volumes. However, under dense weed and crop canopies higher spray volumes can also help with coverage and control.
Effective POST programs rely on tank mixes with multiple effective sites of action. Including a Group 15 residual herbicide with POST applications helps manage later emerging pigweeds and grasses, and reduces dependence on rescue sprays. Always follow POST and total seasonal rate limits and be mindful of rotational restrictions.
Successful POST weed control depends on early timing, correct rates, proper adjuvants and effective tank mixes. No herbicide can compensate for weeds sprayed too late. For additional guidance, consult the 2026 MSU Weed Control Guide for Field Crops (E0434) at canr.msu.edu/weeds/.
DR. KURT STEINKE PROFESSOR, SOIL FERTILITY AND NUTRIENT MANAGEMENT, MICHIGAN
UNIVERSITY

lower Michigan receiving 10-20 inches of rainfall from early March through mid-April. Fertilizer price increases ranging from 10-55% occurred late winter through spring creating further stress on an already tight 2026 budget.
While many factors may be out of our control, maintaining a cost-effective soybean nutrient program is one item growers can actively seek to achieve. Now that fields have emerged and plants are developing, there may still be opportunities for growers to manage in-season nutrients or evaluate preand at-plant fertilizer applications.
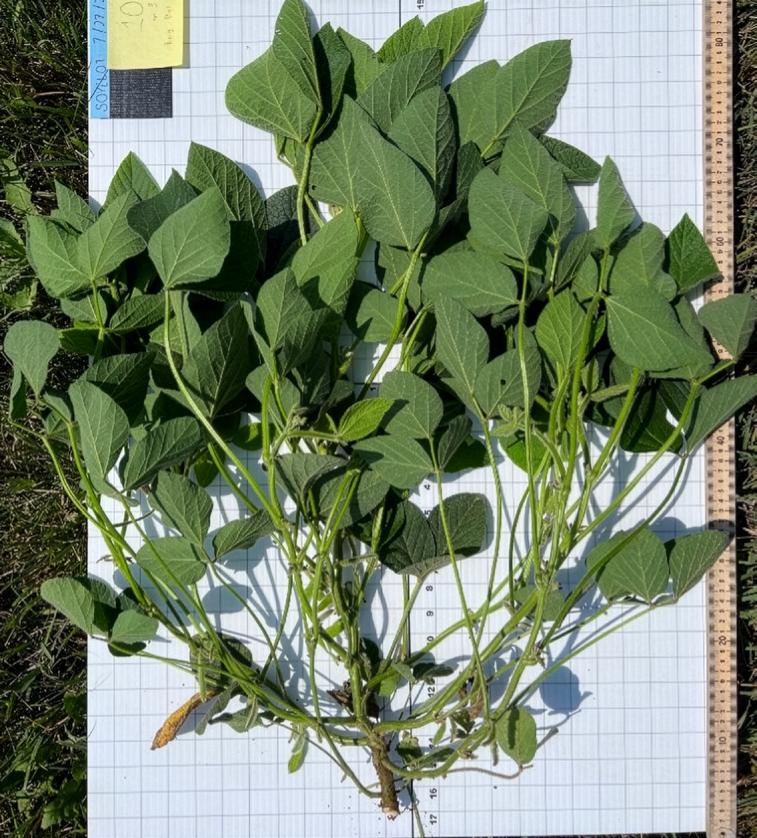
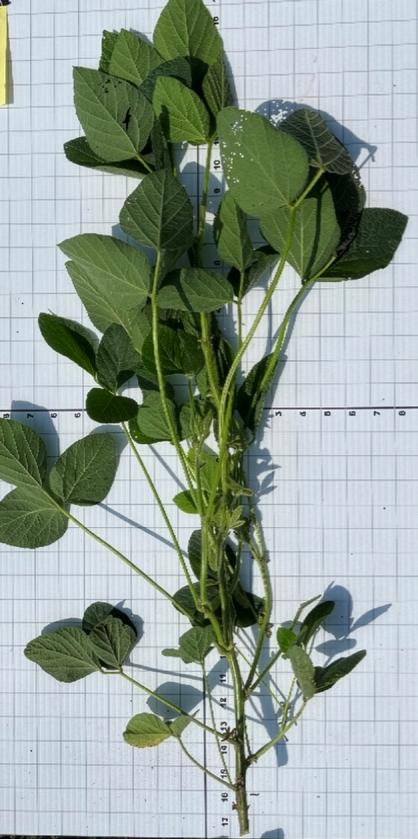
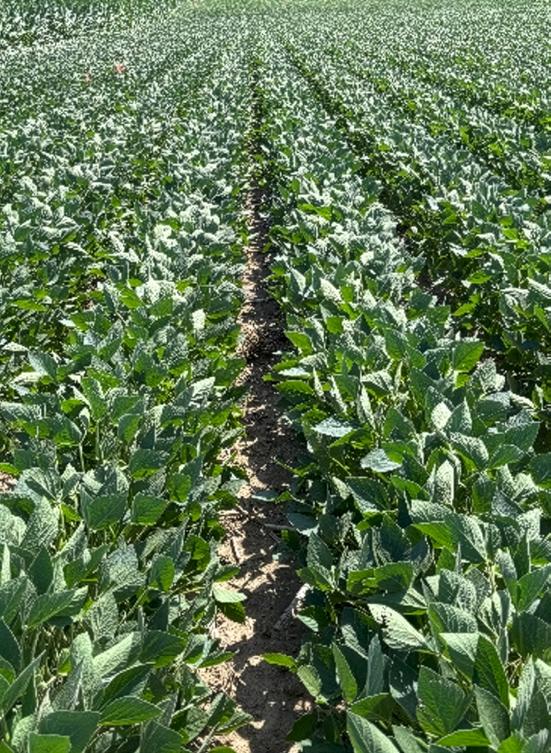
Figure 1. Same soybean variety, population and field with 25 lb. N and 15 lb. S applied as a 2x2 starter application (left) compared to no fertilizer application (right). Despite substantial early-season growth and dry matter accumulation differences, no significant yield differences occurred at this location.
First, try to understand whether a deficiency in the field is from an actual low soil test nutrient value or due to soil moisture conditions. Soil test values and critical thresholds are a law of averages, indicating there are values both above and below the numbers shown on the soil test report. Also, remember that the soil water status may influence whether an area of the field visibly shows a deficiency. When soil moisture is plentiful, water is available to move nutrients
through the soil to the root and deficiencies may not appear, even when below critical values. When soil moisture is lacking, nutrients have a more challenging pathway through soil pores and deficiencies may appear even when soil test values are above critical thresholds. Understanding how and where water moves through a field or soil may give you a better gauge not only for interpreting yield maps, but also how to manage areas within the field differently.
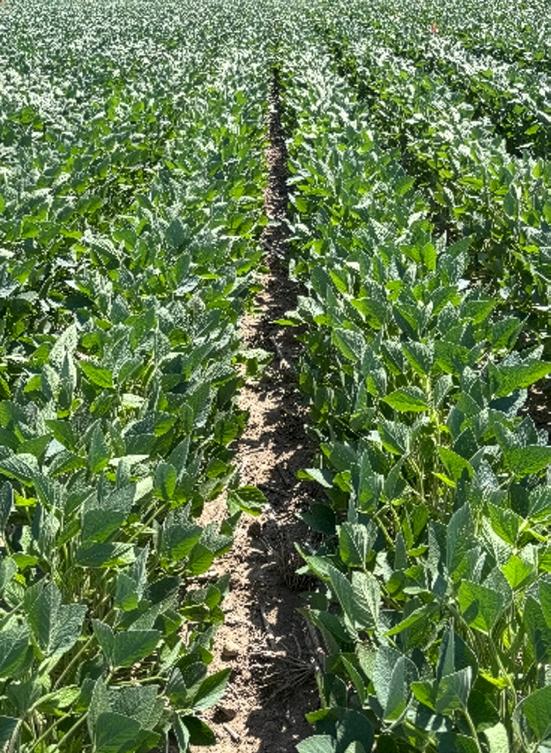
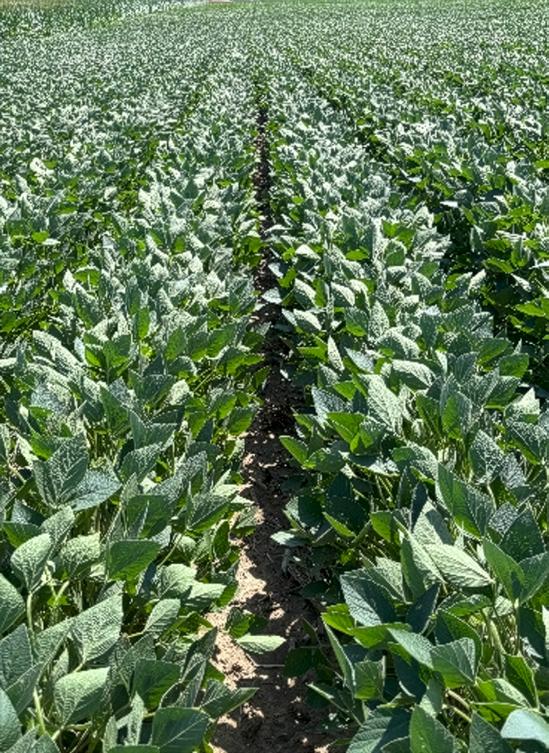
Figure 2. At below critical soil test K concentrations, subtle plant dry matter responses and changes in rate of row closure occurred between no K2O application (left), 70 lb. K2O applied 2x2 (center), and 280 lb. K₂O applied pre-plant incorporated (right) but no differences in grain yield occurred. Note the reduced row closure and slight yellow plant appearance at the 280 lb. K₂O application rate.
Pre-plant or at-plant fertilizer applications including starter fertilizer may be one of the first evaluations to occur inseason. The magnitude of residual soil-test values, weather conditions and specific nutrient(s) applied may impact whether a visual observation or biomass response occurs in the field. When evaluating early season soybean nutrient applications, be

careful not to confuse a biomass response with a grain yield response (Figure 1). Simply slowing down to 30 mph in your vehicle and observing larger, greener plants with additional biomass where nutrients were applied is not necessarily indicative that a yield response may occur. To assist with positive or negative nutrient responses in the field, consider taking in-season soil and tissue samples from affected and not affected areas, perhaps utilize sensor technologies for detecting tissue abnormalities, and most importantly be sure to confirm an early season visual response by closely examining the yield monitor at season’s end.
Added nutrients may provide a more subtle plant response including modest increases in plant biomass or changes in rate of row closure (Figure 2). Potassium receives much early-season attention in soybeans and for good reasons. Soybeans not only remove more potassium per bushel than corn, but K uptake occurs much earlier in the season than other nutrients with about 25% and 75% of K uptake complete by the R1 and R4 (seed-fill) growth stages, respectively. Due to both the large quantity and early timeframe for K uptake, correcting K deficiencies in-season can especially be a struggle in more northerly, shorter growing seasons including Michigan. All these factors lead to a greater emphasis on pre-plant soil test K values for maintaining sufficient tissue K later in the season. While greater biomass does not always translate to increased yield, much of the K uptake after seed-fill occurs via remobilization from other plant tissues, indicating greater quantities of biomass may still provide additional opportunities for greater late-season K uptake.
Manganese (Mn) remains the most common soybean
differences.
The 2024 growing season told a different story with the best visual soybean sulfur deficiencies observed in many years
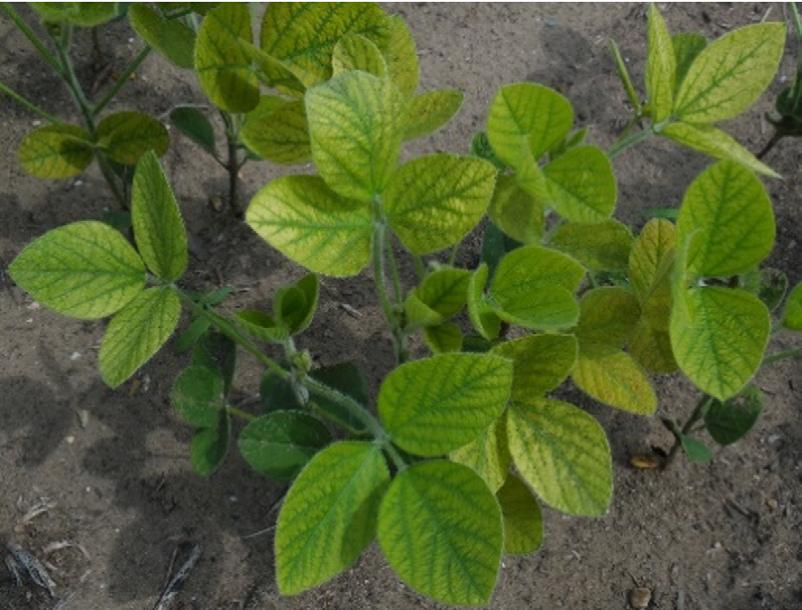
Figure 3. Soybean plant displaying manganese deficiency on coarse-textured, low organic matter soil. Visible deficiency symptoms include yellowing between veins with veins remaining dark green, located towards the top of the plant.
and yield increases of 8-10 bushels per acre with 15 lb. S per acre applied as a 2x2 starter fertilizer (Figure 4). Again, weather variability in the form of 6-8+ inches of rainfall occurred in both July and August 2024 assisting with the positive sulfur response.
Soils containing less than 2% organic matter, little if any history of previous S applications (i.e., low residual soil S), and excessive early spring to mid-summer precipitation are the fields that tend to display S deficiencies first.
Moving forward in 2026, be on the lookout for potential S deficiencies. Soybean S deficiency will often appear as a chlorotic, slightly yellow appearance on the upper leaves of the plant with plants also displaying a stunted, spindly,
DR. ERIC ANDERSON
STATEWIDE SOYBEAN EDUCATOR, MICHIGAN STATE UNIVERSITY EXTENSION
What leads to the development of white mold?
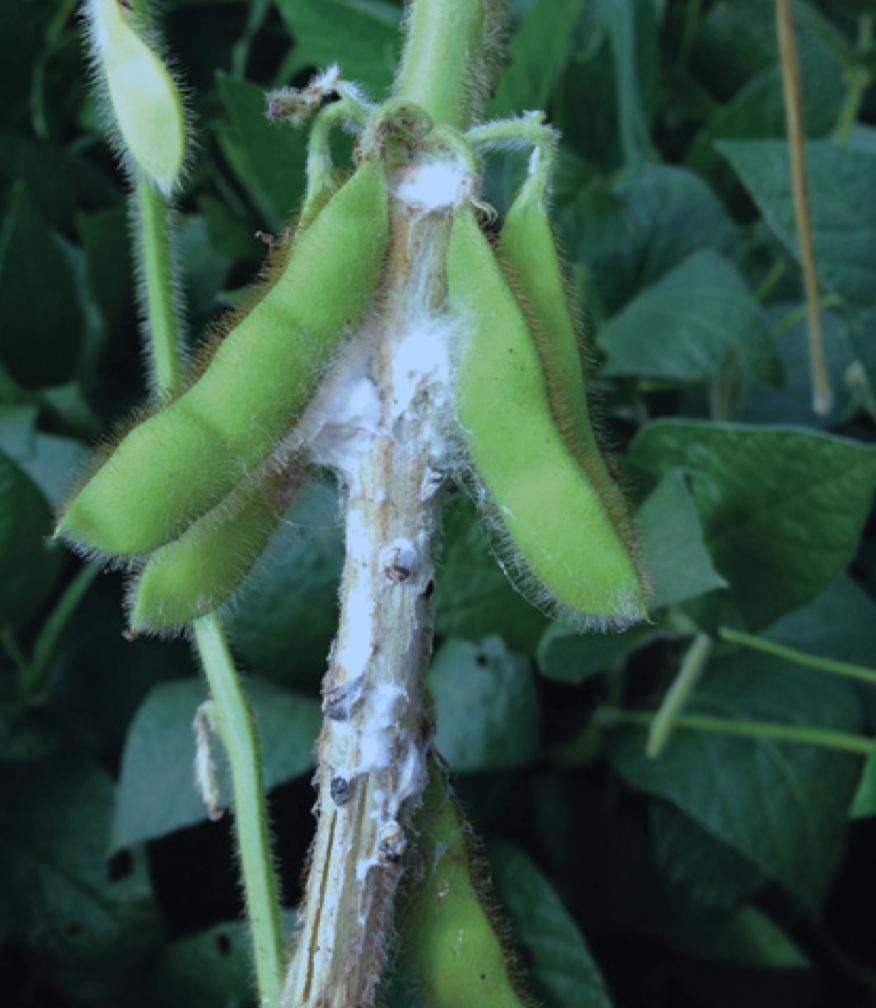
Disease outbreaks of white mold (also known as Sclerotinia stem rot caused by the fungus Sclerotinia sclerotiorum) occur when three key factors align: the presence of a susceptible variety, field history of disease, and favorable environmental conditions, particularly cool (<85 °F), moist weather during flowering. Sclerotia resting bodies in the soil germinate to produce apothecia which release spores that infect through flower petals.
Which fields should I target for management?
Field history is one of the most important considerations. Target fields that have a history of white mold. The sclerotia resting structures can survive for up to 10 years in soil. Although tillage can initially bury sclerotia, subsequent tillage will bring sclerotia close enough to the soil surface where they can germinate. Studies have demonstrated that long term no-till fields tend to be at lower risk to white mold. Additionally, variety susceptibility is an important component. Although no varieties are immune to white mold, variety selection can make a huge difference.
When should fungicides be applied?
The best fungicide timing is from beginning of flowering (R1) through to the beginning of pod development (R3). Once we hit the “full pod” (R4) growth stage, fungicides will
not be as effective in suppressing disease. To differentiate the R3 from the R4 growth stage, start at the top of the plant and identify the first fully open leaf. Count down 4 nodes and look at the size of the developing pod at the fourth node. If that pod is at or greater than 3/16” it’s at the R3 growth stage, but once the pod is more than ¾” it’s at the R4 growth stage and fungicides will be far less effective.
The fungicide efficacy tool hosted on the Crop Protection Network website lists fungicides and their efficacy for white mold. Fungicide products ranked as “good” for white mold suppression include Endura, Aproach (in a 2-pass system), Omega and Propulse. We also have good success with the herbicide Cobra, which often performs as well as the best fungicides under high white mold disease pressure. However, farmers should note there is the potential for burn and some yield loss under conditions that don’t favor disease.
Nine different fungicide programs across 70 locations have been tested in the Michigan Soybean On-Farm Research trial program from 2012–2025. Results showed no significant differences between fungicides and the nontreated control in half of those trials, mostly due to a lack of white mold pressure, which emphasizes the importance of conducting trials across multiple locations and years.
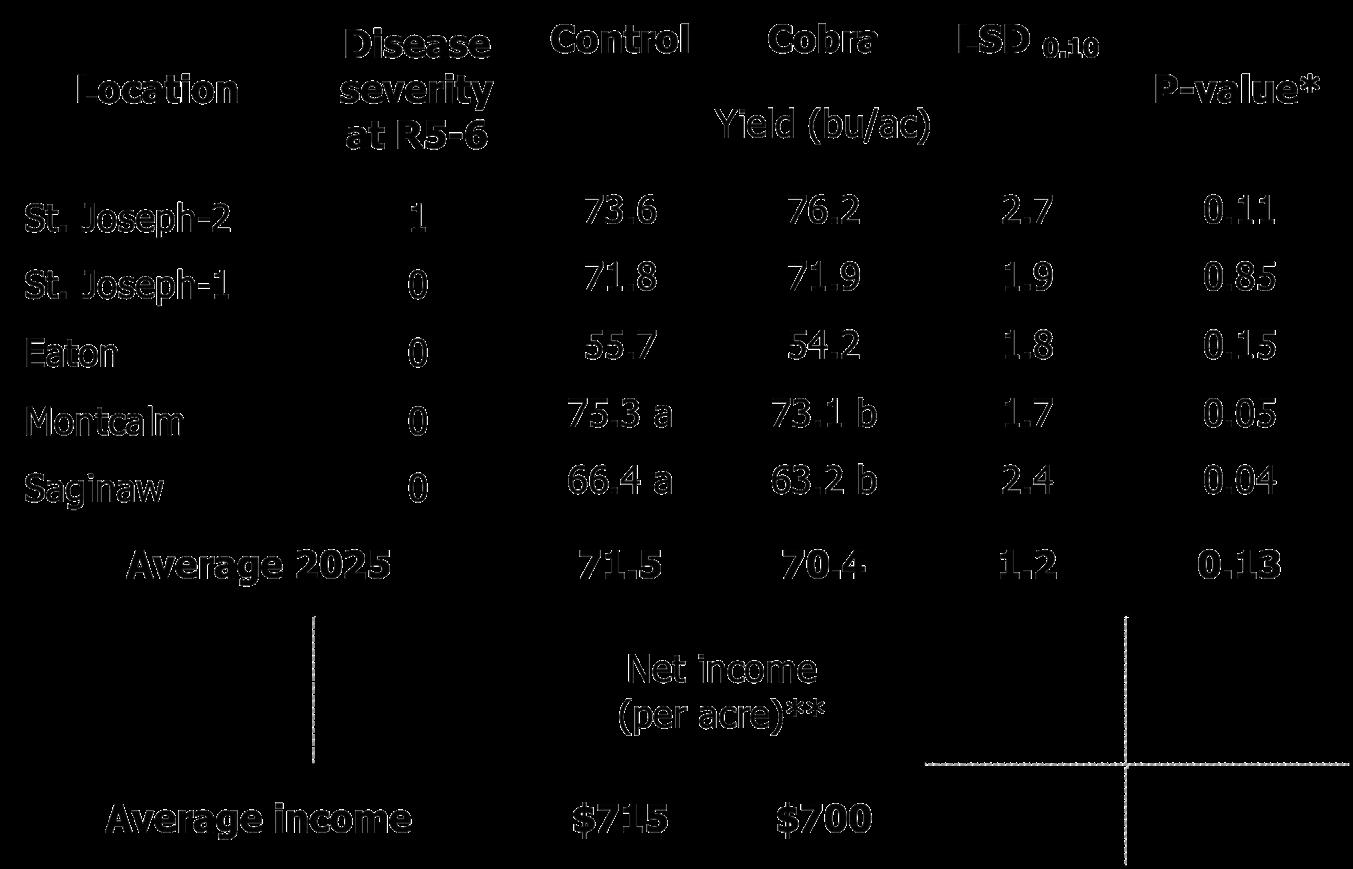
* P-value is the probability the results occurred by random chance if there was no real treatment effect
** Cobra cost = $4.22 per acre; application cost was not included because it was tankmixed with a planned postemergence herbicide application
Most recently, in 2025, Cobra was tested for white mold suppression at five locations where white mold incidence was low at one site and nonexistent at the others. The Cobra treatment reduced yield at two locations, did not impact yield at two locations, and increased yield (P=0.11) at the site with low disease pressure.
If you do decide to make a fungicide application, be sure to leave check strips and pencil out the costs and benefits, otherwise you will never know your ROI. It’s always important to pay attention to what is working for you and what is not. The Crop Protection Network has assembled multistate fungicide trial data into a fungicide ROI calculator. The calculator will help examine the potential economic benefits by examining input costs, market price and production outcomes. These ROI calculators are intended to support the decision-making

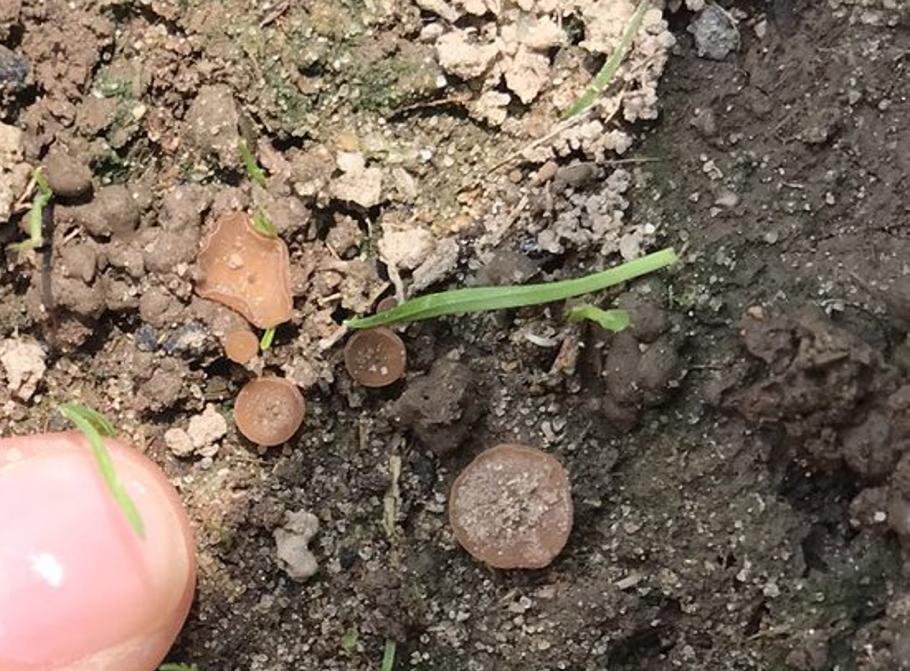
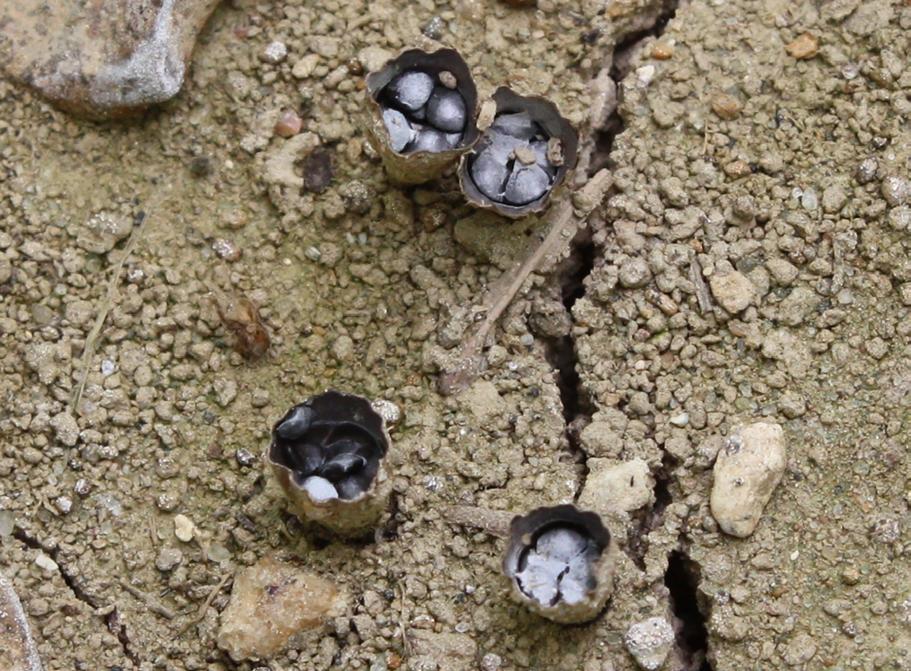
Figure1: Top: Sclerotinia (white mold fungus) apothecia and sclerotia on soil surface (Jill Check). Right: Very common and harmless “birds nest” fungus, which is often confused with the white mold fungus.
process. It’s important to note that these are not predictive, but they provide a framework for exploring trial data: cropprotectionnetwork.org/roi-calculators
Are there other considerations?
Foliar fungicides can be an effective tool for managing white mold. However, they are only one of the tactics available and should be used in combination with other white mold management practices such as partially resistant varieties, wide rows, reduced planting rates, irrigation water management and appropriate tillage methods. Be sure to make note of which fields develop white mold for future planning, and if you are investing in a fungicide be sure to leave check strips to pencil out the economics.
Each year we screen varieties and test new fungicide products, biologicals and amendments. The most promising of these are brought to on-farm research trials in collaboration with the Michigan Soybean Committee in the Michigan Soybean On-Farm Research program. If you are interested in a particular product, please reach out.
• Field history is a good predictor of future problems.
• Variety resistance is an important component of management. Understand your varieties and their potential risk.
• Fungicides need to be applied during flowering (R1 to R3), prior to white mold symptoms. Once we get to the R4 (full pod) growth stage fungicides have little value in white mold management.
• Not all fungicides are created equal for white mold management. This list is updated annually: cropprotectionnetwork.org/publications/ fungicide-efficacy-for-control-ofsoybean-foliar-diseases
• Leave a check strip to understand your ROI. ROI calculators have been developed to aid in fungicide decision making: cropprotectionnetwork.org/roicalculators