Q1 2026 Market Report







Q1 2026 delivered 98 closed transactions, a 66% surge from Q4 2025's 59 closings and the highest quarterly volume since Q2 2024. However, this velocity came at a cost: average closed price fell to $1.265M, down 6.4% from Q4 and 20.9% from the Q1 2025 peak of $1.598M. A dramatic increase in listing inventory led to a softening in average pricing and an increase in listing discount, confirming that buyers are extracting real concessions.
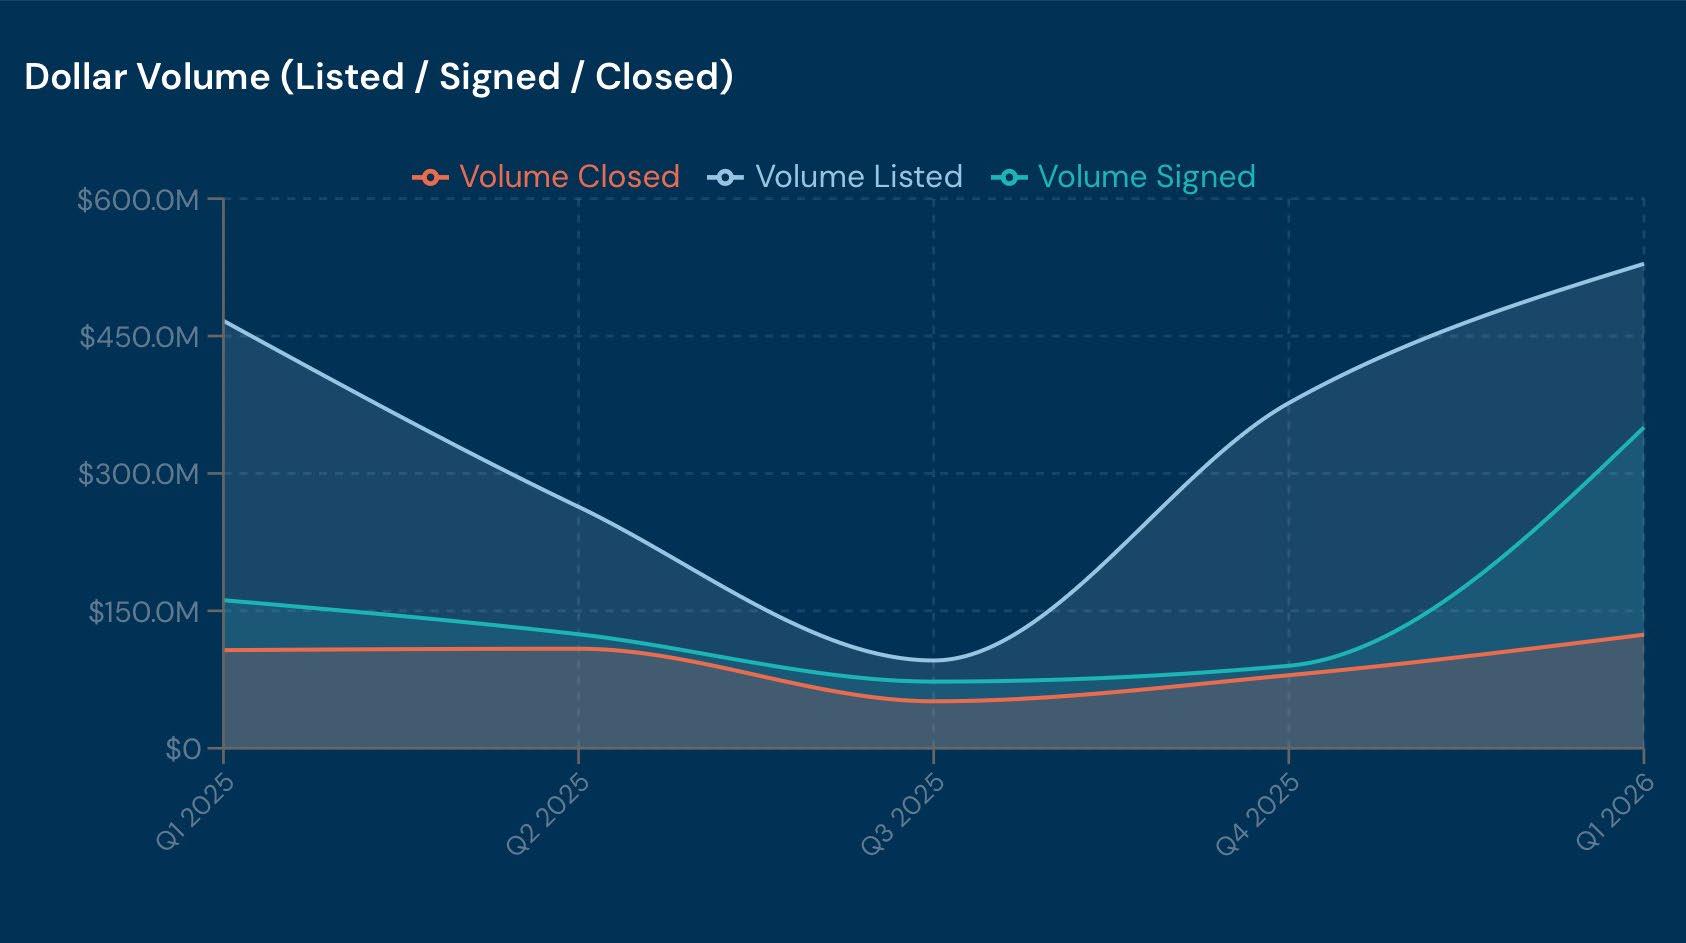
• Pending volume exploded to $350.3M, a 289% increase from Q4 2025's $90.1M, signaling a significant wave of demand re-entering the market at reset price levels.
• Active inventory climbed to 354 listings ($757.7M total active volume) with months of supply at 16.1, still deep in buyer's market territory despite improving from Q4's 17.3 months
• Average listing discount widened to 6.2%, and new listing prices averaged $2.2M, creating a $938K gap between ask and close that developers must underwrite honestly.
• Average days on market improved to 108 from Q4's 122 but remains well above the sub-60-day pace seen in Q1 2025 aligned with historical norms indicating the market is continuing to normalize.

Simon P. Bacon Executive Director

Outlook: The $350M pending pipeline should convert into a materially stronger Q2 2026 in closed volume, but with clearance rate still at 23% and 354 active listings absorbing slowly, pricing discipline and realistic assumptions are essential for any new project penciling in 34236.




$1.1M
Q1 2026 closed 98 transactions at an average price of $1,264,740 a 15.9% decline from Q1 2025's $1,598,464 and the lowest average since Q3 2024. Buyer activity is accelerating with $350.3M in pending volume, up 117% QOQ, signaling aggressive capital deployment into a market repricing in real time. Active inventory stands at 354 listings totaling $757.7M with 16.1 months of supply.



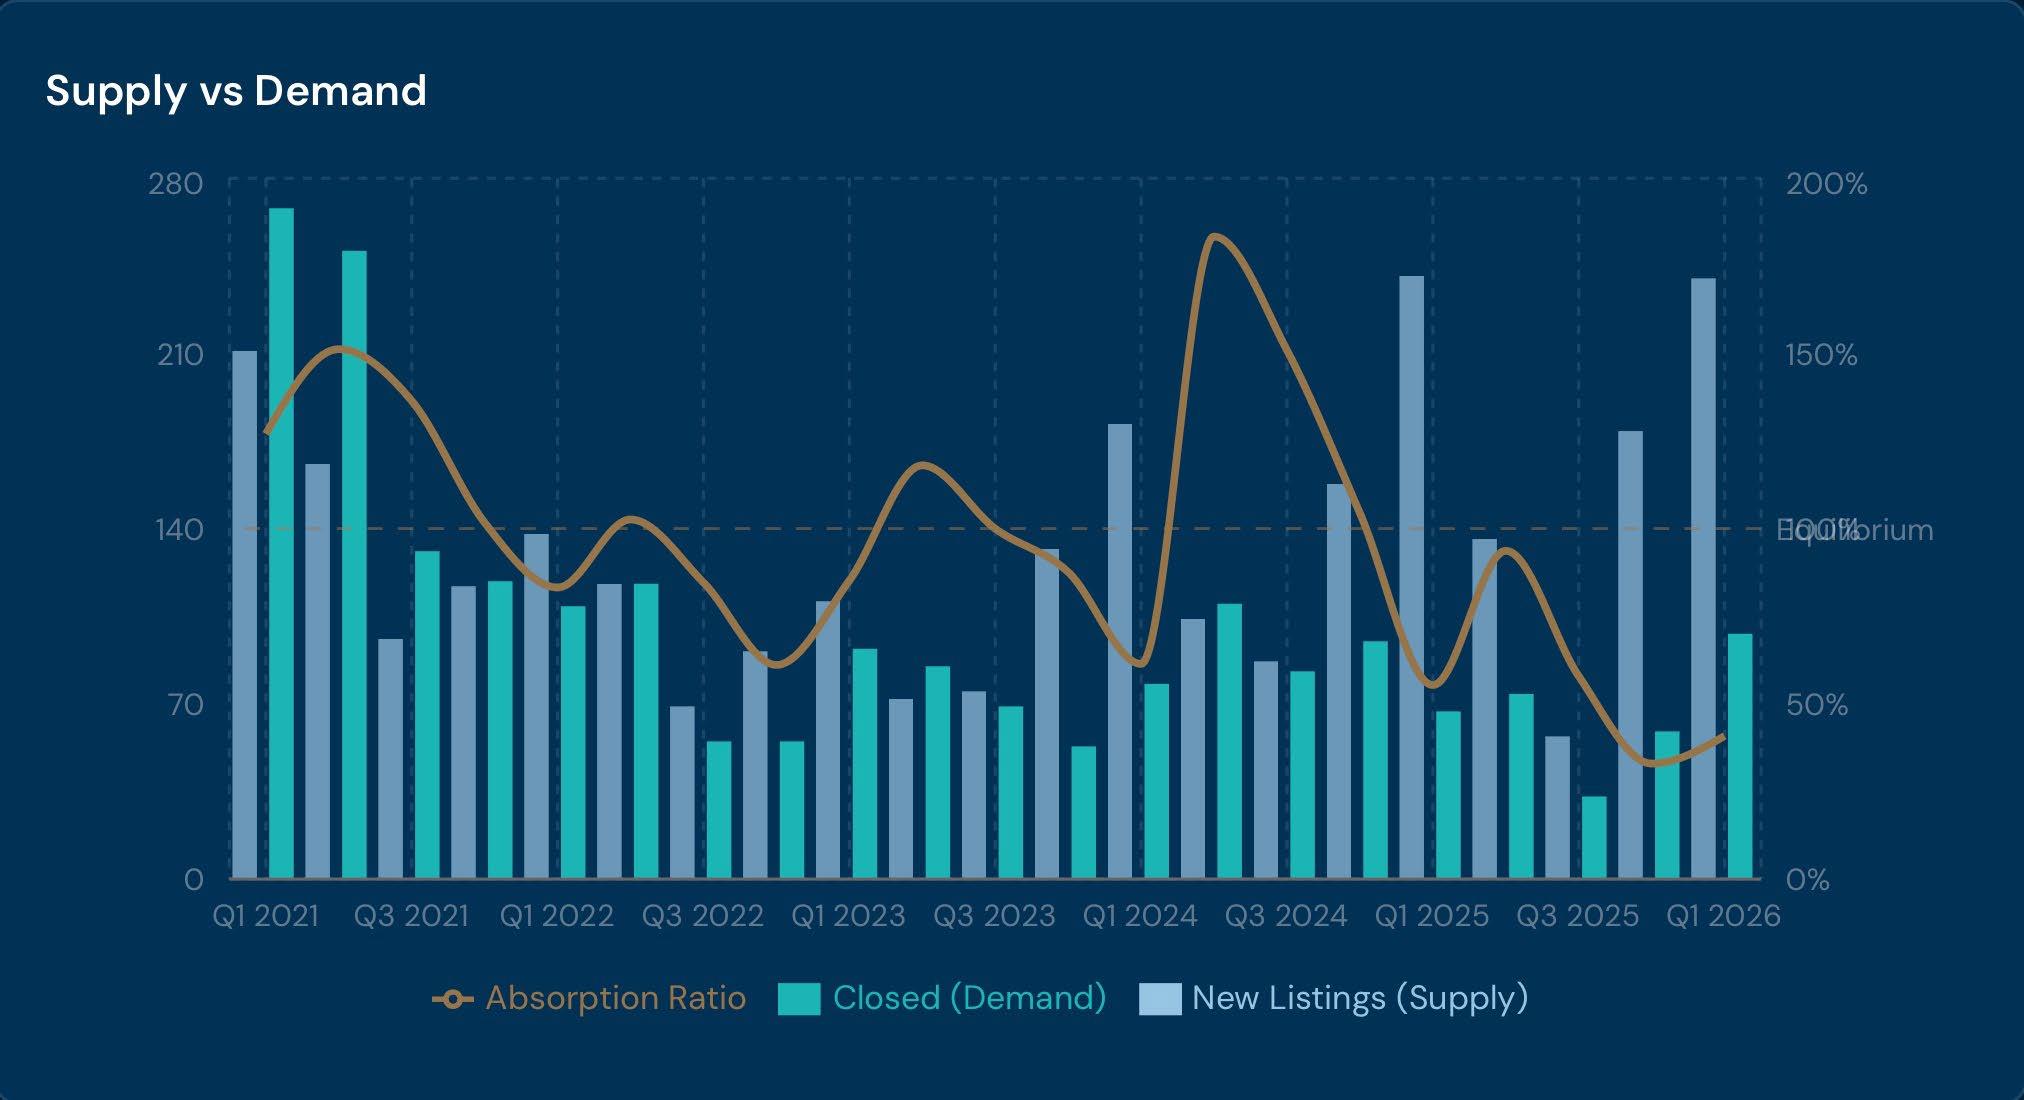
Absorption ratio remains depressed at ~0.23 in Q1 2026, well below 100% equilibrium confirming persistent oversupply conditions across the full 5-year dataset.
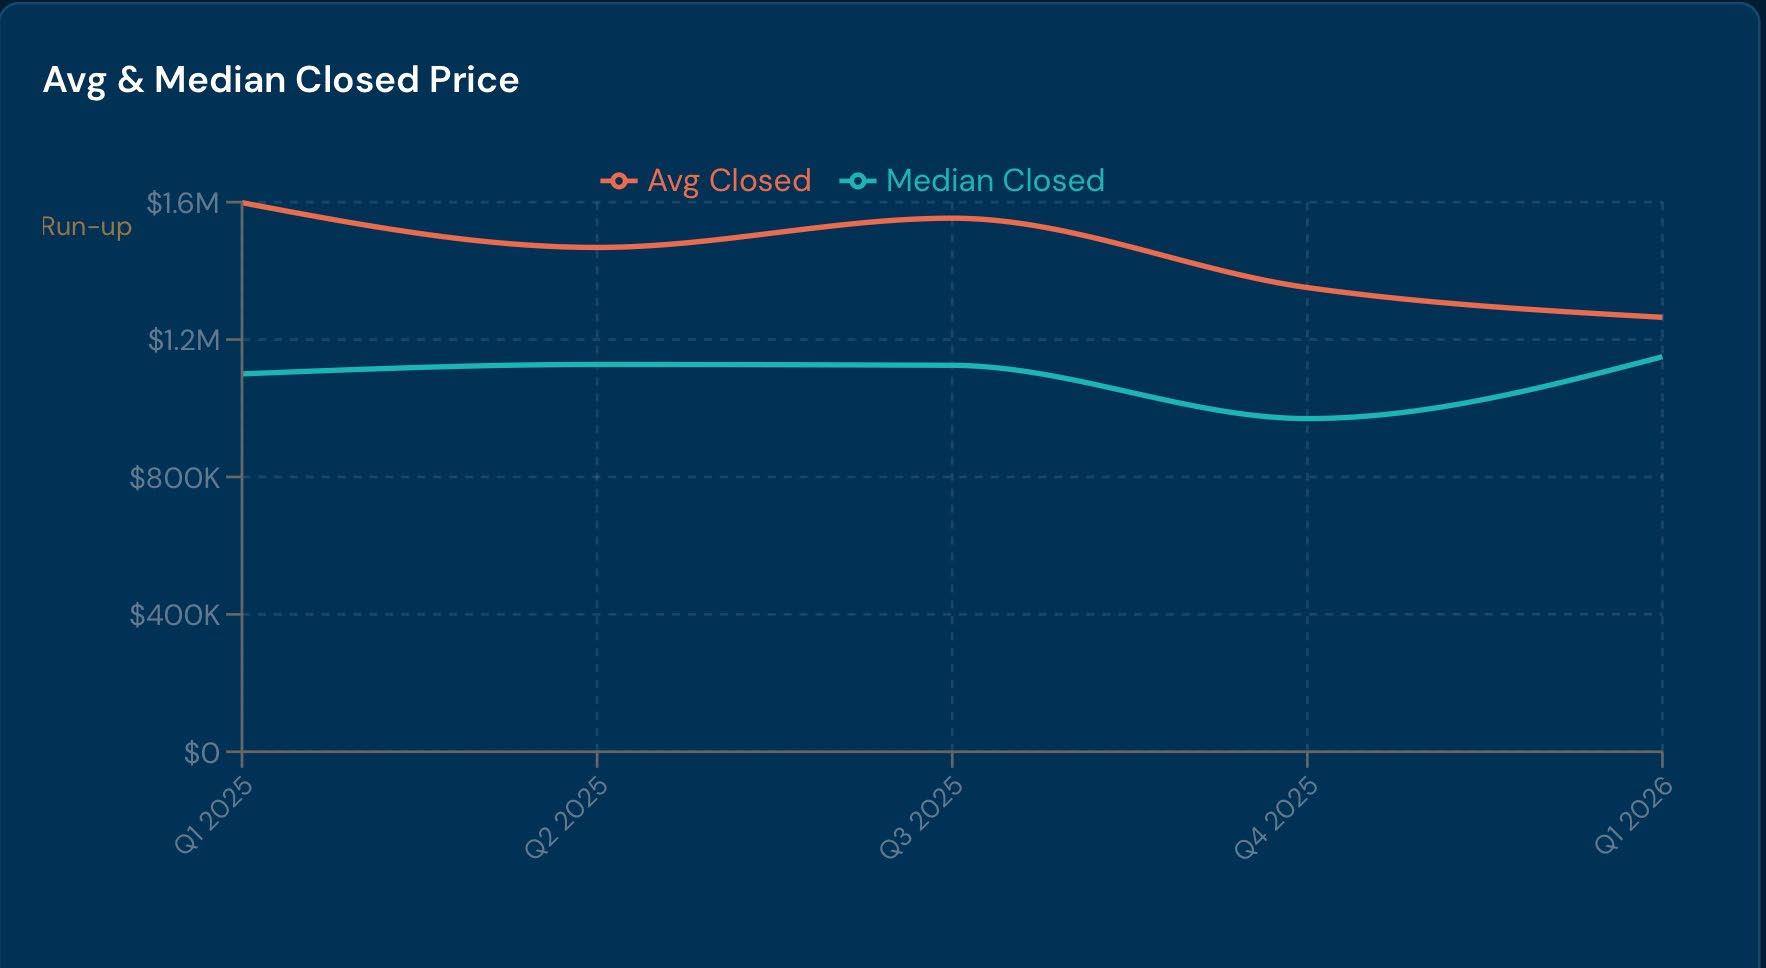
Avg closed price declined from $1.6M in Q1 2025 to $1.3M in Q1 2026 — a 20.9% YOY compression as larger, higher-priced units clear out of inventory.
Median price showed resilience, rising 4.5% YOY. The divergence between avg and median signals the mix is shifting toward mid-market transactions.
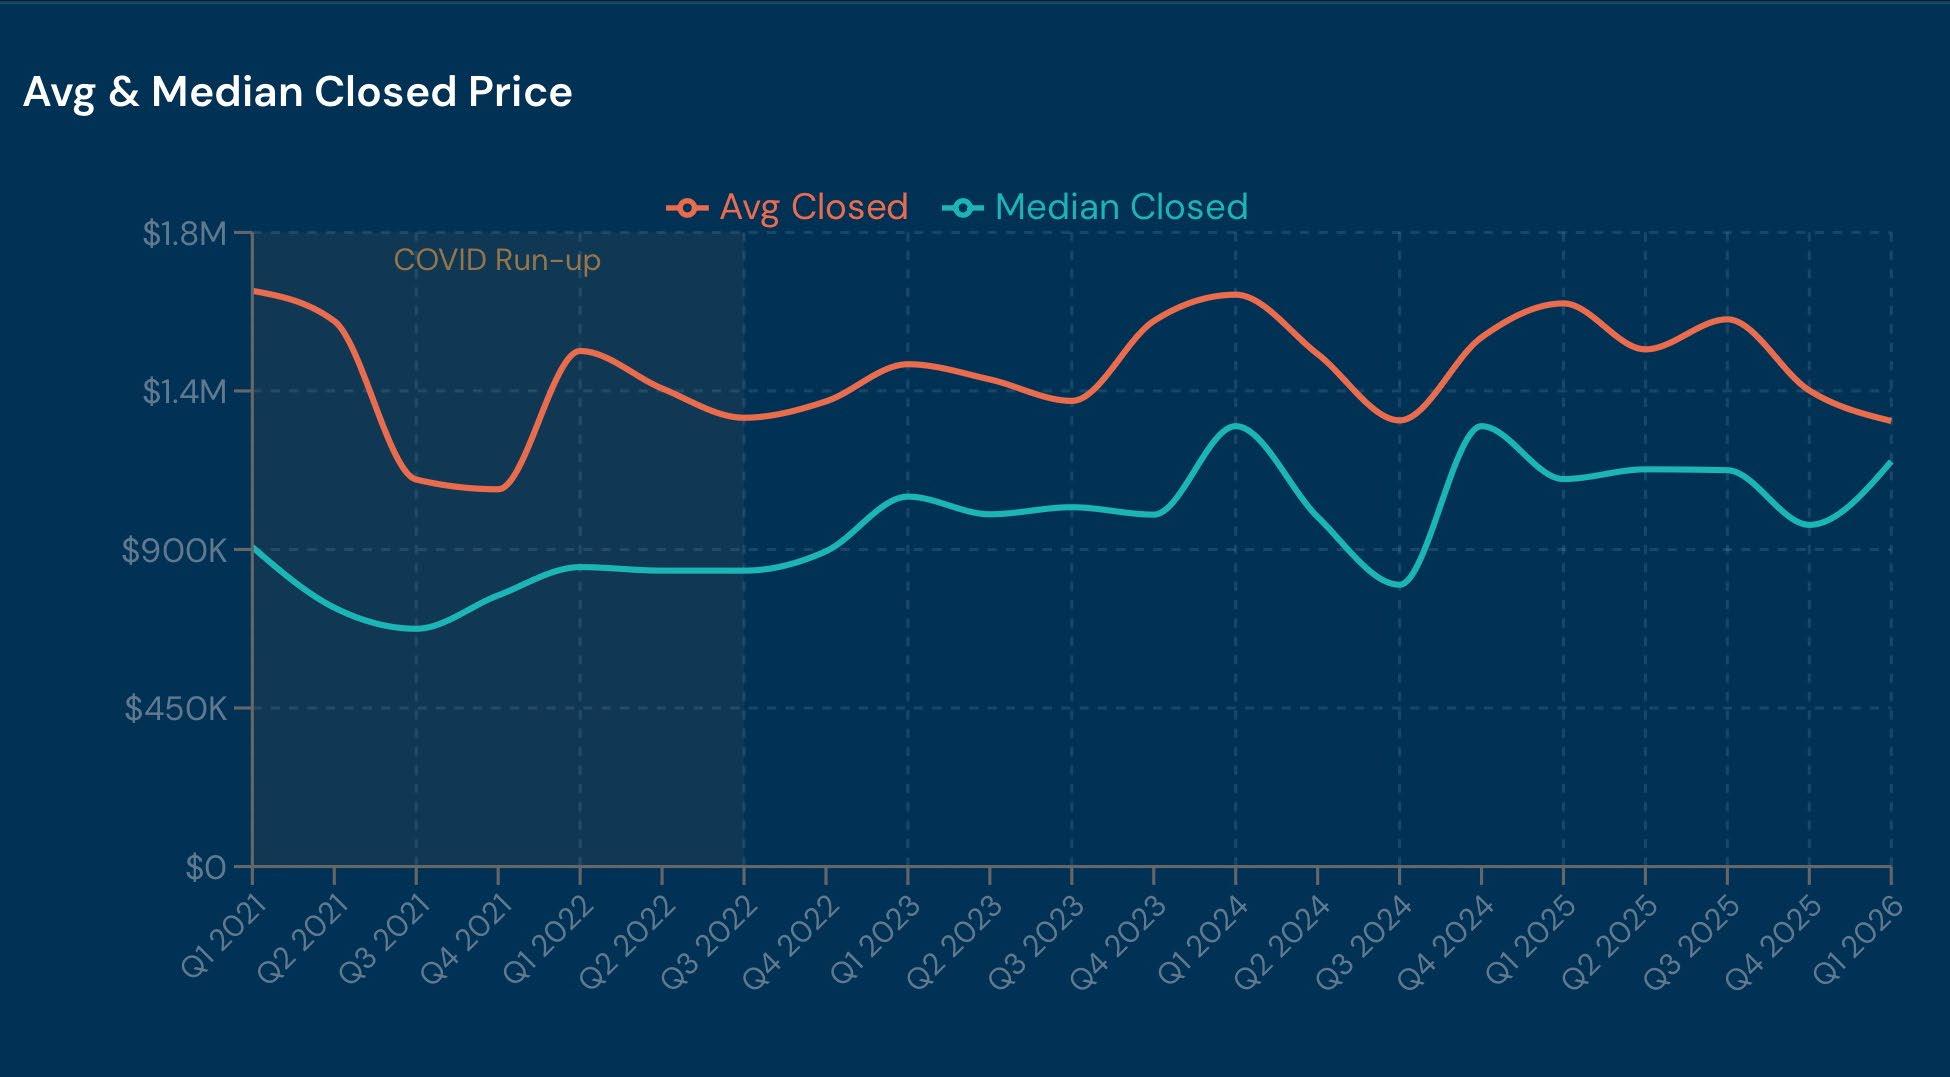
Avg closed price peaked during the COVID run-up and has been compressing since mid-2022. Current levels represent a return to pre-2022 norms median prices show greater stability than averages.

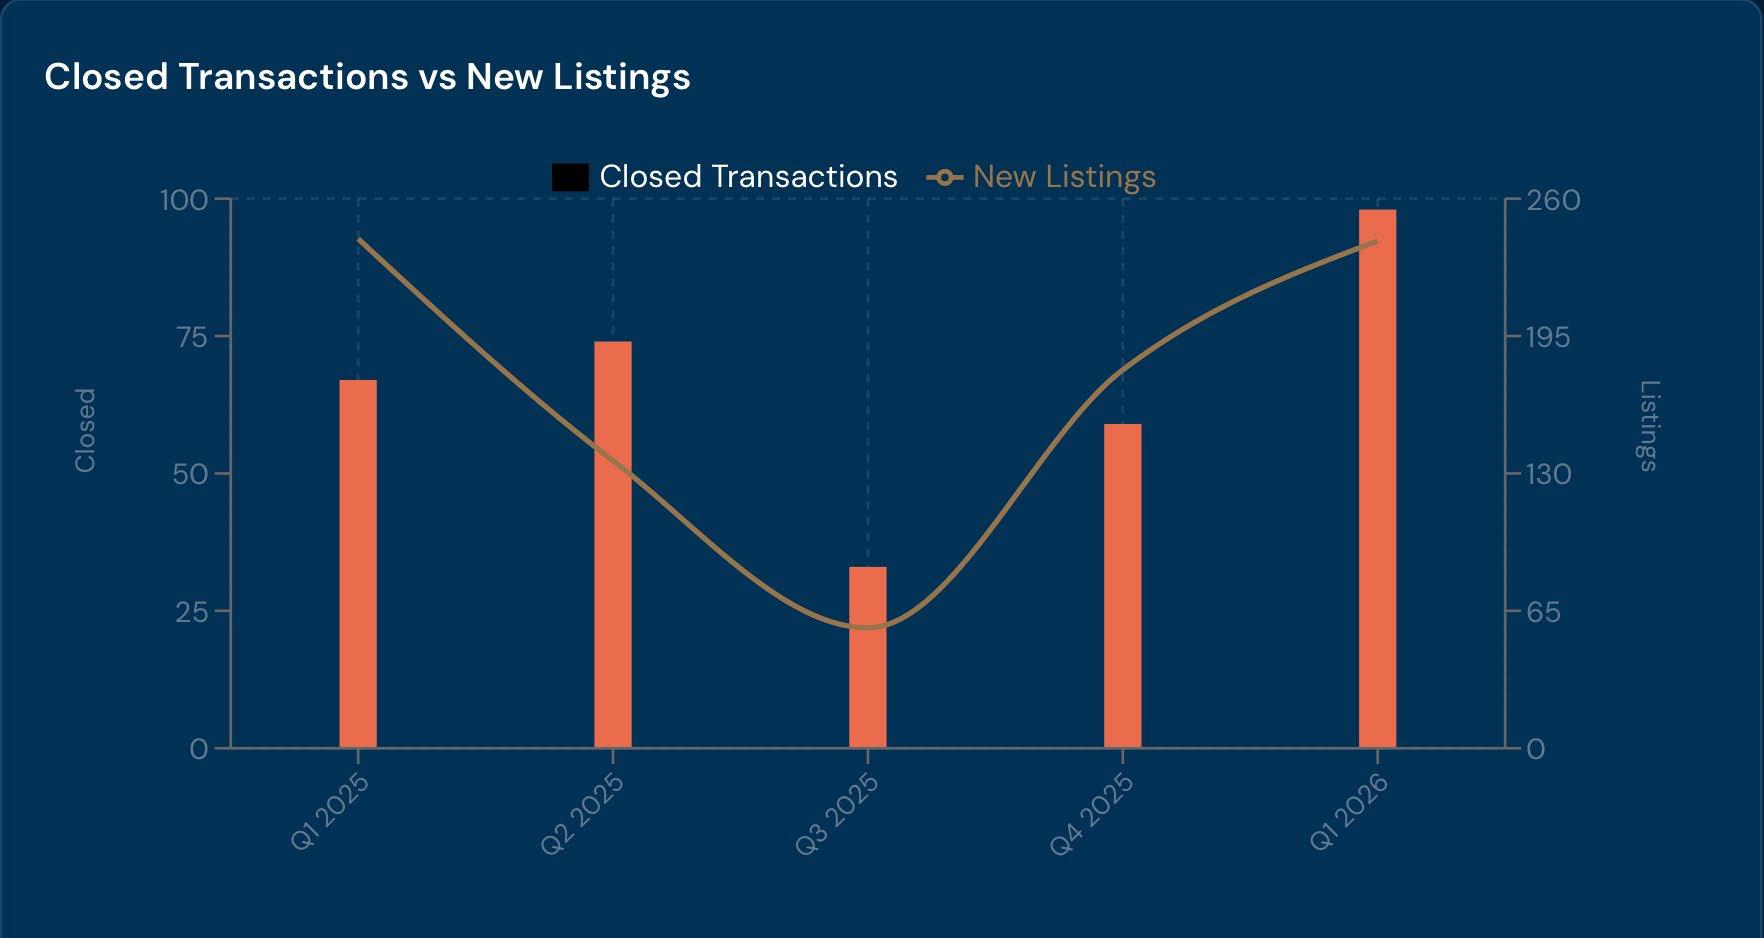
Q1 2026 Highlights
98
CLOSED TRANSACTIONS
▲ 66.1% vs Q4 2025 (59)
▲ 46.3% vs Q1 2025 (67)
Highest since Q2 2024 (110)
240 NEW LISTINGS
▼ 0.4% vs Q1 2025 (241)
▲ 34.1% vs Q4 2025 (179)

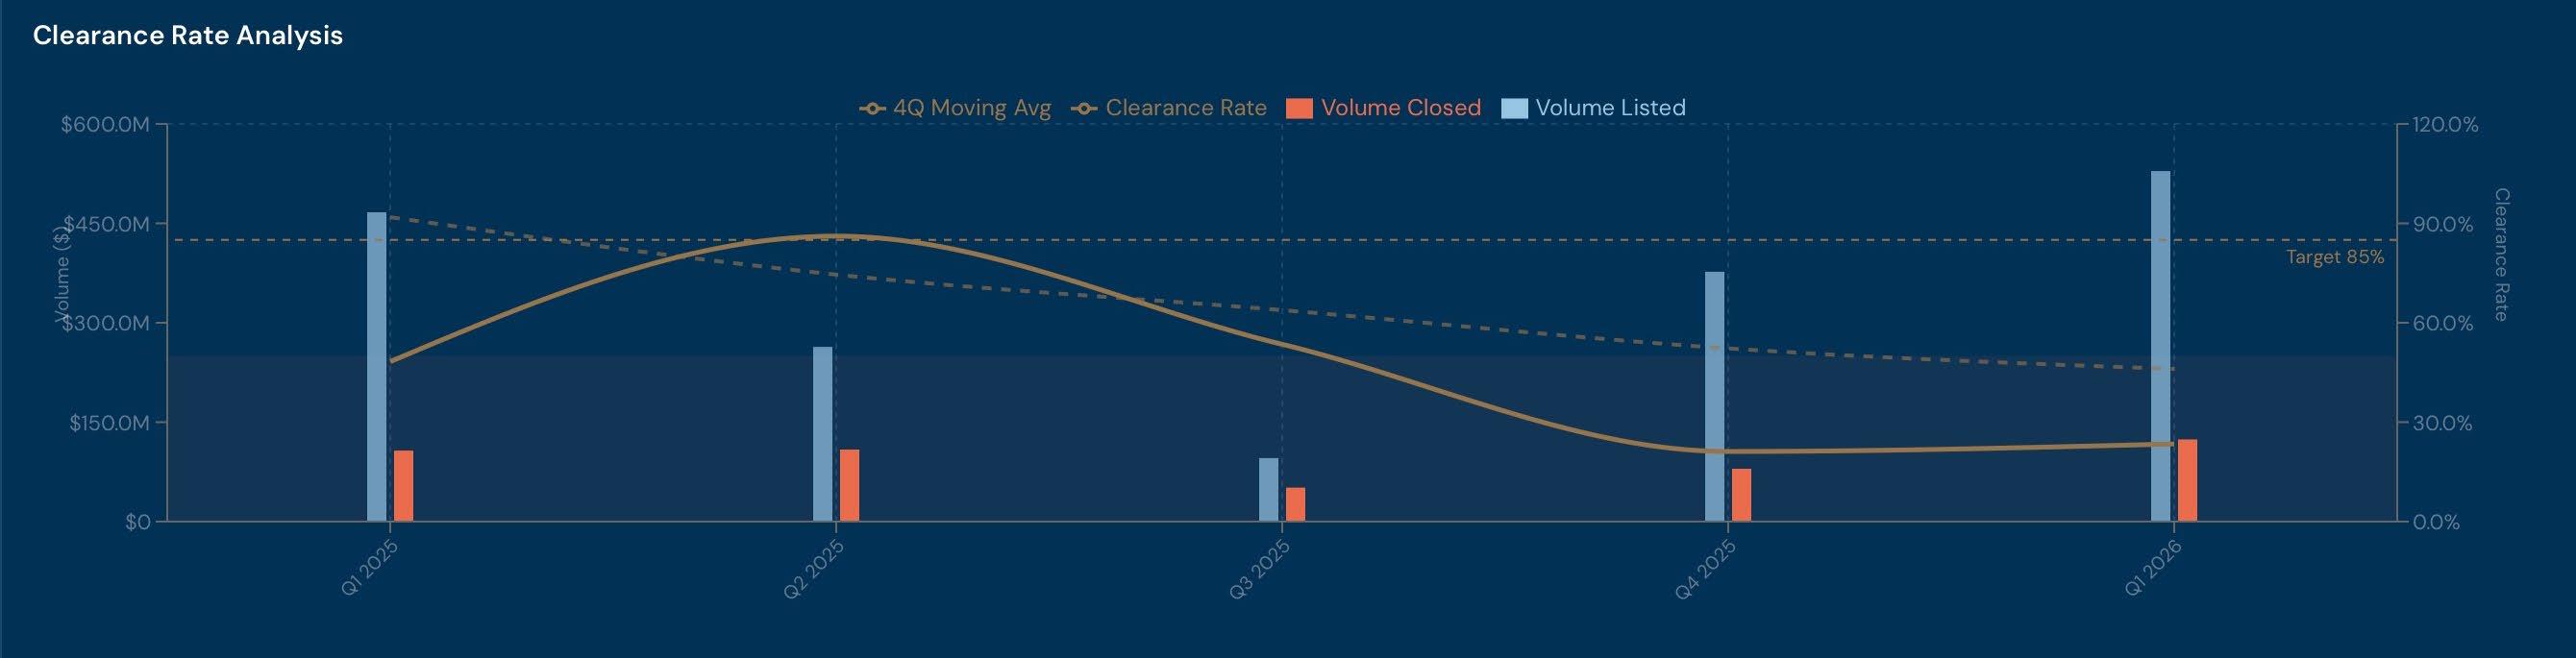
Clearance rate remains well below the 85% target listed volume is not converting to closings at a healthy pace, a structural sign of buyer caution and pricing misalignment.
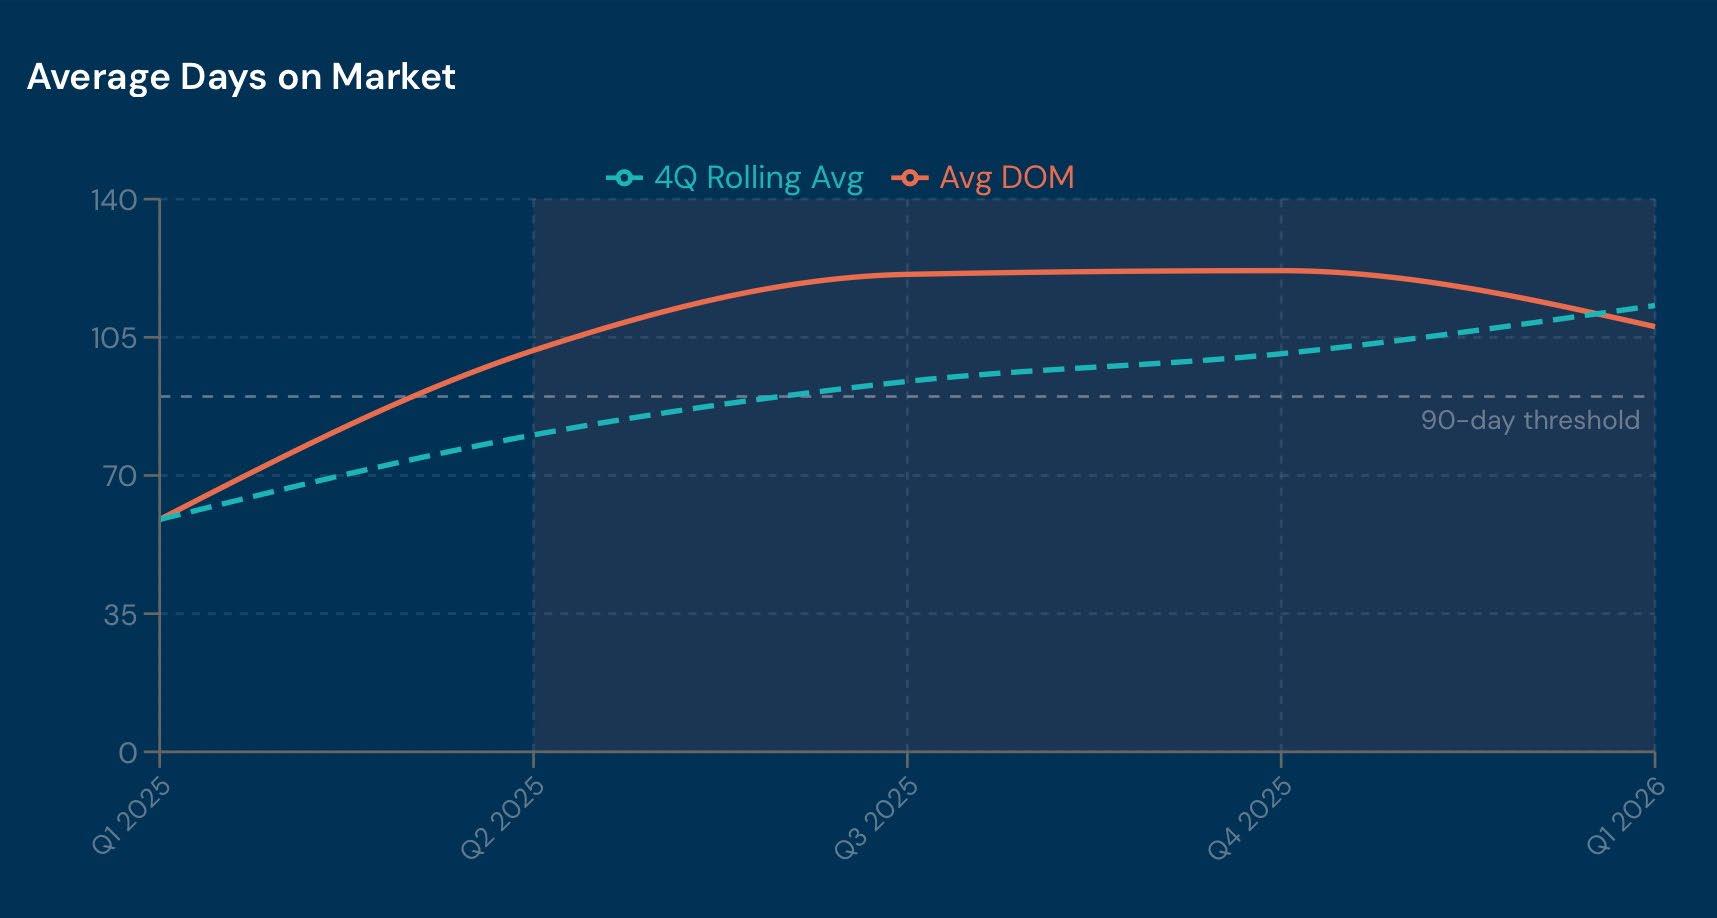
Avg DOM: 108d ▲ 82.9% YOY
Both avg DOM (108d) and the 4Q rolling avg exceed the 90-day threshold, signaling extended sell cycles well above historical norms.
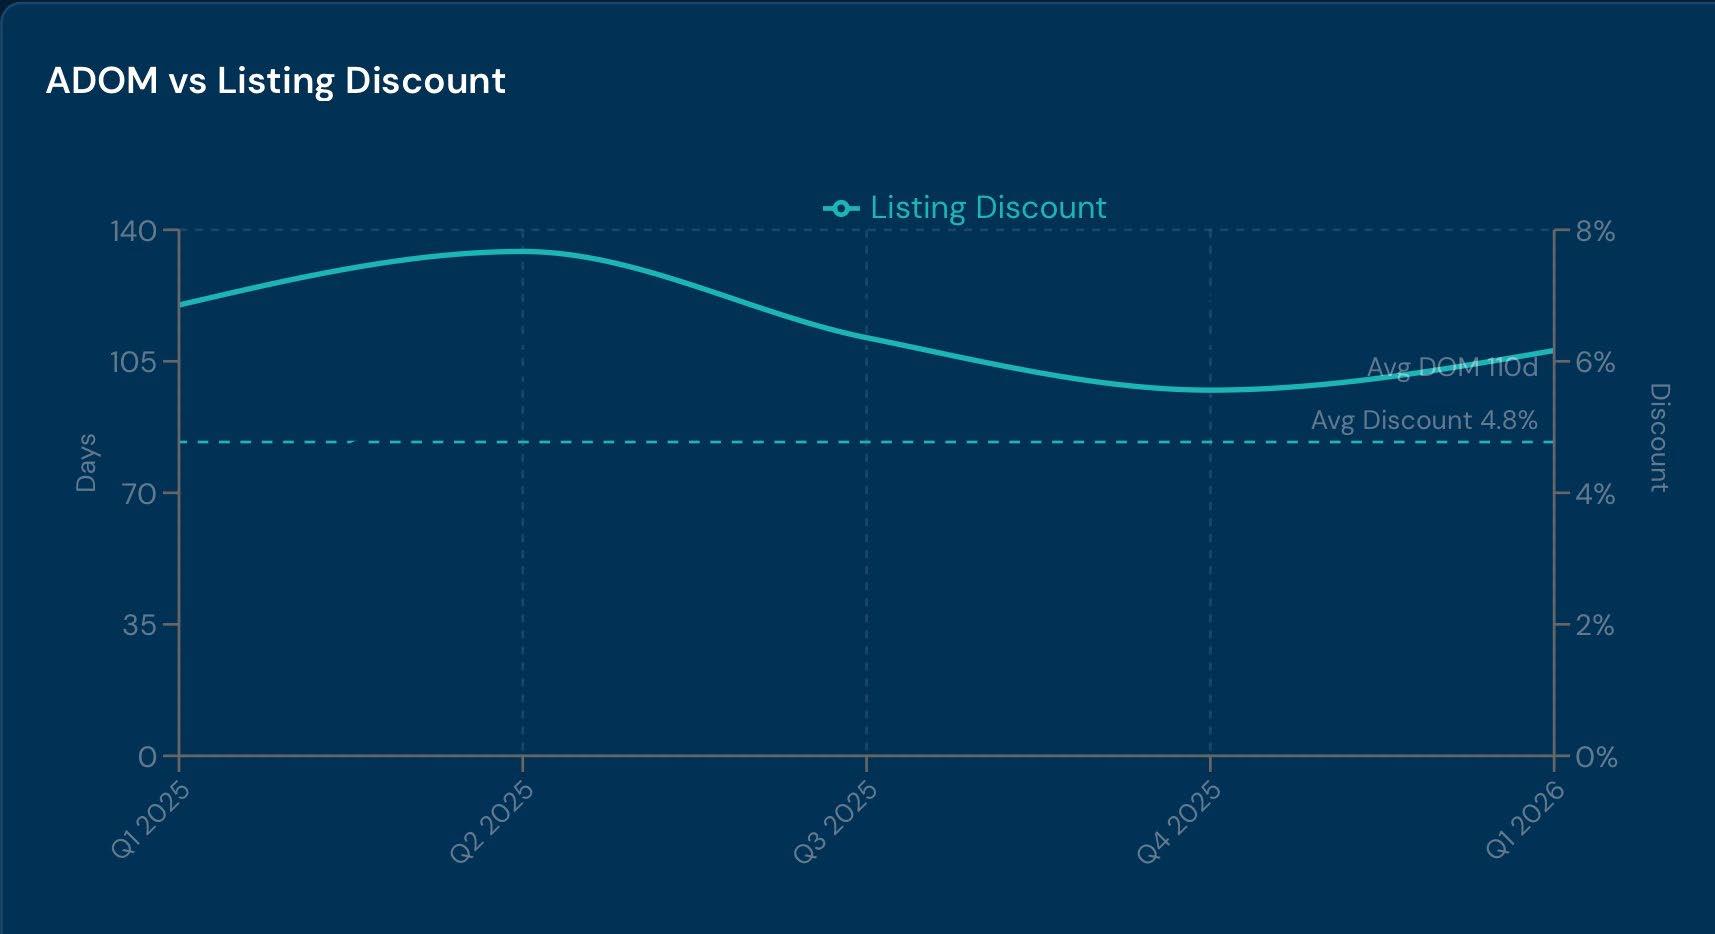
Listing Discount: 6.2% · Avg DOM: 110d
Discount widening from a ~4.8% trailing average confirms buyers extracting meaningful concessions at close.
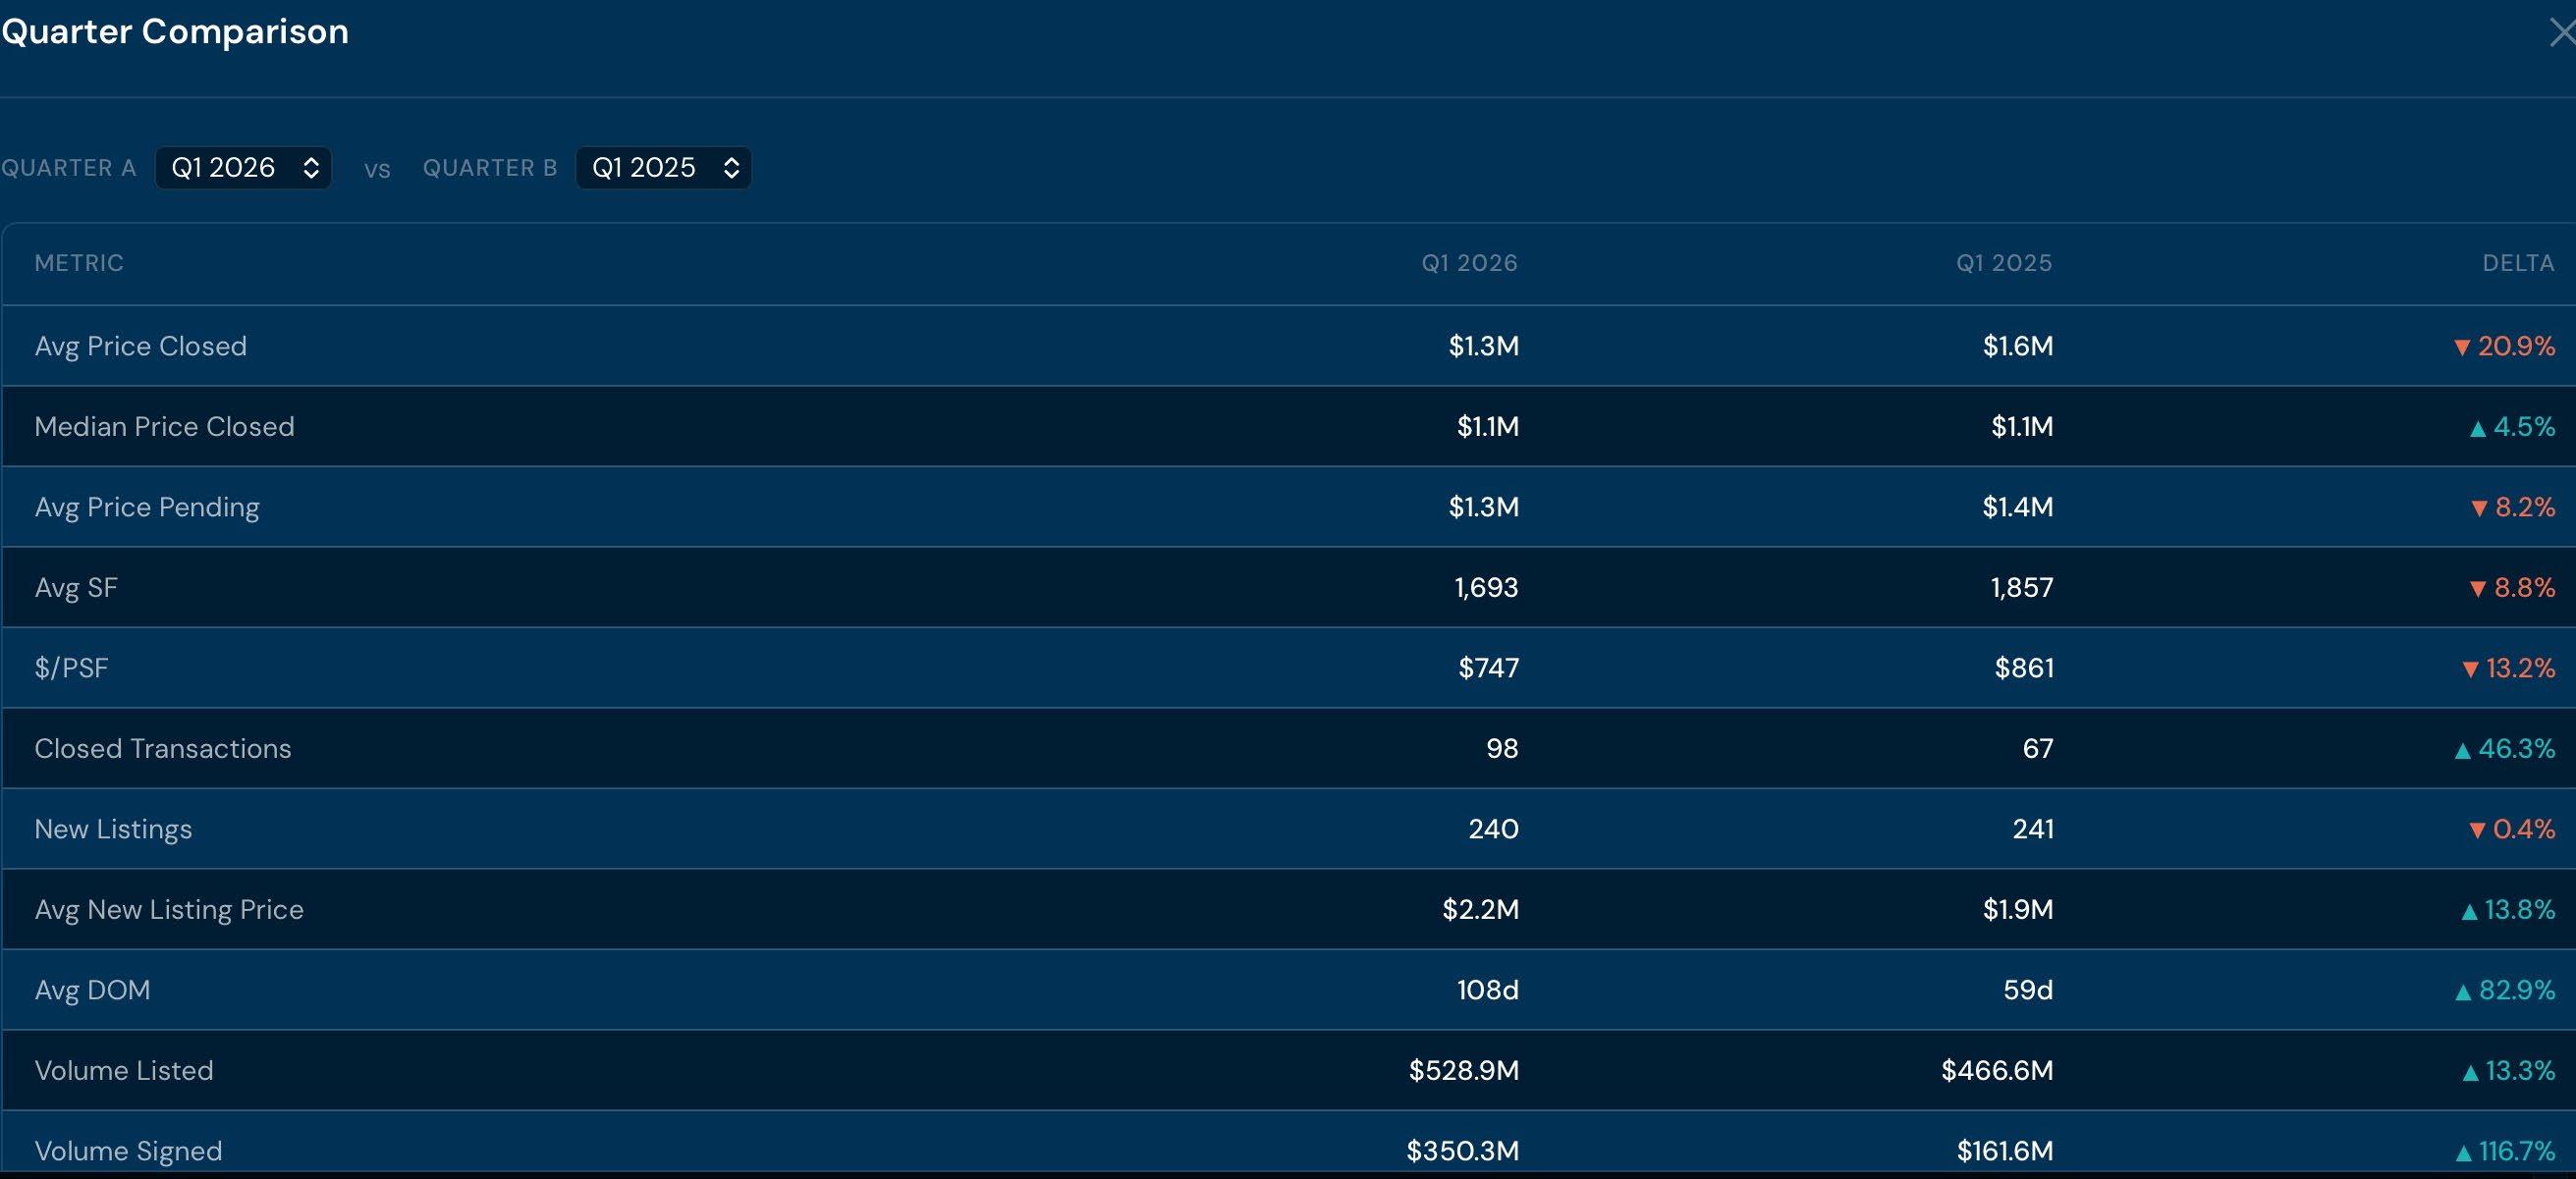

1 Closed transactions jumped to 98, up 66.1% from Q4 2025's 59 and 46.3% from Q1 2025's 67 — the highest quarterly volume since Q2 2024's 110.
2 Inventory remains elevated at 354 active listings and 16.1 months of supply, with $528.9M in new listing volume and average new listing prices at $2,203,644 — creating a 74.3% spread between ask and close that signals further price discovery ahead.
3 Listing discount widened to 6.2% and average DOM held at 108 days, confirming buyers are extracting meaningful concessions before closing.
4 Avg closed price fell to $1.3M, down 20.9% YOY, while the median held at $1.1M (+4.5% YOY) — the compression is concentrated in the upper tier.
With $350M in pending volume already locked and clearance rate still depressed at 0.23, Q2 2026 will test whether this transaction surge represents genuine demand absorption or opportunistic cherry-picking at the top of a 354-unit inventory wall.
Developers pricing new product above $2M/unit should expect extended sellthrough timelines of 14–18 months given the current 16.1-month supply overhang.
The $350.3M in signed volume must convert to closings in Q2 to confirm genuine demand failure to close would signal opportunistic rather than structural recovery.
The 74.3% spread between avg listing price ($2.2M) and avg close ($1.3M) indicates significant negotiation still occurring. Expect continued listing discounts of 6–8%.