6 minute read
Recent Market Trends, Landlord Analysis, and Rent


Distribution
Frequency of sales
Advertisement
Among 45 small multi-family NOAH properties in Oakman Boulevard Community, 31 were sold between 20112022, with a turnover rate of 68.89%. 19 properties were traded multiple times during this period, which signals a potential risk of instability. Of all NOAH property sales occurred in the neighborhood, 43% of them took place between LLCs. For example, a property located at 4234 W Davison was sold five times. Of these five sales, four of the five the transactions took place between LLCs and were accompanied by an increase in the sale price from $30,000 to $120,000. This pattern reveals the investor’s confidence in the future profitability of the property. However, this investment (or speculative behavior) can signal future rises in listed rent prices and potential instability in similar properties throughout the neighborhood.
We conducted a comparative analysis of the rental landscape in the Oakman Boulevard Community against other selected neighborhoods in the City of Detroit. These selected neighborhoods include West Village, Boston Edison, and
Grandmont. Due to time limitations, we were unable to determine the exact stock of NOAH properties in these neighborhoods, so the comparative analysis focuses on residential properties in general across these neighborhoods.
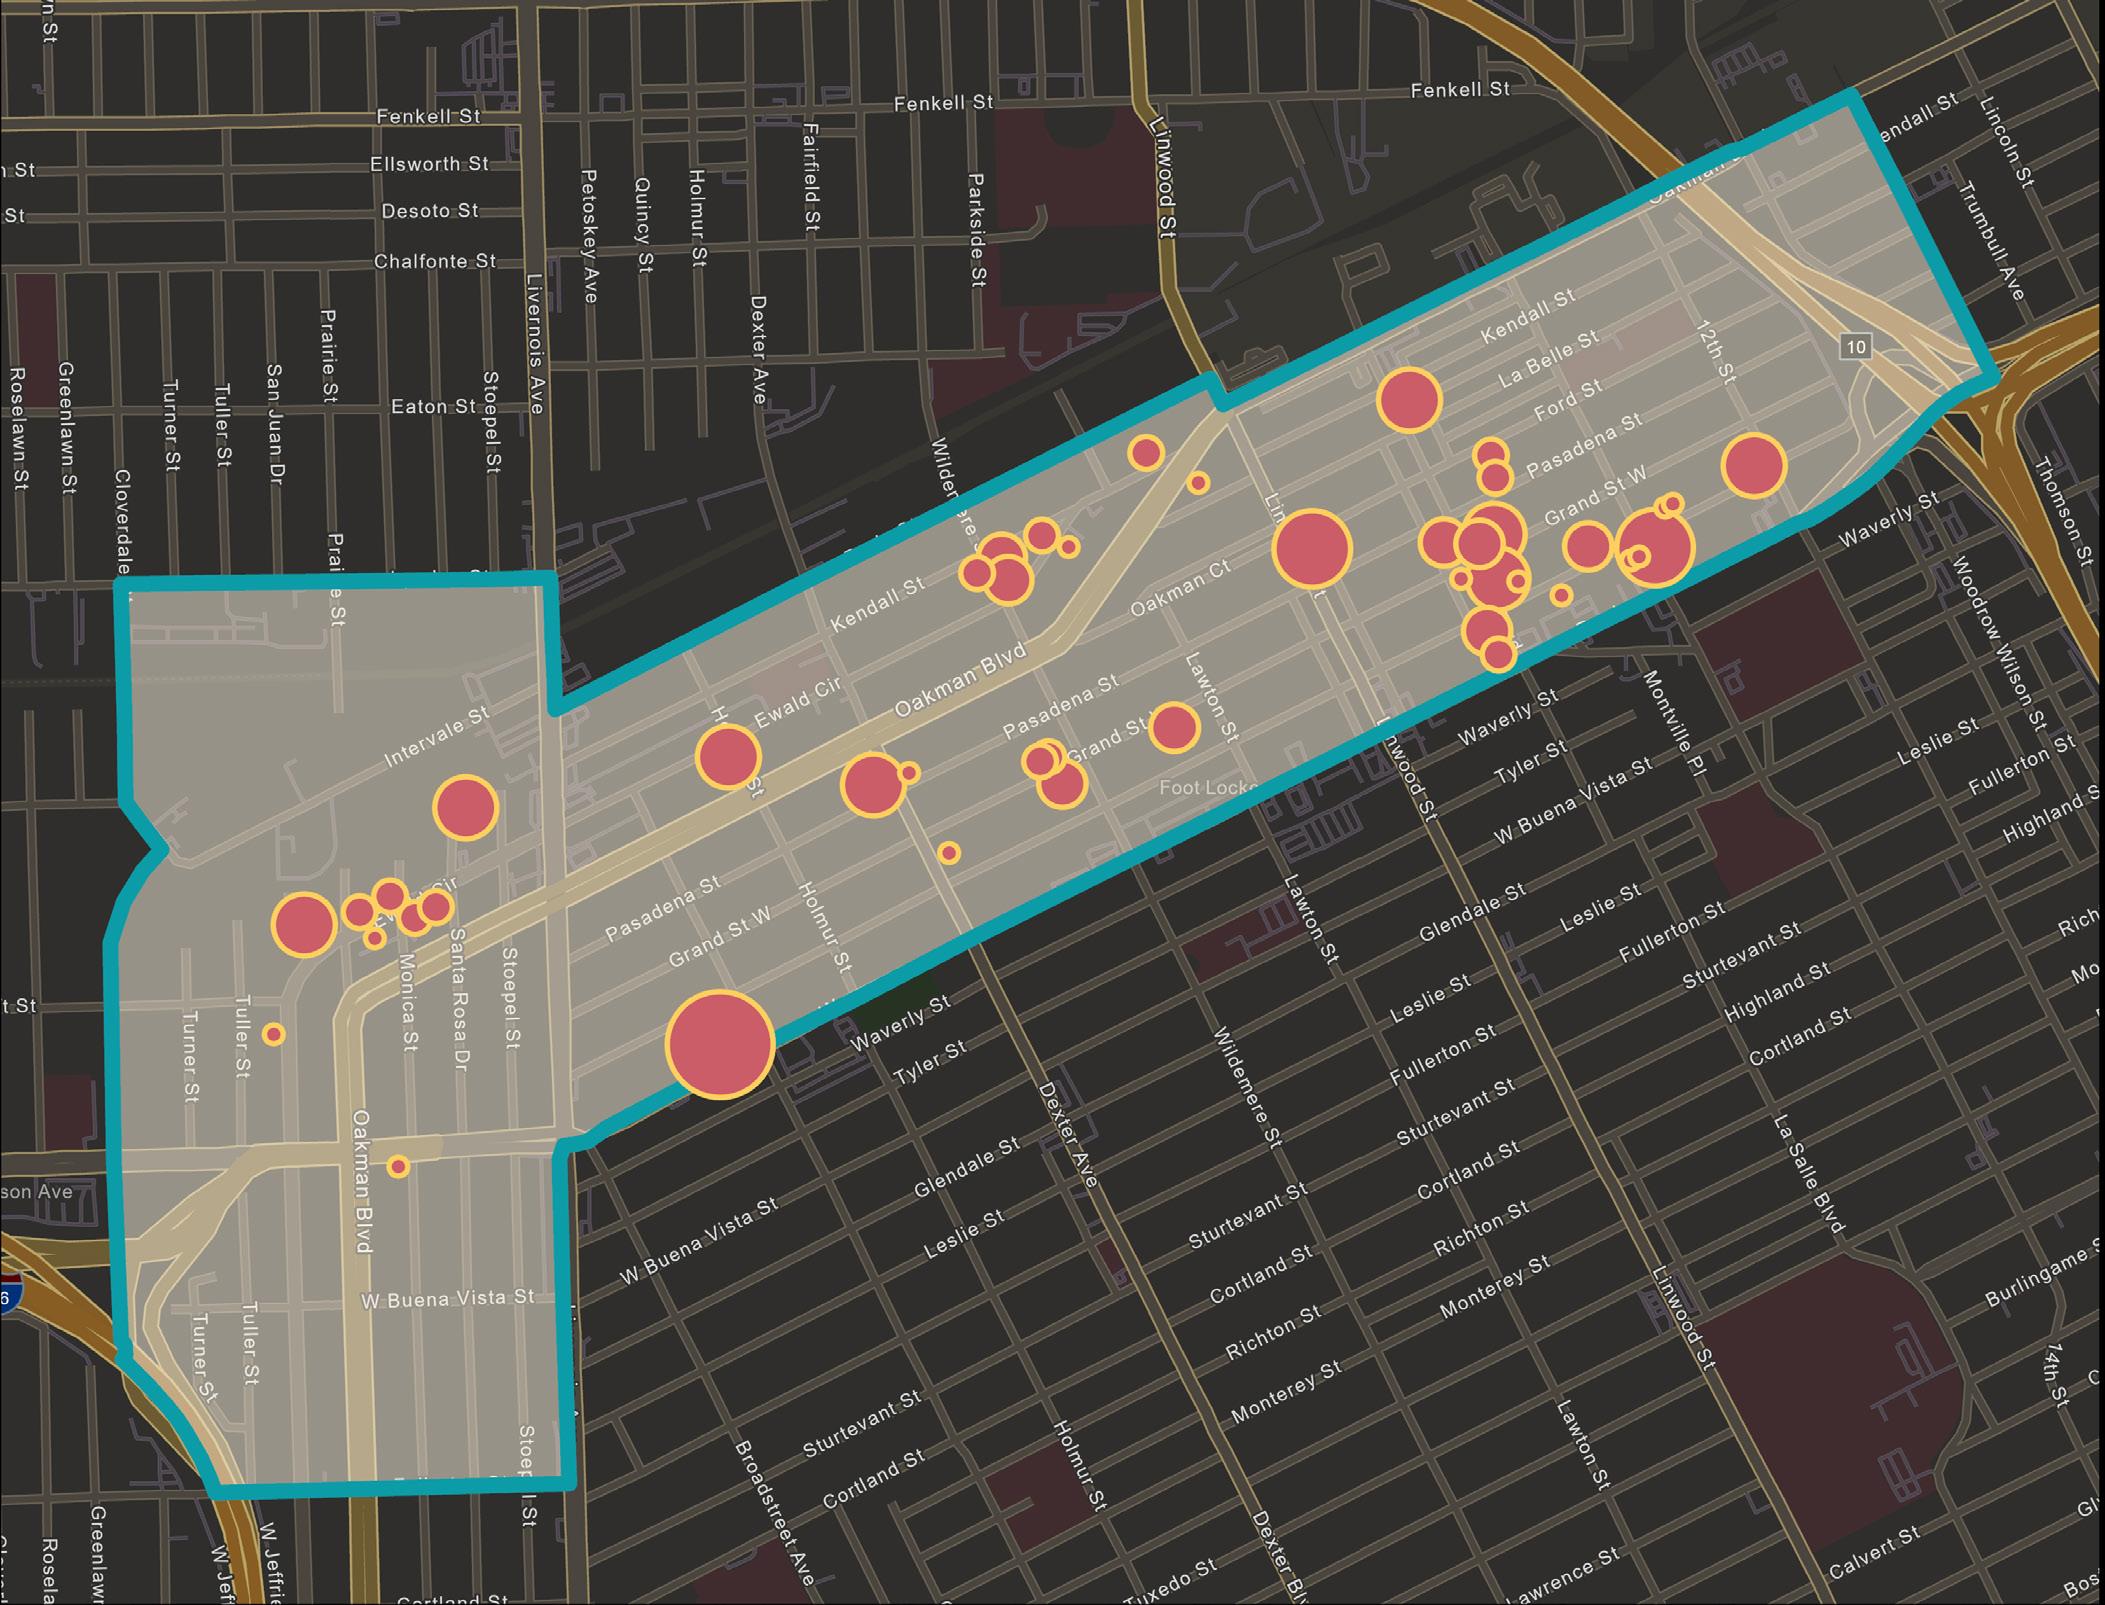
Residential properties in Oakman Boulevard Community are relatively stable with a turnover rate of 39.92%, compared to Detroit’s citywide average of 38.57%. However, the 45 identified NOAH properties in Oakman Boulevard have a higher turnover rate (68.89%), illustrating that NOAH properties have a higher likelihood of being traded on the market.
Comparing across select Detroit neighborhoods shows that those with a greater number of single-family houses tend to have higher turnover rates. For example, West Village has a higher turnover rate with 62.62% single-family houses compared to Oakman (at large) which has 53.32% single-family houses. Yet, the frequency of transactions for NOAH properties (with a turnover rate of 68.89%) is significantly higher compared to all residential properties (with a turnover rate of 39.92%) in Oakman as well as those in other selected neighborhoods. This shows that the high turnover rate for NOAH properties is not due to property type, but more likely due to increased investment interest in the neighborhood that has been seeing rising values as discussed below.
Market Trends + Risks to NOAH
Properties: Sales Analysis + Appreciation Rates
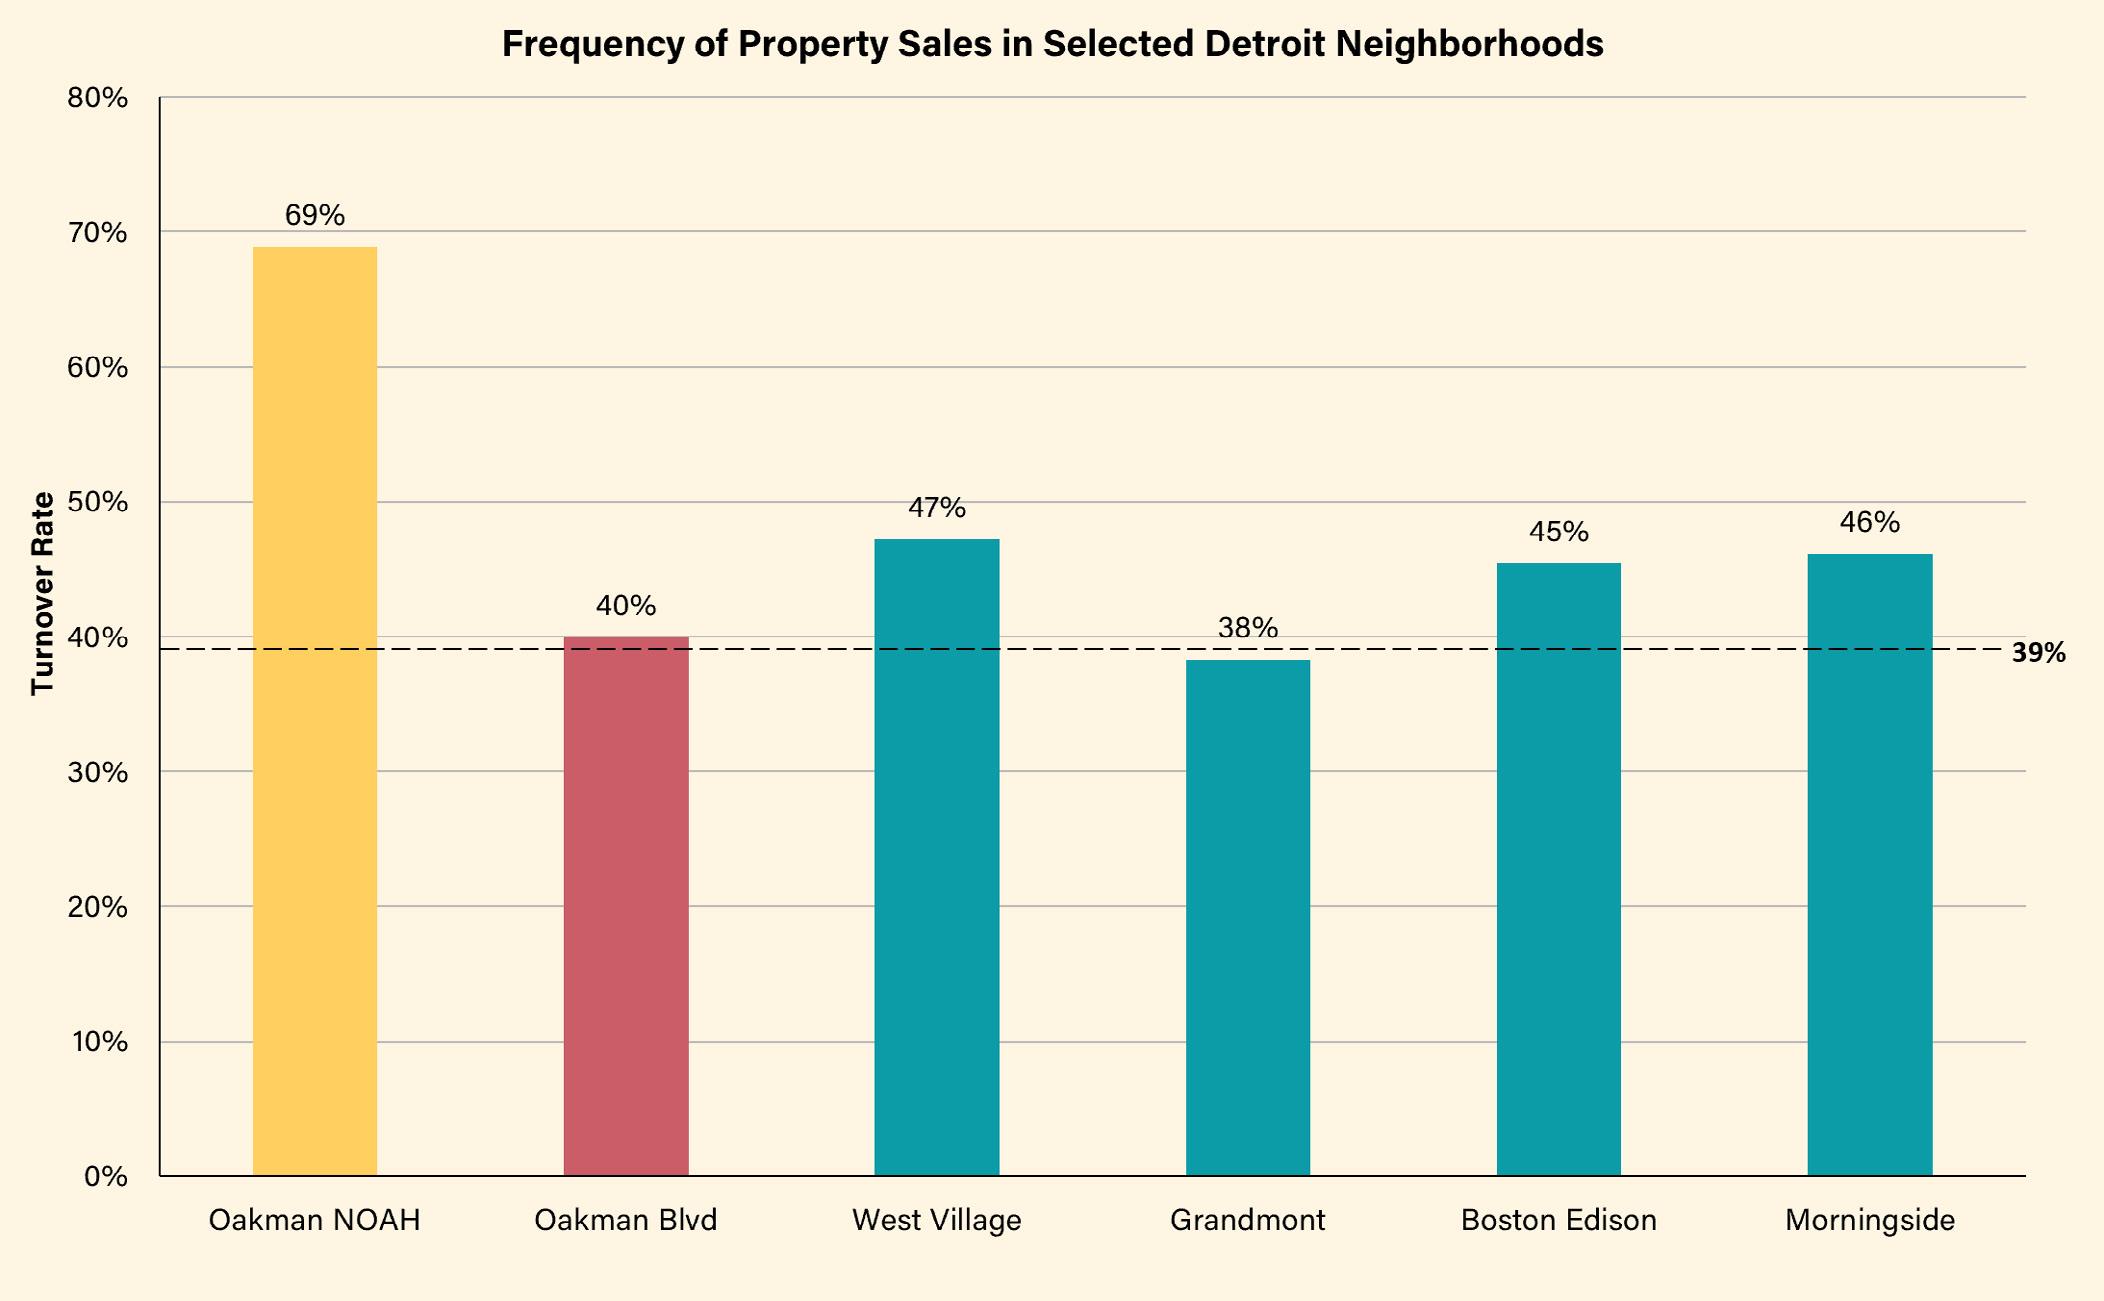
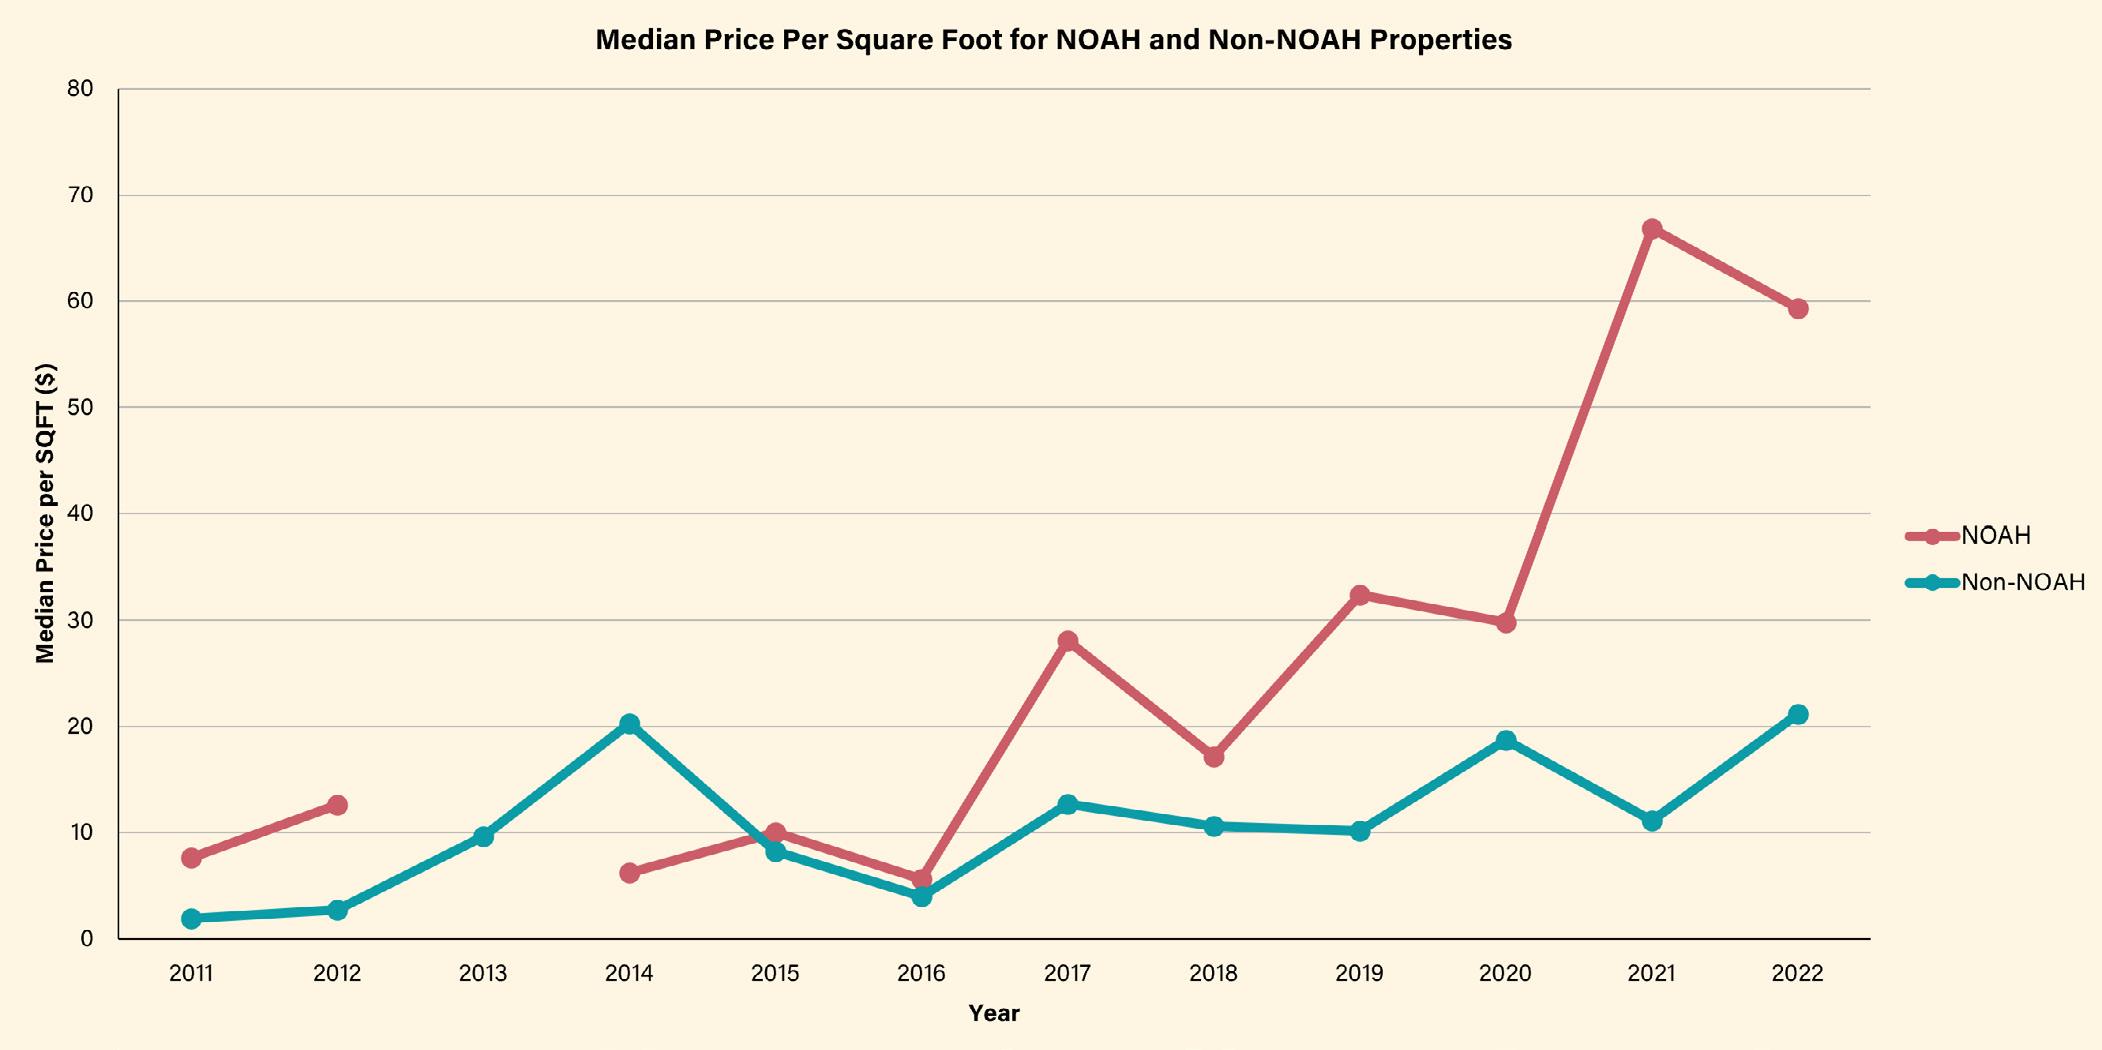
A price trend analysis comparing the 45 target NOAH properties in Oakman Boulevard Community, non-NOAH multifamily properties in the Oakman Boulevard Community, and multi-family housing in selected neighborhoods adds insight to the landscape of small multi-family NOAH properties in Detroit.
By tracking sales data from 2011-2022 it is evident that multi-family housing prices in Detroit are rising at an average annual appreciation rate of 15.15%. Acknowledging the possible distortion in 2022 due to the small sample size in sales data collection, housing prices in Detroit, as in the rest of the nation, showed a significant price spike during the pandemic.
For the small multi-family NOAH properties in Oakman Boulevard Community, their average annual appreciation rate is 20.52%, around five percentage points higher than the City of Detroit rate. A high average annual appreciation rate combined with these properties’ relatively high turnover rate reveals that small multi-family NOAH properties in the neighborhood are at risk of losing affordability.
There is a significant difference in price trends between small multi-family NOAH properties in Oakman and other multi-family properties. Since 2018, NOAH properties have risen in price at a faster rate than other properties in the neighborhood, which affirms that NOAH properties can generate higher returns for investors. One possible reason why NOAH properties are more popular with investors may be because the small multi-family NOAH properties allow private investors and small investment institutions to invest with less capital because of their lower price. Another possible reason is its correlation with the announcement of the JLG, which was announced in October 2017. 2
In order to corroborate our findings, we also looked at price per unit across the 45 target NOAH properties. From 2011 to 2022 price per unit shows similar patterns in price increases. Price per unit data can be found in appendix D.
Note: There is no sales data for small multi-family NOAH properties in 2013
Oakman landlords’ footprint in the City of Detroit

An evaluation of Oakman Boulevard Community’s target 45 NOAH landlords shows that those properties belong to a total of 42 landlords who own 148 properties across the City of Detroit. Of these 148 properties citywide, there are a total of 687 units with an average of 8 units per property. In general, the properties they own range from 4-36 units per property with some single-family properties containing 1 unit, showing that those landlords tend to invest in similar types of properties.
The overwhelming majority (73.81%, 31 landlords) of NOAH landlords are Michiganbased owners who appear to be slowly collecting additional properties. Meanwhile, 35.71% (15 landlords) of NOAH landlords are Detroit-based owners. Some landlords in Oakman Boulevard Community are larger players with more properties in the citywide rental market. ACP Oakman LLC owns the highest number of units (94) across the City at large, while James Hobbs has the highest number of properties (31).
Should the market trends show an increased value of properties in the Oakman neighborhood, it is possible that some of the landlords with a larger footprint may begin to invest in more properties within Oakman, raising rent values and shifting the landlord market to represent a higher proportion of larger players.
Rent level and distribution
Listed rent is an important part of understanding the affordability of properties within a community. However, obtaining accurate listed rent data for the 45 properties was challenging. Our team relied on MLS data to capture the most current listed rent prices, however the rent data that we were able to gather came from a range of years (2012-2021), making it difficult to accurately assess and analyze.
Of the 45 properties, we gathered listed rents for 18 properties. For the rent information we managed to collect, the data shows that those small multi-family NOAH properties are still relatively affordable, with rent in the range of $450-$895. Across the rent information we collected, the average listed rent is $605.78. In addition to looking at MLS listings to find rent data, our team looked at recent apartment listings on Zillow, Redfin, and LoopNet, knowing that some of the most up-to-date information may not yet be available in MLS. During our search, we found that some recently listed rent prices differed from what we found in MLS. For example, the rent data listed in MLS before 2020 for 13639 La Salle Boulevard was $450, while recent Zillow postings show recently renovated apartments available for $800 and $850. This example underscores the challenge of accessing real-time rent listings, making it difficult to track whether properties remain affordable or not.
As discussed in our analysis, increased sales frequency and rising property values in the neighborhood indicate that rent levels in these same properties are likely to rise significantly in the near future.
Summary of Findings from Property Research
Through property research, our team found that 45 properties with 4-36 units were identified as NOAH in the Oakman Boulevard Community. All of these NOAH properties were built before 1957, representing a high risk of lead paint exposure in properties that do not hold a certificate of compliance. 41 of the 45 properties have not gone through the process to receive a certificate of compliance, which indicates a high likelihood of poor exterior and interior conditions. Inspection and lead clearance is imperative in rental-occupied properties due to the aging housing stock in the City of Detroit and the risk of lead exposure to tenants.
An analysis of frequency of sales showed that 31 of the 45 target properties were sold between 2011 and 2022. 19 properties were traded multiple times. Compared to Detroit’s citywide turnover average of 38.57%, residential properties in the Oakman Boulevard Community have a turnover average of 39.92%. However, the 45 target properties have a much higher turnover rate (68.89%), signaling that NOAH properties have a higher likelihood of being traded on the market. The annual appreciation rate for small multi-family NOAH properties in the neighborhood is 20.52%, about five percentage points higher than the City of Detroit (15.15%). This high average annual appreciation rate combined with properties’ high turnover rate signals the risk of NOAH properties losing affordability. Of the rent information we gathered, listed rents ranged from $450-$895 across varying unit sizes. The average rent across the collected data is $605.78. While these properties are affordable at present, the market trend analysis indicates that property values are rising and this will likely increase rent levels in the future.