3 minute read
NOAH properties and their contractual relationships to the City of Detroit


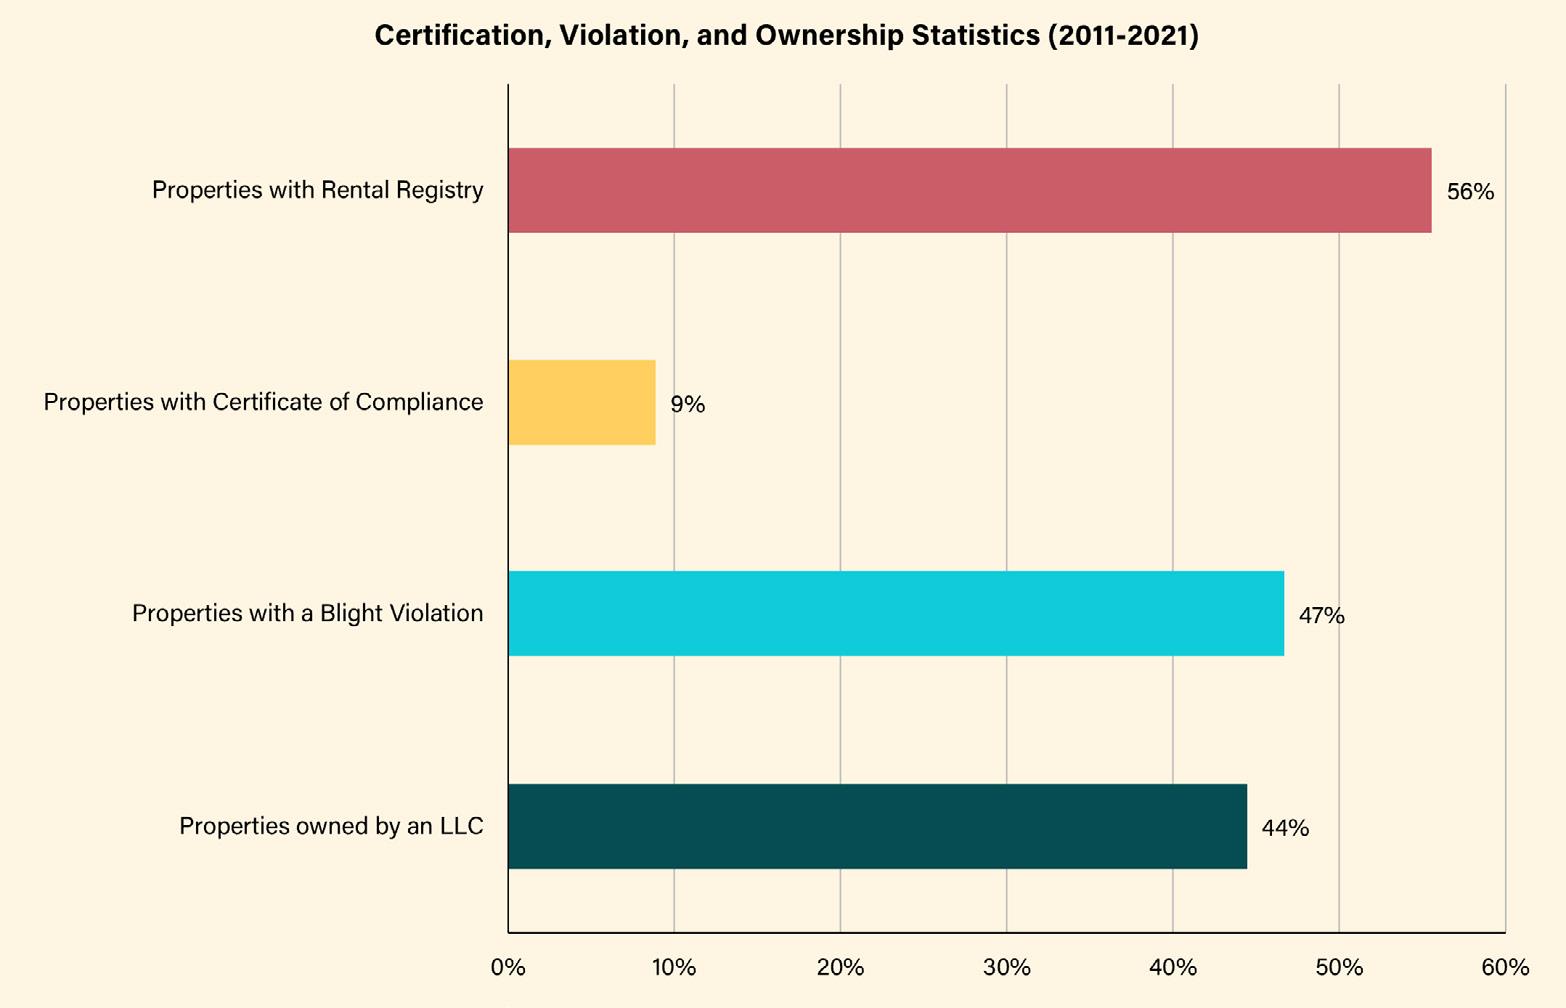
In order to better understand the status of each property in relation to the City of Detroit, an evaluation of certificate of compliance, blight violations, ownership status, and rental registry was conducted. From 2011-2022, of the 45 properties, we found that 44.44% are owned by an LLC, 8.89% have obtained a certificate of compliance, 46.47% have blight violations, and 55.56% hold a rental registration.
In Detroit, having a rental registration does not necessarily mean that a landlord has obtained a certificate of compliance. Of the 45 properties, only 4 (8.80%) hold both a certificate of compliance and a rental registration, which means that the other properties have neither been inspected by a 3rd party, nor passed a lead clearance. This striking number indicates that there is a lack of enforcement of basic condition standards in NOAH properties within the neighborhood. Rental properties without certificates of compliance may have serious quality issues, reflecting the poor conditions of many aging properties throughout the City.
Advertisement
Submarket comparison
Our team obtained CoStar submarket data to offer context and provide a comparison to NOAH properties in the Oakman Boulevard Community neighborhood. The online CoStar database integrates publicly available commercial real estate records to generate analyses and models of real estate markets as well as information on individual properties. CoStar reflects commercial real estate, including residential rental properties. Through this database, we are able to compile analytics related to property value, rental rate, sales history, sales volume, vacancy, and asset types.
As seen in Figure 7 below, the CoStar study area lies within the Uptown Detroit Submarket, which covers an area extending beyond Oakman. This area includes Highland Park, the North End, Dexter Linwood, Palmer Park, and areas surrounding the former state fairgrounds.
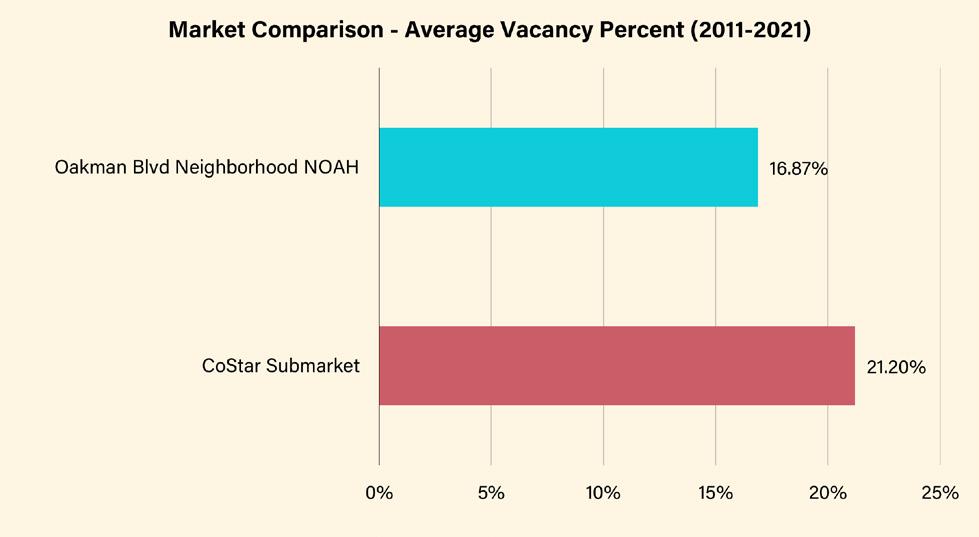
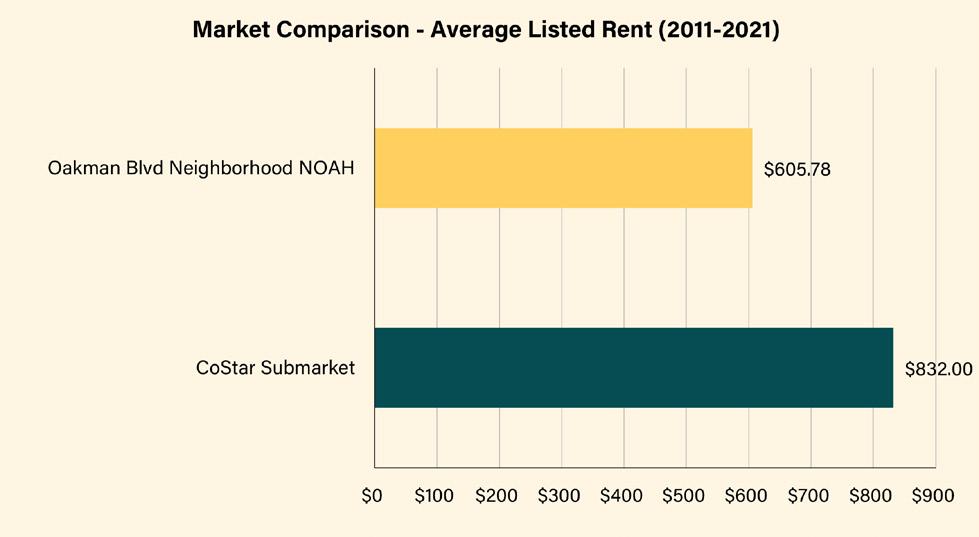
Oakman Boulevard Community neighborhood NOAH properties have an average vacancy percentage of 16.87%, a lower rate than the CoStar Submarket at 21.20%. Additionally, the Oakman average listed rent for NOAH properties is $605.78 whereas for the CoStar Submarket it is $832.00. This shows that with lower vacancy rate and lower rent, there is room for rent growth in the Oakman area.


Property Typology represent those that are unregistered; they have obtained neither a rental registration nor a certificate of compliance. Properties in typology 2 represent those that have obtained a rental registration but not a certificate of compliance. Properties in typology 3 represent those that have obtained both a rental registration and a certificate of compliance.
After data identification and initial analysis of NOAH properties in the neighborhood, a property typology was defined by evaluating whether or not properties have obtained rental registration and certificate of compliance. As explained in the previous section, evaluating the characteristics of properties that have or have not obtained a certificate of compliance and/or a rental registry underscores areas for potential improvement.
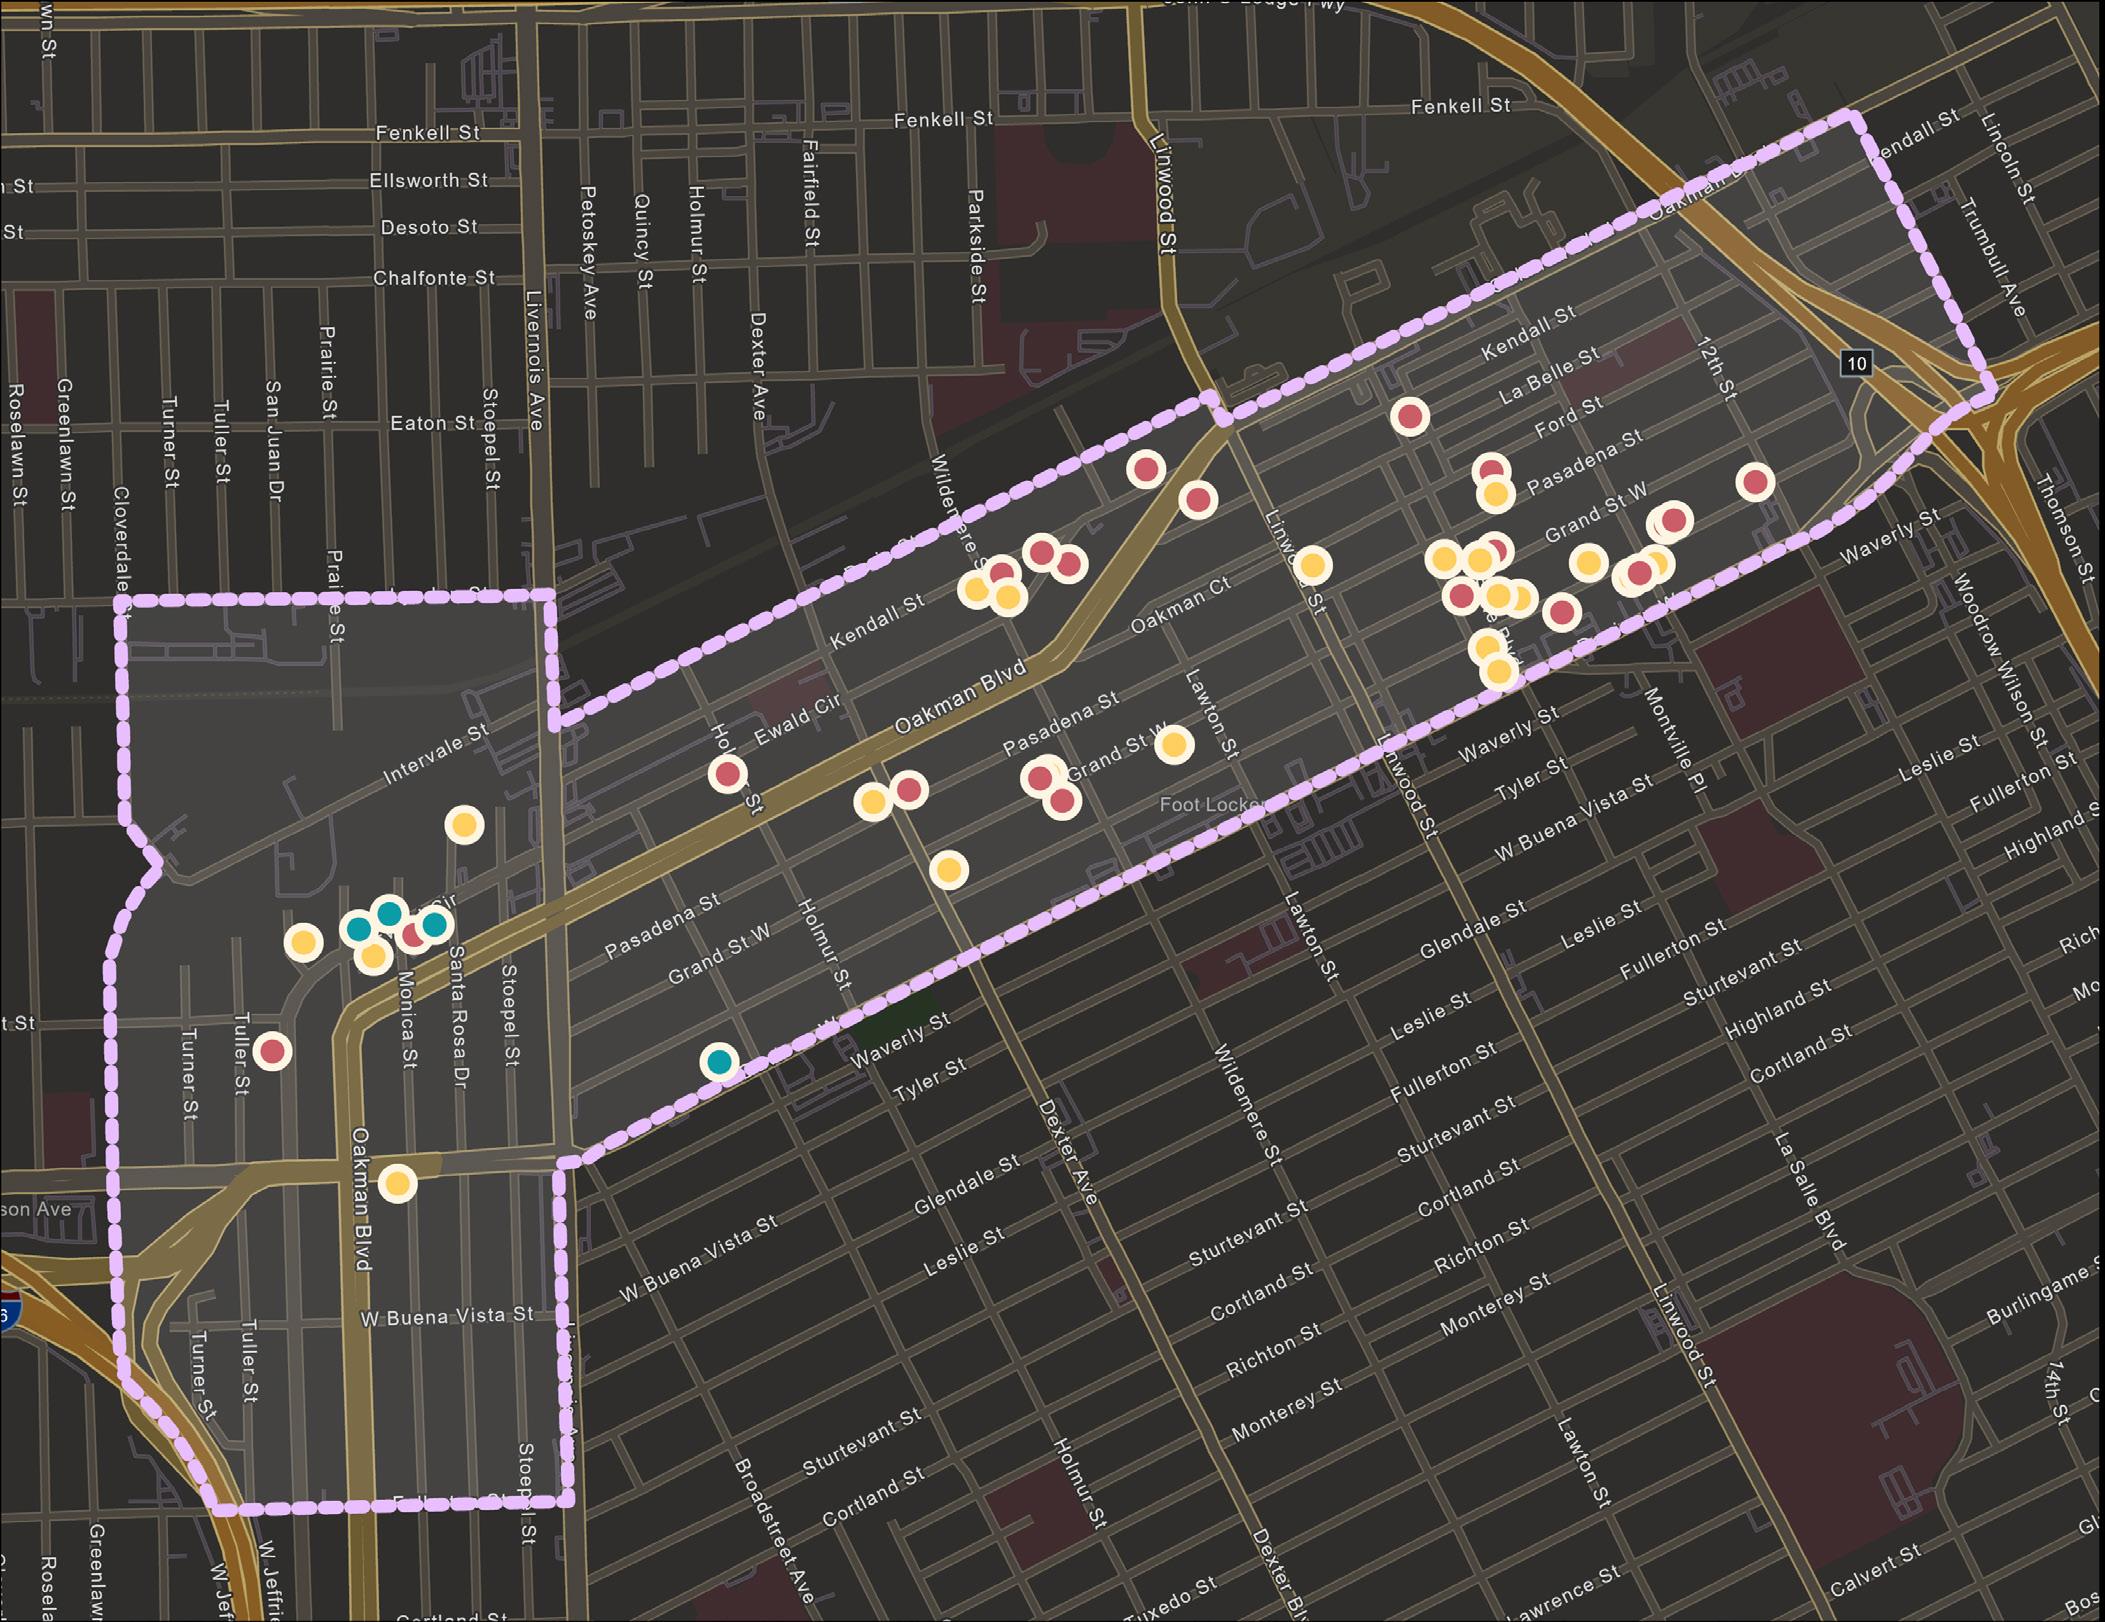
45 properties were designated into three typology categories (a full list of attributes across typologies can be seen in Appendix C, Table C1). Properties in typology 1
Properties in typology 1 make up 20 of the 45 target NOAH properties. These properties have a high number of units overall (151), but a relatively small number of average units per property (7.6). Properties in typology 1 have the highest average vacancy percent (22.5%) across typologies.
Of these 20 properties, 20% are owned by LLCs, indicating that this typology is represented by smaller scale landlords. These property characteristics mean that it is more likely that smaller landlords do not obtain rental registration and certificate of compliance, making their properties at greater risk for lower overall conditions.
Properties in typology 2 make up 21 of the 45 target NOAH properties. Compared to typology 1, properties in typology 2 show a higher number of units overall (280) and a higher average number of units (13.3). In contrast, properties in typology 2 have a lower average vacancy rate (12.08%). Compared to typology 1, 57% of properties in typology 2 are owned by an LLC. The combination of LLC ownership, high average vacancy percentage, and high assessed value indicates possible risk of speculation in this typology.
Properties in typology 3 make up 4 of the 45 NOAH properties. Compared to typology 1 and 2, properties in typology 3 have a very small number of overall units (34) with a relatively low average number of units (8.5). These properties are all owned by LLCs.