Pulaski County Transportation Report
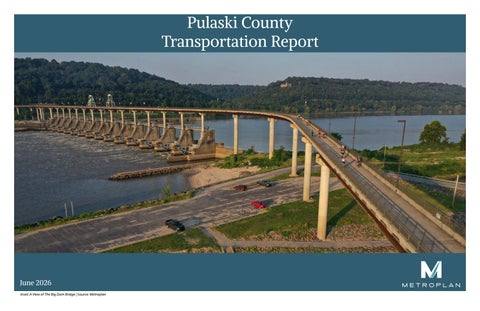
June 2026 Inset: A View of The Big Dam Bridge | Source: Metroplan
Table of Contents ABSTRACT PULASKI COUNTY HISTORY CURRENT GROWTH TRENDS TRANSPORTATION FORECAST DEVELOPMENT CHALLENGES
Pulaski County Transportation Report Abstract This report was developed by Metroplan to inform regional development and transportation plans. It is intended to provide decision makers within Pulaski County and its cities and towns with information to guide the development of transportation projects. The report provides data associated with safety, congestion, demographics, infrastructure condition, and current transportation projects. The report largely focuses on existing conditions but also examines past trends as well as projected future conditions.
Pulaski County History REPORT LIMITATIONS TRANSPORTATION IMPROVEMENTS TABLE OF MAPS SOURCES MAPS
Pulaski County has served as an important center for movement and commerce for centuries. Long before European settlement, Indigenous peoples developed settlements, trade networks, and trail systems throughout the region, taking advantage of the county’s location where Arkansas’s three natural divisions converge. European exploration began in the 16th century with Hernando DeSoto’s expedition, followed by French explorers in the early 18th century. Permanent settlement increased in the early 1800s, and Pulaski County was established in 1818 as one of Arkansas Territory’s original counties. The selection of Little Rock as both the county seat and territorial capital in 1821 positioned the county as the political and economic center of Arkansas, a role it has maintained since statehood in 1836. Throughout the 19th and 20th centuries, Pulaski County experienced substantial population growth, urbanization, and economic development. Little Rock and North Little Rock emerged as the state’s largest urban centers, supported by expanding educational institutions, government functions, and military facilities. Following World War II, the county developed into Arkansas’s primary multimodal transportation hub with the construction of Interstates 30, 40, 430, 440, and 630, the completion of the McClellan-Kerr Arkansas River Navigation System, expansion of the Port of Little Rock, growth of the Clinton National Airport, and establishment of the Little Rock Air Force Base.
Image 1: Pulaski County on the map of Arkansas
Pulaski County Population 1930-2020
450,000
Decennial Census
399,125 400,000
382,748 361,474 340,597
350,000
349,660
287,189
300,000
242,980 250,000
196,688 200,000 156,085 150,000
137,727
100,000 1930
1940
1950
1960
1970
1980
1990
2000
2010
2020
Figure 1: County Population Statistics 1930–2020
Pulaski County Population Statistics (See Figure 1, Figure 2, Figure 3) • • •
Population estimate for 2025 is 405,808. County population grew 10% between 2000 and 2020. 7% (28,084 people) of the county’s working population commutes to other counties for work.
Pulaski County’s population grew steadily from approximately 137,700 residents in 1930 to nearly 400,000 residents in 2020, with growth patterns shifting geographically over time. Between the 1930s and 1950s, most residents lived within the expanding urban areas of Little Rock and North Little Rock, while post-World War II development began extending into nearby communities. From the 1950s through the 1980s, suburbanization accelerated. Pulaski County added more than 140,000 new residents, driven in part by the incorporation of Jacksonville and the establishment of the Little Rock Air Force Base. This spurred residential growth north of the Arkansas River. In the 1980s, court-ordered school desegregation efforts and district boundary restrictions further influenced residential patterns, prompting many families to relocate to suburban and unincorporated areas such as Sherwood, Maumelle, and western Pulaski County. As a result, the Pulaski County Special School District service area experienced significant residential growth. Since then, population growth has increasingly shifted westward, with the incorporation of Maumelle in 1985 and continued development in western Little Rock — including the Chenal Valley area — accommodating much of the county’s expansion. Despite slower growth rates in recent decades, Pulaski County has added nearly 60,000 residents between 1980 and 2020. The county remains Arkansas’s most populous county and continues to serve as the state’s primary center for government, healthcare, and education.
% of Workforce Employed Outside County of Residence CTPP 2017-2021 | ACS Five-Year People working outside countySample bordersData
80% 65%
70%
67% 57%
55%
60% 50% 40%
35%
30% 20% 7%
10% 0% Faulkner
Grant
Lonoke
Perry
Pulaski
Saline
Figure 2: Workforce Commuter Flow Statistic
The chart above depicts that only 7% of the working population in Pulaski County travels to elsewhere for work. This reinforces the fact that Pulaski County serves as the employment hub of Central Arkansas.
Current Growth Trends Metroplan’s forecast indicates that Pulaski County’s population will continue to grow steadily between 2020 and 2050 as shown in Figure 3. After reaching 399,125 residents in 2020, the county surpassed 405,000 in 2025 and will surpass 416,000 by 2030, with growth continuing at a consistent pace through the following decades. By 2040, the population is expected to reach approximately 437,500 residents and increase to 458,581 by 2050. Overall, the forecast projects an increase of nearly 60,000 residents over the 30 year period, representing approximately 15 percent growth. As shown in Figure 2, population growth is expected to remain positive but moderate, reflecting a slower rate of growth than experienced during the mid-20th century. While Pulaski County continues to add residents, its recent growth rate of approximately 1.6 percent is lower than that of several neighboring counties in the Central Arkansas region. Population in Pulaski County has shifted outward from the urban cores of Little Rock and North Little Rock to suburban communities, with recent decades characterized by continued westward expansion. While this pattern is expected to continue, several areas within the county present strong opportunities for future growth. Western Little Rock and the western portions of Pulaski County are expected to remain the county’s primary growth areas as residential and commercial development continues to expand. The recently constructed White Oak Interchange also presents new opportunities for development in central Pulaski County by improving accessibility and opening additional land for development. Sherwood has experienced consistent population growth and is well positioned to continue attracting new residents. Within Little Rock and North Little Rock, redevelopment and infill initiatives in the Pettaway neighborhood, Argenta and surrounding areas have the potential to strengthen downtown by increasing housing options and revitalizing underutilized properties. The Port of Little Rock will continue to serve as a major economic asset, supporting industrial development, attracting new businesses, and generating employment opportunities. Although the southern portion of the county has historically experienced limited growth, its available land and strategic location suggest considerable long term development potential as infrastructure and market demand continue to evolve.
Metroplan’s Pulaski County Population Pulaski County Population 1980-2020 With Forecast to 2050 Metroplan Forecast to 2050 480,000 460,000 440,000 420,000 400,000 380,000 360,000 340,000 320,000 300,000 1980 1985 1990 1995 2000 2005 2010 2015 2020 2025 2030 2035 2040 2045 2050 Pulaski
Pulaski Forecast
Figure 3: Pulaski County Population Projection to 2050
Transportation Pulaski County is home to the most comprehensive transportation network in Arkansas and serves as the primary transportation hub for Central Arkansas. Its strategic location and diverse transportation assets support the movement of people and goods throughout the region and beyond. In addition to its roadway network, Pulaski County is served by public transit, freight and passenger rail, the Port of Little Rock along the Arkansas River, and the Bill and Hillary Clinton National Airport. These provide multimodal transportation options that support regional mobility and economic growth.
Overall, Pulaski County’s transportation network provides reliable travel times across most major corridors. However, several key segments experience recurring congestion that reduces travel time reliability, particularly during peak commuting periods. Interstate 30, where it enters Pulaski County from Saline County, is one of the least reliable corridors due to heavy commuter traffic entering the county. More than half of Saline County’s workforce commutes to Pualski County. Additional reliability challenges occur along sections of Interstate 630. A part of the problem is the reduction of travel lanes and the large traffic volumes atrracted by the midtown employment centers such as the Baptist Health Medical Center, Akransas Children’s Hospital and the Little Rock Central High School. Interstate 530 north bound at the south terminal, State Highway 107 near downtown North Little Rock, and portions of State Highway 100 also experience recurring delays and reduced travel time reliability.
ADT Gain 2019-2025
Counter Location
22,000
I 40 - Near Exit 14B
17,000
Hwy 57 - Near City of Sherwood PWD
16,000
Hwy 430 - Near Westwood Valley Condos
The county’s highway system is anchored by Interstates 30, 40, 57, 430, 440, 530, and 630 which provide regional and interstate connectivity for the movement of people and goods. These facilities are complemented by major U.S. highways, including US 70 and US 165, and an extensive network of state highways such as Highways 5, 10, 100, 107, 161, 365, and 367, among others. Together, these routes form the backbone of the county’s transportation system. As the economic center of Central Arkansas, Pulaski County experiences some of the highest traffic volumes in the state.
16,000
Hwy 630 - Near Baptist Health
16,000
Hwy 630 - Financial Center Parkway
15,000
Hwy 430 - Near Big Rock Fun Park
14,000
Hwy 430 - Near Central Ar. Christian Schs
14,000
Hwy 430 - Near Kanis Road
14,000
Hwy 430 - Terry Elementary School
Travel demand is concentrated along the interstate corridors and major state highways. Interstate 30, 40, 430, and 630 carry more than 100,000 vehicles daily. These high traffic volumes reflect not only the travel needs of county residents but also the significant number of commuters who rely on Pulaski County’s transportation network each day.
-27,000
I 40 - Near Shilcotts Bayou
-25,000
Financial Center Pkwy - S Shackleford Rd
-16,000
I 40 - Near Main Street Ramp Exit
-13,000
Cantrell Rd - N Rodney Parham
-12,300
S Cumberland St
-12,000
Cantrell Rd - Second Presbyterian Church
-12,000
I 40 - Burns Park Drive
-9,200
La Harpe Blvd
-9,000
Cantrell Rd - Pleasant Ridge Apartments
Table 1: Highest Average Daily Traffic Gain from 2019–2025
ADT Loss 2019-2025
Counter Location
Table 2: Highest Average Daily Traffic Loss from 2019–2025
Transportation Cont.
Motorized Crash Sevierity
As the transportation hub of Central Arkansas, AR State Chart PoliceTitle - ARDOT | 2021-2024 Pulaski County carries some of the highest traffic volumes in the state, Wrightsville resulting in a greater concentration Sherwood of crashes and serious injuries than surrounding counties. Several roadway Rural Pulaski segments are identified in the Regional North Little Rock Safety Action Plan’s High Injury Network and continue to be priorities Maumelle for safety improvements. Interstate Little Rock 30, particularly where it enters the county from Saline County, records Jacksonville some of the highest numbers of fatal Cammack Village and serious injury crashes. Portions of Interstate 430 also experience 0 5,000 10,000 15,000 20,000 25,000 30,000 35,000 40,000 45,000 50,000 Cammack North Little Rural elevated crash rates due to high traffic Little Rock Maumelle Sherwood Wrightsville Village Jacksonville Rock Pulaski volumes and complex interchange Property Damage Only 11 2,409 33,323 777 9,226 3,516 2,049 15 Incapacitating Injury 106 719 28 182 172 59 2 movements. Within the county’s urban Non-Incapacitating Injury 1 408 3,581 126 1,326 631 253 7 areas, the downtowns of Little Rock, Possible Injury 283 5,229 79 1,416 475 371 8 North Little Rock, and Jacksonville Fatal Injury 22 176 3 40 79 7 report higher concentrations of serious Property Damage Only Incapacitating Injury Non-Incapacitating Injury Possible Injury Fatal Injury injury crashes, reflecting the increased travel demand associated with major Figure 4: Motorized Crash Sevierity by Jurisdiction in Pulaski County employment, and commercial and activity centers. Non-motorized crashes are distributed Non-Motorized Crash Sevierity throughout the county but occur more frequently in AR State Chart PoliceTitle - ARDOT | 2021-2024 midtown and the Geyer Springs region of Little Rock. Sherwood
Pulaski County plays a critical role Rural Pulaski in Arkansas’s freight network, with Interstate 40 serving as the county’s North Little Rock primary freight corridor. The highest percentage of freight traffic is observed Maumelle along Interstate 40, particularly near its Little Rock interchange with Interstate 440, where freight vehicles account for as much as Jacksonville 72 percent of total traffic. Interstate 40 continues to carry a significant share Alexander of freight traffic across the eastern 0 100 200 300 400 500 600 700 800 900 portion of the county, while Interstate North Little Alexander Jacksonville Little Rock Maumelle Rural Pulaski Sherwood 30 also serves as a major interstate Rock Fatal Injury 8 87 16 18 2 freight corridor. Interstate 440 provides Non-Incapacitating Injury 26 177 5 44 15 15 an important connection between Incapacitating Injury 1 17 230 2 80 21 6 these interstate corridors and the Port Possible Injury 5 161 0 26 7 11 Property Damage Only 9 107 1 16 8 1 of Little Rock, facilitating the efficient movement of goods throughout the Fatal Injury Non-Incapacitating Injury Incapacitating Injury Possible Injury Property Damage Only region. Another major freight activity Figure 5: Non-Motorized Crash Sevierity by Jurisdiction in Pulaski County area is the Interstate 30 and Interstate 530 interchange, where freight traffic remains consistently high due to regional and statewide distribution patterns.
Public transit services in Pulaski County are provided by Rock Region METRO (RRM), the region’s primary transit provider. RRM operates 15 fixed bus routes serving Little Rock and North Little Rock, carrying approximately 9,500 to 10,000 riders on an average weekday and nearly 3 million passenger trips annually. Fixed route bus service generally operates between 5:00 a.m. and 8:00 p.m., with most routes converging at the River Cities Travel Center in downtown Little Rock, which serves as the system’s primary transfer hub. Plans for mixed use development surrounding the transit center present an opportunity to strengthen transit oriented development and encourage greater transit use. Within the Rock Region Metro’s area of operation, approximately 112,500 residents live within a quarter mile walking distance of a fixed route bus service, providing convenient access to public transportation for a significant portion of the population. Beyond its fixed route network, Rock Region METRO provides complementary mobility services through METRO Connect paratransit and five microtransit zones serving portions of Little Rock, North Little Rock, Sherwood, and Jacksonville. The METRO Connect service offers on demand transportation within designated service zones using smaller vehicles while maintaining the same fare structure as the fixed route system. In addition, the METRO Streetcar, a 3.4 mile heritage rail service, provides a direct connection between downtown Little Rock and North Little Rock, supporting local mobility and tourism. Although Rock Region METRO provides essential transit services throughout the county, opportunities exist to improve accessibility, connectivity, frequency, and the overall rider experience. Fixed route service is concentrated within the urban core and does not extend to many developing areas on the outskirts of the county, limiting access for residents in lower density communities. Service frequencies typically range from 30 to 35 minutes depending on route demand and operator availability. Expanding first mile and last mile connections through enhanced bicycle facilities, secure bike parking, shared micromobility options, and improved pedestrian infrastructure could increase the effective service area of the transit network. Additionally, evaluating ridership patterns and prioritizing improvements at high use stops, such as shelters, seating, lighting, and real time passenger information, would enhance rider comfort while encouraging increased transit use throughout the county.
Transportation Projects
Completed OR Under Construction Projects • Interstate 30 Crossing • Broadway Bridge • Big Rock Interchange • Managed Lanes of Interstate 430 • Highway 10 / Interstate 440 / Rodney Parham Projects: * Interchange * Widening and other improvements • Freeway widening to 6 lanes for: * Interstate 30 * Interstate 40 * US Highway 67 (now Interstate 57) • Completion of Interstate 440 * Section north of I-40 • Rail Grade Separation Projects * McCain Boulevard in North Little Rock * Baseline Road in Little Rock * Main Street in Jacksonville * JP Wright Loop in Jacksonville * Geyer Springs in Little Rock • Recently Completed Connections * White Oak Crossing and Interchange * Brookswood/Brockington Ramp Planned Projects • South Loop • Interstate 30 Crossing Improvements Ped/Bike Projects
Completed And On-Going Projects • Arkansas River Trail • Big Dam Bridge • Two Rivers Bridge • Southwest Trail • Levy Trail • Clinton Presidential Park Bridge • Junction Bridge • Southeast Trail
Forecast Development Challenges
Condition
Number of Bridges
Good
197
As Pulaski County continues to grow, future development will need to balance increasing demand for housing, employment, and infrastructure while preserving the efficiency of the county’s transportation system. Much of the anticipated growth is expected to occur in western Pulaski County and other suburban areas, requiring continued investment in roadway capacity, utilities, schools, and public services. At the same time, redevelopment and infill opportunities within established urban areas, particularly near downtown Little Rock and existing activity centers, will make use of existing infrastructure and reduce pressure for outward expansion.
Fair
146
Poor
1
Total Bridges
344
Maintaining mobility will remain a key challenge as population and employment continue to increase. Several major corridors already experience recurring congestion and reduced travel time reliablity during peak periods. Sections of major roadways such as Interstate 30, Interstate 40, State Highway 10, 100, and 107 face potential capacity issues. Additional growth in and around the county will put further demand on the county’s roadway network. These problems might be solved with context-sensitive roadway improvements. Part of the answer lies in improving transit accessibility and enhancing bicyce and pedestrian connections. Protecting freight mobility while accommodating residential and commercial development will require coordinated land use and transportation planning. As development continues, investments that support strategic redevelopment and resilient infrastructure will help ensure that Pulaski County remains a competitive, connected, and livable regional center.
Table 3: Condition of Bridges in Pulaski County
Report Limitations Current data, including traffic counts, travel speeds, travel time reliability, and infrastructure condition were taken from available federal, state and regional databases. These databases do not include all public roadways. Local, city and county databases will be incorporated into future editions of the report.
Transportation Improvements While no specific recommendations are made in this report, this information can assist in the planning of transportation improvements that help make Pulaski County’s transportation system safer, more reliable, and more efficient.
Strategic public investment in transportation will position Pulaski County to accommodate future population and economic growth by expanding roadway and intersection capacity, creating new routing options, and increasing travel choices. A well-connected and adaptable transportation system will support continued investment, development, and quality of life for residents and businesses. The Pulaski County Transportation Report provides information on population growth and land use to help plan these future infrastructure investments.
Congested Arterial Roads in Pulaski County These roads are designed for speeds of 45 mph or greater. However, the segments highlighted below operate at speeds less than 35 mph during periods of congestion.
Route
From
To
Mileage Hours per Day
Chenal Pkwy
Kanis W
Kanis E
0.44
12.9
Chenal Pkwy
Kanis W
Rahling
0.81
13.0
Chenal Pkwy
Kanis E
Kanis W
0.43
13.5
Chenal Pkwy
Rahling
Kanis W
0.81
12.7
Hwy 10
Taylor Loop E
I-430
2.79
9.5
Hwy 100 (Maumelle Blvd)
Odom N
Odom S
1.74
9.1
Hwy 100 (Maumelle Blvd)
Hwy 365
Odom N
1.01
8.8
Hwy 100 (Maumelle Blvd)
Odom N
Hwy 365
1.01
8.0
Hwy 10
I-430
Taylor Loop E
2.7
6.1
Hwy 10
Taylor Loop W
Taylor Loop E
0.98
5.0
Table 4: Top Higher Speed Arterial Segments, Speed Less Than 35 MPH
Congested Freeways in Pulaski County These freeways are designed for speeds of 60 mph or greater. However, the segments highlighted below operate at speeds less than 45 mph during periods of congestion.
Route
From
To
Mileage
Hours per Day
I-430 Ramp
I-430 S
I-30 E
0.5
8.2
I-630 Ramp
I-630
I-30 E
0.6
4.5
I-630
I-630/I430 N Ramp
Financial Ctr
0.33
2.4
I-30W
I-430 N Ramp
2800 feet E of Co Line 2.54
2.2
I-30E
6th St
Broadway NLR
0.79
2.3
I-30E
I-630
6th St
0.25
1.9
I-630E
Spring St
I-30Ramps
0.68
1.5
I-30W
I-40 WB
UP Railroad
1.14
1.5
I-30E
1660 feet W of Co Line
Otter Creek South
2.35
1.5
I-30W/I-40E
Hwy 107
I-30 Merge
0.66
1.5
Table 5: Top Freeway Segments, Speed Less than 45 MPH
Table of Maps Demographics & Development Factors
Safety
Map 1: Population Change 2010 to 2020
Map 17: Crashes Occurred from 2021–2024 & High Injury Network
Map 2: Population Distribution
•
Map 17a: Crashes Occurred from 2021–2024 & High Injury Streets in Urban Pulaski County
•
Map 17b: Crashes Occurred from 2021–2024 & High Injury Streets in Core Pulaski County
This group of maps highlights how population trends and development patterns have evolved across Pulaski County. Together, they show where people live and work, how growth is expected to change over time, and how land use and physical constraints influence where future development can occur.
•
Map 2a: Population Distribuion in Urban Pulaski County
Map 3: Population Change Observed between 2020 to 2024 Map 4: No Vehicle Households
This group of maps highlights where crashes occur in Pulaski County, with a focus on high-injury streets and non-motorized safety. Together, they identify corridors where targeted safety improvements could reduce crash severity and improve outcomes for all users. Please refer to the Central Arkansas Safety Action Plan for further information.
Map 18: Non-Motorized Crashes Occurred from 2020–2024 & High Injury Network
Map 5: Employment
•
Map 18a: Non-Motorized Crashes Occurred from 2020–2024 & High Injury Streets in Urban Pulaski County
•
•
Map 18b: Non-Motorized Crashes Occurred from 2020–2024 & High Injury Streets in Core Pulaski County
Map 5a: Employment in Urban Pulaski County
Map 6: Development Constraints •
Map 6a: Developmet Constraints in Urban Pluaski County
•
Map 6b: Development Constraints in Core Pulaski County
Map 7: Land Use (2023) •
Map 7a: Land Use in Urban Pulaski County
•
Map 7b: Land Use in Core Pulaski County
Traffic Congestion & Volume This set of maps shows where traffic demand is highest in Pulaski County and where congestion occurs today and in the future. Together, they highlight key corridors and roadway segments where improvements could enhance traffic flow and travel reliability.
Map 19: 2024 Average Daily Traffic • Map 19a: 2024 Average Daily Traffic in Urban Pulaski County
These maps showcase the daily traffic recorded by the traffic counters placed by ARDOT in 2024.
•
Map 20a: Five Year Traffic Growth Trend for Urban Pulaski County
•
Map 21a: Traffic Volume 2015/2050 Comparison in Urban Pulaski County
Transportation Infrastructure
This group of maps provides an overview of Pulaski County’s transportation infrastructure, showing how the roadway network is organized, who maintains it, and how it functions today. Together, the maps highlight existing conditions and gaps in connectivity that can inform maintenance priorities and future transportation planning.
Map 8: Roadway Administrative System
The map shows who is responsible for the network of roads; State, County, or City.
Map 9: Roadway Functional Classification •
Map 9a: Roadway Functional Classification in Urban Pulaski County
•
Map 9b: Roadway Functional Classification in Core Pulaski County
Map 10: Master Street Plans of Cities •
Map 10a: Master Street Plan of Cities in Urban Pulaski County
•
Map 10b: Master Street Plans of Cities in Core Pulaski County
Map 11: Condition of Locally Owned Bridges •
Map 11a: Condition of Locally Owned Bridges in Urban Pualski County
•
Map 11b: Condition of Locally Owned Bridges in Core Pulaski County
Map 12: Condition of State-Owned Bridges •
Map 12a: Condition of State-Owned Bridges in Urban Pulaski County
•
Map 12b: Condition of State-Owned Bridges in Core Pulaski County
These maps reflect the change in traffic count recorded between 2019 and 2026. The map estimates the growth in traffic volume between 2015 and 2050.
Map 22: Maximum Volume to Capacity (V/C) Ratio in Morning (AM), 2015 Map 23: Maximum Volume to Capacity (V/C) Ratio in Evening (PM), 2015
These maps show road segments that are nearing or exceeding their traffic capacity, thus causing congestion.
Map 24: Estimated Maximum Volume to Capacity (V/C) Ratio in Morning (AM), 2050. Map 25: Estimated Maximum Volume to Capacity (V/C) Ratio in Evening (PM), 2050.
These maps predict road segments that will be nearing or exceeding their traffic capacity, thus causing congestion.
Map 26: Level of Service
This map interprets the flow of traffic on streets.
Map 27: Average Peak Hour Speed in Morning (AM) •
Map 27a: Average Peak Hour Speed in Morning (AM) in Urban Pulaski County
Map 28: Average Peak Hour Speed in Evening (PM) •
Map 28a: Average Peak Hour Speed in Evening (PM) in Urban Pulaski County
Map 29: Congestion Management Process Lower Speed Arterials Map 30: Congestion Management Process Higher Speed Arterials Map 31: Congestion Management Process Freeways
Please refer to the Congestion Management Report for additional information
The map highlights the roads according to the number of travel lanes.
Map 32: Level of Travel Time Reliability (LOTTR) • Map 32a: Level of Travel Time Reliability (LOTTR) in Urban Pulaski County
Map 14: Traffic Control Signals
Freight Movement and Access
Map 13: Number of Through Lanes
•
Map 14a: Traffic Control Signals in Urban Pulaski County
•
Map 14b: Traffic Control Signlas in Core Pulaski County
Map 15: Pavement Condition (2021) Map 16: Existing and Planned Pedestrian and Bike Facilities The map does not show sidewalks.
•
Map 16a: Existing and Planned Pedestrian and Bike Facilities in Urban Pulaski County
•
Map 16b: Existing and Planned Pedestrian and Bike Facilities in Core Pulaski County
This map shows how consistently travelers can reach their destinations on time on major roadways.
This group of maps highlights how freight moves through Pulaski County and how the region connects to the broader freight and multimodal network. Together, they identify key freight corridors, access to multimodal facilities, and the reliability of truck travel that supports economic activity and regional connectivity.
Map 33: State Freight Plan and Multimodal Facilities Map 34: Interstate Truck Travel Time Reliability (TTTR)
This map shows how consistently trucks can travel on interstates and major roadways without unexpected delays
Map 35: Freight Percentage Table of maps Continues on the next spread
Transportation Improvement Program (TIP) Projects
This section of maps highlights planned transportation investments. Together, they show where transit is currently available and how future projects and strategic connections can improve access, mobility, and system connectivity.
Map 36: Rail Crossings and Grade Separations Map 37: Transportation Improvement Projects Slated for 2025–2028 Map 38: Transit Service •
Map 39a: Probable Strategic Connection in Urban Pulaski County
•
Map 40a: Future Capacity Concerns in Urban Pulaski County
Sources This report includes data from a variety of sources. The data used to draft maps is mentioned in each legend. Additional information can be found at:
•
2025-2025 Transportation Improvement Program: https://metroplan.org/wp-content/ uploads/2025/08/TIP-2025-2028-FINAL-Adopted.pdf
•
ARDOT data on crashes, bridges. Speed limits, etc.: https://gis.ardot.gov/portal/apps/ dashboards/3ae35f942fa340888abd27f26d405558
•
Central Arkansas Safety Action Plan: https://metroplan.org/central-arkansas-safety-actionplan/
•
Commuting Data: https://ctppdata.transportation.org/?utm_source=dlvr.it#/index
•
Congestion Management Process (CMP) 2025: https://metroplan.org/congestion-managementprocess-2025-cmp/
•
Crashes and Safety: https://metroplan.org/central-arkansas-safety-action-plan/
•
Historical Information on Pulaski County: https://encyclopediaofarkansas.net/entries/pulaskicounty-409/
•
Historical Information on Pulaski County School District: https://www.arkansasonline.com/ news/2026/may/22/with-pulaski-county-schools-declared-desegregated-sherwood-eyesexit-from-district/
•
Information on Rock Region Metro: https://rrmetro.org/
•
Traffic Counts: https://ardot.gov/divisions/tsmo/traffic-information-systems/maps
•
Population Forecasts: https://metroplan.org/research-center/regional-demographics
•
Metropolitan Transportation Plan: https://metroplan.org/transportation/long-rangemetropolitan-transportation-plan-mtp/
•
Metroplan Congestion Management Process: https://metroplan.org/congestion-managementprocess-2025-cmp/
Metroplan is a voluntary association of local governments that has operated by interlocal agreement since 1955. Originally formed as the Metropolitan Area Planning Commission of Pulaski County, Metroplan now has members in five counties of the sixcounty metro area. Metroplan is the designated metropolitan planning organization (MPO) under Title 23 of the United States Code. Metroplan serves as the regional voice on issues affecting Central Arkansas, develops transportation plans required by federal law, convenes stakeholders to deal with common issues, and provides information and staff resources to our member local governments, the business community, and the public. The Central Arkansas Regional Transportation Study, or CARTS, is the cooperative effort by the participating communities, transportation providers and many other interested parties to develop a long-range transportation plan for the metropolitan area.
DISCLAIMER This report was funded in part through grants from the Federal Highway Administration and Federal Transit Administration, U.S. Department of Transportation. The views and opinions of the authors expressed herein do not necessarily state or reflect those of the U.S. Department of Transportation. NOTICE OF NONDISCRIMINATION Metroplan complies with all civil rights provisions of federal statutes and related authorities that prohibit discrimination in programs and activities receiving federal financial assistance. Therefore, Metroplan does not discriminate on the basis of race, sex, color, age, national origin, religion or disability, in the admission, access to and treatment in Metroplan’s programs and activities, as well as Metroplan’s hiring or employment practices. Complaints of alleged discrimination and inquiries regarding nondiscrimination policies may be directed to Sydney Dozier, ADA/504/Title VI Coordinator, 501 West Markham Street, Suite B, Little Rock, AR 72201, (501) 372-3300, or the following e-mail address: sdozier@metroplan.org. (Hearing impaired may dial 711.)