Lonoke County Transportation Report
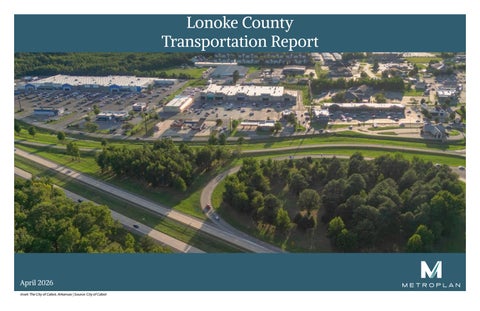
April 2026 Inset: The City of Cabot, Arkansas | Source: City of Cabot
Table of Contents ABSTRACT LONOKE COUNTY HISTORY CURRENT GROWTH TRENDS TRANSPORTATION FORECASTED DEVELOPMENT CHALLENGES REPORT LIMITATIONS
Lonoke County Transportation Report Abstract This report was developed by Metroplan to inform regional development and transportation plans. This report is intended to provide decision makers within Lonoke County and its cities and towns with information to guide the development of transportation projects. The report provides data associated with safety, congestion, demographics, infrastructure condition, and current transportation projects. The report largely focuses on existing conditions but also examines past trends as well as projected future conditions.
Lonoke ounty P opulation1960 1960-2020 LonokeCCounty Population - 2020 Decennial Census Decennial Census
80,000
74,015 68,356
70,000
TRANSPORTATION IMPROVEMENTS
60,000
Lonoke County History
52,828
50,000
TABLE OF MAPS
40,000 30,000
34,518 24,551
26,249
1960
1970
39,268
20,000
SOURCES
10,000 0
MAPS
1980
1990
2000
2010
2020
Figure 1: County Population Statistics 1960-2020
Lonoke County Population Statistics (See Figure 1, Figure 2, Figure 3) • • • •
Image 1: Lonoke County on the map of Arkansas
Population estimated for 2025 is 76,874 Population has grown approximately 3.2% from 2020 to 2024. County population grew 40% between 2000 to 2020. 65% (21,905 people) of the county’s working population commutes to other counties for work.
Lonoke County was founded as an Arkansas county in 1873 and is largely within the Grand Prairie subregion of the Mississippi Alluvial Plain. Lonoke County has a variety of transportation options including, but not limited to, I-40 and I-57. Due to its location, Lonoke County has long attracted farmers of all kinds to its fertile soils and access to good transportation. These factors have historically been the primary drivers of the county’s economy and have led to the growth of many communities including, Lonoke, Carlisle, and England. In recent decades, Northwest Lonoke County has seen significant growth, surpassing the population of communities that have historically been driven by agricultural economics. This growth has been driven by the accessibility to US 67/157 (now I-57), which provides efficient connections to key employnment centers, including the Little Rock Air Force Base, and jobs throughout Pulaski County. Lonoke County is also home to Plum Bayou Mounds Archeological State Park which preserves Native American ceremonial mounds, and acts as an educational area for many students and schools around the state.
Current Growth Trends In the period from 2020 to 2025 Lonoke County, grew by 0.7% annually. However, net population growth in Lonoke County is slowing from the higher growth rates experienced in the two decades pre 2020 which saw Lonoke County add over 20,000 new residents. Lonoke County is now on pace to add 5,000 new residents in the period between 2020 and 2030. Among Central Arkansas counties, Lonoke County is growing more rapidly than Pulaski County, but a lower pace than Faulkner and Saline Counties. Metroplan forecasts Lonoke County’s population to grow to 96,942 in 2050 (See figure 2). Lonoke County’s population growth has been concentrated in the northwestern portion of the county, along the I-57 (US 67) corridor. The cities of Cabot, Austin and Ward have experienced significant growth in recent years while much of the remainder has seen slight population loss especially in the southern portion of the county. Northwest Lonoke County’s accessibility to employment centers combined with access to a desirable school district has led to significant growth. Less growth has been attracted to the Interstate 40 corridor despite similar accessibility to Pulaski County employment centers. This is in part due to the intensive agricultural uses that predominate most of Lonoke County outside of the Northwestern part of the county.
% of Workforce Employed Outside County of Residence % of Workforce Employed Outside County of Residence CTPP 2017-2021 | ACSACS Five-Year Sample Data CTPP 2017-2021, - Five-Year Sample Data
80% 70%
65%
60%
67% 57%
55%
50% 40%
35%
30% 20% 7%
10% 0%
Faulkner
Grant
Lonoke
Perry
Pulaski
Saline
Figure 3: Workforce Commuter Flow Statistic
The chart above depicts the share of emplyed county residents who commute to jobs in other counties. As the chart shows, 65% of Lonoke County workers work in jobs beyond county lines, mainly in Pulaski County.
Metroplan ’s Lonoke County Population Lonoke County Population 1980-2020 With Metroplan Forecast to 2050 Forecast to 2050 120,000 100,000 80,000 60,000 40,000 20,000 0
1980 1985 1990 1995 2000 2005 2010 2015 2020 2025 2030 2035 2040 2045 2050 Lonoke
Lonoke Forecast
Figure 2: Lonoke County Population Projection to 2050
Transportation
Transportation Cont. Transportation Projects
Completed Projects • 2007: Highway 5 widening US 67 to Highway 89 • 2015: Lonoke Highway 89 Interchange • 2019 US 67/167 widening Pu. Co. line to Highway 5 • 2019: Highway 38 Interchange and realignment • 2022: Highway 321 widening • 2024: US 67/167 designated as I-57 • Highway 5 Widening to Greystone (nearing completion)
Lonoke County faces diverse transportation challenges. In higher-growth areas new capacity will be needed into the foreseeable future. In other parts of the county, the main challenge will be financing the maintenance of good-quality transportation infrastructure.
Proposed OR In Design Phase Projects • Interchange Reconfigurations * Highway 5 and Highway 89 • Kerr Station Rd Downtown Cabot to Highway 321 Roadway
Continued population growth in Northwest Lonoke County, combined with high commuting rates to Pulaski County, could begin to impact travel time reliability on Interstate 57. However, planned improvements should increase capacity on Interstate 57 and at the Highway 5 and Highway 89 interchanges in the relatively near term. This will allow a continued high level of service for Interstate 57 through Lonoke County. Accessibility to Interstate 57 from Cabot, Austin, and Ward will also be impacted by continued growth.
Ped/Bike Projects
The Highway 89 and Highway 5 interchanges have faced accessibility challenges. Both projects are now in the construction phase to enhance connectivity. The interchange serving Highways 5, 321, and 367, poses design challenges due to the close proximity with Interstate 57 ramps. Additionally, Cabot’s Highway 89 corridor has an average daily traffic of 20,000 which is approaching its capacity. The addition of a new Highway 38 interchange does provide an alternative route to access I-57 and may temporarily forestall the need for capacity improvements to Highway 89. Additional challenges within the county include capacity considerations on I-40, which experiences some of the highest truck percentages in the Central Arkansas region. Listed on the next page are some of the most important transportation projects in Lonoke County planned or under construction in the last 20 years.
Completed OR Under Construction Projects • Ward Safe Routes to School project * Ward Peyton St. (Hwy 319) Sidewalk * Ward Wilson Loop Sidewalks • Cabot Elm and Main Sidepath project • Cabot Main Street Streetscaping and Sidewalks Proposed or In Design Phase Projects • Cabot Regional Greenway: * Highway 38 to Cabot High School (starting construction soon) * Cabot High School to Kerr Station Rd * Kerr Station Rd Downtown Cabot to Highway 321 • Austin Regional Greenway: * Austin City Park to Highway 38 (starting construction soon)
Image 1: Lonoke County Courthouse | Source : American Courthouses: A photo archive by John Deacon
Forecasted Development Challenges Future development is forecast to continue to concentrate in northwestern Lonoke County, posing ongoing transprtation challenges for Cabot, Sutin, and Ward. Traffic congestion and delays are growing concerns along State Highways 5, 89, and 321, especially in the northwestern part of the county. US Highways 165 and 70 have seen little growth over historic counts. Traffic volumes are also increasing on Interstate 57, while high volume of freight movement along Interstate 40 adds pressure to the region’s transportation network. The future challenge will be to balance the need to maintain good quality infrasturcture in low -growth areas while adding capacity to meet the need in faster-growing areas.
Report Limitations Current data, including traffic counts, travel speeds, travel time reliability, and infrastructure condition were taken from available federal, state and regional databases. These databases do not include all public roadways. Local, city and county databases will be incorporated into future editions of the report.
Transportation Improvements While no specific recommendations are made in this report, this information can assist in the planning of transportation improvements that help make Lonoke County’s transportation system safer, more reliable, and more efficient.
Strategic public investment in transportation will position Lonoke County to accommodate future population and economic growth by expanding roadway and intersection capacity, creating new routing options, and increasing travel choices. A well-connected and adaptable transportation system will support continued investment, development, and quality of life for residents and businesses. The Lonoke County Transportation Report provides information on population growth and land use to help plan these future infrastructure investments.
Table of Maps Demographics & Development Factors
This group of maps highlights how population trends and development patterns have evolved across Lonoke County. Together, they show where people live and work, how growth is expected to change over time, and how land use and physical constraints influence where future development can occur.
Map 1: Population Change 2010 to 2020 Map 2: Population Distribution Map 3: Projected Population Change 2015 to 2050 Map 4: No Vehicle Households Map 5: Employment Map 6: Development Constraints Map 7: Land Use (2023) •
Map 7a: Land Use, Austin | Cabot | Ward
Transportation Infrastructure
This group of maps provides an overview of Lonoke County’s transportation infrastructure, showing how the roadway network is organized, who maintains it, and how it functions today. Together, the maps highlight existing conditions and gaps in connectivity that can inform maintenance priorities and future transportation planning.
Map 8: Roadway Administrative System
The map shows who is responsible for the network of roads; State, County, or City.
Map 9: Roadway Functional Classification •
Map 9a: Roadway Functional Classification in Austin | Cabot | Ward
Map 10: Master Street Plans of Cities •
Map 10a: Master Street Plan of Austin | Cabot | Ward
Traffic Congestion & Volume This set of maps shows where traffic demand is highest in Lonoke County and where congestion occurs today and in the future. Together, they highlight key corridors and roadway segments where improvements could enhance traffic flow and travel reliability.
Map 19: 2024 Average Daily Traffic • Map 19a: 2024 Average Daily Traffic in Austin | Cabot | Ward
These maps showcase the daily traffic recorded by the traffic counters placed by ARDOT in 2024.
Map 20: Five Year Traffic Growth Trend • Map 20a: Five Year Traffic Growth Trend for Austin | Cabot | Ward
These maps reflect the change in traffic count recorded between 2019 and 2024.
Map 21: Traffic Volume 2015/2050 Comparison
The map estimates the growth in traffic volume between 2015 and 2050.
Map 22: Maximum Volume to Capacity (V/C) Ratio in Morning (AM), 2015 Map 23: Maximum Volume to Capacity (V/C) Ratio in Evening (PM), 2015
These maps show road segments that are nearing or exceeding their traffic capacity, thus causing congestion.
Map 24: Estimated Maximum Volume to Capacity (V/C) Ratio in Morning (AM), 2050. Map 25: Estimated Maximum Volume to Capacity (V/C) Ratio in Evening (PM), 2050.
These maps predict road segments that will be nearing or exceeding their traffic capacity, thus causing congestion.
Map 26: Level of Service
This map interprets the flow of traffic on streets.
Map 27: Average Peak Hour Speed in Morning (AM) Map 28: Average Peak Hour Speed in Evening (PM) Map 29: Congestion Management Process Lower Speed Arterials Map 30: Congestion Management Process Higher Speed Arterials Map 31: Congestion Management Process Freeways
Map 11: Condition of Locally Owned Bridges
Please refer to the Congestion Management Report for additional information
•
Map 32: Level of Travel Time Reliability (LOTTR)
Map 11a: Condition of Locally Owned Bridges in Austin | Cabot | Ward
Map 12: Condition of State-Owned Bridges •
Map 12a: Condition of State-Owned Bridges in Austin | Cabot | Ward
This map shows how consistently travelers can reach their destinations on time on major roadways.
Freight Movement and Access
Map 13: Number of Through Lanes
The map highlights the roads according to the number of travel lanes.
This group of maps highlights how freight moves through Lonoke County and how the region connects to the broader freight and multimodal network. Together, they identify key freight corridors, access to multimodal facilities, and the reliability of truck travel that supports economic activity and regional connectivity.
Map 14: Traffic Control Signals
Map 33: State Freight Plan and Multi-modal Facilities
Map 15: Pavement Condition (2021)
Map 34: Interstate Truck Travel Time Reliability (TTTR)
Map 16: Existing and Planned Pedestrian and Bike Facilities
This map shows how consistently trucks can travel on interstates and major roadways without unexpected delays
The map does not show sidewalks.
Map 35: Freight Percentage
•
Transportation Improvement Program (TIP) Projects
Map 16a: Existing and Planned Pedestrian and Bike Facilities in Austin | Cabot | Ward
Safety
This group of maps highlights where crashes occur in Lonoke County, with a focus on high-injury streets and non-motorized safety. Together, they identify corridors where targeted safety improvements could reduce crash severity and improve outcomes for all users. Please refer to the Central Arkansas Safety Action Plan for further information.
Map 17: Crashes Occurred from 2021–2024 & High Injury Network •
Map 17a: Crashes Occurred from 2021–2024 & High Injury Streets in Austin | Cabot | Ward
Map 18: Non-Motorized Crashes Occurred from 2020–2024 & High Injury Network •
Map 18a: Non-Motorized Crashes Occurred from 2020–2024 & High Injury Streets in Austin | Cabot | Ward
This section of maps highlights planned transportation investments. Together, they show where transit is currently available and how future projects and strategic connections can improve access, mobility, and system connectivity.
Map 36: Transportation Improvement Projects Slated for 2025-2028 Map 37: Strategic Connections Map 38: Future Capacity Concerns
Sources This report includes data from a variety of sources. The data used to draft maps is mentioned in each legend. Additional information can be found at:
•
2025-2025 Transportation Improvement Program: https://metroplan.org/wp-content/ uploads/2025/08/TIP-2025-2028-FINAL-Adopted.pdf
•
ARDOT data on crashes, bridges. Speed limits, etc.: https://gis.ardot.gov/portal/apps/ dashboards/3ae35f942fa340888abd27f26d405558
•
Central Arkansas Safety Action Plan: https://metroplan.org/central-arkansas-safety-actionplan/
•
Commuting Data: https://ctppdata.transportation.org/?utm_source=dlvr.it#/index
•
Congestion Management Process (CMP) 2025: https://metroplan.org/congestion-managementprocess-2025-cmp/
•
Crashes and Safety: https://metroplan.org/central-arkansas-safety-action-plan/
•
Historical Information on Lonoke County: https://encyclopediaofarkansas.net/entries/lonokecounty-787/
•
Traffic Counts: https://ardot.gov/divisions/tsmo/traffic-information-systems/maps
•
Population Forecasts: https://metroplan.org/research-center/regional-demographics
•
Metropolitan Transportation Plan: https://metroplan.org/transportation/long-rangemetropolitan-transportation-plan-mtp/
•
Metroplan Congestion Management Process: https://metroplan.org/congestion-managementprocess-2025-cmp/
Metroplan is a voluntary association of local governments that has operated by interlocal agreement since 1955. Originally formed as the Metropolitan Area Planning Commission of Pulaski County, Metroplan now has members in five counties of the sixcounty metro area. Metroplan is the designated metropolitan planning organization (MPO) under Title 23 of the United States Code. Metroplan serves as the regional voice on issues affecting Central Arkansas, develops transportation plans required by federal law, convenes stakeholders to deal with common issues, and provides information and staff resources to our member local governments, the business community, and the public. The Central Arkansas Regional Transportation Study, or CARTS, is the cooperative effort by the participating communities, transportation providers and many other interested parties to develop a long-range transportation plan for the metropolitan area.
DISCLAIMER This report was funded in part through grants from the Federal Highway Administration and Federal Transit Administration, U.S. Department of Transportation. The views and opinions of the authors expressed herein do not necessarily state or reflect those of the U.S. Department of Transportation. NOTICE OF NONDISCRIMINATION Metroplan complies with all civil rights provisions of federal statutes and related authorities that prohibit discrimination in programs and activities receiving federal financial assistance. Therefore, Metroplan does not discriminate on the basis of race, sex, color, age, national origin, religion or disability, in the admission, access to and treatment in Metroplan’s programs and activities, as well as Metroplan’s hiring or employment practices. Complaints of alleged discrimination and inquiries regarding nondiscrimination policies may be directed to Sydney Dozier, ADA/504/Title VI Coordinator, 501 West Markham Street, Suite B, Little Rock, AR 72201, (501) 372-3300, or the following e-mail address: sdozier@metroplan.org. (Hearing impaired may dial 711.)
Map 1. Population Change 2010 to 2020 5
319
Census Tracts Percent Change
Less than -10% -10% to 0% 0% to 10% 10% to 25% Greater than 25%
Ward
§ ¥ , 57
305 319
Source: Census 2010 and 2020
Austin
89
38
5
31
321
0
Cabot
1
² 2
3
4
Miles
321
236
89
236
13
294
89
31
Carlisle
Lonoke
70 £ ¤ 70 £ ¤
31 381
15
Keo 232
13
161
Humnoke
£ ¤ 165
England
Coy 15
Allport
31
256
Population change is calculated at the census tract level. Population totals are from the 2010 and 2020 Decennial Censuses.
Map 2. Population Distribution
! ! ! ! ! !! ! ! ! ! ! ! ! ! ! !! ! ! !!! !! ! !! 5 ! ! ! !! 319 ! !! ! !! ! ! ! ! ! ! ! ! !!! ! ! ! ! ! !!! !!! ! ! ! !! ! ! ! ! ! ! ! !! !! ! !!! !! ! !! ! ! ! ! ! ! ! ! ! !! ! ! ! ! ! ! ! ! !!! !!! !! ! ! !! ! ! ! !!!!! ! ! ! ! !! ! ! ! !!! ! ! ! ! ! !! ! ! !!! ! ! ! ! !! !! !! ! ! ! ! ! ! ! ! !! ! ! ! ! ! ! ! ! ! ! !! ! ! ! !! ! ! ! ! ! ! !!! ! !!!! !!! !! ! !! !!! ! ! !! !! ! !!! !! ! !!! !! !! ! ! ! ! ! !!!! ! !! ! ! ! ! ! !! ! ! ! ! ! !! ! !! !!! !!! ! ! ! ! !! !! ! !!! !! ! ! !!! ! ! ! ! ! ! ! ! ! ! ! !!!! ! ! !!! ! ! ! !! ! ! ! ! ! !!! !!!!!!! ! ! ! ! ! ! ! ! !! ! ! !! ! ! ! ! ! ! ! !! ! !!!! ! !! ! !! ! !! ! !! !! ! ! ! ! ! ! !! ! !! ! !! !!!! ! ! !! !! ! ! !!!! ! !! ! ! !! !! ! ! ! ! ! ! ! !! ! !! ! ! ! ! !! ! ! ! ! ! !! !! ! ! !! !! ! ! ! ! !!!! ! ! ! ! ! ! ! ! ! ! !!!!! !! !!! ! ! !! ! !! ! !! !!! ! ! ! ! ! ! ! ! ! ! ! ! ! ! ! ! ! ! ! ! ! ! ! ! ! ! ! ! ! ! ! ! ! ! ! ! ! ! ! ! ! ! ! ! ! ! ! !! !!!!! ! !! ! ! !! ! ! ! ! !! ! !! !! !! !! ! ! ! !! !! !!!! !!! ! ! ! ! ! !! ! ! ! ! ! ! ! ! ! !! ! !!! ! ! !!! ! ! ! ! !! !! ! ! !! ! ! ! ! ! ! ! ! ! ! ! ! ! ! !! ! ! ! ! ! !! ! ! ! !!!! !! !! ! ! ! !! ! ! !!! ! ! ! ! !! !! ! ! ! ! ! ! ! ! ! ! ! ! ! ! ! ! ! ! ! ! ! ! ! ! ! ! ! ! ! ! ! ! ! ! ! ! ! Ward ! ! ! ! ! ! ! ! ! ! ! ! ! !! !!!!!! ! !!!!!!! ! ! !! !!! !! !! ! ! ! ! ! ! ! !! !! ! ! ! ! ! ! ! ! ! ! ! ! ! ! ! ! ! ! ! ! ! ! ! !! ! ! ! ! ! ! ! ! ! ! ! ! ! ! ! ! ! ! ! ! ! ! ! ! ! ! ! !! !!! ! ! ! !! !!! !! ! !!! ! !!!!! !! ! ! ! ! ! !!! ! !! !! !!!! !!!! ! ! ! ! ! !! ! ! !! ! ! ! ! ! ! ! ! ! !!! ! ! !! ! !! !! ! ! ! ! ! ! ! ! ! ! ! ! ! ! ! ! ! !! ! ! !! ! ! ! ! !! ! ! ! ! !!! !! ! !!!! !! ! ! ! ! ! ! ! ! ! ! ! ! ! ! ! ! ! !! ! !! ! ! ! !!! ! !! !! !!! !! !! ! ! ! ! ! ! One Dot = 10 People ! ! ! !! !! !!! !! !! ! ! ! !! ! ! ! !!! !!! ! ! ! !! !! ! ! ! !! ! ! ! !! ! ! ! !! !! ! ! ! !! ! ! ! ! ! ! ! ! ! ! ! ! ! ! ! !!! !!! ! ! !! ! ! ! !!!! !!! !! !! ! ! !! ! ! ! ! ! ! ! ! ! ! ! ! ! ! ! ! !! !! ! ! ! ! ! ! ! ! !!! !!! ! !! ! ! ! ! !! ! !!!! ! ! ! !! ! !!!! ! ! !!!!! ! ! ! ! !! ! !! !!!! !! !! ! ! 305! !!! ! ! ! ! !! ! !! !! ! ! ! !!! !!! ! ! ! !!! !! !! !!! ! ! !! ! ! ! ! !!!!! !!! ! ! ! !! !! !! !!! 57 !! !! ! ! ! ! ! ! ! !! ! !! ! ! ! !! ! ! !!!!! ! ! ! ! ! ! ! ! ! ! ! ! ! !! ! !! ! ! ! ! !! !! !! ! ! ! ! !! ! ! ! ! ! ! ! ! ! ! 319 !! !!! !! ! ! ! ! ! ! ! ! ! ! ! ! ! ! ! ! ! ! ! ! ! ! ! ! ! ! ! !! ! ! ! ! ! ! ! ! ! ! ! ! ! ! ! ! ! ! ! !! ! ! ! ! !! !!!!!! !! !! !! !!! !! !! ! ! ! ! ! !! !!! ! ! ! ! ! ! ! ! ! ! ! ! ! ! ! ! ! ! ! ! ! ! ! ! ! ! ! ! ! ! !!! !! ! !! ! !! !! !! !!! ! ! !! ! !! ! !! !!!!! !! !!! ! !! !! !!! ! !! !! ! !! ! ! !!! !!!!!!! ! ! ! ! !! ! ! !!! ! ! !!!! !! ! ! ! ! Source: 2020 Decennial Census ! !! ! !! !! ! ! !! ! ! !!! ! !! ! ! ! ! !! ! ! !! ! ! !! ! ! !!! ! !!! ! ! ! !!! ! ! ! !! ! ! ! !! !!!!! ! ! ! ! ! ! ! ! ! !! !! !! ! ! ! ! ! ! ! !! !! ! ! ! ! ! ! ! !! ! !! ! !! ! !! !! ! ! ! !! ! !! ! ! ! ! ! ! ! ! ! ! ! ! ! ! ! ! ! ! ! ! ! ! ! ! ! ! ! ! ! ! ! ! ! ! ! ! ! ! ! ! ! ! ! ! ! ! ! ! ! ! ! ! ! ! ! ! ! ! ! ! !!!! ! !! ! !! ! !! ! !! !! ! ! !!! ! !!! ! ! ! ! Austin !! !!! !!! !! !! !!!!! !!! ! ! ! ! ! ! ! ! ! ! ! ! ! !! ! !! ! !! ! ! !! ! ! ! ! ! ! ! !!! ! ! ! ! ! ! ! ! !! ! ! !! ! ! ! ! !! ! ! 38 ! !! ! ! ! ! ! !! !! ! ! ! ! ! !!! ! ! ! ! !! !! ! ! ! !!! !! !! ! ! ! ! ! ! ! ! ! ! ! ! ! ! ! ! ! ! ! ! ! ! ! ! ! ! ! ! ! ! ! ! ! ! ! ! ! ! ! ! ! ! ! ! ! ! ! ! ! ! ! ! ! ! ! ! ! ! ! ! ! ! ! ! ! ! ! ! ! !! ! ! ! ! ! ! ! ! ! !! !! ! ! !! ! ! ! 89!!! ! ! !!!! ! ! !! !! !!! !! ! ! ! !!! ! !! ! ! ! !!! ! ! !! ! ! ! ! !!!! ! ! ! ! !! ! ! ! ! ! ! ! ! !! ! !! ! ! ! ! ! ! ! ! ! ! ! ! ! ! !! ! !! ! ! ! !! ! !! ! !!!! !! ! !! ! !!! ! ! ! !! !! ! ! ! !!! ! ! ! ! !! !!! ! ! ! ! !! ! ! !! ! ! ! ! ! ! ! ! ! !!! ! ! !!!! ! ! !! ! ! ! ! ! ! ! ! ! ! !! !! !!!!! ! ! ! ! ! ! ! !!!! ! ! !!!!! ! !!! ! !! ! !!! ! ! ! ! ! ! ! !! !! ! ! ! ! ! ! ! ! ! ! !! ! !! !!! !! ! !! ! ! ! !!! ! ! ! ! ! !! ! !!! ! ! ! !!!!! ! ! !! ! ! ! ! ! ! ! ! ! ! ! ! ! ! ! ! ! ! ! ! ! ! ! ! ! ! ! ! ! ! ! ! ! ! ! ! ! ! ! ! ! ! ! ! ! ! ! ! ! ! ! ! ! !! ! ! ! ! ! !! ! !! ! ! !! ! ! ! ! ! ! ! !! !! !! ! !31! ! ! ! ! !! ! !! ! ! ! !! ! !!!!! !!!! ! 5 ! !! ! ! ! !! !! ! ! ! ! !! !! ! ! ! ! !! ! ! ! ! ! ! ! ! ! ! !!! !! ! ! ! ! ! !!!!! ! ! ! ! ! ! ! ! ! ! ! ! ! ! ! ! ! ! ! ! ! ! ! ! ! ! ! ! ! ! ! ! ! ! ! ! ! ! ! ! ! ! !!! ! ! ! ! ! ! 321 ! ! ! ! ! ! !! !!! ! ! !! ! ! !! ! !! !! ! ! ! !! !!! ! ! !!!! !!! !! ! !! !! ! ! ! ! ! ! ! !!! ! ! ! ! !! ! !! ! ! !! ! !! ! !!! ! ! ! ! ! ! ! ! ! ! ! ! ! ! !! ! ! !! ! !! ! ! !! ! ! ! ! ! ! ! !!! ! ! ! ! ! ! ! ! !!!! ! ! ! ! ! !!! ! ! ! !! ! ! !!!! ! ! ! ! ! !! ! ! ! !! !! ! ! ! ! ! ! ! ! ! ! ! ! ! !!!! ! ! !!! ! !! ! ! ! !! ! ! ! ! ! !!! ! ! ! ! !!! ! ! ! ! ! !! ! ! !!! ! ! !!! ! ! ! !! ! ! !! ! !! ! !! !! ! ! !!!!! ! !! !! ! ! !! ! ! ! ! ! !! !! ! ! ! !!! ! ! ! !! ! ! !!!!!! ! ! ! ! ! ! ! ! ! ! ! ! !!!! ! ! ! ! ! !! !! ! ! ! ! ! ! ! ! ! ! ! ! ! ! ! ! ! ! ! ! ! ! ! ! ! ! ! ! ! ! ! ! ! ! ! ! ! !! ! !!! ! ! !! !! !! ! ! !!! ! ! !!!! !! ! ! ! ! ! ! ! ! ! 0 1 2 3 ! ! ! ! ! ! ! ! ! ! ! ! ! ! ! !! ! ! ! ! ! ! !! ! ! ! ! ! ! ! ! ! ! ! !! ! ! ! ! ! !! ! ! ! ! ! ! ! ! ! ! ! ! ! ! ! ! ! ! ! ! ! ! ! ! ! ! ! ! ! ! ! ! ! ! ! !! ! ! ! ! !! ! ! ! ! !! ! ! ! !!!! ! !! !! ! ! !! ! ! ! ! ! ! ! !!! ! ! ! ! ! ! !! !!!! ! !! ! ! ! ! ! !! !!! ! !! ! ! ! ! ! ! ! ! ! ! ! !! ! ! ! ! ! !! ! !!! !! ! !! !! ! ! ! ! !! ! ! ! ! ! ! ! ! ! ! !! !! ! ! ! ! ! ! ! ! ! ! ! ! !! ! ! ! !! ! ! ! ! ! ! ! ! !! ! ! !!! ! !! !! ! ! ! ! ! ! ! ! ! ! ! !!! ! !!! !! ! ! Cabot ! ! ! !!!! !! ! ! !! !! ! ! !!!!!!!! ! !! ! ! ! ! ! !! ! ! ! ! ! !! ! ! ! ! ! ! ! !!! ! ! ! ! ! ! ! ! ! ! ! ! ! ! ! ! Miles ! ! ! ! ! ! ! ! ! ! ! ! ! ! ! ! ! ! ! ! ! !! ! ! ! ! ! ! ! ! ! ! ! ! ! ! ! ! ! ! ! ! ! ! ! !! ! ! !! !! ! !! ! ! ! !! ! !!! ! !!!!! ! !!!!!! ! ! !!! !!!! ! ! !! ! ! ! ! !! !! !! ! !! ! ! ! ! ! ! !! ! ! !! ! ! ! !!! ! ! !! !!!! ! ! ! ! ! ! !!!!!!!!! !! !! ! ! ! !!! !! ! ! ! ! ! ! ! ! ! ! ! ! ! ! ! ! ! ! ! ! ! ! ! ! !! ! ! !!! ! ! ! ! ! ! !!! ! ! ! ! ! ! !! ! !! !! !! ! !! ! ! ! !! ! ! ! ! !! !!! ! ! ! ! !! ! !! !! ! ! ! !! !! !! !! ! ! ! ! !! ! ! ! !!! ! ! !! ! ! !! ! ! ! ! ! ! ! ! ! ! ! !!!!!! !! ! ! !!!! ! ! ! ! !! ! ! !! ! !!! ! ! ! !! ! ! !! !!! ! ! ! ! ! ! ! ! ! ! ! ! ! ! ! ! ! ! ! ! ! ! ! ! ! ! ! ! ! ! ! ! ! ! ! ! ! ! ! ! ! ! ! ! ! ! ! !! !!! !! ! ! !!!! ! ! ! ! !! ! !! ! !! ! ! !! !!! !! ! ! ! !! ! ! !! ! ! !! ! ! ! ! ! ! ! ! ! ! ! ! ! ! ! ! ! ! ! ! ! ! ! ! ! ! ! ! ! ! !! ! !!!!! !! ! ! ! ! !!!! ! ! !! ! !! !! !! !!! ! ! ! ! ! !! ! ! ! ! ! !!! ! ! ! !! !! !! ! ! ! !!! ! ! ! !!! ! ! !! ! !! !! ! ! ! !!!!!! ! ! !!!!!!!!!321 ! !!! !! ! ! ! ! !! ! ! !!! ! !!!! ! ! !!!!!! !!!! !! !!!! ! !! !!! ! ! ! ! !!! ! !!!! ! !! !! ! ! !! ! !!!! ! ! !! !!! !!!!! ! ! ! ! ! ! ! ! ! ! ! ! ! ! !! ! ! ! ! ! ! ! ! ! ! ! ! ! ! ! ! !!! ! ! ! !!!! ! ! !! ! !! !! ! !!!! ! ! ! ! ! ! ! ! ! ! ! ! ! ! ! ! ! ! ! ! ! ! ! ! ! !! ! !!! ! !! ! ! ! ! ! !! !! !! ! ! ! ! ! !!! ! !! ! ! ! ! !! !!!! ! !! !! ! ! !!! !! !! ! ! !! ! ! !! ! ! ! !!!! ! !!! ! ! ! !!!! ! ! !! !! ! ! ! ! ! ! ! ! ! !! !!! ! ! ! ! ! ! ! ! ! ! ! ! !! ! ! ! !! !! ! ! ! ! !! !!! ! ! ! !! ! !!! !!! !! ! !! ! ! !! !! ! !! ! ! ! !!!! !!!! ! !! !! ! ! !! ! !! ! !! !!!! ! ! !!! ! ! ! !!! ! !! ! ! !! !! !!!! !!!!!!!!! !! ! !! ! ! ! !!!!!! ! ! ! ! ! ! !!! !!! ! !!!! ! ! !! !!!! ! ! ! !! !!!!!!! ! !! !! ! !!! ! !! ! ! ! !! !!! ! !!! !! !! !! ! ! !! ! ! ! ! ! ! ! ! ! ! ! ! ! ! ! ! ! ! ! ! ! ! ! ! ! ! ! ! ! ! ! ! ! ! ! ! ! ! ! !!! !! ! ! ! !! ! ! ! ! ! !! ! ! !! ! ! ! ! !! !! !! !!!! !!! !! !! ! ! ! ! ! !! ! ! !! !! !!!! !! !!! !! !!!! ! !! !! ! ! ! ! ! ! ! ! ! ! ! ! ! ! ! ! ! ! ! ! ! ! ! 236 ! ! ! ! ! ! ! ! ! ! ! !! !! ! ! ! ! !! !! ! ! ! ! ! !!! ! ! !! ! ! !! ! !! !! ! ! ! ! !!! ! !!! ! !! ! !!!! ! ! !! ! ! ! ! !! ! !!! !! ! !! ! !! ! !!!!!!! !! ! !!!! ! ! ! ! ! ! ! !! !! ! ! !!! ! ! ! ! ! ! ! ! ! ! ! ! ! ! ! ! ! ! ! ! ! ! ! ! !! ! ! !! ! ! ! !! ! ! ! ! !!! !!! !! ! ! ! ! ! !! ! ! ! ! !! ! !!! ! ! !! ! ! ! ! !! ! !! ! ! ! ! ! ! ! ! ! ! ! ! !! ! ! ! !! ! ! ! !! ! ! ! ! !! ! !! ! ! ! !! ! ! ! ! ! !! ! !! !! !! ! ! ! ! ! ! ! ! ! ! ! ! ! ! ! ! ! ! ! ! ! ! ! ! ! ! ! ! ! ! !! ! ! ! ! !! ! !!! ! ! ! ! ! ! ! ! ! !!! ! !! ! ! ! ! ! !! !! !! !! ! ! ! !! !! !!!! ! ! 89 !! ! ! !!! ! ! ! ! ! ! ! ! !!!! !! ! ! ! ! ! ! ! ! ! ! ! ! !! ! !! ! ! ! ! ! ! ! ! ! ! ! ! ! ! ! ! ! ! ! ! ! ! ! ! ! ! ! ! ! ! ! ! ! ! ! ! ! ! ! !! ! ! !!! !! ! ! ! !! ! ! ! ! ! !! ! !! !! ! ! ! ! ! ! ! ! ! ! ! ! !! ! ! ! ! ! ! ! !! !! ! ! !!! !! ! ! ! ! ! !! !! ! ! ! ! ! ! ! ! !! ! ! ! ! ! !! ! ! ! ! ! ! ! ! ! ! ! ! ! ! ! ! ! ! ! ! ! ! ! ! ! ! ! ! ! ! ! ! ! ! ! ! !! ! !! ! ! ! ! ! ! !! ! ! ! ! ! ! !! ! ! ! ! !! ! ! ! !! ! ! ! !! ! !!!! ! ! ! ! ! ! ! !! !! ! !! !! ! !! ! !! ! ! ! ! ! ! ! ! ! !! ! ! !! ! ! ! ! ! ! ! ! ! ! ! ! ! ! ! ! ! ! ! ! ! ! !!! ! ! ! ! !!! ! !!! ! ! !! !!!!! ! ! ! ! ! ! !!!!! ! !! ! ! !! ! ! ! ! ! ! ! ! ! ! ! ! ! ! ! ! ! ! ! ! ! ! ! ! ! !! ! ! ! ! ! !! ! ! !!!! ! !!!!! ! ! ! ! ! ! ! ! ! ! ! ! ! ! ! ! ! ! ! ! ! ! ! ! ! ! ! ! ! ! ! ! ! ! ! ! ! ! ! ! ! ! ! ! ! ! ! ! ! ! ! !!!!!! !! ! ! ! ! ! ! ! !! ! ! ! ! !! ! ! ! ! ! ! !! ! !!! ! ! !! !! !!! ! ! ! !! ! ! ! ! ! ! ! ! ! ! ! ! ! ! ! ! ! ! ! ! ! ! ! ! ! ! ! ! ! ! ! !!! ! ! ! ! ! ! ! ! ! ! ! ! ! ! ! ! ! ! ! ! ! ! ! !! ! ! ! ! ! ! ! ! ! ! ! ! ! ! ! ! ! ! !! ! ! ! ! ! ! ! ! ! ! ! ! !!!! ! ! ! !! ! ! ! !! !! ! ! ! ! ! !! ! ! ! ! ! ! !! ! !! !! ! ! ! ! ! ! ! ! ! ! ! ! ! ! ! ! ! ! ! ! ! ! ! ! ! ! ! ! ! ! ! ! ! ! ! ! ! ! ! ! ! ! !!! ! ! ! ! ! ! ! ! ! ! !! ! ! ! ! !! ! ! ! 236 ! ! ! ! ! !! ! ! ! ! ! ! ! ! ! !! ! ! ! ! !! ! ! ! ! !! ! ! ! ! !! ! ! ! ! ! ! ! ! ! ! ! ! ! ! ! ! ! ! ! ! ! !! ! ! !!! ! ! ! ! ! !! ! ! ! ! ! ! ! ! ! !!! ! ! ! ! ! ! ! ! ! ! ! ! ! ! !!!! ! ! ! ! !! ! ! ! ! ! ! ! ! ! ! ! ! ! ! ! !! ! ! ! !!!! ! ! ! ! ! ! ! ! ! ! !! ! ! ! ! ! ! ! ! ! ! ! ! ! ! !! ! ! ! ! ! ! ! ! ! ! ! ! ! ! ! ! ! ! ! ! ! ! ! ! ! ! ! 13 ! ! ! ! ! ! ! ! ! ! ! ! ! ! ! ! ! ! ! ! ! ! !!!! !!! ! !!! !! !! ! !! !! !! !! !! !! !! !! !! !! !! ! ! ! ! ! ! ! ! !! ! ! ! ! ! ! ! !! ! ! ! ! ! ! ! ! ! ! ! !! ! ! ! ! ! ! ! ! ! ! ! !! ! ! ! ! ! ! !! ! !! ! !! ! ! ! !! ! ! ! !! ! ! ! ! ! ! ! ! ! !! ! ! !! !! ! ! ! ! ! ! ! ! ! ! ! ! ! !! ! ! ! ! !! ! ! ! !!! ! ! ! ! ! ! ! ! !! ! ! ! ! ! ! ! ! ! ! ! !! ! ! ! ! ! !! ! ! ! ! ! ! ! ! ! ! ! ! ! ! ! ! ! ! ! ! ! ! ! ! ! ! ! ! ! ! ! ! ! ! ! ! ! ! ! ! ! ! ! ! ! ! ! ! ! ! ! ! ! ! ! ! ! ! ! ! ! ! ! ! ! !! ! !! !! ! !! ! ! ! ! !! !! ! ! ! ! !!! !!! ! ! ! ! ! !! ! !! ! ! !!! !! ! ! !! ! ! ! !!! ! ! ! ! ! ! ! ! ! ! ! !! ! ! ! !! ! ! ! ! ! ! ! ! ! ! ! ! ! ! ! ! ! ! !!!!! ! ! ! ! ! ! !! ! ! ! ! ! ! ! ! ! ! ! !! ! ! ! ! ! ! ! ! ! ! ! ! ! ! ! ! ! ! ! ! ! ! ! ! ! ! ! ! ! ! ! ! ! ! ! ! ! ! ! ! ! ! ! ! ! ! ! ! ! ! ! ! ! !! !! !!!!! !!!! ! !!! ! ! !!! ! ! ! ! ! ! ! ! ! ! ! ! ! !!! 294 !! !!!! !!! !! ! !!! ! !!! !! ! ! !! ! ! !! ! !! ! ! ! !! ! !!!! ! ! !!! ! !! ! ! ! !!! ! ! ! ! !! ! ! ! ! !! ! ! !!! ! ! ! ! ! ! ! ! ! ! ! ! ! ! ! ! ! ! ! ! ! ! ! ! ! ! ! ! ! ! ! ! ! ! !!! !!! ! !! ! !! ! !! ! ! ! ! ! ! ! ! ! ! ! ! ! ! ! ! ! ! ! ! !! !! ! ! ! ! !! ! ! !!! ! ! ! ! ! !!! ! ! ! ! ! !! ! ! ! ! ! ! ! ! ! ! ! ! ! ! ! ! ! ! ! !! ! ! !! ! !!! !!! !!! !! ! ! ! !!!! ! ! ! ! ! ! !! !! !!!!!! ! !! !! ! !! ! !! !! ! ! !! ! ! !!! ! !!! ! ! ! !!! !!! ! !! ! !! ! !! !! ! !! ! ! ! ! ! ! ! !!! ! !! ! !!! !! ! ! ! !! ! ! ! !! ! ! !! ! ! !!! ! ! ! !! ! ! ! !! ! !! !! !! ! ! !! ! !! !!! ! !!! ! ! !!!! ! !! !! !! !! ! ! ! ! ! 89 ! ! !! !! !! !! ! ! ! ! ! !! ! ! ! !! ! ! ! !! ! ! ! ! !! ! ! ! ! ! ! ! ! !!! ! ! ! ! ! ! ! ! ! ! !! !!! ! ! !!!! !!!!! ! ! ! ! ! ! ! !!!!!!! ! ! !!!!!! ! ! !! ! ! ! ! ! ! ! !! ! ! ! ! ! ! 31 ! ! ! ! ! ! ! ! ! ! ! ! ! ! !! !! ! !! ! !!! ! ! ! ! !!! ! !! ! ! ! ! !! ! !! ! ! ! Carlisle ! ! ! ! !!! ! ! !!! ! ! ! ! ! ! ! ! ! ! ! ! ! ! ! ! !! ! !! ! ! ! ! ! ! ! ! ! ! ! ! ! ! ! ! ! ! ! ! ! ! ! ! ! ! ! ! ! ! ! ! ! !!! !! ! ! !!! ! ! !! ! !! ! !! ! ! ! !! ! !!! ! ! !!! ! !! ! ! ! !! ! ! ! ! ! ! !! ! ! ! Lonoke ! ! ! !! ! !! ! ! ! ! !! ! ! !! !! ! !!! !! ! ! ! !!! ! ! ! ! ! ! ! ! ! ! ! ! ! ! ! ! ! ! ! ! ! !! ! ! ! ! ! ! ! ! ! !!!!!! ! ! ! ! ! ! ! ! ! ! ! ! ! ! ! ! ! ! ! ! ! !! ! ! !!! !! ! ! ! !! ! ! !!! ! !! ! ! ! ! ! ! ! ! ! ! !! ! ! ! ! ! ! ! ! ! ! ! ! ! ! ! ! ! ! ! ! ! ! ! ! !! !! 70 ! ! ! !! !!! ! !!! ! ! !! ! !! ! ! !! ! !! ! !! ! ! ! ! !! !! !! !! ! ! ! ! ! !! ! ! ! ! !! ! !! ! ! !! ! !! ! !! !! !!! ! ! !! !! ! !! ! ! ! ! ! ! ! !! ! ! ! ! ! ! ! !! !! ! !! ! ! ! ! ! ! ! ! ! ! ! ! ! ! ! ! ! !! ! !!!!! ! ! ! ! ! ! !! ! ! !!! ! ! ! ! ! ! !!!! ! !!!!! ! ! ! !!! 70 ! !! ! ! ! ! ! ! ! !! ! ! ! ! ! ! ! ! ! !! !!!!!! ! ! ! ! ! ! ! ! ! ! ! !! ! ! ! !! !! ! ! ! ! ! ! ! ! ! ! ! ! ! !! ! ! !!! ! ! ! ! ! !! !! ! ! ! !! ! ! ! ! ! ! ! ! ! ! ! ! ! ! ! ! ! ! !! !! ! !!! ! !!! ! !! ! ! ! ! ! !!! ! ! ! !! ! ! ! ! ! ! ! ! ! ! ! !! ! ! !! ! ! ! ! ! ! ! ! ! ! ! ! ! ! ! ! ! !! ! ! ! ! ! ! !! ! ! ! ! !! ! ! ! ! ! ! ! ! ! ! ! ! ! !!! ! ! ! ! !! !!! !! ! ! ! ! ! ! ! ! ! ! ! ! ! ! ! ! ! ! ! !! ! !! ! ! ! !!! ! ! 31 !!! ! ! ! ! !! !!! !! ! ! ! ! ! ! 381 !!!! ! !! ! ! ! ! !! !!!! ! ! ! ! ! ! ! ! !! ! !! ! ! ! !!! ! !! ! !! !! !! !! ! ! ! ! !! ! ! ! !! ! ! ! ! ! ! ! ! !! ! ! ! ! ! ! ! ! ! ! ! ! ! ! 15 ! ! ! ! ! ! ! ! !! ! ! !! !! ! ! !! ! ! !! !!! ! !! ! ! ! ! !! ! ! ! ! !!! ! !! ! ! ! ! !! ! ! ! ! ! !! ! ! !! !! ! !! ! ! ! ! ! ! ! ! ! ! ! ! !!! ! ! ! !! ! ! ! ! ! !
Population Distribution Population Density
§ ¥ ,
²
4
£ ¤
£ ¤
! !
Keo
!
! !
! ! !
!!
! !
!
! ! ! ! ! !!! ! ! ! ! ! !
!
!
! !
!
! !
! ! !
! !
!
!! !
!
! !
! !! ! ! ! ! !!!!!! ! ! ! !! !!! ! !! ! !!!!! !! ! ! !! !! ! !!! !! ! ! ! ! ! ! ! ! !!!!! ! ! ! ! ! ! !!! ! ! !!! ! ! ! ! ! ! ! ! ! ! ! ! ! ! ! ! ! ! ! ! ! ! ! ! ! !!!! ! ! ! ! ! !!!! ! ! !! England ! ! ! ! ! ! ! ! ! ! ! ! ! ! !!! !! !! !! ! !! !! !!! ! ! ! ! ! ! ! ! ! !! ! !! ! ! !!! ! ! ! ! !!!!! ! ! ! !
! 161
! ! ! !! !
!
!
13
!
!
!
!
! ! !
!
!
!
!
!
! !!
232
! !
!
! ! ! !
!
15
! !
!
!
!!
! !
!
! !
! !
!
! ! ! ! ! !
!
£ ¤ 1!65
Coy
! !! !!!! !! ! Allport !
!
256
!
!
!
!
!
! ! !
!
Population Density is derived from 2020 Census Block Level data and has been modified to reflect land use patterns.
!
! ! !
! !
31 !!
! !
Humnoke
!
Map 3. Projected Population Change 2015 to 2050 5
319
Projected Population Change Projected Population Change 2015 to 2050
Value
Highest Growth High : 2645.75
Ward
§ ¥ , 57
Lowest Growth Low : -108.578
305 319
Source: Metroplan Projections
Austin
89
38
5
31
321
0
Cabot
1
² 2
Miles
321
236
89
236
13 294
89
§ ¦ ¨ 40
31
Carlisle
Lonoke
70 £ ¤ 70 £ ¤
31 381
15
Keo 232
13
161
Humnoke
£ ¤ 165
England
Coy 15
Allport
31
256
Population change is based on population projection datasets produced by Metroplan at the Census Tract level.
3
4
Map 4. No Vehicle Households 5
319
Census Tracts
Percent of Household with 0 Vehicles 0% to 1% 1% to 3% 3% to 5% 5% to 10% Greater Than 10%
Ward
§ ¥ , 57
305 319
Austin
89
Source: US Census American Community Survey 2023 - 5 Year Average
38
5
31
321
0
Cabot
1
² 2
Miles
321
236
89
236
13
294
89
31
Carlisle
Lonoke
70 £ ¤ 70 £ ¤
31 381
15
Keo 232
13
161
Humnoke
£ ¤ 165
England
Coy 15
Allport
31
256
Zero Vehicle Households are shown at the Census Tract level and are derived from 2023 American Community Survey 5-year averages.
3
4
Map 5. Employment 5
319
Employment Total Employment by TAZ
0 - 49 50 - 99 100 - 249 250 - 499 500 - 999 1000+
Ward
§ ¥ , 57
305 319
Austin
89
Source: LEHD 2022 LODES Data
38
5
31
321
0
Cabot
1
² 2
Miles
321
236
89
236
13
294
89
§ ¦ ¨ 40
31
Carlisle
Lonoke
70 £ ¤ 70 £ ¤
31 381
15
Keo 232
13
161
Humnoke
£ ¤ 165
England
Coy 15
Allport
31
256
Employment totals are derived from LEHD Origin-Destination Employment Statistics (LODES) which is a component of US Census Longitudinal Employer-Household Dynamics data . Data is shown at the Traffic Analysis Zones (TAZ) level.
3
4
Map 6. Development Constraints 5
319
Development Constraints Slope > 15% Wetlands 100 Year Flood Plain Cemetery Lake \ River Park or Protected Open Space Developed or Reserved Land
Ward
§ ¥ , 57
305 319
Austin
89
38
5
31
321
0
Cabot
1
² 2
3
4
Miles
321
236
89
236
13
294
89
31
Carlisle
Lonoke
70 £ ¤ 70 £ ¤
31 381
15
Keo 232
13
161
Humnoke
£ ¤ 165
England
Coy 15
Allport
31
256
The development constraints shown include flood plains, steep slopes, and other factors that commonly deter development The data was derived from the Metroplan GIS using a variety of sources.
Map 6a. Development Constraints Northwest Lonoke County 5
The map of development constraints is a combination of various data layers produced by Metroplan and other publicly available datasets.
319
Ward
Development Constraints Slope > 15% Wetlands 100 Year Flood Plain Cemetery Lake \ River Park or Protected Open Space Developed or Reserved Land
§ ¥ , 57
305 319
Austin
38
89
31
5 321
Source: Metroplan (2023)
0
0.4
² 0.8
Miles
1.2
1.6
Cabot
321
Map 7. Land Use (2023) 5
319
Existing Land Use Land Use
Rural Residential Residential Multi-Family Commercial Industrial Institutional Other Park/Open Space
Ward
§ ¥ , 57
305 319
Austin
89
Source: Metroplan (2023)
38
5
31
321
0
Cabot
1
² 2
Miles
321
236
89
236
13
294
89
31
Carlisle
Lonoke
70 £ ¤ 70 £ ¤
31 381
15
Keo 232
13
161
Humnoke
£ ¤ 165
England
Coy 15
Allport
31
256
The Land Use dataset was developed by Metroplan using imagery and county parcel data for general land use classifications.
3
4
Map 7a. Land Use 2023
5
319
The Land Use dataset was developed by Metroplan using imagery and county parcel data for general land use classifications.
Ward
Existing Land Use
§ ¥ , 57
305 319
Land Use
Rural Residential Residential Multi-Family Commercial Industrial Institutional Other Park/Open Space
Austin
38
89
31
5 321
Source: Metroplan (2023)
0
0.4
² 0.8
Miles
1.2
1.6
Cabot
321
Map 8. Administrative System 5
319
Administrative System Administrative System State - Interstate State - US Highway State - State Highway State-Other County City Private
Ward
§ ¥ , 57
305 319
Austin
89
38
5
31
321
0
Cabot
1
² 2
Miles
321
236
89
236
13
294
89
31
Carlisle
Lonoke
70 £ ¤ 70 £ ¤
31 381
15
Keo 232
13
161
Humnoke
£ ¤ 165
England
Coy 15
Allport
31
256
The Administrative System dataset is maintained by Metroplan and developed from data from ARDOT and Metroplan. This map represents ownership and maintenance responsibility for roadways.
3
4
Map 9. Roadway Functional Classification 5
319
Functional Classification Interstate Other Freeway Other Principal Arterial Minor Arterial Future Minor Arterial Major Collector Minor Collector Local Road Out_of_Lonokei_2024
Ward
§ ¥ , 57
305
Adjusted Urban Area
319
LR-NLR
Austin
89
38
5
31
321
0
Cabot
1
² 2
3
4
Miles
321
236
89
236
13
294
89
31
Carlisle
Lonoke
70 £ ¤ 70 £ ¤
31 381
15
Keo 232
13
161
Humnoke
£ ¤ 165
England
Coy 15
Allport
31
256
Functional Classification shows which roadways are eligible for federal funding. The functional classification map is updated after each decennial census in conjunction with the urbanized area designation. The functional classification map is developed in collaboration with ARDOT and FHWA. All local roads as well as minor collectors outside of urbanized areas are not federal aid eligible.
Map 9a. Roadway Functional Classification 5
Functional Classification shows which roadways are eligible for federal funding. The functional classification map is updated after each decennial census in conjunction with the urbanized area designation. The functional classification map is developed in collaboration with ARDOT and FHWA. All local roads as well as minor collectors outside of urbanized areas are not federal aid eligible.
319
Ward
Functional Classification Interstate Other Freeway Other Principal Arterial Minor Arterial Future Minor Arterial Major Collector Minor Collector Local Road Out_of_Lonokei_2024
Adjusted Urban Area
§ ¥ , 57
305 319
Austin
38
89
31
5 321
LR-NLR
Source: FHWA 2025
0
0.4
² 0.8
Miles
1.2
1.6
Cabot
321
Map 10. Master Street Plans of Cities 5
319
Master Street Plans Roadway Classification Interstate Principal Arterial Minor Arterial Proposed Minor Arterial Collector Proposed Collector
Ward
§ ¥ , 57
305 319
Source:Metroplan, Austin, Cabot, and Ward
Austin
89
38
5
31
321
0
Cabot
1
² 2
3
4
Miles
321
236
89
236
13
294
89
31
Carlisle
Lonoke
70 £ ¤ 70 £ ¤
31 381
15
Keo 232
13
161
Humnoke
£ ¤ 165
England
Coy 15
Allport
31
256
The map of Master Street Plans in Lonoke County is a compilation of the individual Master Street Plans for each municipality. The master street plans are developed along with land use plans to guide development within each community.
Map10a. Master Street Plans of Cities 5
The map of Master Street Plans in Lonoke County is a compilation of the individual Master Street Plans for each municipality. The master street plans are developed along with land use plans to guide development within each community.
319
Ward
Master Street Plans
§ ¥ , 57
305 319
Roadway Classification Interstate Principal Arterial Minor Arterial Proposed Minor Arterial Collector Proposed Collector
Austin
38
89
31
5 321
Source: Metroplan, Austin, Cabot and Ward
0
0.4
² 0.8
Miles
1.2
1.6
Cabot
321
Map 11. Bridge Condition - Locally Owned
# * 5
# *
319
# *
Bridge Condition
# *
Ward
# * § ¥ , 57
# * Poor # * Fair # * Good
# *
305 319
#Austin *
89
5
Bridges
# * # * # * Cabot # # * * # *
Source: ARDOT 2025
38 31
321
0
1
² 2
3
Miles
321
# *
236
# *
89
#* # *
236
13
294
89
# *
31
# Carlisle *
# * 70 £ ¤
Lonoke
# * # *
70 £ ¤
# * 31
# * 381
# *
# *
# * # *
15
# *
# *
# * Keo
# *
# #* *
232
13
# * # *
# *
161
165
Coy 15
# * 256
# *
Humnoke
£ ¤
England
# *
Allport
31
#* * #
# *
# * The bridge condition map shows all bridges that are maintained either by the county or cities. These bridges are part of a larger dataset that is maintained by ARDOT and updated annually.
# * #* # * * # # *
4
Map 11a. Bridge Condition - Locally Owned 5
# *
319
The bridge condition map shows all bridges that are maintained either by the county or cities. These bridges are part of a larger dataset that is maintained by ARDOT and updated annually.
# * # * # *
Ward
# * Bridges
§ ¥ , 57
305 319
Bridge Condition
# * Poor # * Fair # * Good
# *
89
Austin
38
# *
5
31 321
Source: ARDOT 2025
0
0.4
² 0.8
# * 1.2
# *
1.6
Miles
# *
Cabot # * # *
# *
321
Map 12. Bridge Condition - State Owned
# * 5
319
# * # * # # * * # * § ¥ , # * # * # * #* * Austin # # * # *
# * # * #* * # 89
# * # *
Bridge Condition
Ward
305
57
5
Bridges
# * # #* * # *
# *
319
# *
Source: ARDOT 2025
38
# *
# *
31
321
# * # #* * # * * # # * #* #* # * * #
# * Poor # * Fair # * Good
0
Cabot
1
# * # * # *
321
2
3
4
Miles
# * 89
²
# *
236
# * # * # * 236
13
# *
# *
294
# *
89
# *
# *
# *
#* # * # * * # # *
# *
# *
31
#* * #
Lonoke
# * # *
# *
# *
# #* # * *
# *
# # * 70 #* # * ## * ** £ ¤ # * # *
# *
70 £ ¤
# * # * # *
31
# *
381
15
# * # *
# * # *
# *
# *
# *
Keo
# *
# * # *
# *
# *
Carlisle
# * # * # * # *
# *
# *
# *
# * 232
#* * # # * 13
# * # * # *
161
# #* *
#England * 15
# £ * ¤ Coy # * 165
# *
# *
# *
Humnoke Allport
31
256
# * # *
# *
# *
The bridge condition map shows all bridges that are maintained by ARDOT. These bridges are part of a larger dataset that is maintained by ARDOT and updated annually.
# *
## * # **
# *
# - State Owned * Map 12a. Bridge Condition 5
The bridge condition map shows all bridges that are maintained by ARDOT. These bridges are part of a larger dataset that is maintained by ARDOT and updated annually.
319
# #* * # * #* * #
# *
Ward
# * # * # *
# * Bridges
§ ¥ , 57
##* * # #* *
Bridge Condition
# *
# * Poor # * Fair # * Good
# *
# *
89
# *
305
# *
# * 319
# * # * # *
# *
Austin
38
31
5 # * 321
Source: ARDOT 2025
0
0.4
² 0.8
# * # * 1.2
1.6
Miles
# * # *
#* * # #* # *
# #* #* *
#* * #* #
Cabot
# * # * 321
# *
Map 13. Number of Through Lanes 5
319
Through Lanes 1 Thru Lanes 2 Thru Lanes 3 Thru Lanes 4 Thru Lanes 5 Thru Lanes 6 Thru Lanes (total lanes for freeways)
Ward
§ ¥ , 57
305 319
Austin
89
5
Source: Metroplan 2025
38 31
321
Cabot
0
I-57 Widening to 6 lanes U.C.
1
² 2
Miles
321
236
89
236
13
294
89
31
Carlisle
Lonoke
70 £ ¤ 70 £ ¤
31 381
15
Keo 232
13
161
Humnoke
£ ¤ 165
England
Coy 15
Allport
31
256
The Through Lanes dataset is maintained and updated by Metroplan. Through Lanes shown include main travel lanes and exclude turn lanes.
3
4
Map 14. Traffic Control Signals 5
319
é è
Traffic Signals é Ward è
é è
§ ¥ , 57
é è 5
89
è é éè è é é è éè è é è éè é è é é è
é Traffic Control Signals è
305 319
è Austin é é è
Source: Metroplan 2025
38 31
321
0
Cabot
è é é é è è é è
èè é é
1
² 2
Miles
321
236
89
236
13
294
89
é è è é
31
Lonoke
Carlisle
é è
70 £ ¤
70 £ ¤
31 381
15
Keo 232
13
161
Humnoke
£ ¤ 165
è é é é è è
England
Coy 15
Allport
31
256
The traffic control signals map is maintained and updated by Metroplan. The Signals shown on the map are for traffic control only. Examples of types of signals that are not included on the map: pedestrian beacons, fire station signals, and school zone flashers.
3
4
Map 14a. Traffic Control Signals 5
The traffic control signals map is maintained and updated by Metroplan. The Signals shown on the map are for traffic control only. Examples of types of signals that are not included on the map: pedestrian beacons, fire station signals, and school zone flashers.
319
é è
é è Ward
é è
Traffic Control Signals
305
§ ¥ , 57
319
é è é Traffic Control Signals è
Austin 89
é è 5
èè é é è éè éè éè é
38
é è é è è é é è è é
31 321
Source: Metroplan 2025
0
0.4
² 0.8
Miles
1.2
1.6
Cabot
é è
é è é è é è é è
é è
321
Map 15. Pavement Condition 2021 5
319
Pavement Condition Total Federal PCI
Ward
§ ¥ , 57
Good Fair Poor
305 319
Austin
89
Source: ARDOT 2021
38
5
31
321
0
Cabot
1
² 2
Miles
321
236
89
236
13
294
89
§ ¦ ¨ 40
31
Carlisle
Lonoke
70 £ ¤ 70 £ ¤
31 381
15
Keo 232
13
161
Humnoke
£ ¤ 165
England
Coy 15
Allport
31
256
Pavement Condition is a dataset collected by ARDOT for FHWA performance measures. The pavement data shown is only for the Interstate and National Highway System (NHS).
3
4
Map 16. Existing and Planned Pedestrian and Bike Facilities 5
Pedestrian and Bike Facilities
319
Existing Facilities Seperated Path Bike Lane Signed Bike Route
Ward
§ ¥ , 57
Proposed Facilities
Proposed Seperated Path Proposed Bike Lane Proposed Bike Route Regional Greenway
305 319
Austin
89
Source: Metroplan
38
5
31
321
0
Cabot
1
² 2
Miles
321
236
89
236
13
294
89
§ ¦ ¨ 40
31
Carlisle
Lonoke
70 £ ¤ 70 £ ¤
31 381
15
Keo 232
13
161
Humnoke
£ ¤ 165
England
Coy 15
Allport
31
256
The pedestrian and bike facility dataset is maintained and updated by Metroplan. This dataset is a compilation of regional plans and local plans and does not include sidewalks.
3
4
Map 16a. Existing and Planned Pedestrian and Bike Facilities 5
The pedestrian and bike facility dataset is maintained and updated by Metroplan. This dataset is a compilation of regional plans and local plans and does not include sidewalks.
319
Ward
Pedestrian and Bike Facilities
§ ¥ , 57
305 319
Existing Facilities Seperated Path Bike Lane Signed Bike Route
Austin
Proposed Facilities
38
89
Proposed Seperated Path Proposed Bike Lane Proposed Bike Route Regional Greenway
31
5 321
Source: Metroplan
0
0.4
² 0.8
Miles
1.2
1.6
Cabot
321
Map 17. Crashes 2021- 2024 and High Injury Network 5
#
# # # 319
# #
D
#
#
#
#
D # # D
#
# # # #
D # D
#
Crashes and HIN
D# D D # ## # # # ## # Ward # # # # ## 305# 57 § ¥ , 319 #
Crash Severity
D Fatal #
D 5 #
# Source: Arkansas State Police/ARDOT/Metroplan
#
38
#
#
D
D
31
321
D
#
# ## # D # # Cabot # ## # # # # # # # # D #D# ## # ## #### # ## D## D #
0
#
2
#
# #
D
#
#D #
² Miles
#
##
321
#
1
#
D
D
Other Crashes High Injury Network - Safety Action Plan
D
D ##D
# Austin # 89# # # D # ## # # # # D # # # # #
#
# Serious Injury
D
#
D
# ##
236
# #
#
D# ## 89
#
#
#
236
#
#
###
D
# 13
#
# 294 #
# #
# # #
D
#
D
#
89
#
#
DD
## #D
# # # ### # D# #§ D 40 ## # ¦ ¨
##
# # # # # Lonoke ## # #
# #
# D
D
#D
# #
D
# ##DD # Carlisle
#D
#
70 £ ¤
#
70 £ ¤
##
#
31
#
# # #
D
31
D
# # #
381
#
D
#
#
# 15
# #
#
#
Keo 232
D #
13
#
161
#
165 #£ ¤
D
#
England
#
# #
15
# 256
Coy
31
D
# #
Humnoke
D# Allport
D
# #
Crash data is maintained and updated in a cooperative effort between ARDOT and Arkansas State Police. The high injury network (HIN) was developed from the crashdata as part of Metroplan's SS4A Safety Action Plan.
#
3
4
# Map 17a. Crashes 2021-2024 and High Injury Network #
5
#
#
#
# #
#
Crash data is maintained and updated in a cooperative effort between ARDOT and Arkansas State Police. The high injury network (HIN) was developed from the crashdata as part of Metroplan's SS4A Safety Action Plan.
#
319
#
D
#
#
D D
D#
#
D
# # #
#
D
#
#
#
# #
#
# #
#
D
Crashes and HIN
#
57
D #
#
# Serious Injury
89
#
# ## # D #
5
0.4
0.8
Miles
1.6
#
D #
Austin
# #
# # #
38
D
#
#
# 31
# #
321
D
# #
# 1.2
#
#D #
# Source: Arkansas State Police/ARDOT/Metroplan
#
#
#
#
D
0
D
#
D
D Fatal
²
#
319
Crash Severity
Other Crashes High Injury Network - Safety Action Plan
305
§ ¥ ,
Ward
# # # #
#
D Cabot
## ## ## # D # # D # # # #
#
#
#
D
##
# # ## #
#
#
# # # # D
#
#
# #
#
# 321
#
#
#
#
#
D
#
D
# #
#
#
Map 18. Non-Motorized Crashes 2020- 2024 and High Injury Network (HIN) 5
319
Non-Motorized Crashes and HIN
#
Crash Severity
D Fatal
Ward
# Serious Injury Other Crashes High Injury Network - Safety Action Plan
#
§ ¥ , 57
5
D
319
Source: Arkansas State Police/ARDOT/Metroplan
Austin
## # #
89#
D#
305
38
#
31
321
0
D
Cabot
1
² 2
3
4
Miles
321
D 236
# 89
236
#
13
294
89
D
D § ¦ ¨ 40
D
D
31
Lonoke
Carlisle
#
70 £ ¤
70 £ ¤
31 381
15
Keo 232
13
161
Humnoke
£ ¤ 165
England
Coy 15
Allport
31
256
The non-Motorized Crash data is subset of crash data that is maintained and updated in a cooperative effort between ARDOT and Arkansas State Police. The high injury network (HIN) was developed from the crashdata as part of Metroplan's SS4A Safety Action Plan. The crashes represented are between motorized vehicles and pedestrians or cyclists.
Map 18a. Non-Motorized Crashes 2020- 2024 and High Injury Network (HIN) 5
The non-Motorized Crash data is subset of crash data that is maintained and updated in a cooperative effort between ARDOT and Arkansas State Police. The high injury network (HIN) was developed from the crashdata as part of Metroplan's SS4A Safety Action Plan. The crashes represented are between motorized vehicles and pedestrians or cyclists.
319
#
Ward
#
Non-Motorized Crashes and HIN
§ ¥ , 57
305 319
Injury Severity
D Fatal # Serious Injury
Other Crashes High Injury Network - Safety Action Plan
89
Austin
#
38
# #
#
#
D #
5
31
# 321
Source: Arkansas State Police/ARDOT/Metroplan
0
0.4
² 0.8
Miles
D 1.2
1.6
D Cabot
321
D
Map 19. 2024 Average Daily Traffic ! ( 5700
5
1200 ! (
319
! (
Average Daily Traffic
700 ! ( 690 ! (
1100
2024 Average Daily Traffic
810 ! (
Ward
450 ! (
305
§ ¥ , 57
319
4600 ! (
Austin
89
Source: ARDOT
3700 ! (
Cabot
1100
0
1300 ! ( ! ( 321
! (
2700
! (
430
! (
! ( 89
1
² 2
3
4
Miles
3700
2000
! (
! (
2600
31
321
! (
Traffic Count
3800 ! (
780
38 ! (
See Inset
5
! (
! (
990
! (
3700 ! (
870 ! (
1100
400
236
4900 4300 ! (
! (
1000
! (
236
120
13
294
! (
! (
! (
3200
630
! (
1000 ! (
5500
4100
! (
2900
89
! (
1200 ! ( ! ( 870 460004700 ! ( 40 ! ( 1300 ! (
! (
§ ¦ ¨
1800
460001000160 !260 (! ! (! ! ( (( 1000 440 ! (
! (
! (
2800
460
! (
40 ! (
4100
41000
! (
31 ! (
( 4100 !
8500 1100 ! ( 6000 ! ( ! ! ( 4800 ! ( (! ( 4300 (1200 790 4800 ! ! ! ( 750 ( ! (1600 3100 ! ( ! ( 3400
Lonoke 1300
2400 ! (
2200 ! (
70 £ ¤
270 ! ( 540 1500580 ! ( ! ( (! 1400 (! 5200 ! ( 1100 3200 ( Carlisle ! (! 3600 ! 5100 (190 ! ( ! (! ! ( 1400 ( 3000
38000
! (
3300
70 £ ¤
! (
! (
3200
37000 ! (
460
! ( 3200 ! ( 2200 ! (
990 ! (
650
850 ! (
360 ! ( ! (
850
31 381
6300 ! (
15 80 ! (
430 ! ( ! ( 220
! (
! (
5600
! (
50
870
! (
610
690 ! (
Keo 460 ! (
! (
6500
! (
! (
! (
270 ! (
161
110
! (
5900
! (
6600 7700 7600 ( ! ( ! ( !
England
710
! (! ( 1800 310
15
4000
232
! (
190
! (
840
13
! (
4300
£ ¤ 165
400 ! ( 31
! (
Humnoke
3900
! (
Coy
Allport
180 ! (
30 ! (
! (
1400
150
810
256
! (
170
! (
! (
120
! (
40
! (
! (
430
130 ! (
2024 Average daily traffic at ARDOT traffic count stations
430
430 ! (
4000
Map 19a. 2024 Average Daily Traffic ! ( 5700
5
319
! (
2024 average daily traffic at ARDOT traffic count stations
1200
! ( 700
! (
1100
! (
32000
3700
! (
! (
690
930
! ( 1000 ! ( 5200 1800 ! ( 1800 ! ( ! ( ! (
7100 2700 ! (
40000
! (
660
1800
( ! (!
5300
810
1700 ! (! (
! ( Ward
! (
17000
! (
3700 510
! ( ! (
Average Daily Traffic
! (
§ ¥ ,
220
!
( 90! ( ! ( 2000
2024 Average Daily Traffic
! (
! (
! (
Traffic Count Location ! (
12000
! ( 6200
89
13000
Source: ARDOT
0
! (
0.4
0.8
! ( 2900
! (
41000
1.6
17000
Miles
! (
5400 2000
! (
! (
4000 ! (! ( 2600 9600 ! (
! ( ! (
58000
5500
950
! (
! (
! (
! ( Austin
12000
38
8900
Cabot
! (
31
2500 321
8200
! (
! (
1100
1200
! (
1000
3700
! (
! (1500
! ( ! (
780
4600
14000
410
10000
! (
! (
3000
6500
3100 4100 ! ! ( ! ! ( 3200 20000 240 (( 2300 ! ( 3100 ! ( 2900 ! ( 1900 16000 ! ( 9600 ! 5100 ! ( ( ( ! ( (! (16000 ! (! 2000 ! 1700 1600 ! (610 ! ( ! ( 1300 ! ( 800 6300 1200 ! (! ( ! ( ! ( 4000 770 1900 ( 10000 ! ! (
! (
3800
319
! (
3500
450
! (
2400
! (
! (
1.2
14000
! (
! ( 37000
2400
! (
4300 ! (
5
²
! (
! (
4800 305 ! (
2000 ! ( 2200 2600
4900
1400
! ( 530
1600 57
! (
! (
1700
! (
! (
14000
! (
490
1300
3700
! (
! (20000 ! (
20000 17000
! (
! (
! (
6400
321
! (
2700
! (
2000
3800
560
! (
! (
980
! (
3700
Map 20. Five Year Traffic Growth Trend (2019-2024) 5
319
ADT Growth Trend 2019 to 2024 ADT Change
! ( New Location
Ward
§ ¥ ,
! ( ! ( ! ( ( ! (! 89
5
57
20% - 125% 10% - 19.9% 0% - 9.9% -9.9% - - 0.1% -70% - -10%
305 319
Source: ARDOT
Austin
38
See Inset
31
321
0
Cabot
1
² 2
3
4
Miles
321
236
89
236
13
294
89
§ ¦ ¨ 40
31
Carlisle
Lonoke
70 £ ¤ 70 £ ¤
31 381
15
Keo 232
13
161
Humnoke
£ ¤ 165
England
Coy 15
Allport
31
256
Change in average daily traffic was calculated by subtracting 2019 traffic from 2024 count. In some cases, counts with large year to year count fluctuations were excluded.
Map 20a. Five Year Traffic Growth Trend (2019-2024) 5
319
Change in average daily traffic was calculated by subtracting 2019 traffic from 2024 count. In some cases, counts with large year to year count fluctuations were excluded.
Ward
ADT Growth Trend
§ ¥ , 57
! ( ( !! ( ! ( ! (
2019 - 2024 ADT Change
! ( New Location
305 319
Austin
20% - 125% 10% - 19.9% 0% - 9.9% -9.9% - - 0.1% -70% - -10%
38
89
31
5 321
Source: ARDOT
0
0.4
² 0.8
Miles
1.2
1.6
Cabot
321
Map 21. Traffic Volume 2015 / 2030 Comparison 5
2015 / 2050 Traffic Volume
319
Daily Traffic Volume
Tot_Flow
2015 Volume
Ward
305 319
0 50 1, 0 00 2, 0 50 5, 0 0 10 00 ,0 50 0 0 1 0 ,0 0 0, 0 00 0
57
10
§ ¥ ,
Proportional bandwidths with current over future bandwidth
Austin
89
Tot_Flow
38
2050 Volume
5
31
321
1, 0 00 2, 0 50 5, 0 0 10 00 ,0 50 0 0 1 0 ,0 0 0, 0 00 0
50
10
0
Cabot
321
Source:CARTS Travel Demand Model
236
89
236
13
294
89
§ ¦ ¨ 40
31
Carlisle
Lonoke
70 £ ¤ 70 £ ¤
31 381
15
Keo 232
13
161
Humnoke
£ ¤ 165
England
Coy 15
Allport
31
256
Traffic volumes are presented with bandwidths shown proportional to the 24-hour traffic volume. 2015 volumes in gray are shown over modeled 2050 traffic volumes in red. The amount of red shown is proportional to traffic growth over the period. Volumes are derived from the CARTS Travel Demand Model.
Map 22. Maximum AM Volume / Capacity Ratio 2015 5
319
V/C Ratio AM 2015 Maximum AM V/C 2015
0.00 - 0.59 0.60 - 0.69 0.70 - 0.79 0.80 - 0.89 0.90 - 0.99 1.00 - 1.05
Ward
§ ¥ , 57
305 319
Austin
89
Severe congestion
Source: CARTS TDM
38
5
Some congestion
31
321
0
Cabot
1
² 2
3
Miles
321
236
89
236
13
294
89
31
Carlisle
Lonoke
70 £ ¤ 70 £ ¤
31 381
15
Keo 232
13
161
Humnoke
£ ¤ 165
England
Coy 15
Allport
31
256
Volume to capacity ratio correlates strongly with traffic congestion. Volume to capacity ratios were obtained from the CARTS Travel Demand Model.
4
Map 23. Maximum PM Volume / Capacity Ratio 2015 5
319
V/C Ratio PM 2015 Maximum AM V/C 2015
0.00 - 0.59 0.60 - 0.69 0.70 - 0.79 0.80 - 0.89 0.90 - 0.99 1.00 - 1.05
Ward
§ ¥ , 57
305 319
Austin
89
Severe congestion
Source: CARTS TDM
38
5
Some congestion
31
321
0
Cabot
1
² 2
3
Miles
321
236
89
236
13
294
89
31
Carlisle
Lonoke
70 £ ¤ 70 £ ¤
31 381
15
Keo 232
13
161
Humnoke
£ ¤ 165
England
Coy 15
Allport
31
256
Volume to capacity ratio correlates strongly with traffic congestion. Volume to capacity ratios were obtained from the CARTS Travel Demand Model.
4
Map 24. Maximum AM Volume / Capacity Ratio 2050 5
319
V/C Ratio AM 2050 Maximum AM V/C 2050
0.00 - 0.59 0.60 - 0.69 0.70 - 0.79 0.80 - 0.89 0.90 - 0.99 1.00 - 1.05
Ward
§ ¥ , 57
305 319
Austin
89
Severe congestion
Source: CARTS TDM
38
5
Some congestion
31
321
0
Cabot
1
² 2
3
Miles
321
236
89
236
13
294
89
31
Carlisle
Lonoke
70 £ ¤ 70 £ ¤
31 381
15
Keo 232
13
161
Humnoke
£ ¤ 165
England
Coy 15
Allport
31
256
Volume to capacity ratio correlates strongly with traffic congestion. Volume to capacity ratios were obtained from the CARTS Travel Demand Model. Model reflects programmed widening on I-40 and I-57 for 2050 forecast year.
4
Map 25. Maximum PM Volume / Capacity Ratio 2050 5
319
V/C Ratio PM 2050 Maximum AM V/C 2015
0.00 - 0.59 0.60 - 0.69 0.70 - 0.79 0.80 - 0.89 0.90 - 0.99 1.00 - 1.05
Ward
§ ¥ , 57
305 319
Austin
89
Severe congestion
Source: CARTS TDM
38
5
Some congestion
31
321
0
Cabot
1
² 2
3
Miles
321
236
89
236
13
294
89
31
Carlisle
Lonoke
70 £ ¤ 70 £ ¤
31 381
15
Keo 232
13
161
Humnoke
£ ¤ 165
England
Coy 15
Allport
31
256
Volume to capacity ratio correlates strongly with traffic congestion. Volume to capacity ratios were obtained from the CARTS Travel Demand Model. Model reflects programmed widening on I-40 and I-57 for 2050 forecast year.
4
Map 26. Level of Service 5
319
Level of Service 2025 Level of Service
A (free flow) B (reasonably free flow) C (stable flow) D (approaching unstable flow) E (unstable flow) F (forced or breakdown flow)
Ward
§ ¥ , 57
305 319
Austin
89
Source: ARDOT
38
5
31
321
0
Cabot
1
² 2
3
4
Miles
321
236
89
236
13
294
89
§ ¦ ¨ 40
31
Carlisle
Lonoke
70 £ ¤ 70 £ ¤
31 381
15
Keo 232
13
161
Humnoke
£ ¤ 165
England
Coy 15
Allport
31
256
Roadway level of service is a measure used to represent roadway operating conditions. Level of Service A represents free-flow traffic. Level of Service F is representative of a high level of congestion with breakdowns in traffic flow. Level of service estimates are from ARDOT.
Map 27. AM Peak Hour Speed Weekdays 5
319
AM AM Peak Peak Hour Hour Average Avg. Speed Speed 0 - 9.9 MPH 10 - 19.9 MPH 20 - 29.9 MPH 30 - 39.9 MPH 40 - 49.9 MPH 50 - 59.9 MPH 60+ MPH
Ward
§ ¥ , 57
305 319
Austin
89
Source: NPMRDS: September 2025 M-TH 7:00 AM - 7:59 AM
38
5
31
321
0
Cabot
1
² 2
3
4
Miles
321
236
89
236
13
294
89
31
Carlisle
Lonoke
70 £ ¤ 70 £ ¤
31 381
15
Keo 232
13
161
Humnoke
£ ¤ 165
England
Coy 15
Allport
31
256
The segments identified correspond to NPMRDS Traffic Management Channels (TMC). Speeds may vary significantly along a TMC. Map reflects the slower direction of travel.
Map 28. PM Peak Hour Speed Weekdays 5
319
AM Peak Hour Avg. Speed PM Peak Hour Average Speed 0 - 9.9 MPH 10 - 19.9 MPH 20 - 29.9 MPH 30 - 39.9 MPH 40 - 49.9 MPH 50 - 59.9 MPH 60+ MPH
Ward
§ ¥ , 57
305 319
Austin
89
Source: NPMRDS: September 2025 M-TH 4:30 PM - 5:30 PM
38
5
31
321
0
Cabot
1
² 2
3
4
Miles
321
236
89
236
13
294
89
31
Carlisle
Lonoke
70 £ ¤ 70 £ ¤
31 381
15
Keo 232
13
161
Humnoke
£ ¤ 165
England
Coy 15
Allport
31
256
The segments identified correspond to NPMRDS Traffic Management Channels (TMC). Speeds may vary significantly along a TMC. Map reflects the slower direction of travel.
Map 29. Congestion Management Process Lower Speed Arterials 5
319
Lower Speed Arterials Average per Day below 25 MPH
0 to 15 Minutes 15 to 30 Minutes 30 to 60 Minutes 60 to 90 Minutes 90 to 120 Minutes Over 120 Minutes
Ward
§ ¥ , 57
305 319
Austin
89
5
October 2024 Weekdays, 6:00 AM to 8:00 PM
Source: NPMRDS
38 31
321
0
Cabot
1
² 2
Miles
321
236
89
236
13
294
89
§ ¦ ¨ 40
31
Carlisle
Lonoke
70 £ ¤ 70 £ ¤
31 381
15
Keo 232
13
161
Humnoke
£ ¤ 165
England
Coy 15
Allport
31
256
The data represented was developed from the Congested Management Process (CMP) that was authored by Metroplan. The CMP shows roadways and delay, by time below set thresholds. More detailed information is available in the CMP document.
3
4
Map 30. Congestion Management Process Higher Speed Arterials 5
319
Higher Speed Arterials Average per Day below 35 MPH 0 to 15 Minutes 15 to 30 Minutes 30 to 60 Minutes 60 to 90 Minutes 90 to 120 Minutes Over 120 Minutes
Ward
§ ¥ , 57
305 319
Austin
89
5
October 2024 Weekdays, 6:00 AM to 8:00 PM
Source: NPMRDS
38 31
321
0
Cabot
1
² 2
Miles
321
236
89
236
13
294
89
§ ¦ ¨ 40
31
Carlisle
Lonoke
70 £ ¤ 70 £ ¤
31 381
15
Keo 232
13
161
Humnoke
£ ¤ 165
England
Coy 15
Allport
31
256
The data represented was developed from the Congested Management Process (CMP) that was authored by Metroplan. The CMP shows roadways and delay by time below set thresholds. More detailed information is available in the CMP document.
3
4
Map 31. Congestion Management Process Freeways 5
319
Freeways Average per Day below 45 MPH 0 to 15 Minutes 15 to 30 Minutes 30 to 60 Minutes 60 to 90 Minutes 90 to 120 Minutes Over 120 Minutes
Ward
§ ¥ , 57
305 319
Austin
89
5
October 2024 Weekdays, 6:00 AM to 8:00 PM
Source: NPMRDS
38 31
321
0
Cabot
1
² 2
Miles
321
236
89
236
13
294
89
§ ¦ ¨ 40
31
Carlisle
Lonoke
70 £ ¤ 70 £ ¤
31 381
15
Keo 232
13
161
Humnoke
£ ¤ 165
England
Coy 15
Allport
31
256
The data represented was developed from the Congested Management Process (CMP) that was authored by Metroplan. The CMP shows roadways and delay by time below set thresholds. More detailed information is available in the CMP document.
3
4
Map 32. Level of Travel Time Reliability (LOTTR) 5
319
Travel Time Reliability LOTTR
Ward
§ ¥ , 57
Reliable Potentially Unreliable Unreliable
305 319
Austin
89
Source: NPMRDS
38
5
31
321
0
Cabot
1
² 2
Miles
321
236
89
236
13
294
89
§ ¦ ¨ 40
31
Carlisle
Lonoke
70 £ ¤ 70 £ ¤
31 381
15
Keo 232
13
161
Humnoke
£ ¤ 165
England
Coy 15
Allport
31
256
The data represented was developed from the National Performance Measures Reliability Data Set (NPMRDS). The information represents Travel Time and how reliable it is for the roadway facilities.
3
4
Map 33. State Freight and Multimodal Facilities 5
319
Multimodal Facilities State freight tiers and Multi-modal facilities
Freight Tier 1 Freight Tier 2 Freight Tier 3 Freight Tier 4 Rail Airport
Ward
§ ¥ , 57
305 319
Austin
89
Source: Metroplan
38
5
31
321
0
Cabot
1
² 2
Miles
321
236
89
236
13
294
89
§ ¦ ¨ 40
31
Carlisle
Lonoke
70 £ ¤ 70 £ ¤
31 381
15
Keo 232
13
161
Humnoke
£ ¤ 165
England
Coy 15
Allport
31
256
The multi-modal data shown is from ARDOT and the State freight plan.
3
4
Map 34. Interstate Truck Travel Time Reliability (TTTR) 5
319
Freight Reliability Ward
§ ¥ , 57
Reliable Potentially Unreliable Unreliable
305 319
Austin
89
Source: NPMRDS
38
5
31
321
0
Cabot
1
² 2
Miles
321
236
89
236
13
294
89
§ ¦ ¨ 40
31
Carlisle
Lonoke
70 £ ¤ 70 £ ¤
31 381
15
Keo 232
13
161
Humnoke
£ ¤ 165
England
Coy 15
Allport
31
256
The data represented was developed from the National Performance Measures Reliability Data Set (NPMRDS). The information represents Travel Time and how reliable it is for the roadway facilities and freight.
3
4
Map 35. Freight Percentage 8%
5
319
15%
Freight Percentage Truck Percentage 20%+
Ward
10% - 19.9% 5% -9%
§ ¥ , 57
305
12%
Austin
89
5
2%-4% 1%
319
Source: ARDOT 2025
38
12%
31
321
0
Cabot
1
² 2
Miles
9% 321
236
5% 89
236
13
294
89
52%
§ ¦ ¨
9%
50%
40
58%
56% 31
7%
Lonoke
Carlisle
70 £ ¤ 12%
70 £ ¤
31 381
5%
15
10% Keo
17% 232
13
13%161
Humnoke
£ ¤ 165
England
Coy 15
Allport
31
42% 7%
256
7%
The freight percentage is available for only a subset of traffic count stations. ARDOT collects and maintains this as part of its traffic count data.
3
4
Map 36. Transportation Improvement Projects 2025-2028 5
319
") ")
Projects Ward
§ ¥ , 57
Capacity \ Widening Pavement Preservation Rehabilitation Project Development
319
Austin
38
) "
5
31
321
Cabot
) "
Interchange \ Ramp Improvements
( Intersection !
305
89
Bridge Replacement \ Preservation
0
1
² 2
Miles
I-57 Widening U.C.- From TIP 2023-2026
321
236
89
236
13 294
89
§ ¦ ¨ 40
31
Carlisle
Lonoke
70 £ ¤ 70 £ ¤
31 381
15
Keo 232
13
161
Humnoke
£ ¤ 165
England
Coy 15
Allport
31
256
The Transportation Implementation Plan (TIP) projects are scheduled near term projects. The TIP represents the current transportation investment guided by Metroplan in Lonoke County.
Source: Metroplan 2025
3
4
Map 38. Strategic Connections 5
319
Strategic Connections Potential Strategic Connections New Connections
Ward
Interstate / Freeway State Highway; US Highway
§ ¥ , 57
Arterial not otherwise classed
305
Federal Aid not otherwise classed
319
Local Road
Austin
89
Source: Metroplan 2025
38
5
31
321
0
Cabot
1
² 2
3
4
Miles
321
236
89
236
13
294
89
§ ¦ ¨ 40
31
Carlisle
Lonoke
70 £ ¤ 70 £ ¤
31 381
15
Keo 232
13
161
Humnoke
£ ¤ 165
England
Coy 15
Allport
31
256
The strategic connections represent potential projects in Lonoke County that are not currently under development/construction but are seen as opportunities to minimize congestion, increase connectivity, and improve travel time reliability. Additional connections, that are not shown on the map will also be necessary to provide new development opportunities in growing areas of Lonoke County.
Map 38. Future Capacity Concerns 5
319
Future Capacity Concerns Potential Strategic Connections Capacity_Issues
Ward
Interstate / Freeway State Highway; US Highway
§ ¥ , 57
Arterial not otherwise classed
305
Federal Aid not otherwise classed
319
Local Road
Austin
89
Source: Metroplan 2025
38
5
31
321
0
Cabot
1
² 2
Miles
321
236
89
236
13
294
89
§ ¦ ¨ 40
31
Carlisle
Lonoke
70 £ ¤ 70 £ ¤
31 381
15
Keo 232
13
161
Humnoke
£ ¤ 165
England
Coy 15
31
256
The capacity needs identified represent roadways where existing capacity may be inadequate to serve future traffic volumes as indicated by the CARTS Travel Demand Model.
Allport
3
4