DECEMBER 2025
The Future of Energy • • • • • •
The Regional Economy in 2025 Moving Cargo Efficiently at LSI Get Ready for an Energy Revolution Electric Vehicles Leading the Trend at Seal Solar Powering from Solar at Lexicon
• Triangle Park at The Port • Pulaski County Reaps the Solar Harvest • Housing Construction • Construction Value • Economic Outlook • Statistical Supplement
Metroplan’s Economic Review and Outlook is an annual chronicle providing economic data and insight for the Little Rock-North Little Rock-Conway MSA. Prepared by: Jonathan Lupton—research, writing, and editing Lynn Bell—layout, editing, and illustrations* Photographs by Metroplan staff except where noted. Acknowledgments This edition of the Metrotrends newsletter, like all others, was helped along by many hands (and minds). We’d like to thank the professionals we interviewed for their insights, photos, and data. And, as always, several members of the Metroplan staff provided vital help with maps (Jeff Runder), building permit data (Iris Woods), and editing (Casey Covington, Tammy Gillis, and Bernadette Rhodes).
This report was funded in part through grant(s) from the Federal Highway Administration and Federal Transit Administration, U.S. Department of Transportation. The views and opinions of the authors expressed herein do not necessarily state or reflect those of the U.S. Department of Transportation. Notice of Nondiscrimination: https://metroplan.org/wp-content/uploads/2023/07/2023TitleVI_flyer2.pdf This notice is available upon request from the Title VI/ADA/504 Coordinator in large print, audiotape or braille. *Digital drawings of solar panels from iStockphoto.com.
About this Edition This edition of the Metrotrends Economic Review and Outlook newsletter covers the customary economic data, but puts its focus on emerging trends in renewable energy. Advancements in solar and electic vehicle technology have brought costs down, creating abundant resources that are good
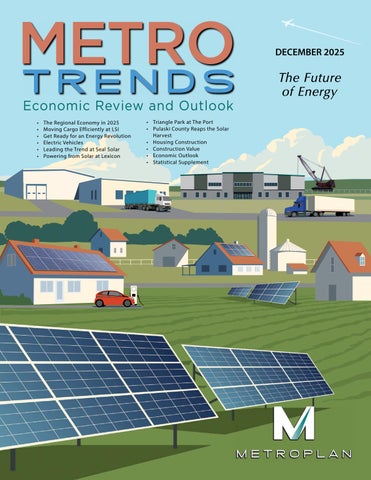
for the environment while creating jobs and saving money for companies and municipalities. The cover art illustrates the burgeoning residential and agriculture uses of solar, as well as electric vehicles and efficient trucks and equipment.
About Metroplan
About CARTS
Metroplan is a voluntary association of local governments that has operated by interlocal agreement since 1955. Originally formed as the Metropolitan Area Planning Commission of Pulaski County, Metroplan now has members in five counties of the six-county metro area. Metroplan is the designated metropolitan planning organization (MPO) under Title 23 of the United States Code.
The Central Arkansas Regional Transportation Study, or CARTS, is the cooperative effort by the participating communities, transportation providers and many other interested parties to develop a long-range transportation plan for the metropolitan area.
Metroplan serves as the regional voice on issues affecting Central Arkansas, develops transportation plans required by federal law, convenes stakeholders to deal with common issues, and provides information and staff resources to our member local governments, the business community, and the public. As part of that mission, Metroplan publishes Metrotrends twice yearly. The spring/summer edition is the Demographic Review and Outlook; the fall/winter edition is the Economic Review and Outlook.
TABLE OF CONTENTS The Regional Economy in 2025 ...........................................................................................................1 Moving Cargo Efficiently at LSI ..........................................................................................................3 Get Ready for an Energy Revolution ..................................................................................................4 Electric Vehicles ....................................................................................................................................5 Leading the Trend at Seal Solar ...........................................................................................................6 Powering from Solar at Lexicon ..........................................................................................................8 Triangle Park at The Port .....................................................................................................................9 Pulaski County Reaps the Solar Harvest ............................................................................................9 Housing Construction ........................................................................................................................10 Construction Value .............................................................................................................................12 Economic Outlook 2026.....................................................................................................................13 Statistical Supplement 2025 ...............................................................................................................14
THE REGIONAL ECONOMY IN 2025 Central Arkansas continues with its track record for steady growth. Job growth has slowed since 2022 but remains above the U.S. average for the 2022–2025 period. In August 2025 the region hosted 402,000 jobs, with a growth rate of 1.3 percent compared with August 2024. U.S. job growth was 0.9 percent over the same interval. Unemployment has ticked up, but only slightly, from a post-pandemic low around 2.6 percent locally to around 3.8 percent in August 2025. This remains a bit lower than the 4.3 percent U.S. average. U.S.A.
Little Rock MSA Employment Trend 98.3 98.7 Employment Trend 2025 January 2022January - August2022–August 2025 98.9 98.9 99.2 99.1 99.4 99.4 99.6 99.5 99.9 99.8 100.3 100.1 100.5 100.5 100.6 100.6 100.9 100.9 101.1 101.2 Dec 2022 101.2 101.3 Jan 2023 101.5 101.8 Feb 2023 101.7 101.8 U.S.A. Little Rock MSA Mar 2023 101.7 102.0 of Labor Statistics. AprSource: 2023 U.S. Bureau 101.9 102.1 Seasonally adjusted index. May 2023 102.0 102.2 U.S.A. Little Rock MSA Unemployment Trend JunJan 2023 102.2 4 102.53.1 Source: U.S. Bureau of Labor Statistics. 2022 January 2022 August 2025 Unemployment Trend January 2025 JulFeb 2023 102.33.8 102.43.1 Seasonally adjusted2022–August index. 2022 Aug 2023 102.4 102.6 4.5 Mar 2022 3.7 3.0 Sep 2023 102.53.7 102.93.1 Apr 2022 4 Oct 2023 102.63.6 103.13.0 May 2022 Nov 2023 102.73.6 103.13.2 Jun 2022 3.5 Dec 2023 102.93.5 103.43.1 Jul 2022 Jan 2024 103.0 Aug3 2022 3.6 103.33.1 Feb 2024 103.1 103.4 Sep 2022 3.5 3.0 Mar2.5 2024 103.3 103.7 Oct 2022 3.6 2.9 Apr 2024 103.3 103.9 Nov 2022 3.6 2.9 May 2024 103.5 104.1 2 Dec 2022 3.5 2.7 Jun 2024 103.5 104.1 Jan 2023 3.5 2.7 Jul 2024 103.6 104.4 Feb 2023 3.6 2.7 Aug 2024 103.6 104.5 Mar 2023 3.5 2.7 U.S.A. Little Rock MSA Sep 2024 103.8 104.8 Apr 2023 2.6 of3.4 Labor Statistics, OctSource: 2024 U.S. Bureau 103.8 104.7 seasonally adjusted. May 2023 Nov 2024 104.03.6 104.92.8 Jun 2023 U.S. Bureau of Labor Statistics, seasonally adjusted. Dec 2024 104.23.6 105.02.9 2023 3.5 105.02.9 JanJul 2025 104.3 The2023 table at right conveys Location Quotient (LQ) of regional economic Aug Feb 2025 104.33.7 105.33.1 sectors, comparison Sep 2023 in 104.4 3.8 105.5with 3.2 the U.S. average. Any LQ score above 1.0 Mar 2025 2023 greater-than-average suggests emphasis, while sectors with scores below 1 AprOct 2025 104.53.9 105.53.2 Nov 2023 3.7 3.2 are smaller than the U.S. average. You can quickly see the region’s highest Dec 2023 3.8 3.3 score Warehouse and Utility sectors. It is also Jan 2024is in the Transportation, 3.7 3.0 above in the closely Feb 2024average 3.9 3.1 related Wholesale Trade sector. Mar 2024 3.9 3.2 Apr 2024 3.9 3.2 May 2024 4 3.3 Jun 2024 4.1 3.2 METROTRENDS Jul 2024 4.2 3.3 Aug 2024 4.2 3.2 Sep 2024 4.1 3.1 May 2025
Jul 2025
Jul 2025
May 2025
Mar 2025
Jan 2025
Jan 2025
Mar 2025
Sep 2024
Nov 2024
Nov 2024
Jul 2024
Sep 2024
May 2024
Jul 2024
May 2024
Jan 2024
Mar 2024
Mar 2024
Nov 2023
Jan 2024
Nov 2023
Jul 2023
Sep 2023
Sep 2023
May 2023
Jul 2023
May 2023
Mar 2023
Jan 2023
Mar 2023
Nov 2022
Jan 2023
Jul 2022
Sep 2022
Nov 2022
May 2022
Jul 2022
Sep 2022
Jan 2022
Mar 2022
May 2022
Mar 2022
Jan 2022
Index: Year 2022 = 100.0
Jan 2022 Feb 2022 107.0 Mar 2022 106.0 Apr 2022 105.0 May 2022 104.0 Jun 2022 103.0 Jul 2022 102.0 Aug 2022 101.0 Sep 2022 100.0 99.0 Oct 2022 98.0 Nov 2022
Jobs in Little Rock MSA August 2025
402,400 Not seasonally 401,000 adjusted Seasonally adjusted
Unemployment Rate Comparison August 2025 U.S. Little Rock MSA Seasonally adjusted Not seasonally adjusted
4.3 4.5
3.8 3.9
Source: U.S. Bureau of Labor Statistics. Jobs data from Nonfarm payroll jobs series.
Location Quotients of Regional Economic Sectors Little Rock MSA Industry Sectors
Location Quotient
Mining + Construction
0.93
Manufacturing
0.68
Wholesale Trade
1.15
Retail Trade
1.01
Transp., Warehouse, Utility
1.27
Information
0.67
Financial
1.21
Professional / Bus. Svcs.
0.84
Health / Education
1.03
Leisure + Hospitality
0.85
Other Services
1.23
Government
1.21
Source: U.S. Bureau of Labor Statistics.
2025 ECONOMIC REVIEW & OUTLOOK | 1
The region continues to develop its role in logistics and transportation. Major shifts in the international trading order have fed recent demand for logistical and warehousing services, and the local area has responded with shovel-ready site availability and a quick approval process. Local labor force participation continues growing, reaching 50 percent of population in 2025. The labor force matched its 2019 pre-Covid peak by 2023 but has continued making gains as a share of population. While low local unemployment rates could suggest a labor shortage, participation growth suggests ambitious firms can find a growing supply of willing workers. Central Arkansas plays a prominent role in a business sector that gets little public attention: power grid management. Recent data analysis has revealed that the region holds about 6 percent of all U.S. jobs in NAICS category 221121, “Bulk Electric Power Transmission.” Two firms, MISO and the Southwest Power Pool, dominate this local sector, with about 1,750 jobs by the most recent count. This amounts to a local LQ of over 25.0—probably the highest in the regional economy, and hence a
Known Estimated 2019 47.8% 2020 46.9% 2021Central 46.4% Arkansas Labor Force Share of Population 2019–2025 2022 47.2% 51.0% 2023 47.9% 50.0% 2024 49.4% 49.4% 50.0% 49.0%2025 50.0%
Central Arkansas Labor Force Share of Population 2019-2025 49.4%
48.0% 47.0%
47.8% 46.9%
46.0% 45.0% 2019
2020
-1.1%
Wholesale Trade Trade Wholesale Manufacturing Manufacturing Mining/Construction Mining + Construction -2.3%
2022
2023
2024
2025
Estimated
1. Decennial Census 2020.
2. Metroplan population estimates and interpolations. 3. U.S. Bureau of Labor Statistics.
Warehousing and transportation have been winners for the regional economy in recent years.
Jobs by Industry
6.7%
2.2%
-0.1% 2.3%
-0.7%
2021
Known
0.0% 0.5%
Retail Trade Retail Trade
46.4%
Sources: Decennial Census 2020. Metroplan population estimates and interpolations. U.S. Bureau of Labor Sources: Statistics.
-0.2%
1.0%
47.9%
44.0%
US Little Rock MSA Percent Job Change by-2.3% Sector2024–2025 2024-25 Mining + Construction 0.4% Percent Job Change by Sector Manufacturing -0.7% 2.3% Government Wholesale Trade -0.1% 0.4% -1.1% Government 0.5% RetailOther Trade 0.5% 0.0% Services -1.6% Other Services 1.2% Transp., Warehouse, Utility 1.0% 2.2% Leisure/Hospitality 5.0% Information -0.2% -2.0% Leisure + Hospitality 1.3% Financial 0.8% 0.7% Health/Education Health / Education 3.2% Professional / Bus. Svcs. -0.3% -1.6% Health / Education 3.2% 6.7% -1.6% Professional/Business Svcs Professional / Bus. Svcs. -0.3% Leisure + Hospitality 1.3% 5.0% 0.7% Financial Services Other Services Financial 1.2% -1.6% 0.8% Government 0.5% 0.4% Information Services -2.0% Information Transportation/ Transp., Warehouse, Utility Warehousing/Utilities
47.2%
The chart at left compares job change by industry for the U.S. and Central Arkansas economies. Over the past year the regional economy has been gaining jobs faster than the U.S. average in most sectors. Local outperformance has been notable in the large health/ education sector, as well as leisure and hospitality, manufacturing, and in the transportation, utility and warehousing sectors. It also continues to gain jobs in finance and government.
0.4%
-3.0% -2.0% -1.0% 0.0% 1.0% 2.0% 3.0% 4.0% 5.0% 6.0% 7.0% 8.0%
Little Rock MSA
US
Source: U.S. Bureau of Labor Statistics.
2 | 2025 ECONOMIC REVIEW & OUTLOOK
METROTRENDS
major economic driving force. This important sector has seen substantial national job growth since about 2022. This growth has been driven by demand growth (data centers) and the need to improve transmission response for outages related to extreme weather.
Jan 2025
Jun 2025
Aug 2024
Oct 2023
Mar 2024
May 2023
Jul 2022
Dec 2022
Feb 2022
Apr 2021
Sep 2021
Nov 2020
Jan 2020
Jun 2020
Aug 2019
Oct 2018
Mar 2019
May 2018
Jul 2017
Dec 2017
Feb 2017
Apr 2016
Sep 2016
Nov 2015
Jan 2015
Jun 2015
Despite today’s electricity market pressures—or because of them—a revolution is underway in renewable energy that has the potential to transform shortfall into abundance. Solar is already one of the lowest-cost energy sources, and performance continues improving. This edition of the Metrotrends Economic Review and Outlook will describe this unexpected energy metamorphosis.
Emp (x 1,000) Jan 2015 25.9 U.S. in NAICS 221121 U.S.Jobs Jobs in NAICS 221121 Feb 2015 26.1 Electric Power Transmission ElectricBulk Bulk Power Transmission Mar 2015 26.2 30.0 Apr 2015 26.3 May 2015 26.4 29.0 Jun 2015 26.6 28.0 Jul 2015 26.6 27.0 Aug 2015 26.5 Sep 2015 26.4 26.0 Oct 2015 26.5 25.0 Nov 2015 26.6 24.0 Dec 2015 26.6 23.0 Jan 2016 26.5 Feb 2016 26.7 22.0 Mar 2016 26.6 Apr 2016 26.6 May 2016 26.6 Source: U.S. Bureau Jun 2016 26.8 of Labor Statistics. Jul 2016 26.8 Aug 2016 26.7 Source: U.S. Bureau of Labor Statistics. Sep 2016 26.5 Oct 2016 26.4 Nov 2016 26.4 Dec 2016 26.3 Jan 2017 26.3 Feb 2017 26.0 bulk products, reducing emissions while also Mar 2017 26.0 cutting down on wastage. LSI manages a Apr 2017 26.0 May 2017 26.1 wide variety of products, including steel and Jun 2017 26.5 aluminum coils, fertilizer, petcoke, wetcake, Jul 2017 26.8 and bauxite. Aug 2017 26.7 Sep 2017 26.7 Oct 2017 26.8 LSI is also in the warehousing business, a Nov 2017 26.8 growing market segment in today’s trading Dec 2017 27.0 environment. It offers bonded warehouses, Jan 2018 27.0 Feb 2018 26.9 meaning self-contained storage space giving Mar 2018 27.1 customers the same advantages as a foreign Apr 2018 27.2 May 2018 27.0 trade zone, but on a more economical scale. Jobs (x 1,000)
Energy demand has been a prominent news issue lately, with growing concerns about constrained electricity supply. Whether the problem stems from growing power demand from data centers, crypto-mining, automation-related electrification of machinery and tools, or general economic growth, customer bills are showing the strain. Over the short term, there is a looming anxiety about electric power shortage.
MOVING CARGO EFFICIENTLY AT LSI Logistic Services, Inc. (LSI) uses cranes to lift cargoes from barges and trains onto trucks, a small but indispensable part of operations at the Port of Little Rock. LSI participates in a 2024 Sustainability Plan sponsored by its corporate owners, reducing emissions while improving productivity. Its new Manitowoc crane—built in the U.S.A.— operates with about 60 percent less diesel fuel, on an hourly basis, than the crane it replaced. In 2026, another crane will be retired and a more efficient one added. LSI’s new systems include a link belt material handler that yields 35 to 40 percent lower carbon emissions, while moving materials faster than the former machine. LSI also emphasizes dust mitigation with
This new crane at LSI lifts steel coils more quickly, with less energy use, than its predecessor. Photo credit: Logistic Services.
Carrix, LSI’s parent company, is the world’s largest privately-held marine and rail terminal operator. It manages over 250 locations on five continents.1
1portoflittlerock.com/2024/01/logistics-services-inc-the-port-of-little-rocks-stevedoring-partner/
METROTRENDS
2025 ECONOMIC REVIEW & OUTLOOK | 3
GET READY FOR AN ENERGY REVOLUTION In 2012, photovoltaic (PV) electricity was a tiny but fastgrowing industry. In that year, the U.S. Energy Information Administration (EIA) forecast that PV capacity would triple in less than three decades: the U.S. would generate 6.16 BkWh1 of grid electricity from PV power by 2030. Instead, solar went exponential. By 2016 PV electricity generation had zoomed above 19 BkWh—more than five times the amount forecast for the year 2030 by the EIA back in 2012.
7/1/2025
2/1/2025
9/1/2024
4/1/2024
6/1/2023
11/1/2023
1/1/2023
2004 791 2005 875 200,000 2006 981 150,000 1,280 2007 2008 1,938 100,000 2009 2,334 2010 50,000 3,492 2011 5,429 2012 0 10,123 1995 2000 2005 2010 2015 2020 2025 2030 2013 17,268 Source: U.S. Energy Information Administration. 2014 28,924 2015 39,032 2016 54,866 2017 77,277 2018 93,365 1 Billion 2019Kilowatt-hours. 106,894 2 Rachel “The Power of Positive Tipping Points,” Economist August 15, 2025. 2020 Dobbs, 130,721 3 Conservative estimate, making allowance for seasonal variations. 2021 164,422 4 “The Sun Machines,” Economist, June 22 2024. 2022 205,074 2023 238,937 303,167 2025 ECONOMIC REVIEW & OUTLOOK 4 |2024
8/1/2022
Million Kilowatt Hours (KwH)
Actual 2024Forecast 20Forecast 2030 (In 2012) 2000 598 Information Source: U.S. Energy Administration. 350,000 PV Solar 2001 201.07 669 143.46 6.16 Actual 2024Forecast 20Forecast 2030 (In 2012) 300,000 PV Solar 2002 201.07 704 143.46 6.16 Actual 2024Forecast 2003 709 20Forecast 2030 (In 2012) PV Solar 250,000 201.07 143.46 6.16
Arkansas thousand megawatthours Arkansas Solar Energy Generation Arkansas Utility-Scale Utility-Scale Solar Energy Generation (thousand 12/1/2015 0.927 (thousand megawatt hours) megawatthours) 1/1/2016 1.47304 2/1/2016 1.81143 600 3/1/2016 1.72461 500 4/1/2016 1.92271 5/1/2016 1.78677 400 6/1/2016 2.37569 7/1/2016 2.58657 300 8/1/2016 2.10249 9/1/2016 2.81818 200 10/1/2016 2.82317 11/1/2016 2.34538 100 12/1/2016 2.37198 0 1/1/2017 1.41498 2/1/2017 1.5851 3/1/2017 2.69493 4/1/2017 3.01716 5/1/2017 3.4254 Source: U.S. Energy Information Administration. 6/1/2017 3.287 7/1/2017 3.46 8/1/2017 2.55649 Source: U.S. Energy Information Administration. 9/1/2017 3.2058 10/1/2017 2.74413 11/1/2017 1.71799 12/1/2017 1.70254 1/1/2018 13.34838 2/1/2018 9.41151 3/1/2018 20.08064 4/1/2018 19.51915 5/1/2018 22.61139 3/1/2022
Solar ElectricityGeneration Generation 2000–2024 2000-2024 U.S.U.S. Solar Electricity
5/1/2021
Source: U.S. Energy Million KwHInformation Administration.
10/1/2021
100 150 200 250 Actual 2024 201.07 BkWh (Billions of Kilowatt-hours) 0 50 100 150 200 250 Source: U.S. Energy Information Administration. BkWh (Billions of Kilowatt-hours) 0 50 100 150 200 250 Source: U.S. Energy Information Administration. BkWh (Billions of Kilowatt-hours)
7/1/2020
50
12/1/2020
201.07 0
2/1/2020
Actual 2024
201.07
9/1/2019
143.46
4/1/2019
Forecast 2030 (In 2016) Actual 2024
What about Arkansas? It lags in clean energy trends, right? Yet state solar electricity has roughly quadrupled in the past two years.3 Solar output that was negligible as recently as 2017 is now powering factories, EV charging stations, houses, offices, and farms. Charts_PV_25b.xlsx
6/1/2018
143.46
11/1/2018
143.46
Forecast 2030 (In 2016)
1/1/2018
6.16
8/1/2017
Forecast 2030 (In 2012) Forecast 2030 (In 2016)
3/1/2017
6.16
5/1/2016
Forecast 2030 (In 2012)
10/1/2016
U.S. Energy Information Administration PV Electricity Forecasts U.S. Energy InformationAdministration Administration U.S. Energy Information PV Electricity Forecasts Forecast 2030 (In 2012) 6.16 PV Electricity Forecasts
There are qualifying factors. Solar electricity is affected by weather and season. Solar requires storage, and must be balanced with other sources to maintain steady power flow. Technologies for countering these issues are also growing exponentially—especially battery storage. Federal policies have shifted over the past year, and this will slow the growth in solar energy—but only slightly.2
12/1/2015
The forecast-shattering trend has not stopped. In 2024, the U.S. generated over 201.7 BkWh of solar power. This is 40 percent more than the IEA forecast back in 2016 for the year 2030. U.S. solar generation grew by a factor of nine from 2014 to 2024. In short, forecasts in recent years have consistently undershot the exponential growth that is occurring in solar U.S. Energy Information Administration energy. PV Electricity Forecasts
METROTRENDS
Chart3
What is happening with solar power today is less a clean energy agenda than a technological revolution, propelled by continuing cost reductions to inputs like the polysilicon for solar panels. Impacts will go far beyond potentially reducing carbon emissions. When energy gets cheaper, people use it more. Power-intensive practices that were once too expensive will become affordable.4 Just as the advent of coal energy once jump-started industrialization, PV electricity has the potential to transform the world as we know it.
ELECTRIC VEHICLES While EVs remain a small portion of the vehicle fleet, their use is growing rapidly. With the help of a CPRG grant* from the EPA, Metroplan is assisting with funding for charging stations across Central Arkansas. So far, nine have been
installed. You may be driving an electric vehicle sooner than you think, thanks to a continuing revolution in energy and battery technology. These chargers will help make the transition.
Through the CPRG grant, Metroplan is helping fund charging stations in towns like Keo (Mayor Stephanie White pictured at left) and England and assisting cities such as Little Rock with the costs of an EV fleet.
EV Charger Suitability Tool Heat Map Preview The image on the left depicts the Suitability Analysis Tool developed by Metroplan. It is a web-based heatmap tool that assists with identifying likely sites for EV charger deployment based on factors like multi-family housing density and workforce concentration.
This screenshot illustrates the tool’s interactive heat map interface, highlighting zones scored for high-priority charger deployment based on combined criteria like residential density and traffic flow.
* This refers to a $99.9 million Climate Pollution Reduction Grant (CPRG) from EPA to Metroplan in a tri-regional coalition of Central Arkansas with the Northwest Arkansas Regional Planning Commission and the City of Fort Smith. Total Funding: $99,999,999 Central Arkansas Award: $49,250,000
METROTRENDS
2025 ECONOMIC REVIEW & OUTLOOK | 5
LEADING THE TREND AT SEAL SOLAR In 2012, Seal Energy Solutions opened for business, providing energy audits and insulation upgrades for businesses and homes—the term “seal” refers to sealing leaks for improved energy efficiency. The business was highly successful, but around 2016 its team grew excited about the promising trends in solar energy, and by 2019, with a name adjustment, the switch to solar was complete. Today Seal Solar installs photovoltaic (PV) solar panels and batteries with a staff of about 40 employees.
Seal Solar does most of its business with commercial customers. Solar is particularly effective in agriculture, with critical activities like irrigation water-pumping and grain drying that demand heavy (and expensive) power loads. Solar pays back quickly for these customers. As solar energy gains economic prominence, it offers job opportunities for installation and maintenance.
We talked with Josh Davenport and J.D. Poole at Seal Solar, and gained crucial insights into their business and the future of solar energy in Arkansas. Electrical demand is surging, propelled in part by the rapid expansion in data centers for AI. Also, more energy users are switching to electric power. Electric systems tend to last longer than fossil fuel alternatives. For example, a typical solar array has a warrantied life cycle of about 25 years. Even after the warranty expires, panels typically remain about 80 percent efficient.
Grain drying is energy-intensive and often located in remote areas. This makes it a good match for “behind the grid” solar power.
“Solar will continue to grow despite changes in federal policy. There are multiple utility scale projects to be constructed over the next few years.” —J.D. Poole, Vice President of Special Projects and Marketing, Seal Solar
With the help of USDA Rural Development, Rusty Tractor is Arkansas' first 100 percent solar powered vineyard. All photos on this spread courtesy of Seal Solar.
6 | 2025 ECONOMIC REVIEW & OUTLOOK
With a compact battery like this, residential users get a backup generator for emergencies when the grid goes down.
METROTRENDS
State law on “net metering” changed in late 2024, meaning solar providers selling electricity back to the grid are compensated at lower wholesale rates, rather than retail rates. This has tended to shift the business toward larger solar arrays to gain economies of scale. More operations are now “behind the meter,” i.e. providing power directly and off the main grid. At the same time Seal Solar also does business with residential customers. Higher interest rates since 2022 have increased costs and dampened demand, but Seal Solar still serves residential customers, often filling the gap as other businesses exit the sector in face of altered federal policies. Seal Solar sees opportunity in its Arkansas home environment. The state gets a lot of sunshine, with plenty of flat land without shade, especially in the Delta region. Despite criticism about displacing land, solar only occupies about 0.2 percent of the state’s agricultural land, and even in case of an “extreme level of solar development,” would still use less than 1 percent. There is a niche to develop a “green collar” workforce around the local solar industry. Tariff requirements give an edge to domestic manufacturing, and the state is notable for its rapidresponse workforce development.
Solar installations tend to repay their costs quickly, with a lengthy service life of low-cost power.
The winding down of federal tax incentives has added some headwinds for the solar industry. Solar costs have nevertheless fallen below those of fossil fuels, and will keep dropping.1 The business prospect remains promising.
The LRCSP Community Solar array powers Loblolly Creamery, Christ Episcopal Church, Root Café, the Community Bakery, and two private residences.
“We’re proud of our team’s ability to work together in high pressure situations to meet our common goals.” —The Seal Solar Team
1 Economist, September 16, 2025. Renewable Power Generation Costs in 2023, International Renewable Energy Agency. Annual Energy Outlook 2025, U.S. Energy Information Administration.
METROTRENDS
2025 ECONOMIC REVIEW & OUTLOOK | 7
POWERING FROM SOLAR AT LEXICON Lexicon, Inc. is headquartered in Little Rock and employs 3,400 workers nationwide. It runs steel fabrication shops—one at the Port of Little Rock and two in Blytheville— and is also an industrial contractor and a builder of golf courses. Lexicon does not make steel; it assembles steel parts into units like industrial beams and girders. While much fabrication is done on-site, the company also builds industrial facilities, like data centers and giant warehouses. It builds huge industrial sites for steel and auto manufacturers, including all the steel mills in northeast Arkansas near Blytheville. This business of assembling steel parts demands a lot of electric power. A few years ago, boosted by federal incentives, Lexicon contracted with Seal Solar to build two solar arrays shown in the table: Location
Acreage
Capacity
Lonoke County
20
2.5 mw
Mississippi County
10
0.95 mw
This has proven a winner, even after changes in state netmetering laws that have reduced compensation for solar contributions to the grid. In economic terms, by using solar, Lexicon offsets 70% of its electric usage in Arkansas, albeit with some variability due to monthly weather. This is more than good budgeting. It also helps win contracts to build industrial facilities from Hyundai, Volkswagen, Tesla and others— international companies which have pledged to reduce emissions.
Lexicon hard at work on one of the nation’s most environmentally advanced steel mills.
While robots do about 20 percent of the work, Lexicon nurtures its human workforce and partners with local education providers—especially Mills High School—to train youthful programmers, welders and fabricators. The company now flies drones over its construction sites to perform quality checks and measurements that speed production and improve overall efficiency. Work has shifted in just a few years from manual measurement and riveting to using CNC machines that assemble parts with unprecedented precision at speeds considered impossible a few short years ago. Solar energy is quietly behind the scenes, powering a thriving and growing enterprise.
"It's already paid for itself, after only four or five years." —Jeff Weatherly, Lexicon CFO
Making sparks, shaping steel, and helping build the future one weld at a time at Lexicon.
All photos on this page courtesy of Lexicon. 8 | 2025 ECONOMIC REVIEW & OUTLOOK
Viji Kuruvilla, VP of Quality, speaking with students and teachers at Mills High School after the grand opening of their new welding lab—proudly sponsored by Lexicon.
METROTRENDS
TRIANGLE PARK AND WETLANDS AT THE PORT It doesn’t look like much right now, but the Port of Little Rock is working with the Audubon Society and Applied Land Restoration (ALR) to convert 29 acres of former soybean fields into a wetland nature preserve. It will become a birding habitat featuring native trees and plants, with an emphasis on pollinator species. A boardwalk will allow the visiting public to cross the wetland on foot, bike or wheelchair, enjoying the colors, as well as the tweets, chirps, and croaks of nature. Wetlands are rich and vital natural habitats, also filtering and improving water quality while reducing flooding problems nearby.
By adding the Triangle Park to the Fourche Bayou Mitigation Bank, stream and wetland offset credits will be sold to private developers permitting building sites elsewhere within the port. Over coming years, the Port of Little Rock intends to develop three additional wetland sites, tallying up to 500 additional acres. Since the Port’s land area includes sizeable wetland areas, having 500+ acres of stream and wetland credits on offer will make it easier for firms to move in and develop their sites for manufacturing and warehousing, with economic benefits for the entire Central Arkansas region. Triangle Park
Triangle Park
e
Conceptual stream design image (above) courtesy of Applied Land Restoration. At left: Property dedicated to Fourche Bayou Mitigation Bank.
PULASKI COUNTY REAPS THE SOLAR HARVEST With solar arrays at the Port of Little Rock and near the County Detention Center, Pulaski County government generates about 90 percent of the electricity it uses. This saves about $250,000 every year. As Pulaski County Judge Barry Hyde said, “To be innovative requires commitment and belief that there are more efficient ways to do things. Flipping the switch and bringing this solar array online is the result of a tremendous amount of resolve, planning and a desire to propel Pulaski County into the 21st Century.”
METROTRENDS
2025 ECONOMIC REVIEW & OUTLOOK | 9
HOUSING CONSTRUCTION
Most cities in the region made gains in single-family construction over the past year. Sherwood saw an 86 percent gain, Little Rock rose 61 percent, and Vilonia climbed 43 percent. Only Bryant and Cabot saw fewer new homes built, compared with the previous year.
Multi-family construction remains focused in the region’s largest cities, with Little Rock, Conway and North Little Rock leading the pack. In multi-family most cities were down, although North Little Rock saw a big jump mainly boosted by more units at the Pointe North Hills in Lakewood. Little Rock is seeing multi-family growth in its southwest region. Single-family housing in the area ran a bit above the national trend in 2023 and 2024. Although the local trend sees upward and downward ticks, itCharts_Bldg_Perm_25b is tracking the national average and will respond positively to a decline in the Federal Reserve’s prime rate in the summer of 2025.
2025 Q2
2025 Q1
2024 Q4
2024 Q3
2024 Q2
2024 Q1
2023 Q4
2023 Q3
2023 Q2
2023 Q1
2022 Q4
2022 Q3
2022 Q2
7/1/2025
2022 Q1
4/1/2025
10/1/2024
7/1/2024
4/1/2024
1/1/2024
7/1/2023
10/1/2023
4/1/2023
1/1/2023
7/1/2022
10/1/2022
4/1/2022
1/1/2022
7/1/2021
10/1/2021
4/1/2021
1/1/2021
MPRIME January 2021 to September 2025 2021 to September 2025 1/1/2021 3.25 92/1/2021 3.25 3.25 83/1/2021 4/1/2021 3.25 7 5/1/2021 3.25 6 6/1/2021 3.25 57/1/2021 3.25 48/1/2021 3.25 3.25 39/1/2021 10/1/2021 3.25 2 11/1/2021 3.25 1 12/1/2021 3.25 01/1/2022 3.25 2/1/2022 3.25 3/1/2022 3.37 4/1/2022 3.5 5/1/2022 3.94 6/1/2022 4.38 7/1/2022 4.85 8/1/2022 5.5 9/1/2022 5.73 | 2025 ECONOMIC 10 10/1/2022 6.25 REVIEW & OUTLOOK 11/1/2022 6.95 12/1/2022 7.27
1/1/2025
2021 Q4
2021 Q3
2021 Q2
2021 Q1
SFLittle Rock MF MSA Quarterly Total New Housing Unit Permits 2021 Q1 2021 Q1 Little Rock 430 MSA 620 1050 Quarterly New 2025 Housing Q3 Unit Permits 2021 Q1–2025 Q3 2021 Q2 513 48 561 1400Q3 2021 455 54 509 2021 Q4 510 764 1274 1200 2022 Q1 473 260 733 1000 2022 Q2 455 382 837 2022 344 104 448 800Q3 2022 Q4 251 341 592 600 2023 Q1 304 385 689 400Q2 2023 363 83 446 2023 329 111 440 200Q3 2023 Q4 292 865 1157 20240Q1 369 274 643 2024 Q2 350 18 368 2024 Q3 362 236 598 Charts_Bldg_Perm_25b MF Total 2024 Q4 442 29 471SF 2025 Q1 483 373 856 2025 Q2 392 222 614 Federal Reserve Prime Interest Rate 113 Federal Reserve Prime Interest Rate 2025 Q3 448 January 561
2025 Q3
Regional housing construction is making steady progress. Single-family construction rose about 29 percent over the past year, while multi-family was down 47 percent. Total new housing units were down slightly compared with the previous year. The chart below shows the quarterly trend. As usual, single-family has churned along steadily in recent years while multi-family construction has more up-and-down bounce to it.
Multi-family housing in North Little Rock’s Argenta neighborhood continues an expanding trend of infill housing in Central Arkansas.
Chart1
METROTRENDS
Charts_Bldg_Perm_25b
Single-Family Construction Trend
US LR MSA Single-Family Construction Trend January 2021 January 2021 to September 2025to September 2025
Jul 2025
Jan 2025
Apr 2025
Oct 2024
Jul 2024
Apr 2024
Jan 2024
Oct 2023
Jul 2023
Apr 2023
Jan 2023
Oct 2022
Jul 2022
Apr 2022
Jan 2022
Oct 2021
Jul 2021
Apr 2021
Jan 2021
Index: Year 2021 = 100.0
Jan 2021 110.5 101.0 250.0 Feb 2021 114.2 142.2 Mar 2021 90.3 200.0 83.5 Apr 2021 85.7 70.5 150.0 93.2 May 2021 98.6 Jun 2021 87.8 131.7 100.0 Jul 2021 100.4 95.1 Aug 2021 98.6 113.9 50.0 Sep 2021 105.4 110.8 Oct 20210.0 107.6 92.3 Nov 2021 114.6 87.3 Dec 2021 113.2 105.7 Jan 2022 110.3 105.0 US LR MSA Feb 2022 105.6 127.5 Mar 2022 85.6 81.1 Apr 2022 93.5 108.6 May 2022 Little 96.3 79.1 Quarterly Housing Units by Type Rock MSA Jun 2022 100.3 102.3 2021–2025 Jul 2022 121.4 115.6 SINGLEMULTITOTAL Aug 2022 113.2 156.0 FAMILY FAMILY HOUSING Sep 2022 129.5 157.5 UNITS Oct 2022 139.2 203.4 2021 Q1 430 620 1,050 Nov 2022 165.0 159.1 Dec 2022 182.7 226.3 2021 Q2 513 48 561 Jan 2023 172.6 126.5 2021 Q3 455 54 509 Feb 2023 156.0 180.5 2021 Q4 510 764 1,274 Mar 2023 115.2 182.6 Apr 2023 121.6 140.9 2022 Q1 473 260 733 May 2023 102.7 142.2 2022 Q2 455 382 837 Jun 2023 100.2 118.1
Total Units Permitted Over Previous Year-to-Date Oct 23 - Sep 24
Oct 24 - Sep 25
Single-Family
1,373 Compiled by
Multi-family
1,393Metroplan
1,765 737
Total Units
10/22/2025 2,766
2,502
Single-family Housing Units Permitted Over Previous Year-to-Date City
Oct 23 Sep 24
Oct 24 Sep 25
Percent Change
Benton
223
248
11.2%
Bryant
139
122
-12.2%
Cabot
97
70
-27.8%
Conway
129
138
7.0%
Jacksonville
80
112
40.0%
Little Rock
342
551
61.1%
689
Maumelle
89
110
23.6%
83
446
N Little Rock
175
230
31.4%
329
111
440
Sherwood
99
184
85.9%
2023 Q4
292
865
1,157
Vilonia
75
107
42.7%
2024 Q1
369
274
643
2024 Q2
350
18
368
2024 Q3
362
236
598
2024 Q4
442
29
471
Benton
2025 Q1
483
373
856
Bryant
2
8
0
17
2022 Q3
344
104
448
2022 Q4
251
341
592
2023 Q1
304
385
2023 Q2
363
2023 Q3
Chart3
Multi-family Housing Units Permitted Over Previous Year-to-Date City
Oct 23 Sep 24
Oct 24 Sep 25
180
0
2025 Q2
392
222
614
Cabot
2025 Q3
448
113
561
Conway
668
80
Jacksonville
24
38
Little Rock
500
399
Maumelle
0
0
N Little Rock
19
185
Sherwood
0
10
Vilonia
0
0
METROTRENDS
2025 ECONOMIC REVIEW & OUTLOOK | 11
Page 1
Perm_Val_Trend_Chart_2010-2024.xlsx
CONSTRUCTION VALUE
x $ 1 million
Regional construction value receded by about 14 percent in 2024 compared with the previous year. This reflects a moderate economic slowdown due to high interest rates. The region nonetheless saw $1.3 billion in new construction. Residential construction only dropped by 7.6 percent, reflecting continued demand for new housing in a growing regional economy.
LR-NLR-Conway Permit Value Trends by Type Residential Central ArkansasConstruction Construction Value bybyType 2010-2024 Central Type 2010–2024 New ResidentArkansas Repair/Addition on-Resident Value Total 1,800.0 2010 347.1 63.0 460.7 870.8 2011 1,600.0 316.2 59.6 382.8 758.6 2012 1,400.0 350.6 59.5 526.4 936.5 2013 1,200.0 337.8 68.1 477.0 883.0 2014 285.9 109.9 691.2 1,087.0 1,000.0 2015 308.8 61.3 564.0 934.1 800.0 2016 309.3 75.6 499.9 884.8 2017 600.0 403.6 92.5 577.7 1,073.8 2018 400.0 395.3 71.4 790.7 1,257.4 2019 200.0 455.3 78.9 578.4 1,112.6 2020 500.6 96.6 471.0 1,068.2 2021 654.8 101.6 454.9 1,211.4 2022 568.0 110.1 586.7 1,264.8 New Residential 131.1Residential Repair/Addition Non-Residential 2023 554.0 848.1 1,533.2 City_Medians_2024.xlsx 2024 512.4 114.3 679.6 1,306.4
2024
2023
N. Little Rock
2022
Jacksonville
2021
175,000 159,000 107,881 Benton
Cabot
Sherwood
7 Benton 8 Jacksonville 9 N. Little Rock
2020
2019
2018
2017
2016
2015
Bryant
2013
2014
Little Rock
2012
Conway
389,000 107,881 254,000
Compiled by Metroplan 9/12/2025
2004 2005 2006 2007 2008 2009 2010 2011 2012 2013 2014 2015 2016 2017 2018 2019 2020 2021 2022 2023 2024
Maumelle
Maumelle 50,000
N. Little 0Rock Median Value Rock MSA Median Permitted ValueValue of Newof Little Rock MSA Median Permitted Sherwood 2004 Little 150,979 Single-Family Homes 2005 160,592 New Single-family Homes 2006 160,207 280,000 254,680 2007 155,818 260,000 2008 155,064 240,000 2009 146,064 220,000 2010 158,761 2011 144,910 230,235 200,000 2012 154,473 180,000 2013 181,148 160,000 2014 170,912 2015 175,999 140,000 2016 190,099 120,000 2017 184,734 100,000 2018 196,874 2019 193,420 2020 198,711 2021 231,436 2022 246,805 Central Arkansas Construction Value ($ millions) 2023 230,235 Compiled by 2023 and 2024 2024 254,680 Metroplan
2011
2010
The median value for new homes climbed to $254,680. As always, this is the median value calculated from building permit records; market observation suggests the initial selling price for homes is roughly double the stated permit value. The chart at right depicts new homes by stated value. Median New Single-Family Housing Permit Values 2024 Median NewHouse House Permit Permit Value 2024 Median New Value 2024 -0.14791 Maumelle was highest at $389,000, followed by Conway City Value Rank City Value 450,000 ($335,000) and Little Rock ($305,000). The lowest values 389,000 400,000 Benton 175,000 1 Maumelle 389,000 335,000 350,000 – at the permit stage - were found in North Little Rock at 305,000 255,000 Bryant 255,000 2 Conway 335,000 242,320 300,000 Cabot 242,320 3254,000 Little Rock 305,000 $107,881, and Jacksonville at $159,000. These figures reflect 250,000 Conway 335,000 4 Bryant 255,000 175,000 200,000 159,000 local conditions and permitting procedures, sale values run Jacksonville 159,000 5 Sherwood 254,000 150,000 107,881 MSA-MedianVal-Trend_Chart_2004-2024.xlsx Little Rock 305,000 6 Cabot 242,320 100,000 higher and may follow a differing pattern.
Overall 9/12/2025
Year
New Residential
Residential Repair + Additions
Commercial and NonResidential
2023
554.0
131.1
848.1
1,533.2
2024
512.4
114.3
679.6
1,306.4
Percent Change
-7.5%
-12.8%
-19.9%
-14.8%
Dat1
12 | 2025 ECONOMIC REVIEW & OUTLOOK
With a median value of $254,680 at the permitting stage in 2025, newly-built homes in Central Arkansas sell for nearly twice as much.
Page 1 of 1
Page 1
METROTRENDS
ECONOMIC OUTLOOK 2026 Central Arkansas is a major player in power transmission, benefiting from centrality and low local energy costs. Shifting federal policies will barely slow the upward-sloping curve in renewable energy, which is undergoing an exponential trend. While solar energy is limited by seasonal and weather-related factors, electricity demand peaks during the same summer months that solar output maximizes.
The regional economic engine continues ticking over smoothly and delivering steady growth. Demographic factors present a labor shortage challenge but so far business startups and expansions in the region have always managed to draw in workers and thrive, demonstrated by a steady rise in regional labor force participation since 2021. The local manufacturing outlook is strong, benefiting from national economic policy and local competitive advantages. The Port of Little Rock is seeing promising and sizeable investments from firms like Welspun (steel pipe manufacturing), Elopak (sustainable food containers), and Amazon. Infrastructure improvements and transportation planning efforts are priming the area for a “Super Site” with region-wide economic benefits. The national economy faces risks that the AI boom, coupled with a surge in under-regulated “creative financing,” could yield an investment market correction.1 Productivity gains from AI might defy these obstacles, powering through with little disruption. In any case, the regional economy looks sound. The table at right compares Central Arkansas GDP performance against other U.S. South Central metros from 2001 to 2023. As you can see, Central Arkansas was the only one that delivered positive growth in every interval. 1 “How Markets Could Topple the Global Economy,” Economist November 13, 2025. 2 “Geothermal’s Time Has Finally Come,” Economist November 18, 2025.
Geothermal energy is now benefitting from recent technological advances in drilling and fracking for fossil fuels.2 Once tightly restricted by location, it will soon become feasible in a far wider range of sites. Energy demand is strong, and getting stronger, causing price pressures and disruptions in the short term. Technological advances in renewable energy are altering the cost equation, and power providers will adapt. We are seeing a transformation in energy abundance that will change the economy as we know it. Metro Area GDP Change 2001–2023 2001–05
2005–10
2010–15
2015–20
Baton Rouge, LA
Metro Area
36.6%
-5.9%
20.2%
-12.3%
2020–23 9.5%
Fayetteville AR
33.0%
-0.7%
27.1%
19.5%
15.7%
Jackson, MS
13.0%
0.3%
8.0%
-1.9%
9.6%
Little Rock AR
18.9%
1.2%
6.1%
3.6%
9.5%
Memphis, TN-MS-AR
7.7%
-5.5%
7.3%
3.6%
7.3%
Tulsa, OK
7.1%
7.1%
23.1%
-7.1%
9.5%
Source: U.S. Bureau of Economic Analysis.
CLINTON NATIONAL AIRPORT GOES GEOTHERMAL Construction is currently underway for a geothermal field at Little Rock’s Clinton National Airport. Funded by Metroplan with the help of a CPRG grant from the EPA, the system will power the airport’s heat and cooling needs. The land will help with transportation too, since once the underground geothermal field is complete, it will do double duty as a surface parking lot.
METROTRENDS
2025 ECONOMIC REVIEW & OUTLOOK | 13
STATISTICAL SUPPLEMENT 2025 ENERGY OPPORTUNITIES ABOUND FOR LOCAL GOVERNMENTS This newsletter edition points to a coming era of abundance in energy. While that sounds hypothetical and theoretical, opportunities exist here and now. Local government agencies can benefit from Metroplan’s ESPC Cohort program, which offers technical assistance and stipends to reduce energy efficiency contract costs for cities, counties and schools.
Whether your goal is to insulate buildings, install solar panels, or many other potential cost-saving strategies, we can help you to develop a scope of work and to issue RFPs to qualified Energy Service Companies. The ESPC Cohort program can help you start saving costs within a short and practical time window.
Forecast_Comp_PV_2009-2030 SOLAR GENERATION FORECASTS
2009 2010 2011 2012 2013 2014 2015 2016 2017 2018 2019 2020 2021 2022 2023 2024 2025 2026 2027 2028 2029 2030
Billions of Kilowatt Hours (BkwH)
Forecast Forecast Forecast Forecast Forecast The chart at left shows forecasts made for photovoltaic solar U.S. Photovoltaic Solar Generation Forecasts Photovoltaic Solar Forecast Trends Year U.S. 2012 2019 Generation 2022 2025 2016 power (PV) by the U.S. Energy Information Administration 2012-2025 2009–2030 2009 0.15 (EIA) since 2012. As you can see, the EIA has repeatedly 2010 600 0.46 2011 1.13 forecast exponential growth, yet actual PV solar output has 2012 500 2.15 grown even faster. The one exception in this chart is the 2022 2013 2.84 forecast, which exceeded the real trend in 2024 and 2025. Yet 2014 3.45 14.99 400 even this forecast, done when federal policy favored solar 2015 3.61 18.82 2016 3.61 28.08 power, runs lower than the 2025 forecast which was made after 300 2017 3.61 44.22 49.7 a reduction in subsidies. Market forces are at work. 2018 3.61 47.58 63.04 2019 200 3.62 47.79 71.52 Two warnings are in order: (1) no trend will go exponential 2020 3.62 47.81 83.93 forever, and (2) solar is not the only rule-changer in the game: 2021 100 3.68 64.46 99.98 103.4 other renewable power sources like wind have also repeatedly 2022 3.8 88.07 124.34 135.9 2023 0 3.95 102.32 152.2 181.3 exceeded forecasts. 2024 4.17 105.24 165.29 274.4 201.7 2025 4.37 107.47 174.57 308.8 272.69 The key takeaway is that, despite cost hikes and constraints in 2012 181.36 Forecast 2016 2026 5.13 Forecast 109.31 327.1 Forecast 370.22019 today’s electric power supply, the future of energy will depend 2027 5.45 Forecast 115.82 343.5 400.11 2022 189.48 Forecast 2025 less on fossil fuels and more on renewable sources. It will be a 2028 125.04 Administration. 197.96 375.2 420.1 Source: U.S.5.72 Energy Information 2029 5.78 132.66 214.06 430.2 469.23 Source: U.S. Energy not Information Administration. future of scarcity, but of unprecedented abundance. 2030 6.16 143.46 219.53 460.1 537.75
AMAZON UNCERTAINTY As this edition reached the brink of publication, we learned that Amazon has announced “an indefinite closure of its Port of Little Rock fulfillment center,” with the loss/relocation of about 4,600 jobs.1 The fulfillment center, which requires “structural repairs,” will reopen at a future date. In the meantime, Amazon is currently constructing its “LIT 3 crossdock facility,” with a forecast opening date in 2027.
Compiled by Metroplan 11/25/2025
1 “Ex-employees of Amazon hit LR job market,” Arkansas Democrat-Gazette, Saturday 22 November 2025.
14 | 2025 ECONOMIC REVIEW & OUTLOOK
METROTRENDS
2025 METROPLAN BOARD OF DIRECTORS PRESIDENT Judge Allen Dodson Faulkner County
VICE PRESIDENT Mayor Ken Kincade City of Cabot
IMMEDIATE PAST PRESIDENT Judge Barry Hyde Pulaski County
SECRETARY/TREASURER Judge Matt Brumley Saline County
Mayor Crystal Herrmann City of Alexander
Mayor Jeff Elmore City of Jacksonville
Mayor Preston Scroggin City of Vilonia
Mayor Bernadette Chamberlain City of Austin
Mayor Stephanie White City of Keo
Mayor Charles Gastineau City of Ward
Mayor Eddie Jones City of Bauxite
Mayor Frank Scott, Jr. City of Little Rock
Mayor Terry Don Robinson City of Wooster
Mayor Tom Farmer City of Benton
Mayor Wayne McGee City of Lonoke
Mayor Derrick Rainey City of Wrightsville
Mayor Chris Treat City of Bryant
Mayor Caleb Norris City of Maumelle
Judge Randy Pruitt Grant County
Mayor Cody Kees City of Cammack Village
Mayor Zach Jeffery City of Mayflower
Judge Doug Erwin Lonoke County
Mayor Bart Castleberry City of Conway
Mayor Jonathon Hawkins City of Mount Vernon
Mayor David “Butch” House City of England
Mayor Terry Hartwick City of North Little Rock
Mr. David Siskowski Arkansas Department of Transportation
Mayor Sammy Hartwick City of Greenbrier
Mayor Mike Kemp City of Shannon Hills
Mayor Terry Williams City of Guy
Mayor Cain Nattin City of Sheridan
Mayor Clyde Crookham, Jr. City of Haskell
Mayor Mary Jo Heye-Townsell City of Sherwood
Mr. Keith Keck Hot Springs Village
Mayor Kimberly Schane City of Traskwood
Mr. Justin Avery Rock Region METRO Mr. Bryan Day Little Rock Port Authority Ms. Suzanne Peyton Clinton National Airport
SMART PLANNING MAKES SMART PLACE S.
501 West Markham St., Suite B
Little Rock, AR 72201
501-372-3300
metroplan.org