
7 minute read
European Box Trades


EURO’ BOX TRADES ASSESSED*
The diverging macroeconomic and demographic outlook of global regions can provide an indicative but valuable outline of the growth and direction of European container trade lanes
During the last two decades, there has been a steady shift regarding European container trade partners from the West (North America) to the East (Asia). The results of a new study from Royal HaskoningDHV, The Future of European Container Trade, show that this trend is likely to continue over the next two decades. Overall, European container trade is expected to grow by 2.8% per year (CAGR) between 2020 and 2040. However, the various European trade lanes are expected to show signifi cantly diff erent growth trends.
European container trade with North America and the intra-European container trade are expected to grow much slower than container trade with Africa, the Middle East/ India and the Far East (Figure 1). Two alternative scenarios on ‘nearshoring’ and a ‘trade war’ show that growth of several European container trade lanes is subject to downside risks.
ORIGIN-DESTINATION MATRIX
The methodology to forecast major European container trade lanes can be split into several steps. Firstly, an origindestination (OD) matrix is constructed for the base year 2020 containing seaborne container trade across seven large global regions (Table 1). As this data is not readily available - except for a select number of key trade routes – it is constructed by Royal HaskoningDHV based on data from Clarksons and UN Comtrade.
Secondly, future imports and exports for all seven regions are based on regression analysis and used in the forecast horizon of 2020 to 2040. This second step provides the row totals and column totals of the future OD-matrices. Thirdly, the RAS method is used to estimate future bilateral trade relations in the OD-matrices of the years 2025, 2030, 2035 and 2040. The RAS method is a well-known method for data reconciliation in supply-use or input-output tables of an economy, but it has other applications as well. Finally, average maritime distances for all bilateral trade relations in the OD-matrix are estimated in order to calculate TEU-miles for all trade routes.
EUROPEAN TRADE LANES
As a result of diverging economic and demographic prospects between global regions, the gradual shift of European trade partners from the West (North America) to the East (Asia) is expected to continue going forward. The Europe - Far East trade lane is expected to grow robustly in both ways (Figure 2). However, the Europe – North America trade lane shows a diverging pattern for the two directions (Figure 3). North America imports and European exports are expected to grow significantly stronger than the other way around. This is due to, among other factors, slower population growth, and hence consumption, on the European side of the Atlantic. As a result, the North America – Europe trade lane is expected to remain at the same volume going forward.
The expected growth of TEU-miles on European trade lanes is slightly higher than the expected growth of TEUs’. The key reason for this development is the strong growth of the Asian market and the fact that the average nautical distance between Europe and Asia is relatively large. As a result of this, the average number of miles per TEU on European trade is expected to increase marginally over the next two decades in RHDHV’s base case scenario.
SCENARIOS: NEAR SHORING AND TRADE WAR
Two alternative scenarios have been conducted. Firstly, in a ‘nearshoring’ scenario the share of intra-regional trade over total trade – which is used as a proxy for the extent of nearshoring – will grow faster compared to the baseline scenario. There are many different reasons why nearshoring could increase going forward. These include rising wages in emerging economies, which makes outsourcing into these countries less attractive, or the fear of logistic disruptions like the Suez blockage in 2021. In the ‘nearshoring’ scenario it is assumed that the share of intra-regional trade over total
*This article highlights the main findings of a new study from Royal HaskoningDHV into the future of European container trade with the study’s author, Michiel Verduijn, Economist at Royal HaskoningDHV, debuting the findings on an exclusive basis with Port Strategy 8 Figure 1. European Seaborne Container Trade Growth by Trade Corridor 2020-2040
Two trade scenarios are set out: near shoring and trade war ‘‘
trade will continue the growth path as seen between 2008 and 2020. In the baseline scenario, this share remains stable between 2020 and 2040.
It is assumed that the total world container trade in the OD-matrix will remain the same as in the baseline scenario, which implies that inter-regional trade must grow slower than in the baseline scenario.
Secondly, in a ‘trade war’ scenario the growth of bilateral trade between Europe and the Far East (both ways) and the US and the Far East (both ways) is reduced by 50 per cent compared to the base case scenario. Again, there are many different reasons why a trade war could arise, including the current war in Ukraine. At this stage, it is difficult to assess the
Exports Imports North America Europe Far East ME / ISC Latin America Africa Oceania Total
North America 5.2 2.7 7.3 1.5 2.6 0.4 0.3 20.0 Europe 5.0 13.3 8.2 4.0 2.1 2.3 0.6 35.5 Far East 20.2 15.8 59.4 6.8 3.9 3.3 2.8 112.2 ME / ISC* 1.4 2.9 2.7 1.8 0.1 0.6 0.1 9.5 Latin America 2.1 2.1 2.4 1.1 1.6 0.6 0.1 9.9 Africa 0.1 1.1 1.7 0.6 0.0 1.6 0.0 5.2 Oceania 0.2 0.2 1.5 0.2 0.0 0.1 0.2 2.4
Total 34.2 38.1 83.2 15.9 10.3 8.9 4.1 194.6
8 Table 1. OD-matrix seaborne container trade (2020, mln TEU, full)
Source: RHDHV, derived from Clarksons and UN Comtrade data. * Middle East & Indian subcontinent.
long-term impact of the war in Ukraine. That said, if it would escalate into a trade war between the Far East and the US/ Europe, this would definitely have consequences for container trade lanes. In the ‘trade war’ scenario it is assumed that the total world container trade in the OD-matrix will remain the same as in the baseline scenario, which implies that other trade relations will grow stronger than in the baseline scenario as a substitution effect.
Both in the nearshoring scenario and in the trade war scenario, the growth of TEU-miles on European trade lanes will be lower than the growth of TEUs’. The key reason for this is the fact that intra-regional trade connections have shorter sea distances than inter-regional connections (nearshoring) and low growth of long-distance Europe-Far East trade (trade war). As a result, the average number of miles per TEU is expected to drop in both scenarios (Figure 4).
STAKEHOLDER IMPLICATIONS
The growth and direction of European container trade can determine the investment decisions of the main stakeholders in this sector: port authorities, shipping lines and shipbuilders. The expected growth of European container trade of 2.8 per cent per year until 2040 shows the need to expand container capacity going forward.
Especially for shipping lines and shipbuilders, the expected continuation of the gradual shift of European trade partners from the West (North America) to the East (Asia) will have additional consequences. In the base case scenario, one can expect strong demand for additional services on European trade lanes with Southeast Asia, the Indian subcontinent and Africa. This will not only have implications on the network optimisation of these shipping lines but potentially also on the average vessel size deployed on European trade lanes. Currently, the largest vessels (17,000TEU – 24,000TEU) are mainly deployed on the EuropeFar East trade lane (Clarksons, Container Intelligence Quarterly 2022Q1) due to stronger economies of scale at higher sailing distances. The relatively robust growth forecast of European trade with regions that are geographically far away will increase the demand for deployment of these very large vessels.This effect will be mitigated in case of significant nearshoring or as a result of a trade war between Europe/US and the Far East.

8 Figure 2. Europe – Far East trade lane

8 Figure 3. Europe – North America trade lane
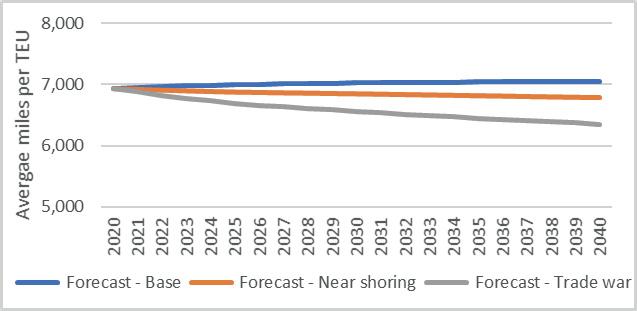
8 Figure 4. European container trade – average miles per TEU


