Human iPSC Derived Microglia Cell Assays K. Shea, E. Offer, G. Marshall, R. Kelly, E. Jones, A. Rutkowski, I. Peset Martin and P. Simpson: Medicines Discovery Catapult, Alderley Park, Cheshire, SK10 4ZF, UK.
md.catapult.org.uk
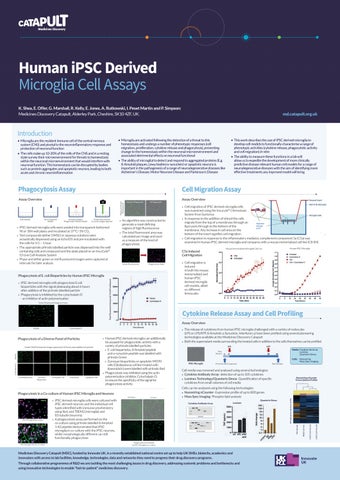
Introduction • Microglia are the resident immune cell of the central nervous system (CNS) and pivotal to the neuroinflammatory response and protection of neuronal function • The cells make up 10-20% of the cells of the CNS and in a resting state survey their microenvironment for threats to homeostasis within the neuronal microenvironment that would interfere with neuronal function. This homeostasis can be disrupted by bodies such as protein aggregates and apoptotic neurons, leading to both acute and chronic neuroinflammation
• Microglia are activated following the detection of a threat to this homeostasis and undergo a number of phenotypic responses (cell migration, proliferation, cytokine release and phagocytosis), preventing change to the homeostasis within the neuronal microenvironment and associated detrimental effects on neuronal functional • The ability of microglial to detect and respond to aggregated proteins (E.g. ß-Amyloid plaques, Lewy bodies/α-synuclein) or apoptotic neurons is important in the pathogenesis of a range of neurodegenerative diseases like Alzheimer’s Disease, Motor Neurone Disease and Parkinson’s Disease
• This work describes the use of iPSC derived microglia to develop cell models to functionally characterise a range of phenotypic activities (cytokine release, phagocytotic activity and cell migration) in-vitro • The ability to measure these functions in a lab will allow us to expedite the development of more clinically predictive disease relevant human cell models for a range of neurodegenerative diseases with the aim of identifying more effective treatments any improved model will bring
Cell Migration Assay
Assay Overview
Assay Overview
Test Compound Added
pHrodo Labelled Phagocytotic Particle Added
Green Flourescence Incucyte Images captured
• iPSC derived microglia cells were seeded into transparent bottomed
96 or 384 well plates and incubated at 37°C/ 5% CO2 • Test compounds (either DMSO or aqueous solution) were acoustically dispensed using an Echo555 and pre-incubated with the cells for 0.5 – 1 hour • The appropriate pHrodo labelled particle was dispensed into the well containing cells and compound and the plate placed on an IncuCyte® S3 Live Cell Analysis System • Phase and either green or red fluorescent images were captured at intervals for later analysis
Maximum Phagocytosis
No Phagocytosis
• Cell migration of iPSC derived microglia cells
• An algorithm was constructed to
generate a mask defining regions of high fluorescence • The total fluorescent area was calculated per image and used as a measure of the level of phagocytosis
Green Fluorescence
Phagocytosis Mask
Green Fluorescent Image at 6 hours
Total Fluorescent Area (μm2/ % Cell Confluence)
bioparticles with the signal plateauing about 6 hours after addition of the pHrodo labelled particle • Phagocytosis is inhibited by the cytochalasin D - an inhibitor of actin polymerisation
Mouse Immortalised Microglial Cell Line 0.4
C5a Induced Cell Migration
Phagocytosis of E. coli Bioparticles by Human iPSC Microglia • iPSC derived microglia cells phagocytose E.coli
was examined using the Incucyte® Chemotaxis System from Sartorius • In response to the addition of stimuli the cells migrate from the top of a membrane through an Migration through 8μm pore through to the bottom of the pores membrane. Any increase in cell area on the bottom of the insert signifies cell migration • Cell migration in response to the inflammatory mediator, complement component 5a (C5a) was examined in human iPSC derived microglia and compares with a mouse immortalized cell line (C8-B4) C8-B4 Cell Line Human iPSC Microglia C5a Untreated Normalised Cell Area
Cells Seeded
Phase and Green Fluorescence
Phagocytosis Assay
• Cell migration is
induced in both the mouse immortalized and human iPSC derived microglia cell models, albeit on different timescales
0.3
0.2
0.1
0.0 0
4
8
12 16 20 24 28 32 36 40 44 48
Time (Hrs)
Cytokine Release Assay and Cell Profiling Assay Overview
IBA1
TREM2
iPSC Microglia Mono-culture IBA1
B3-TUBULIN
iPSC Microglia/ Neuron Co-culture
6 Hours
• iPSC derived microglia cells were cultured with
Cell media was removed and analysed using several technologies: • Cytokine Antibody Array- detection of up to 105 cytokines • Luminex Technology/Quanterix Simoa- Quantification of specific cytokines from small volumes of cell media
Nanostring nCounter Transcriptome Profiler
Cells can be analysed using the following technologies: • Nanostring nCounter- Expression profile of up to 800 genes • Mass Spec Imaging- Phospho-lipid analysis Quanterix Simoa
Luminex
Cytokine Antibody Array
Luminex Luminex
Cytokine Antibody Array Cytokine Antibody Array
Luminex
Cytokine Antibody Array
iPSC derived neurons and the individual cell types identified with immunocytochemistry using Iba1 and TREM2 (microglia) and ß3-tubulin (neurons) • A phagocytosis assay performed on the co-culture using pHrodo labelled ß-Amyloid 1-42 peptide demonstrated that iPSC microglia in co-culture with the iPSC neurons, whilst morphologically different can still functionally phagocytose
Take Samples
Vehicle
+ß-Amyloid
Phagocytosis of ß-Amyloid by iPSC Microglia in co-culture
HMC3 Cell-line (n2)
0.5 Hours
Pre-treat with Compound
HMC3 Cell-line (n1)
Phagocytosis in a Co-culture of Human iPSC Microglia and Neurons
iPSC Microglia
Cells: Nanostring Mass Spec Imaging
HMC3 Cell-line (n2)
Apoptotic Cells
Media: Cytokine Ab Array Luminex Quanterix Simoa
Time (Hours)
HMC3 Cell-line (n1)
α-Synuclein
ATP
M059J Cell-line
ß-Amyloid 1-42
LPS
M059J Cell-line
Zymosan Bioparticles
Luminex
Cytokine Antibody Array
iPSC derived
Cytochalasin D
Vehicle
Green/ Red Fluorescent image captured at 10 hours post addition of particle
be assayed for phagocytotic activity with a variety of pHrodo labelled particles: • E. coli bioparticles, ß-Amyloid peptide and α-synuclein peptide was labelled with pHrodo Green • Zymosan bioparticles or apoptotic M059J cells (Glioblastoma cell line treated with doxorubicin) were labelled with pHrodo Red • Phagocytosis was inhibited using the actin polymerisation inhibitor, Cytochalasin D, to ensure the specificity of the signal for phagocytosis activity
(LPS or LPS/ATP, ß-Amyloid, α-Synuclein, Interferon-γ) have been profiled using several pioneering technologies available at the Medicines Discovery Catapult • Both the supernatant media surrounding the treated cells in addition to the cells themselves can be profiled
iPSC derived
• Human iPSC derived microglia can additionally
Phagocytosis of a Diverse Panel of Particles
E.coli Bioparticles
• The release of cytokines from human iPSC microglia challenged with a variety of molecules
Microglia gene expression profile
Cytochalasin D
Luminex
Cytokine Antibody Array
Microglia gene expression profile
Vehicle
Time (Hours)
Microglia Microgliagene geneexpression expressionprofile profile Microglia gene expression profile
Medicines Discovery Catapult (MDC), funded by Innovate UK, is a recently established national centre set up to help UK SMEs, biotechs, academics and innovators with access to lab facilities, knowledge, technologies, data and networks they need to progress their drug discovery programs.
ell-line Cell-line(n2) (n2) ell-line (n2)
ell-line Cell-line(n1) (n1) ell-line (n1)
9J 59JCell-line Cell-line 9J Cell-line
13201 - A0 MDC Posters Full Set v3.indd 2
iPSC SC derived derived SC derived
Through collaborative programmes of R&D we are tackling the most challenging issues in drug discovery, addressing systemic problems and bottlenecks and using innovative technologies to enable “fast-to-patient” medicines discovery.
13/10/2021 12:56