M:
Research
Spring/26 Melbourne New Apartments
Headlines Melbourne new apartment pipeline to 2029 is 63% lower than the 5-year average. There are 4,014 new apartments due for completion in 2026.
The number of residential rental homes in Melbourne is currently undersupplied. Melbourne rental vacancy was recorded at 2.7% at the end of Q2/26.
New apartment prices were 7.2% higher in Melbourne over the past year to Q2/26, at an indicative $14,900/sqm, with 0.7% growth in the last quarter.
Residential rents across Melbourne trended 1.7% above last year's weekly rate, with rents forecast to rise 4% at the end of 2026.
Melbourne residential property prices have trended higher than a year ago with 0.4% growth, with -7% price growth forecast for 2026.
The construction delivery of new homes in Victoria was 9.3% below a year ago, whilst the cost to build in Melbourne escalated 5.0%.
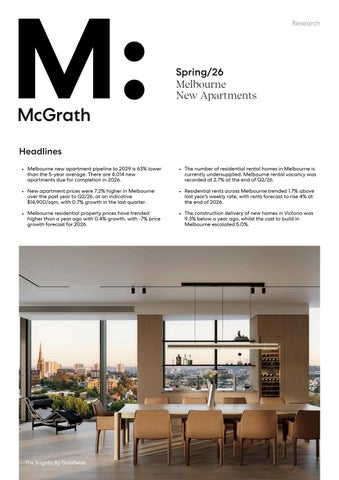
The Brightly By Goldfields
Economy Key drivers
Interest rate
Spring/26
4.60%
Interest rates were last set at 4.60% after the Reserve Bank of Australia (RBA) lifted the cash rate target by 25 bps in September 2026. At this time, most lenders adjusted their mortgage lending rates for homeowners and investors accordingly. By setting borrowing costs, interest rates strongly influence both housing affordability and demand for home loans. Westpac forecasts the cash rate target to be 4.60% at the end of 2026 whilst 4.10% in 2027, with inflation, energy costs and the global economy being closely monitored as a leading indicators for any possible adjustments during this time.
Population growth
5.0%
Unemployment
Melbourne's unemployment rate of 5.0% at the end of Q2/26, was tracking higher than the Australia average at 4.3%. Looking back, the five year average unemployment rate has been 3.9% across Australia. Employment conditions shape the ability for a household to enter the housing market and service mortgages over time, with a healthy labour market typically below 5%. With economic headwinds and technological disruption to a growing number of industries on the horizon, the RBA forecasts unemployment to soften to 4.7% by the end of 2027.
+2.0%
+5.0%
New build costs
Population growth has ramped up housing demand, placing pressure on existing housing supply and infrastructure. Melbourne's total population growth was 2.0% in 2025. This came after the population rebounded 2.6% in 2024, after growth had slowed to 1.1% in 2022, as a consequence of slower migration throughout the pandemic. The Australian Bureau of Statistics (ABS) have projected the long-term population growth for Melbourne at 1.8% per annum.
The construction delivery of new homes in Victoria was 9.3% below the last reported year, whilst residential building approvals trended 1.6% lower. Over this time, Melbourne house approvals were down 3.9% and apartment approvals were 13.1% lower. The cost to build in Melbourne escalated 5.0% in 2025 according to WT, which was below the 6.4% five year average. Considering the economic outlook, WT forecasts building escalation to lift by 4.8% in 2026 and rise 4.9% in 2027.
Economic outlook, Q2/26
2021
2022
2023
2024
2025
2026F
2027F
Interest rate target
0.10%
3.10%
4.35%
4.35%
3.60%
4.60%
4.10%
Economic growth in Australia
4.9%
3.3%
1.3%
1.2%
2.6%
1.5%
1.7%
Unemployment rate in Australia
4.0%
3.3%
3.8%
3.8%
3.9%
4.7%
4.7%
Population growth in Melbourne
1.1%
3.3%
2.6%
2.0%
1.8%
1.8%
1.8%
Building cost escalation in Melbourne
3.0%
9.5%
9.0%
5.5%
5.0%
4.8%
4.9%
Source: McGrath Research, RBA, WT, ABS, Westpac
2
New apartment pipeline Update
Active pipeline
Spring/26
-63%
Total number of new apartments Melbourne, built or due to be completed
The Melbourne annual average pipeline for new build-tosell apartments due for completion between 2026 and 2029 is trending 63% lower than the 5-year average, according to McGrath Research. The pipeline has been based on the average time taken for the marketing and construction of development approved projects with 6+ apartments and 3+ storeys in height. Melbourne is projected to deliver 20,338 new apartments by the end of 2029, averaging 5,085 apartment completions per year. In 2026, there are 4,014 apartments expected to be completed. Between 2021 and 2025, a total of 54,942 apartments were built, with an average 10,988 per year.
Source: McGrath Research
Apartment configurations
39%
New apartments bedroom mix Melbourne, built or due to be completed
When exploring the configurations of the Melbourne active new build apartment pipeline due for completion between 2026 and 2029, 39% are proposed to be 2-bedroom apartments, 21% having 1-bedroom, 0.9% being studios, whilst 33% are allocated as 3-bedrooms and 6.4% with 4-bedrooms or more, according to McGrath Research. By comparison over the past five years, the split of apartments built were reported to be 43% as 2-bedrooms, 27% had 1-bedroom, 1.6% were a studio, whilst 26% had 3-bedrooms and 2.7% recorded 4-bedrooms or more.
Source: McGrath Research
Melbourne, Q2/26
Inner suburbs
Middle suburbs
Outer suburbs
Melbourne
New apartments built 2021-2025, annual average
7,350
3,094
544
10,988
New apartments built 2026-2029, annual average
4,144
632
304
5,085
Share of 2-bedroom apartments, due 2026-2029
39%
43%
35%
39% Source: McGrath Research
3
New apartment prices Update
Spring/26
+7.2%
New apartment prices
Tracking new apartment average prices Melbourne, per square metre
Apartment prices in new projects within Melbourne were 7.2% higher over the past year to Q2/26, with 0.7% growth taking place in the last quarter, according to McGrath Research. New apartment prices were at an indicative $14,900/sqm, ranging between an average of $9,000/sqm and $21,500/sqm for a project with 6+ apartments and 3+ storeys. Over the past five years, total price growth for new apartments was 44.7% higher, with an annual average change of 8.0%.
Source: McGrath Research
Average Price per square metre
$14,900
Range of new apartment average prices Melbourne, per square metre, Q2/26
The inner suburbs of Melbourne saw the strongest growth in new apartment prices in the year ending Q2/26, according to McGrath Research. Prices in the inner suburbs increased 7.7% to an indicative $15,300 per square metre during this time, to range between an average of $9,500 and $21,500/sqm. Outer suburbs recorded a rise in prices of 4.8% with $11,000/sqm ($9,000 to $11,500/sqm) and the middle suburbs rose 4.6% to $13,600/sqm, ranging from an average of $11,000 to $18,000/sqm.
Source: McGrath Research
Melbourne, Q2/26
Inner suburbs
Middle suburbs
Outer suburbs
Melbourne
New build apartment average price/sqm
$15,300
$13,600
$11,000
$14,900
Change from a quarter ago
0.7%
0.0%
0.0%
0.7%
Change from a year ago
7.7%
4.6%
4.8%
7.2% Source: McGrath Research
4
Established residential prices Update
Median price
Spring/26
$851,600
Tracking median prices Melbourne
Melbourne residential property prices have trended higher than a year ago. Prices across Melbourne rose by 0.4% in the year ending Q2/26, with a 2.4% decrease recorded in the most recent quarter. As a result, the median residential value reached $851,600. Residential values shift with changes in interest rates, supply and demand, economic conditions, population trends and local infrastructure which influences market appeal and buyer capacity. Annual residential price growth has averaged 2.3% over the past five years.
Source: McGrath Research, Cotality
Price outlook
-7%
Forecast for median prices Melbourne
Looking ahead, Melbourne residential prices are likely to contract over the coming year. McGrath Research forecast Melbourne residential property prices to decrease by 7% at the end of 2026, followed by a 2% rise in 2027. Residential price forecasts consider borrowing capacity, the balance of supply and demand, economic conditions, population trends and local infrastructure which shapes affordability, demand and market direction.
Source: McGrath Research
Melbourne, Q2/26
Houses
Apartments
Residential
Median price
$951,800
$637,900
$851,600
Change from a quarter ago
-3.0%
-0.5%
-2.4%
Change from a year ago
-0.5%
3.2%
0.4% Source: McGrath Research, Cotality
5
Residential rents Update
Vacancy
Spring/26
2.7%
Residential rental vacancy Melbourne
The number of residential rental homes in Melbourne is currently undersupplied. Melbourne rental vacancy was recorded at 2.7% at the end of Q2/26, rising 20 bps in the quarter whilst rising 20 bps over the past year according to REIA. Generally, around 3% vacancy is considered a balanced market between rental supply and demand. Below this equilibrium is considered to be an undersupplied pool of rental homes, which places upward pressure on weekly rents. For the past five years, Melbourne residential rental vacancy has averaged 3.2%.
Source: McGrath Research, REIA
Yield
-26 bps
Gross rental yield Melbourne
Melbourne gross rental yields have trended lower over the past year. Residential yields fell 18 bps in the Q2/26 quarter to be 3.65% across Melbourne, whilst 26 bps lower compared to a year ago. A yield pushing beyond 4% is more desirable for investment properties located in capital cities, while below this, tends to show higher property values relative to rental income. Melbourne gross rental yields have averaged 3.37% over the past five years.
Source: McGrath Research, Cotality
Melbourne, Q2/26
Houses
Apartments
Residential
Gross rental yield
3.12%
4.79%
3.65%
Change from a quarter ago
-28 bps
+4 bps
-18 bps
Change from a year ago
-41 bps
+5 bps
-26 bps Source: McGrath Research, Cotality
6
Residential rents Update
Median weekly rent
Spring/26
$585
Tracking median weekly rents Melbourne
Residential rents across Melbourne trended above the weekly rate recorded a year ago. Melbourne rents rose 0.9% in Q2/26, whilst increasing 1.7% over the past year, to stand at a median $585 per week. Rent changes are driven by rental supply, tenant demand, migration trends, economic conditions and investor activity which together impact the vacancy rate. For the past five years, Melbourne rents grew an average 6.4% per annum.
Source: McGrath Research, Cotality
Rental outlook
+4%
Forecast for median rents Melbourne
The Melbourne residential market is continuing to experience upward pressure on weekly rents. McGrath Research forecast Melbourne rents to rise 4% at the end of 2026, with a further 5% rise likely in 2027. The rental forecast takes into consideration new and existing supply levels, population changes, economic conditions and upgraded local infrastructure which can influence future tenant demand, vacancy rates and rental growth.
Source: McGrath Research
Melbourne, Q2/26
Houses
Apartments
Residential
Median weekly rent
$580
$590
$585
Change from a quarter ago
0.0%
1.7%
0.9%
Change from a year ago
0.0%
5.4%
1.7% Source: McGrath Research, Cotality
7
Definitions
New apartments New apartments are defined as being within a 3+ storey building and with 6+ apartments as defined by McGrath Research. Melbourne Melbourne refers to the Greater Capital City Statistical Area or ‘Greater Melbourne’ as defined by the Australian Bureau of Statistics. Inner suburbs The inner suburbs are considered to be within the 0-10km ring from the Melbourne CBD as defined by McGrath Research. Middle suburbs The middle suburbs are considered to be within the 10-20km ring from the Melbourne CBD as defined by McGrath Research. Outer suburbs The outer suburbs are considered to be outside the 20km ring from the Melbourne CBD as defined by McGrath Research.
Guiding you home
Michelle Ciesielski National Head of Research, McGrath Research www.mcgrath.com.au/research
Our partnership with Knight Frank and its worldwide network provides our clients with direct access to the global marketplace. As an end-to-end project team, we understand the market intimately and are deeply involved in every step of the journey. Locally, nationally, and internationally, we collaborate to leverage global expertise whilst maintaining our hands-on approach and unrelenting commitment to quality and value.
Find an agent © McGrath Limited 2026 Disclaimer: This report is published for general information only and not to be relied upon in any way. Although high standards have been used in the preparation of the information, analysis, views and projections presented in this report, no responsibility or liability whatsoever can be accepted by McGrath Limited for any loss or damage resultant from any use of, reliance on or reference to the contents of this document. As a general report, this material does not necessarily represent the view of McGrath Limited in relation to particular properties or projects. Reproduction of this report in whole or in part is not allowed without prior written approval of McGrath Limited. McGrath trademarks are property of McGrath Limited.