



























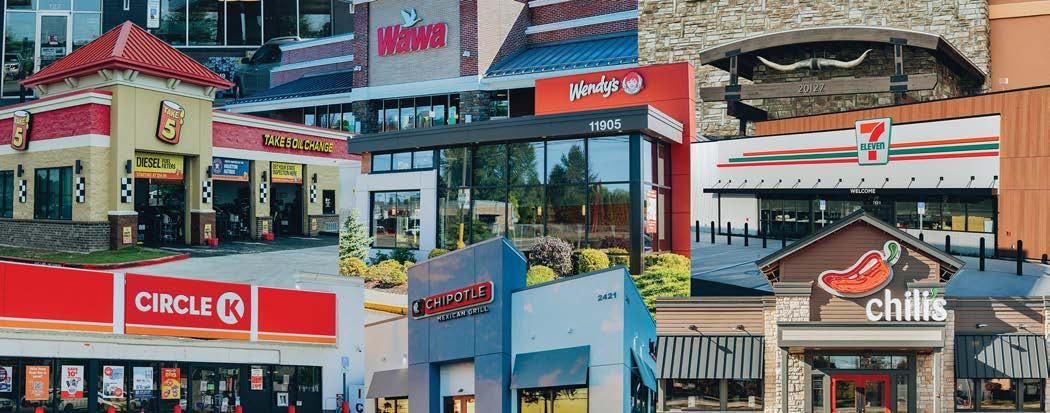
Net Lease Tenant Report
Explore Data on 30+ Tenants

The 2026 Capital Reset
$1.5T in Maturing CRE Debt Surges Deal Activity

The Silver Tsunami Hits
2026-2030 Seniors Housing Investment Window
As our industry continues to evolve with the advancement of AI, so does the way we serve you. At Matthews™, we know that great advisory is built on insight, precision, and an unwavering commitment to client success. Today, I’m proud to introduce the next step in that evolution: Artemis.
Artemis is more than a new platform or initiative. It is a strategic investment in how we deliver value to our clients. It brings together data, market intelligence, and resources across our platform into one connected ecosystem that our agents can access in real time. The result is sharper insight, better execution, and more informed decision-making for the clients we represent.
In a market where speed matters, information matters, and timing matters, Artemis gives our professionals the ability to deliver a higher level of advisory with greater consistency and greater impact.
Commercial real estate has become more complex. There is more information available than ever before, but it is often fragmented, delayed, or disconnected from what is actually happening in the market. Clients do not need more noise. They need clarity. They need real-time insight. They need market intelligence that helps them make better decisions.
We built Artemis to meet that moment.
Artemis brings together the data our agents use, the intelligence they gather, and the tools they rely on to advise clients at the highest level. It allows our professionals to access real-time insights and market intelligence faster, connect information more effectively, and turn that information into meaningful value for clients throughout the decision-making process.
Just as important, Artemis creates efficiency for our agents, and in this business, efficiency matters.
When our professionals spend less time chasing information, piecing together data, or working through disconnected systems, they get time back. And that time goes directly into the work clients actually hire us to do: making a bigger market for the assets we sell, lease, and finance; spending more time in the field; uncovering better intelligence; and identifying more opportunities that can be brought directly to our client base.
That is where Artemis changes the game.
It is not just about better access to information. It is about giving our agents more capacity to do the work that drives results.
Artemis enhances the client experience in clear, measurable ways:
Real-time insights by connecting data and market intelligence in one place
Better decision-making through faster, more informed advisory
Greater market exposure as our agents spend more time building a bigger market for the assets we sell, lease, and finance
More opportunity creation through deeper time in the field, stronger intelligence gathering, and more proactive client coverage
Greater efficiency that allows our professionals to focus less on process and more on execution
All of this is unlocked through Artemis, the definitive ecosystem for the commercial real estate market.
While Artemis represents a major step forward, the foundation of our business remains unchanged.
Commercial real estate is still a relationship business. Trust still matters. Judgment still matters. Execution still matters. Artemis does not replace those things. It strengthens them. Our commitment to our clients remains constant: trusted advice, disciplined execution, and a relentless focus on creating value in every relationship. Artemis allows us to do that at an even higher level.
We are excited about what Artemis makes possible, not only for our firm, but for the clients and partners we are proud to serve.
Thank you for your continued trust.
David Harrington President, Matthews™




An investor’s guide to separating opportunity from risk in today’s net lease market

Sale-leasebacks have shifted from a niche balancesheet tool to a core capital strategy across Corporate America, particularly in retail and other operationally intensive sectors.CoStar reports sales volume for sale-leaseback transactions increasing by 19% YOY from 2024 to 2025. In addition to this transactional growth, trends in the US population point to many Boomers retiring within the next few years, with a current rate of roughly 11,000 retirees a day according to the U.S. Census Bureau. The rise in sale-leasebacks will continue to accelerate, as older business owners step out of the job market and sell their holdings.

Source: U.S. Census Bureau | 2026 MAKE UP 23% BOOMERS OF THE TOTAL U.S. POPULATION
In a landscape defined by higher interest rates, tighter credit, and pressure to improve returns on capital, companies are increasingly turning to the real estate under their operations as a source of liquidity and flexibility.

THE BACKDROP IS CLEAR: BORROWING COSTS ARE ELEVATED, LENDERS ARE MORE SELECTIVE, AND INVESTORS ARE DEMANDING GREATER CAPITAL DISCIPLINE.
Monetizing owned real estate through a saleleaseback allows operators to convert an illiquid asset into cash without disrupting the business. The building trades hands; the tenant keeps running the store.
For sellers, this is a timely way to unlock capital and strengthen balance sheets. For buyers, the headline yields can look compelling until you look into tenant credit, lease structure, and real estate fundamentals in a slower, more uncertain cycle. The underwriting environment is more complex than it seems. This article offers an investor framework for navigating that complexity.
$13.4T in U.S. CorporateOwned Real Estate
Source: Board of Governors of the Federal Reserve System | 2025
AS COMPANIES MONETIZE REAL ESTATE THROUGH SALELEASEBACKS, INVESTORS GAIN ACCESS TO LONG-TERM, INCOME-GENERATING ASSETS BACKED BY OPERATING BUSINESSES.
At its core, the sale-leaseback is about monetizing owned real estate to fund higher return uses. Instead of locking equity in bricks and mortar, companies convert that value into cash and redeploy it into operations, balance-sheet repair, or shareholder returns. In practice, proceeds often fund growth initiatives such as remodel programs, technology and logistics upgrades, or expansion into new formats and markets. They are also frequently used to reduce debt and interest expenses or to support dividends and share repurchases that enhance total shareholder return.
In a higher-rate environment, traditional financing is both more expensive and often more restrictive than in prior cycles. A sale-leaseback can be a relatively attractive alternative to new debt. The company trades ownership for a long-term lease obligation, typically with fixed escalations that are easier to plan around than floating interest costs or uncertain refinancing conditions. For many operators, shifting from an ownership model to an “asset-light” model is as much a strategic decision as a financial one. Certain sectors are especially active in this surge. Retailers, restaurant groups, automotive chains and healthcare operators often sit on sizable real estate portfolios that can be selectively monetized
without undermining operations. Within retail, margin compression, e-commerce competition, and ongoing store rationalization make capital efficiency a priority. Locations may be strategically indispensable from a revenue standpoint but no longer need to be owned to be considered valuable.
Accounting also plays a role. Under ASC 842, many sale-leasebacks receive operating lease treatment, which can improve balance sheet optics and certain credit metrics even as companies relinquish feesimple ownership. For corporate finance teams, that combination of liquidity, flexibility and presentation is powerful, and it helps explain why sale-leasebacks

This corporate pivot is producing a visible surge of sale-leaseback offerings across the net lease sector. Investors are seeing a wave of product, including single-tenant retail across grocery, discount, and specialty categories, big-box locations as chains rethink long-term ownership, and a growing number of outparcels tied to grocery-anchored and power centers. Quick-service restaurant portfolios are also prevalent as operators raise capital for reinvestment and deleveraging. Simultaneously, cap rates are still adjusting to a higher-rate environment, and competition for strong-credit tenants with long-term leases remains intense.
This influx is creating a clear split in the market.
Institutional capital continues to favor stable, creditbacked income streams, while a growing share of offerings fall into more opportunistic territory, where tenant credit or business fundamentals are less certain. As a result, investors must work harder than in prior cycles to sort through a larger pipeline and distinguish durable income from higher-risk yield.
In this environment, disciplined underwriting is not a boxchecking exercise; it is the investment thesis. A practical framework centers on four familiar pillars: tenant credit, lease structure, real estate fundamentals and exit liquidity. The bar within each pillar has moved higher.
Lease terms ultimately define risk allocation. Key considerations include lease duration, renewal options, rent escalations, and clauses such as co-tenancy or termination rights. Sale-leasebacks often favor the seller, making careful review of lease language critical.
Investors need to underwrite not just the income stream, but also the asset’s underlying value and how re-tenantable it is, should the tenant decide to leave. That analysis extends to location quality, visibility, access, traffic patterns and the strength of the trade area, as well as the depth of the tenant pool that could reasonably backfill the space. The physical adaptability of the building, whether the box can be repurposed for different users or formats without excessive cost, also influences both downside protection and long-term upside. In a world where retailer footprints and formats are evolving, flexible boxes and infill locations command a premium
CREDIT-STRONG COMPANIES SELECTIVELY MONETIZING ASSETS, AND STRESSED OPERATORS USING SALE-LEASEBACKS AS A LASTRESORT LIQUIDITY TOOL.
Warning signs such as overleveraged balance sheets, thin coverage ratios, below-market rents that create future rollover risk, short lease terms, and limited renewal options require careful consideration. Investors must also guard against “synthetic credit risk,” where strong real estate fundamentals can obscure a weakening tenant or business model.
With more product coming to market, the net lease sector is being shaped as much by corporate capital strategy as by interest rates. Reading that signal, and filtering for assets that can perform through a full cycle, is now a critical advantage.
Investors should think ahead to how the asset will refinance or trade in five, seven or ten years. Lender appetite, buyer pools, and cap rates will not be static over the hold period. Assets that combine solid tenant credit, clear and financeable lease structures and adaptable real estate tend to maintain better liquidity and pricing, even in risk-off environments. From a practical standpoint, that means underwriting not just the current loan but the likely takeout and asking whether the next buyer will see the same story, or a tougher one.
The overarching message is that attractive yields are not enough. The deal must remain rational if rates normalize, cap rates move out, or tenant performance softens. Underwriting the next cycle means assuming some things will go wrong and ensuring the asset can still perform.
Investors must look beyond brand recognition and evaluate true financial durability, including leverage, coverage ratios, and cash flow stability. Understanding the tenant’s business model and sector positioning is equally important. Stress-testing rent coverage under downside scenarios helps determine lease durability.
With more product in the pipeline, the goal is no longer to find deals that pencil; it is to identify those that can outperform on a risk-adjusted basis and remain liquid through multiple market regimes. For commercial real estate investors building durable portfolios, distinction matters.
Credit durability separates good from great. Top deals feature tenants whose credit aligns with the full lease term. Map terms against business inflection points, store fleet rankings, and strategic shifts in format/omnichannel priorities to assess renewal likelihood. A long lease only works if the tenant stays relevant.
Lease structures that manage rather than amplify risk stand out. Beyond NNN vs. modified gross, scrutinize CAM, capital repairs, roofs/HVAC obligations, and SNDA provisions, these dictate net returns and the ability to finance through distress. M&A-flipped leases often push more risk to landlords.
Sector vulnerabilities provide another filter. Saleleasebacks flow heavily from pressured segments like discretionary retail and casual dining, where shifting consumer behavior and digital competition erode resilience. Clean leases in structurally challenged categories rarely deliver, despite strong real estate.
Capital markets alignment is the final test. Great deals offer sufficient remaining term for broad lender/buyer pools, predictable rent bumps for valuation growth, and pricing that reflects true risks, not just brand hype. Master lease vs. site-by-site and corporate vs. franchisee guarantees create dramatically different profiles even for similar locations.



Today’s sale-leaseback surge presents both complexity and opportunity for investors. The volume of offerings has expanded significantly, with wide variation in credit, lease quality, and real estate fundamentals. At the same time, a broader inventory and more motivated sellers create room for disciplined buyers to be selective while still deploying capital.
A practical response is to apply a consistent framework through assessing tenant durability, lease structure, real estate value, and future liquidity. When those elements align and pricing reflects true risk, investors can move forward with confidence. Those who combine rigorous underwriting with speed and selectivity will be best positioned to capitalize. This is not a temporary spike, but a structural shift in corporate real estate strategy, offering a compelling entry point for building durable, long-term portfolios.

PROPERTIES
DEALS
INSIGHTS
Built for agents, by agents.

TRANSFORMING
How We Prospect, Market, & Close


DELIVERING Instant Market Clarity with Precision-Curated Insights



A recent policy change out of Washington is beginning to influence how retail real estate is being evaluated, marketed, and transacted.
The “ Beautiful Bill,” passed in July 2025, restored 100% bonus depreciation for qualifying assets. While tax policy does not always translate into immediate movement in the investment sales market, this change has had a noticeable impact on investor behavior in a relatively short period of time.
IT HELPS TO LOOK AT WHAT CHANGED.
Bonus depreciation was expanded in 2017 under the Tax Cuts and Jobs Act, allowing investors to immediately expense 100% of qualifying depreciable assets. Beginning in 2023, that benefit began to phase out, stepping down by 20% annually, declining to 80%, then 60%, with further reductions scheduled in the years ahead. By early 2026, most investors had already adjusted underwriting assumptions to reflect a continued reduction in depreciation benefits.
Source: Thomson Reuters
The restoration of 100% bonus depreciation effectively reset those expectations.
Amid higher interest rates and tighter lending, accelerated depreciation has improved after-tax returns across retail assets, at times influencing acquisition timing and pricing.
Retail real estate, particularly assets tied to operating businesses, tends to include a meaningful amount of depreciable value beyond the building itself.
According to Internal Revenue Service guidance and industry cost segregation studies, retail real estate, particularly assets tied to operating businesses, often includes a large amount of depreciable value beyond the building itself. In addition to structural components, these properties frequently incorporate site work, specialized improvements, and operational infrastructure. As a result, investors can typically reclassify 20% to 40% of a retail asset’s purchase price into shorter-life categories, with higher allocations possible in increased infrastructureintensive assets.
With 100% bonus depreciation in place, those amounts can be expensed immediately, creating a concentration of tax benefits in the early years of ownership. In many cases, first-year depreciation deductions are sufficient to offset a significant portion of taxable income, improving near-term cash flow and enhancing overall return profiles.
This dynamic is particularly relevant in net lease retail, where the buyer pool includes a large concentration of private investors and family offices. These groups tend to evaluate investments on an after-tax basis, which means changes in depreciation policy can directly influence both demand and pricing behavior.
The market response following the bill’s passage has been relatively immediate.
Brokerages across multiple regions have reported a noticeable increase in investor outreach within weeks. Simultaneously, more assets began to come to market, particularly from owners who had previously delayed dispositions as depreciation benefits were declining.
Transaction timelines have also begun to compress. Retail net lease deals that would typically take three to six months from initial listing to closing have, in a growing number of cases, traded in under 60 days. This has been most evident in assets where depreciation benefits are both material and straightforward to quantify during underwriting.
Buyers are approaching these opportunities with greater clarity. When a significant portion of a property’s value can be depreciated immediately,

the impact on returns can be modeled early in the process, which has allowed for more decisive bidding and faster execution.
1031 exchange activity has further contributed to this trend. Investors redeploying capital are increasingly pairing exchange proceeds with accelerated depreciation, creating a more compelling reinvestment profile and, in some cases, increasing competition for assets with strong tax attributes.
Despite broader capital market headwinds, cap rates across several retail segments have remained relatively stable.
While borrowing costs remain elevated, the improvement in after-tax yields has helped support pricing. Accelerated depreciation has allowed some investors to maintain target return thresholds even without a corresponding increase in nominal cap rates. At the same time, pricing has become more increasingly differentiated across asset types.
Assets with strong fundamentals and meaningful depreciable components continue to attract consistent demand. In many cases, these properties are trading in the mid-5% to low-6% cap rate range, depending on tenant quality, lease structure, and location. By comparison, assets with more limited depreciation potential or weaker operating characteristics are experiencing more selective demand from buyers.
This widening separation reflects a broader shift in how investors are evaluating retail opportunities, with greater emphasis placed on both income durability and tax efficiency.
The effects of accelerated depreciation are most visible in retail assets where infrastructure and equipment represent a substantial portion of value.
In these cases, cost segregation studies allocate between 40% and 60% of the purchase price to shorter-life assets, allowing investors to capture firstyear deductions. The ability to immediately expense those components has materially improved year-one cash flow for many acquisitions.
Properties with extensive site improvements, mechanical systems, or specialized operational components have been the primary beneficiaries. Investor demand for these assets has remained consistent, supported by both tax advantages and stable underlying performance. Locations with strong throughput, established operators, and reliable revenue streams continue to attract a buyer pool.
The impact of restored bonus depreciation has been most pronounced in retail asset classes where infrastructure, equipment, and site improvements represent a significant portion of total value.
Gas stations and convenience stores are among the clearest examples. These properties tend to be among the most depreciation-heavy in the retail landscape, with substantial capital tied to underground storage tanks (USTs), fuel systems, canopies, and related site work. Under current tax treatment, a convenience store property may qualify as a retail motor fuel outlet if it meets one of several IRS criteria, including generating at least half of its gross revenue from fuel sales, dedicating at least half of its floor area to petroleum-marketing activity, or maintaining a building size of approximately 1,400 square feet or less. When a property satisfies one of these tests and is placed in service during a bonus-eligible year, investors may be able to deduct a substantial portion, potentially the full purchase price less land value, which is commonly estimated at around 20%, in the first year. Even if a site does not fully qualify under these tests, cost segregation studies still commonly reclassify roughly 25% to 50% of the acquisition value into shorter-life assets, allowing for accelerated depreciation. As a result, investor interest in fuel retail portfolios has increased, cap rates have remained relatively stable despite broader market uncertainty, and demand continues to center on high-volume locations operated by experienced groups.


Car washes have shown a similar pattern in the market, often to an even greater degree. With extensive mechanical systems and equipment-driven operations, these assets are particularly well suited for accelerated depreciation. In practice, allocations can exceed 50% of total project cost, and in some cases move materially higher depending on the format and equipment mix. When car washes are developed as freestanding tunnel formats, many of the structural and equipment components may also qualify for 100% bonus depreciation under current tax treatment. That dynamic can meaningfully improve acquisition economics, which has supported continued investment from private equity-backed operators and sustained buyer demand, especially for express tunnel formats.



The influence of restored bonus depreciation has not been uniform across the country.
In high-tax states, the value of accelerated depreciation is more pronounced. Investors with greater tax exposure are able to realize larger immediate savings, which has contributed to stronger demand in markets such as California and parts of the Northeast.


Markets with higher underlying real estate values have also seen more noticeable effects, particularly where improvements and infrastructure represent a larger share of total asset value.
Across the Sunbelt and Southeast, activity has increased as well. Population growth, expanding retail corridors, and a deep pool of private capital have combined with the tax change to drive additional transaction momentum. States such as Texas and Florida continue to see elevated levels of activity, particularly for necessity-based retail assets tied to daily consumer demand.

Quick service restaurants have also benefited, though to a slightly lesser degree. While typically anchored by long-term net leases and strong national brands, these properties still include meaningful interior buildout and equipment value. Cost segregation studies commonly place 20% to 35% of total value into shorter-life categories. From an underwriting perspective, the return of bonus depreciation has helped support transaction activity, largely by enhancing after-tax returns. Investor demand remains concentrated in drive-thru locations and high-traffic sites, with cap rates holding relatively steady across much of the segment.
Even in less equipment-intensive categories, such as dollar stores, the effects are still evident. Although these assets generally offer lower depreciation allocations, often in the range of 15% to 25%, they remain highly liquid within the net lease market and are widely favored by private investors seeking stable income. The incremental benefit of accelerated depreciation has improved overall return profiles, contributing to continued demand for operators such as Dollar General, Family Dollar, and Dollar Tree, particularly in secondary and tertiary markets.
The return of 100% bonus depreciation is influencing how retail investments are being evaluated at a more fundamental level.
Cost segregation is increasingly being incorporated into initial underwriting rather than treated as a post-acquisition consideration. Investors are placing greater emphasis on how much of a property’s value can be depreciated quickly and how those deductions align with their broader tax position.




Source: CoStar Group, Inc.








Dallas, TX New York, NY San Francisco, CA Miami, FL Boston, MA Tampa, FL LosAngeles,CA Houston, TX
This has led to a more detailed evaluation of asset composition, including site improvements, equipment, and other depreciable components. In turn, tax strategy is becoming more integrated into acquisition decisions alongside traditional considerations such as tenant credit, lease structure, and location.
For sellers, this shift underscores the importance of understanding how their assets perform from a tax perspective, as properties with stronger depreciation profiles are often attracting a broader and more competitive buyer pool.
In sectors where infrastructure and equipment make up a meaningful share of asset value, the effect has been especially noticeable, as accelerated depreciation directly enhances early-year cash flow and overall return profiles. As a result, investors are placing greater emphasis on these characteristics when evaluating opportunities, and that shift is increasingly reflected in both transaction activity and market positioning.
For investors, this environment makes it increasingly important to look beyond surface-level metrics. Identifying assets where tax efficiency can enhance returns may create a distinct advantage, particularly as competition increases for these property types. Looking ahead, the interplay between tax policy and fundamentals will remain a key factor in how capital is allocated across the retail landscape.
Real estate markets typically adjust gradually, with changes in interest rates, rent growth, and supply conditions influencing pricing over time. Tax policy tends to operate on a different timeline, often creating more immediate shifts in investor behavior.
The return of 100% bonus depreciation illustrates how a single legislative change can influence transaction activity, deal velocity, and pricing dynamics across the retail sector. It has also reinforced the importance of after-tax returns in investment decision-making, particularly among private investors.



GlobeSt.com — the commercial real estate industry’s trusted national brand—delivering essential insights and strategic intelligence across every region and property sector. We offer high-impact visibility for marketers through trusted editorial, nationally recognized events, and dynamic digital platforms. Backed by a legacy of industry leadership, we connect and engage owners, investors, lenders, developers, and brokers with the information and opportunities that drive CRE forward.
Our trusted team of industry experts is dedicated to delivering the key insights, in-depth analysis, and proven best practices essential for commercial real estate owners, investors, developers, brokers, and finance professionals. We’re here to celebrate innovation and success, providing our readers with digestible, actionable information that transforms complex trends into real-world applications—ensuring you stay ahead of the curve.
GlobeSt’s vibrant event portfolio features a mix of local and national forums tailored to tackle the most pressing challenges across sectors like Healthcare, Multifamily, Net Lease, and Women of Influence. Connect, network, and learn from industry leaders in an inspiring environment designed to drive your business forward. Don’t miss out on your chance to navigate the future of commercial real estate with confidence!

Reaching more than 300,000 CRE professionals across all markets, sectors and business disciplines, GlobeSt.’s unique integrated business model allows us to deeply understand the dynamic real estate industry and the evolving needs of our audience. Join our community today!

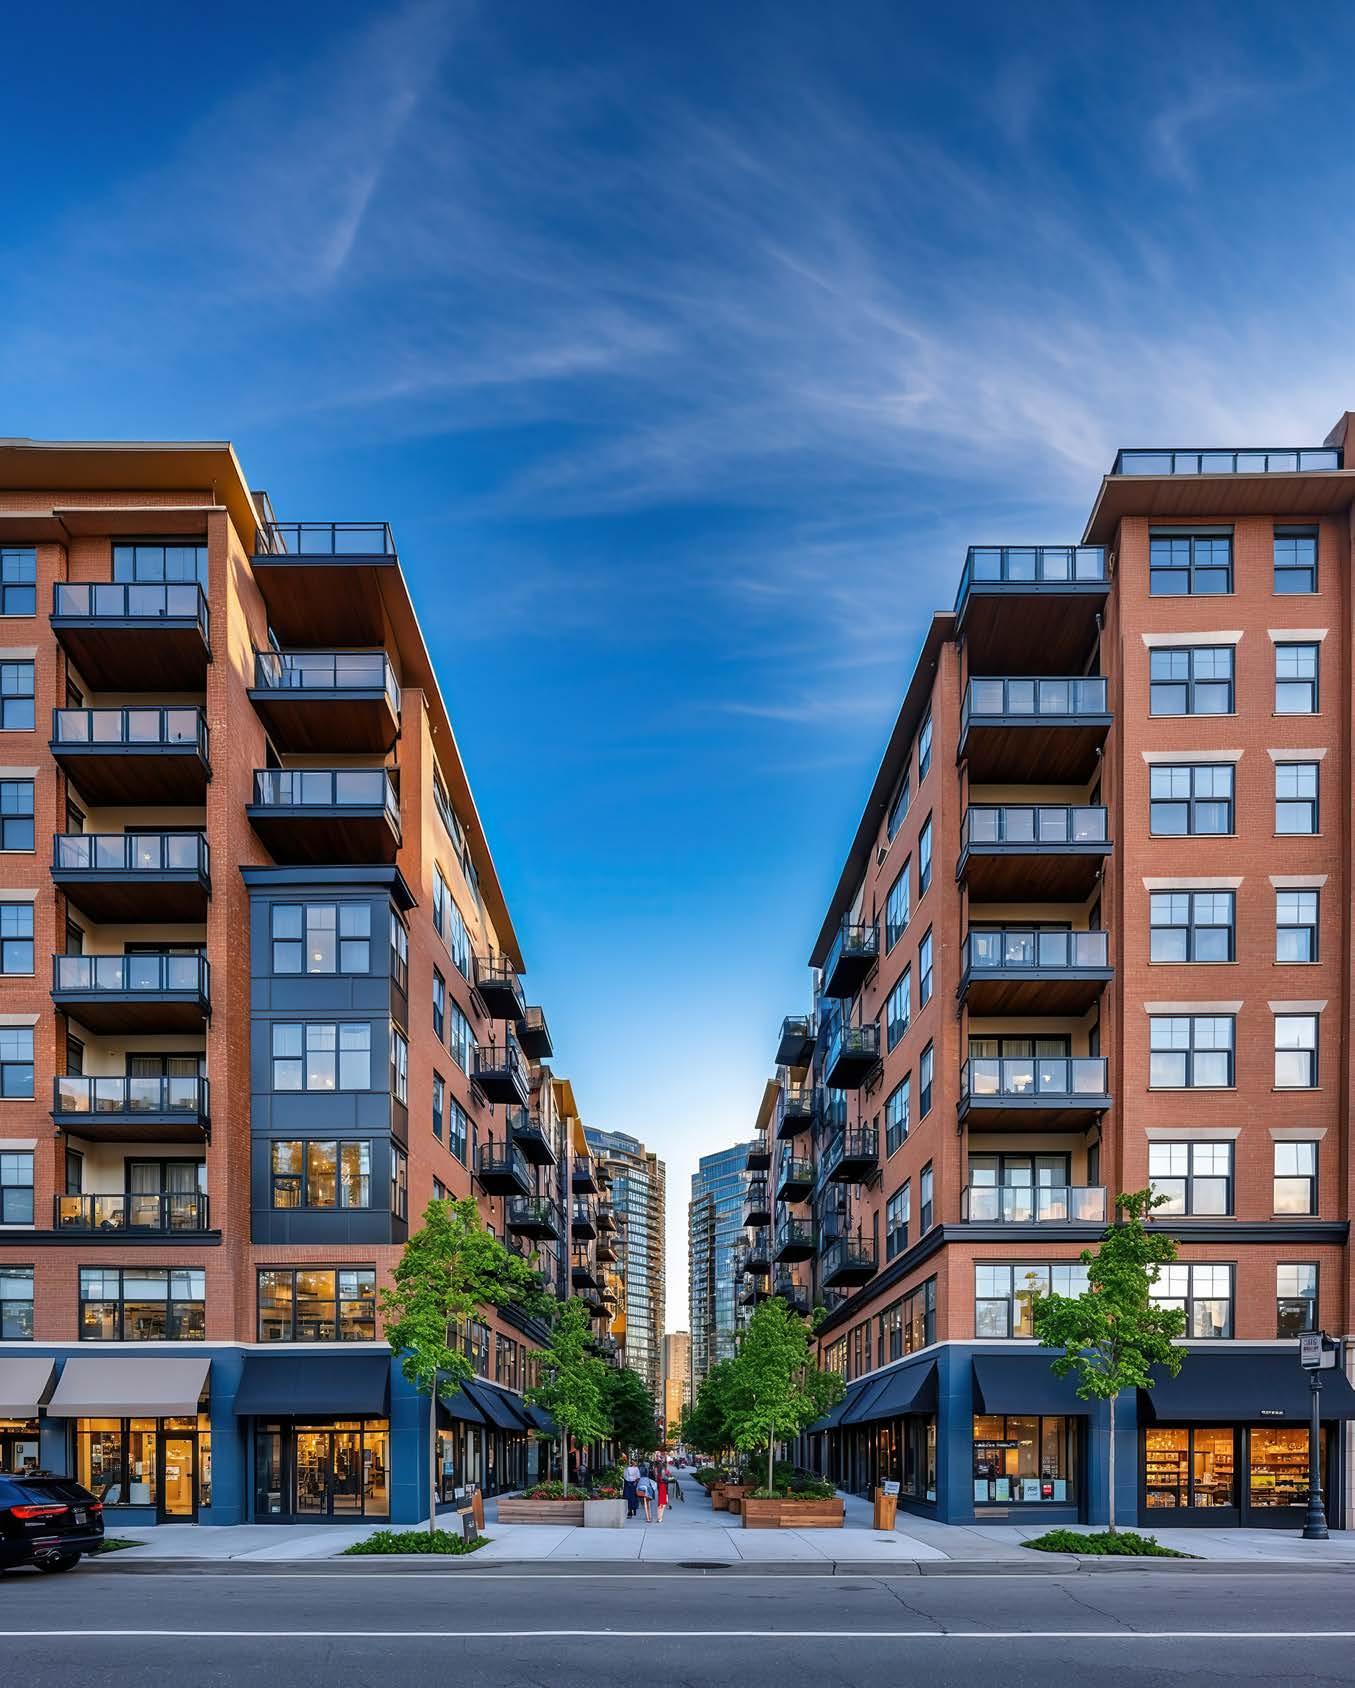

Urban retail is entering a period of reinvention. Across major metropolitan markets, spaces that once struggled with vacancy or declining foot traffic are finding new life through creative repositioning and adaptive reuse. Shifts in consumer behavior, the growth of e-commerce, and evolving lifestyle preferences have reshaped how people interact with retail environments, particularly in dense urban cores.
For many properties, these changes initially presented challenges. Traditional retail formats built for an earlier era of shopping have had to compete with shifting demand and changing tenant requirements. Yet those same pressures are now driving a wave of innovation. Owners, developers, and city leaders are increasingly reimagining underperforming retail assets, transforming them into dynamic spaces that better reflect how people live, work, and gather today.
In many cities, this transformation represents urban retail’s “second act”, one defined not by traditional storefronts alone, but by mixed-use formats, experiential tenants, and communityoriented environments.

Urban retail markets today reflect a complex yet improving landscape. While some legacy retail corridors continue to work through elevated vacancy or outdated layouts, many are stabilizing as landlords adopt more flexible leasing strategies and rethink how space is utilized. Several structural shifts have contributed to this reset. The growth of online shopping has reduced reliance on traditional brick-and-mortar retail for routine purchases. At the same time, urban populations, particularly younger demographics, are demonstrating a renewed preference for physical retail in specific contexts. According to information from RetailDive, nearly three-quarters of Gen Z consumers shop in-store at least once a week, and a majority view in-person shopping as an experience rather than a purely transactional activity.
This shift is especially pronounced in categories such as beauty and luxury, where Gen Z shoppers show a strong preference for in-person purchasing, valuing
immediacy, product interaction, and the overall shopping environment. At the same time, urban consumers are increasingly seeking experiences, dining, wellness, and social environments that cannot be replicated digitally. As a result, the role of physical retail is evolving. Rather than serving primarily as a transactional environment, urban retail is increasingly functioning as a place for engagement and community interaction. This shift is prompting landlords and developers to rethink how retail space can better align with modern consumer expectations, emphasizing experience, convenience, and seamless integration with digital behaviors.

In 2025, 16.4% of U.S. retail sales came from e-commerce; 83.6% are brick-and-mortar sales.
Source: U.S. Census Bureau

Two strategies central to urban retail’s evolution have emerged: repositioning and adaptive reuse.
Repositioning typically involves updating an existing retail property to better align with current demand. This may include renovating storefronts, modernizing layouts, curating new tenant mixes, or incorporating amenities that attract experiential retailers and service-oriented tenants.
Adaptive reuse, by contrast, often entails a more fundamental transformation, repurposing retail space into an entirely different use or integrating it into a broader mixed-use environment.
Post-Pandemic Retail Foot Traffic Recovers
COMMON STRATEGIES INCLUDE:
Mixed-use integration: Retail spaces are increasingly being combined with residential, office, hospitality, or entertainment uses, creating built-in customer bases and activating properties throughout the day.

Experiential and service-oriented tenants: Fitness studios, specialty food concepts, medical and wellness services, and entertainment venues are helping redefine how retail environments function.

Flexible and short-term concepts:
Pop-up shops, temporary activations, and short-term leases allow landlords to test new concepts while keeping spaces active and engaging.
Together, these approaches allow urban retail properties to evolve alongside consumer demand rather than compete directly with online alternatives.
Several major urban markets are demonstrating how repositioning strategies can successfully revitalize retail districts. Cities such as New York City, Chicago, Los Angeles, and Miami have seen renewed activity in formerly underutilized retail corridors as developers introduce mixed-use concepts and experiential tenants.
Successful markets often share several characteristics. Population density and strong residential growth provide a reliable customer base, while access to public transit and walkability support consistent foot traffic. Municipal support, including zoning flexibility, redevelopment incentives, and public-private partnerships, can also play an important role in accelerating revitalization efforts.
Developer innovation is equally important. Projects that thoughtfully combine retail with residential, hospitality, or entertainment uses are demonstrating how urban retail can function as part of a broader ecosystem rather than as a standalone asset class.
While the opportunity for repositioning is significant, executing these strategies in urban environments requires careful planning and alignment across multiple stakeholders.
Financial feasibility remains a key consideration, particularly in markets where construction costs, entitlement timelines, and land values remain high. Developers must balance the capital required for redevelopment with realistic projections for tenant demand and long-term revenue.
Regulatory processes can also shape project timelines. Zoning approvals, permitting requirements, and historic preservation considerations often require coordination with local governments and community stakeholders.
Equally critical is tenant curation. Successful repositioning efforts typically focus on building a complementary tenant mix that encourages repeat visits and sustained engagement. Retailers, restaurants, wellness providers, and entertainment venues can work together to create an ecosystem that keeps properties active throughout the day and evening.
Increasingly, developers are also measuring success through broader indicators such as foot traffic, community engagement, and placemaking impact, metrics that reflect retail’s evolving role in the urban environment.
As with any transformation, repositioning urban retail assets requires thoughtful execution. Projects that succeed are typically those that approach redevelopment with a clear understanding of local demand and long-term market dynamics.
Capital investment must be carefully aligned with achievable outcomes, particularly in complex urban projects where construction and entitlement costs can be significant. Similarly, tenant strategies must reflect the needs and preferences of the surrounding community to ensure sustained engagement.
The growing body of successful repositioning projects across major markets is providing valuable lessons for future developments. As developers gain experience with mixed-use strategies, experiential retail, and flexible leasing models, the industry is now better equipped to navigate potential challenges and unlock the full potential of these assets.

In 2025, 27% of the planned office conversion square footage in major U.S. markets was designated for mixed-use development.
Source: ICSC











Urban retail is entering a new phase defined by flexibility, experience, and deeper integration with surrounding uses. Traditional retail formats are giving way to more adaptive concepts.


Micro-retail enabling local entrepreneurship
growing role in helping landlords understand customer behavior, optimize tenant mixes, and activate spaces more effectively.


Experiential destinations blending retail, dining, and entertainment


Mixed-use environments integrating retail with living and working
These models reflect a broader shift toward spaces that prioritize engagement, convenience, and a sense of place.
Urban retail’s transformation is still unfolding, but the direction is increasingly clear. Across many cities, properties once considered underperforming are being reimagined through creative redevelopment and strategic reuse.
Rather than signaling the decline of urban retail, these changes are revealing its ability to adapt. By embracing mixed uses, experiential concepts, and community-oriented design, developers and investors are helping urban retail enter a new chapter, one that reflects how people live, shop, and gather today.
For developers, investors, and city leaders alike, the opportunity lies not simply in filling vacant storefronts, but in rethinking what urban retail can become in its next act.

By Matthews™ CEO & Founder, Kyle Matthews
matthewsreisresearch.substack.com



BY DANIEL GONZALEZ & PIERCE MAYSON
Source: Placer.ai









Grocery stores are the premier anchor of shopping centers nationally. Whether you’re stopping in to grab lunch or finishing your shopping for the week, grocers are an integral part of the everyday consumer’s routine. This trend is proven in grocery stores’ ability to maintain a stable share of visits despite increased retail competition. Retail buyers favor essential-needs anchors and service-oriented shops, like medical providers, salons, restaurants, etc. because they cannot be duplicated by the Amazons of the world.
However, as grocer tenants have come and gone over the years, the anchor slot is no longer a default. Landlords are assessing today’s top grocers and making decisions that will shape the long-term trajectory of their centers. While landlords in the current cycle view grocery anchor selection as a defensive necessity, they are increasingly viewing it as a proactive portfolio strategy.
GROCERY ANCHORS ARE STILL VIEWED as downside protection, but landlords are now underwriting them as a long-term traffic engine that shapes tenant mix, rent growth, and exit cap rates.
There are four primary tenants shaping the sector today. National operators Aldi and Whole Foods are pulling the market in opposite directions through fundamentally different expansion strategies. Meanwhile, regional powerhouses like Publix and H-E-B continue to dominate their territories. Despite leveraging a selective expansion approach, in comparison to Aldi and Whole Foods, they continue to define the market.
Each of these tenants bring a distinct combination of deal dynamics, customer base, and co-tenancy impact to shopping centers, that ultimately determine where they fit within a long-term portfolio strategy.
Aldi has done something no other grocery operator has managed at scale; it has made the hard-discount model genuinely aspirational for a broad American demographic. What was once a purely pricedriven proposition has evolved into a streamlined, label-heavy shopping experience that resonates across income levels. Its expansion numbers are extraordinary. Its traffic volumes are real. And its impact on a center’s in-line tenant mix is the factor landlords need to understand before they sign.
Aldi’s current position is the result of decades of disciplined execution. The company built its model around efficiency, with limited SKUs, smaller-format stores, lean staffing, and a supply chain designed to support consistently low prices. Now, in its 50th year in the U.S., Aldi is operating from a position of scale and confidence. The company plans to open more than 180 new stores across 31 states in 2026 alone and has committed $9 billion to expanding its U.S. footprint through 2028. That investment includes new distribution infrastructure in Florida and Arizona, as well as a push into new markets such as Colorado, where Aldi plans to open 50 stores within its first two years of entry. At the same time, the company is investing in a redesigned digital platform to support a more seamless and personalized shopping experience.


Aldi’s expansion plan is unmatched within the grocery sector. The company is actively pursuing sites across virtually every U.S. market tier and moving faster than any other operator. At the same time, a theme of focusing predominantly on single tenant stores has emerged in their expansion strategy. In contested markets, landlords regularly report multiple Aldi LOIs within a single year. Their strategy is built on speed and consistency because Aldi does not require perfect real estate; it requires enough viable sites to build density and reinforce its value positioning.
That approach translates into a distinct shopper profile. Aldi shoppers are highly consistent, valueoriented, and efficient in their trips. Their customers shop with intent, moving quickly through the store with limited dwell time. Basket sizes are controlled, and cross-shopping behavior is more necessitydriven than discretionary. This is a dependable customer base, but not one that typically extends into higher-spend, experience-driven retail.
Source: ScrapeHero | 2026 5 or
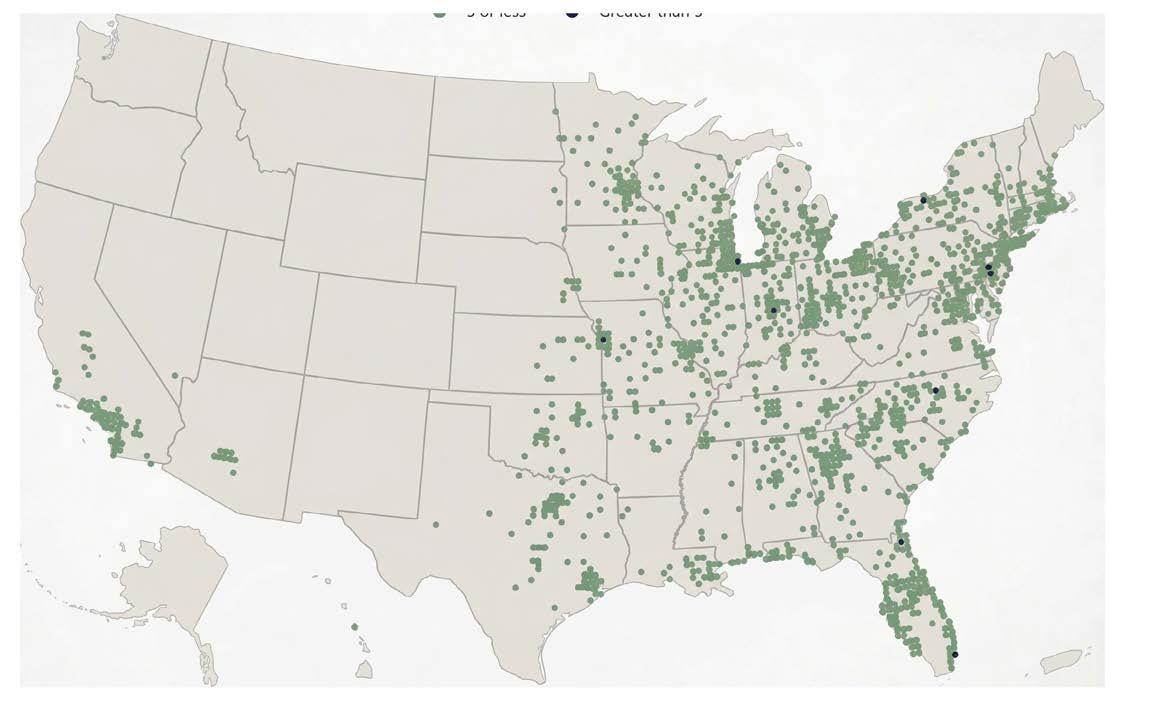
ALDI’S EXPANSION IS TRANSLATING into increased market share, particularly among value-oriented consumers as price sensitivity rises. The strategy has proven to be sustainable given their low-cost operating model, though site selection discipline will be key to avoid oversaturation.
For landlords, the implications for co-tenancy are material. Aldi generates steady, daily traffic, but it does not always create the kind of halo effect that supports premium in-line tenants. The tenant mix that performs best alongside Aldi tends to skew toward necessity and value, including discount soft goods, quick-service food, and service-oriented retail. Centers positioned for experiential retail or higher-margin concepts may see more limited spillover benefit.
The core strategic question is whether the center’s identity aligns with Aldi’s strengths. In trade areas where value and necessity drive consumer behavior, Aldi can be a highly effective anchor. In others, selecting Aldi may represent the most accessible deal rather than the one that maximizes long-term upside.
Concurrently, Aldi has become one of the most active re-anchoring solutions in the market. The company has stepped into a significant number of dark conventional grocery boxes, particularly in older centers where traditional operators have exited. Its smaller footprint often requires subdivision, but that constraint can enable deals that would otherwise not pencil. For many landlords, Aldi is not just an option; it’s a viable path to restoring traffic and stabilizing an asset.

Whole Foods under Amazon has become a different kind of anchor story. The brand equity is intact, and in many markets, it’s stronger than ever. But the deal dynamics, technology integration, and questions around format evolution have introduced a level of complexity that did not exist five years ago. For landlords who can meet the bar, the upside is meaningful.
The 2017 acquisition altered the numbers. Whole Foods is no longer just a grocery tenant; it is part of Amazon’s broader ecosystem. At various points, its stores have functioned as fulfillment nodes, last-mile hubs, and testing grounds for new retail technology. That strategy continues to evolve, but the implication for landlords is clear. Understanding what Amazon wants from its real estate, not just what Whole Foods needs as a grocer, is now part of the underwriting.
This evolution adds both value and complexity to the brand. Amazon’s scale and logistics capabilities strengthen the long-term relevance of the stores, while also introducing new layers of underwriting. Landlords are no longer evaluating a grocer alone; they are evaluating how a global platform intends to use the space.
The main difference between Whole Foods and Aldi is their expansion strategies. Where Aldi moves aggressively, Whole Foods expands deliberately. The company targets trade areas with defined thresholds for income, education, and population density; the result is a smaller pool of viable sites and a slower, more selective process.



That behavior translates directly into co-tenancy strength. The Whole Foods shopper is the exact demographic most premium in-line tenants are targeting, including specialty food and beverage, boutique fitness, wellness concepts, upscale services, and lifestyle soft goods.
There is also an emerging signal at the top end of the market. As the premium grocery category continues to evolve, Erewhon’s early moves outside California offer a first look at what a tier above Whole Foods might look like. While it’s still too early and too geographically limited to draw firm conclusions, it introduces a new question for landlords. If Whole Foods defines the premium anchor today, is there room for a concept above it to anchor a center as well? For now, Whole Foods remains a leading premium grocer, particularly in coastal markets where income levels and consumer preferences can support further segmentation at the high end.
WHOLE FOODS MARKET TYPICALLY accelerates leasing velocity and pushes rents to the top of the submarket due to its affluent customer base. It also attracts higher-quality tenants (fitness, boutique retail, fast casual) that are willing to pay a premium to be nearby.
Whole Foods suits investors prioritizing long-term quality over scale. In right markets, they don’t just anchor a center; they elevate it.
Publix and H-E-B belong in the same category not because they operate the same way, but because they deliver the same outcome. Each grocer has the ability to redefine a center’s trajectory, attract a level of tenant demand that other grocers cannot replicate, and set the standard within its respective territory.


PUBLIX AND H-E-B BOTH PROVIDE non-discretionary, recurring traffic that most retailers can’t replicate. They also create daily visit patterns, which support smaller shop tenants and stabilize occupancy through economic cycles.
Both operators are regionally concentrated, operationally disciplined, and deeply embedded in their markets. That combination makes them less widespread than national grocers, but far more influential where they operate, often shaping not just individual centers but entire trade areas.
Publix is the anchor landlords across the Southeast prioritize, and increasingly the one they compete to secure in newer markets. Employee-owned and financially conservative, the company has built its model on consistency, service, and long-term thinking, with that discipline extending into its real estate strategy.
Within its footprint, Publix organizes expansion through regional teams that tailor site selection, store format, and development type to the surrounding community. Store prototypes, center configurations, and tenancy mixes are adjusted to local demand while maintaining a consistent customer experience, allowing Publix to scale without losing its identity.
PUBLIX HAS EMERGED AS ONE OF the most competitive acquirers of its own shopping centers in recent years, accounting for an average of roughly 40% of all transactions involving Publixanchored properties since 2024. In particular, for newly developed Publix locations, the company is often the most active and aggressive buyer, especially when it comes to pricing.
The vast majority of the buyer pool for Publixanchored assets is finding it hard to compete with Publix on pricing due to the typically flat structure of the Publix lease, which provides a low relative return, especially in conjunction with a typical asking cap rate for a new Publix center, in the 5.5-6% range.
In its core markets, Publix is often the expected anchor. In newer geographies such as Virginia, Kentucky, and emerging Sunbelt corridors, it becomes a competitive pursuit among landlords, not simply a leasing opportunity but a strategic win. The value is not just in filling the box; it is in securing a tenant that drives consistent traffic, supports a wide range of in-line uses, and delivers long-term stability across cycles.
Publix represents reliability. The covenant is strong, the customer base is loyal, and performance is steady, making it less about upside volatility and more about durable, predictable returns.
In Texas, H-E-B operates at a different scale of influence, where a new store announcement functions less like a lease signing and more like a market signal. The company’s real estate strategy is central to that position, built on a long-term approach that prioritizes control of key sites well ahead of development.
H-E-B often acquires land 10 to 15 years in advance in high-growth corridors, targeting hard corners, major roadways, and master-planned communities where visibility and access can be secured for decades. This early positioning allows the company to align store openings with population growth rather than react to it.
When development follows, the execution reinforces the strategy. Stores are designed as destinations, with format, scale, and merchandising tailored to the trade area, creating a shopping experience that drives both frequency and loyalty. The result is not just strong store performance, but a broader impact on the surrounding retail environment.


This approach has turned the company’s real estate strategy into a competition. H-E-B does not follow growth patterns in Texas; it helps direct them, leveraging site control and operational strength to generate some of the highest grocery sales volumes in the country and outperform national competitors within its core market.
For landlords, the implication is straightforward. The value is clear, but access is limited to sites that meet H-E-B’s long-term criteria, making qualification the primary hurdle.
FOUR ANCHORS, FOUR STRATEGIES, FOUR
FASTEST-GROWING GROCER
VALUE-DRIVEN, HIGH- FREQUENCY TRAFFIC
SMALL FORMAT ENABLES RE-ANCHORING
STRONG NECESSITY CO-TENANCY
LIMITED PREMIUM HALO
BEST-IN-CLASS GROCERY COVENANT
LOYAL, REPEAT CUSTOMER BASE
STABLE TRAFFIC ACROSS CYCLES
PREMIUM ANCHOR WITH STRONG HALO
The anchor decision is no longer about filling space; it is about selecting a strategy. Each operator brings a different combination of box size, expansion velocity, tenant improvement expectations, covenant strength, co-tenancy impact, shopper profile, and geographic reach. The right choice depends less on availability and more on alignment with the asset and trade area.
The decision is ultimately determined by three key questions. What is the center’s strategic identity? Who is the trade area’s actual shopper? And what does the 10-year model look like with each of these operators in the box?
of income and predictability of traffic. Grocery-anchored centers, especially with names like Publix, H-E-B, Aldi, and Whole Foods Market, offer stable cash flow, high renewal probability, and strong residual land value, which compresses cap rates and drives consistent investor demand .

FLEXIBLE, COMMUNITYBASED FORMATS
RELIABLE LONG-TERM SOUTHEAST ANCHOR

DRIVES RENT GROWTH AND REPOSITIONING
HIGH-INCOME, EXPERIENCE-DRIVEN SHOPPERS
SELECTIVE SITES, LIMITED SUPPLY
AMAZON-BACKED ECOSYSTEM
DOMINANT TEXAS GROCER
LONG-TERM SITE CONTROL STRATEGY
DESTINATION-DRIVEN TRAFFIC
TOP-TIER SALES VOLUMES
STRONG COMPETITIVE MOAT
The grocer wars are real, and the stakes are high. The landlords and investors who understand exactly what each operator brings, not just to the anchor space but to the entire ecosystem of the center, are the ones who will build the assets that define the next market cycle.

daniel.gonzalez@matthews.com (305) 395-6972
pierce.mayson@matthews.com (813) 709-8585

By Austin Graham

At the height of the market, access to capital and deal flow expanded rapidly. A new wave of syndicators and first-time operators entered the space, many drawn by the visibility of out sized returns and the perception that multifamily was a one-directional trade.
In many cases, those groups were willing to take on higher leverage, shorter-term debt, and more aggressive assumptions in order to win deals. Execution risk was often underestimated, and underwriting frequently left little margin for shifts in interest rates, operating costs, or leasing performance.
As liquidity has tightened and capital has become more selective, the buyer pool has shifted back toward more experienced operators and well-capitalized investors.
Institutional buyers, established regional
Source : Altus Group

operators, and experienced groups are again dominating transaction activity. Meanwhile, many newer entrants have stepped to the sidelines or are working through assets acquired under more optimistic assumptions.
At the same time, investors who allocated capital during the peak are now placing greater emphasis on track record, discipline, and operational capability when selecting partners. The focus has shifted away from rapid growth and toward consistency and execution across market cycles.
The result is a more competitive environment, but one where bids are grounded in fundamentals.
If the previous cycle was driven primarily by revenue growth, the current one is defined by cost control and operational efficiency.
Operating an apartment asset today is materially more complex than it was just a few years ago. Property taxes and insurance costs have risen sharply in many markets, particularly in highgrowth Sunbelt regions where reassessments and natural disaster risk have pushed expenses higher. Payroll costs have increased as operators compete for skilled maintenance and leasing staff, while construction-related inflation has raised the cost of unit turns, repairs, and capital improvements.

Debt strategies during the market’s peak were largely built around speed and flexibility.
At the same time, rent growth has slowed significantly from the historic levels seen during the pandemic-era housing shortage. In some markets, new supply has created short-term pressure on occupancy and pricing power, requiring operators to compete more actively through concessions, marketing, and resident retention strategies. Delinquency has also become a more meaningful variable in certain tenant segments as household budgets adjust to higher living costs.
These pressures have compressed margins and exposed operational inefficiencies that may have gone unnoticed in a rising market.
In response, owners and operators are placing greater focus on expense management, process improvement, and scalability. Portfolio-level purchasing, centralized leasing models, and more data-driven asset management are becoming increasingly common. Technology is playing a larger role as well, with many groups exploring ways to integrate automation and artificial intelligence into leasing, maintenance scheduling, and back-to-office operations.
Performance today is less about how quickly rents can be pushed and more about how effectively an asset can be run.
Bridge loans and floating-rate structures were widely used, often paired with value-add business plans that relied on near-term rent growth to drive refinancing or sales. In a low-rate environment with strong demand for housing, that approach allowed investors to amplify returns while maintaining relatively short hold periods.
Many of those loans are now approaching maturity in a very different capital markets environment. Higher borrowing costs and lower asset valuations have created refinancing gaps for some properties, requiring additional equity contributions, loan modifications, or extensions. In certain cases, assets acquired with aggressive leverage have become difficult to refinance altogether without substantial restructuring.
That experience has driven a clear shift in how investors approach financing today. There is a renewed preference for longer-term, fixed-rate debt, often sourced through agency lenders or other stabilized financing channels. Investors are prioritizing lower leverage, stronger debt service coverage, and structures that provide flexibility across changing market conditions.
Debt is no longer viewed simply as a tool to enhance returns. It is increasingly treated as a central component of risk management.
Perhaps the most meaningful change is in how deals are evaluated.
Underwriting often relied heavily on forwardlooking assumptions to justify pricing.
Rent growth projections were frequently aggressive, expense growth was understated, and exit assumptions often depended on continued cap rate compression.
In today’s market, that approach no longer holds. Underwriting has shifted towards inplace performance and downside protection. Rent growth assumptions are more modest and frequently aligned with long-term historical averages rather than short-term spikes. Expense projections are
Source: First American Title | September Year-Over-Year
more conservative and reflect the persistent inflationary pressures affecting property taxes, insurance, and labor.
Exit cap rates are typically modeled wider than entry, and sensitivity analyses have become a more prominent part of the investment process.
Just as important, there has been a shift in how investors think about value. Where cap rates once served as the primary lens for evaluating acquisitions, basis has taken on equal importance. Investors are increasingly focused on replacement cost, comparable sales history, and the long-term durability of an asset’s location and tenant demand.
Rather than asking what yield a property offers today, buyers are asking whether the entry price provides sufficient protection across a range of economic outcomes.
Multifamily Potential Cap Rate



While underwriting standards have tightened, capital has not disappeared. Instead, it has become more targeted. Investors are increasingly concentrating on markets with durable population growth, diversified employment bases, and long-term housing demand.
Source: Matthews™ Research
These markets share many of the characteristics investors prioritize: population growth, constrained housing supply, and employment drivers that support long-term renter demand.
The current multifamily environment is marked by greater discipline, yet it is far from static. Real estate markets inherently move in cycles, with investor behavior closely following shifts in liquidity and capital availability. As interest rates stabilize and transaction activity gradually increases, risk tolerance is likely to expand, drawing new participants into the market. The caution and selectivity that define today’s conditions will eventually give way to renewed competition for assets, a dynamic that has repeated across past cycles and reflects the enduring rhythms of real estate investing.
This ongoing reset does not eliminate future volatility. Instead, it provides a clearer framework for evaluating and managing risk when market conditions are less forgiving, allowing investors to make informed decisions that balance opportunity with prudence.
The multifamily sector today is defined less by rapid appreciation and more by execution and operational precision. The buyer pool is more experienced, financing is structured with stability in mind, and underwriting reflects a broader range of potential outcomes. Those best positioned in this environment are not counting on a return to peak conditions. Rather, they are the investors who can operate effectively within current constraints while remaining agile enough to respond


Why $1.5T in Maturing CRE Debt Will Drive a Surge in Deal Activity
BY ANDREW MARCUS


Commercial real estate is staring down one of the most consequential refinancing cycles in modern history.
According to the Mortgage Bankers Association, $875 billion in commercial and multifamily mortgage debt is scheduled to mature in 2026, with another $652 billion coming due in 2027.
Many of these loans originated 5 years ago when borrowing costs were between 3% and 4%. Today, refinancing rates sit closer to 6-7%.
Another part of these loans are underwater deals that were extended in 2025.

MBA’s 2025 Commercial Real Estate Survey of Loan Maturity Volumes, released at its February 2026 convention, lays out the numbers clearly. Of the $5.0 trillion in outstanding commercial mortgages held by lenders and investors, 17%, or $875 billion, is scheduled to mature this year. This figure is down 9% from the $957 billion that was scheduled to mature in 2025, but still historically elevated.
A significant share of 2026 sales volume is carrying over. Between 2023 and 2025, lenders and borrowers opted to extend maturing loans rather than
force resolutions at unfavorable rates. Early estimates suggest only 50-55% of the $957 billion sales volume in 2025 was actually paid off. The remainder rolled into the 2026-2027 window.
MBA’s data makes clear that this is not a single-sector story. The maturity wall hits every major commercial property type, with concentration varying by sector and lender channel.
This time is different. Lenders made it clear “extend-and-pretend” is over. 2026 extensions so far will only last a few months & are not expected to kick into 2027.
Source: Mortgage Bankers Association
On the lender side, depositories hold $396 billion (21% of their portfolios) maturing in 2026, while CMBS, CLOs, and ABS account for $200 billion (25%). Credit companies and warehouse lenders
face the steepest percentage exposure at 29%, with $163 billion coming due. The GSEs, Fannie Mae, Freddie Mac, FHA, and Ginnie Mae, report roughly $39 billion in maturities.








What transforms routine maturities into a catalyst for deal activity is the interest rate environment. S&P Global’s analysis pegs the average rate on recently originated CRE loans at approximately 6.2%, versus 4.3% on the debt being replaced. This jump of roughly 200 basis points is likely to grow as the year progresses, and lower rate deals that were extended are forced to refinance.
MBA forecasts the 10-year Treasury will average 4.2% in 2026, with only a single, potential federal funds rate cut this year.
Bad news for investors that took short-term extensions last year hoping for lower rates.
That spread has real consequences. A property financed at 3.5% may not be able to carry the same debt load at 6.5% unless rents have grown enough to offset higher debt service. When debt service coverage ratios fall below lender thresholds, owners either bring fresh capital to the table or sell.
This will be especially pronounced in office, industrial, and multifamily sectors, where fundamental performance has weakened due to demand changes or massive supply expansions.
Source: Matthews™ Research, Federal Reserve


At its core, the thesis is straightforward. Borrowers who can’t refinance must act, and when the math no longer works at today’s rates, assets trade.
This trend is already being reflected in the current market. Transaction volume climbed meaningfully through 2025, with each quarter building on the last. By the fourth quarter, deal activity was running more than 20% ahead of where it had been a year earlier. January 2026 picked up right where Q4 left off; listings surged, bidding pools deepened, and deals above $100 million became routine rather than exceptional. This isn’t a single-sector story. The recovery in sales volume is broadbased, spanning industrial, retail, multifamily, and even office.
On the lending side, this picture reinforces the sales thesis. Banks have largely stopped tightening CRE lending standards after years of pulling back. New origination activity is running at its strongest pace since 2022, and CMBS issuance hit postfinancial-crisis highs last year. Capital is available again for buyers who want to transact.
But here’s the key dynamic: lenders are growing stricter with maturing debt and extensions while simultaneously becoming more accommodative on new originations. That divergence is the engine. Existing borrowers who can’t meet today’s underwriting standards are being pushed toward resolution. New buyers who can meet those standards are finding a lending market that actually wants their business.


That’s a perfect setup for well-capitalized buyers.
The bid side of the equation is strengthening at the same time. Pricing has stabilized across every major property type after two years of uncertainty. Buyers who sat on the sidelines waiting for a floor now have one.
When a wave of motivated sellers meets a market where acquisition financing is more available than it’s been in three years, deals get done. The “dry powder” narrative, circulating in early 2025, is still there.
The sheer volume of debt maturing makes the outcome unavoidable. Even if only a fraction of borrowers can’t refinance at sustainable terms, the amount guarantees a meaningful increase in properties coming to market out of necessity. And unlike 2023 and 2024, when lenders were content to extend and buyers lacked conviction on pricing, both sides of the transaction are now ready to move.
The commercial real estate market is at an inflection point. The combination of $875 billion in 2026 maturities, another $652 billion in 2027, and a refinancing environment roughly 200 basis points above origination rates creates a powerful and unavoidable catalyst for transaction activity across every property type.
What everyone needs to remember though is these are financial market problems. Overall, property performance and the outlook for vacancies, rent growth, and demand are strong across almost every property type.
When an investor is forced into a transaction, that is where value is likely to be found this year. An asset itself may be great, but the financial structure of the initial owner’s deal could be your next opportunity.











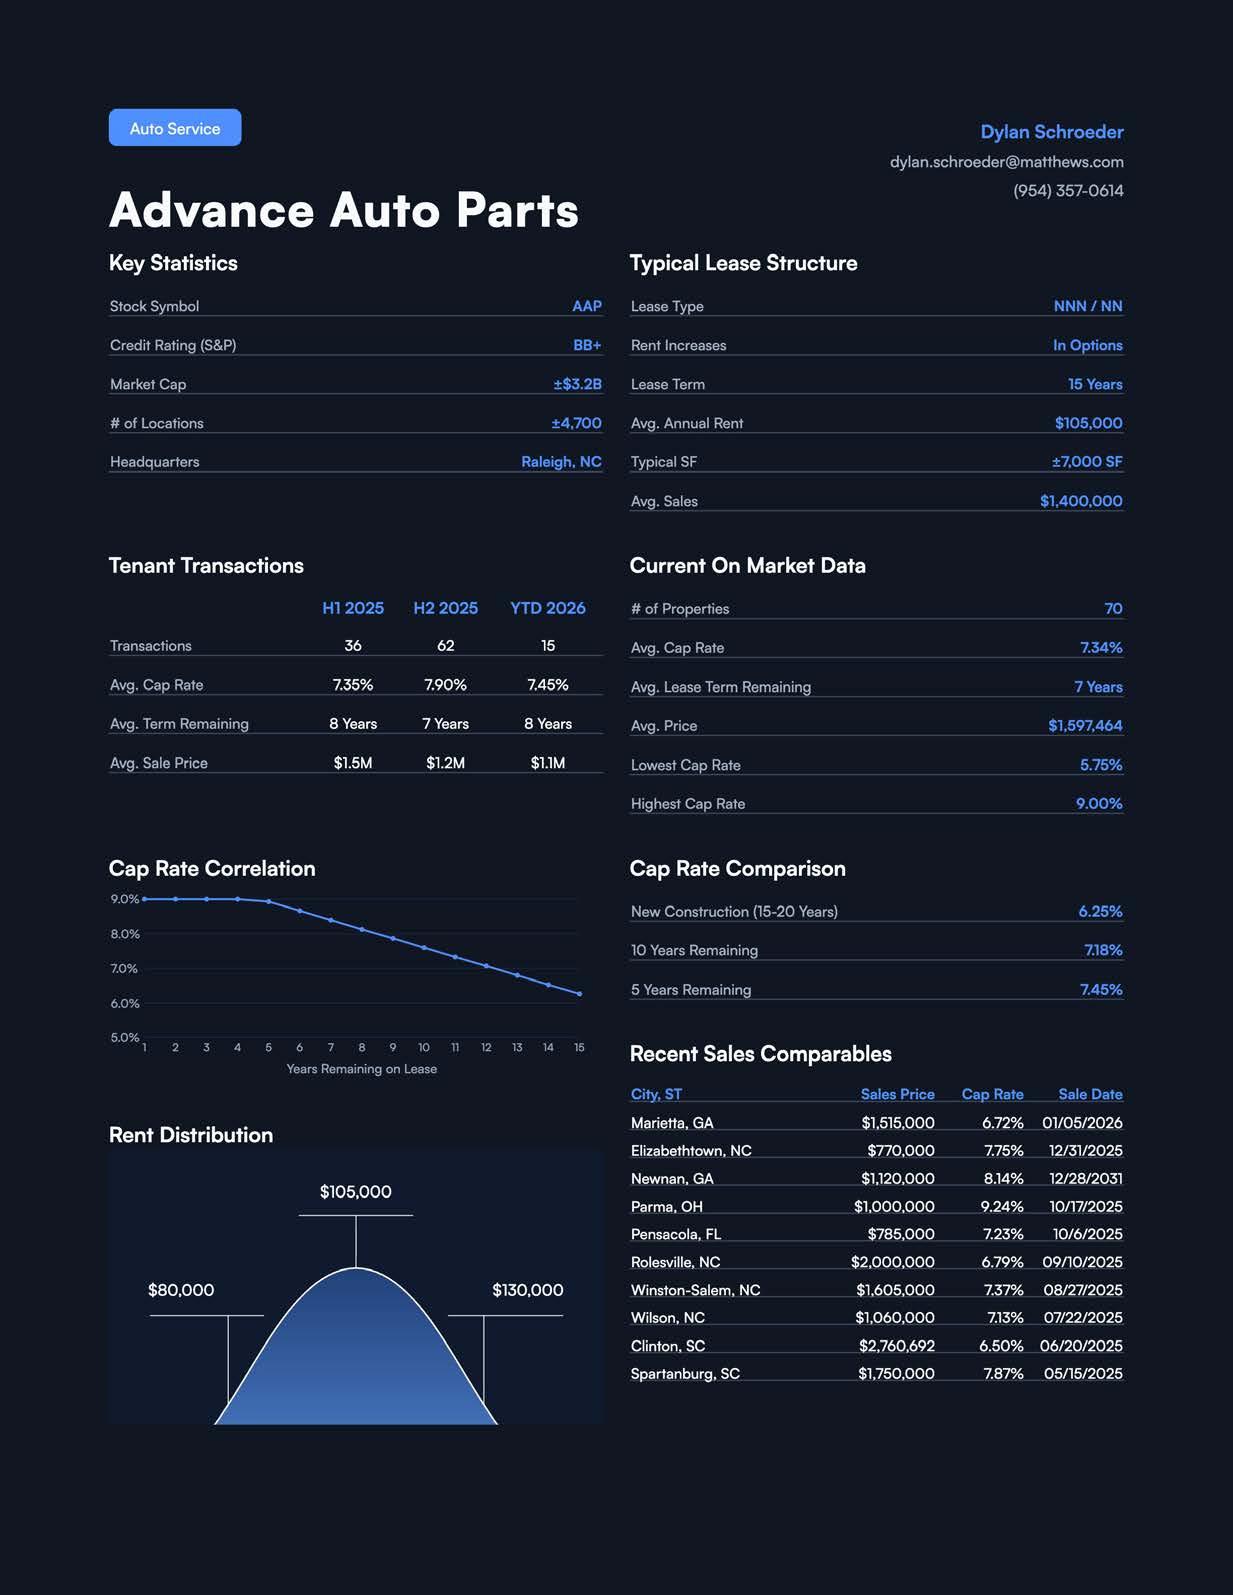
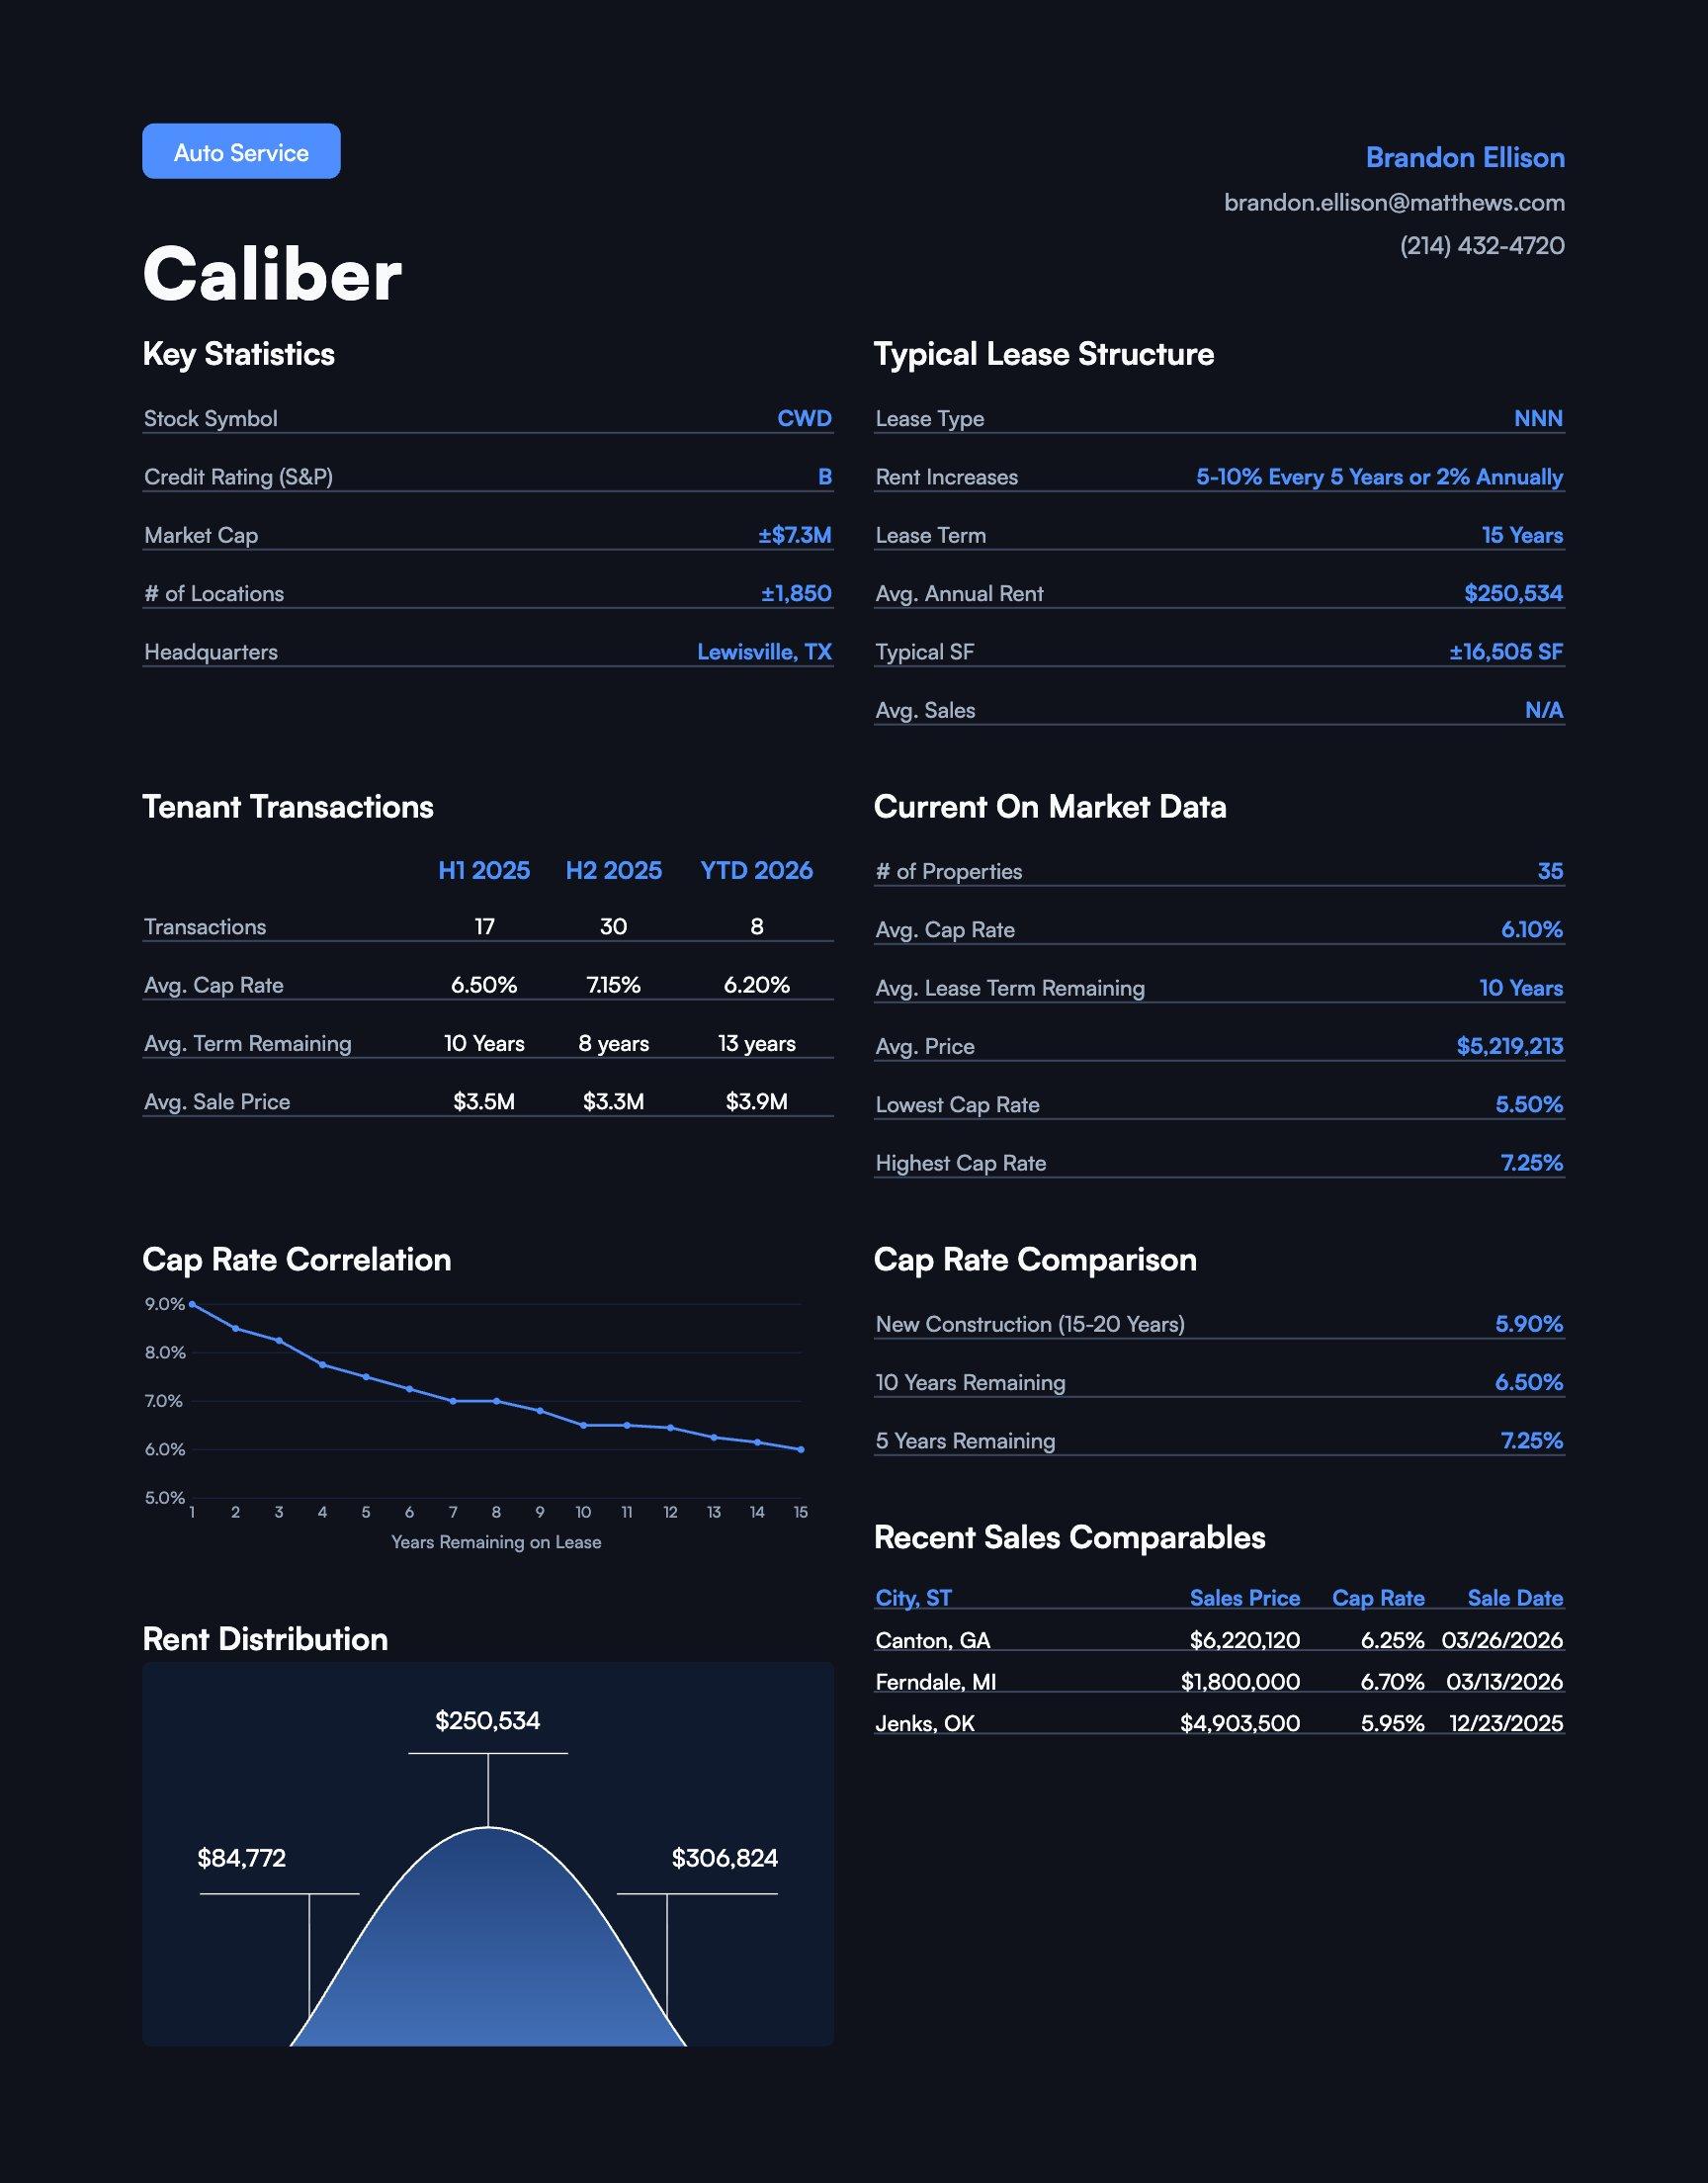
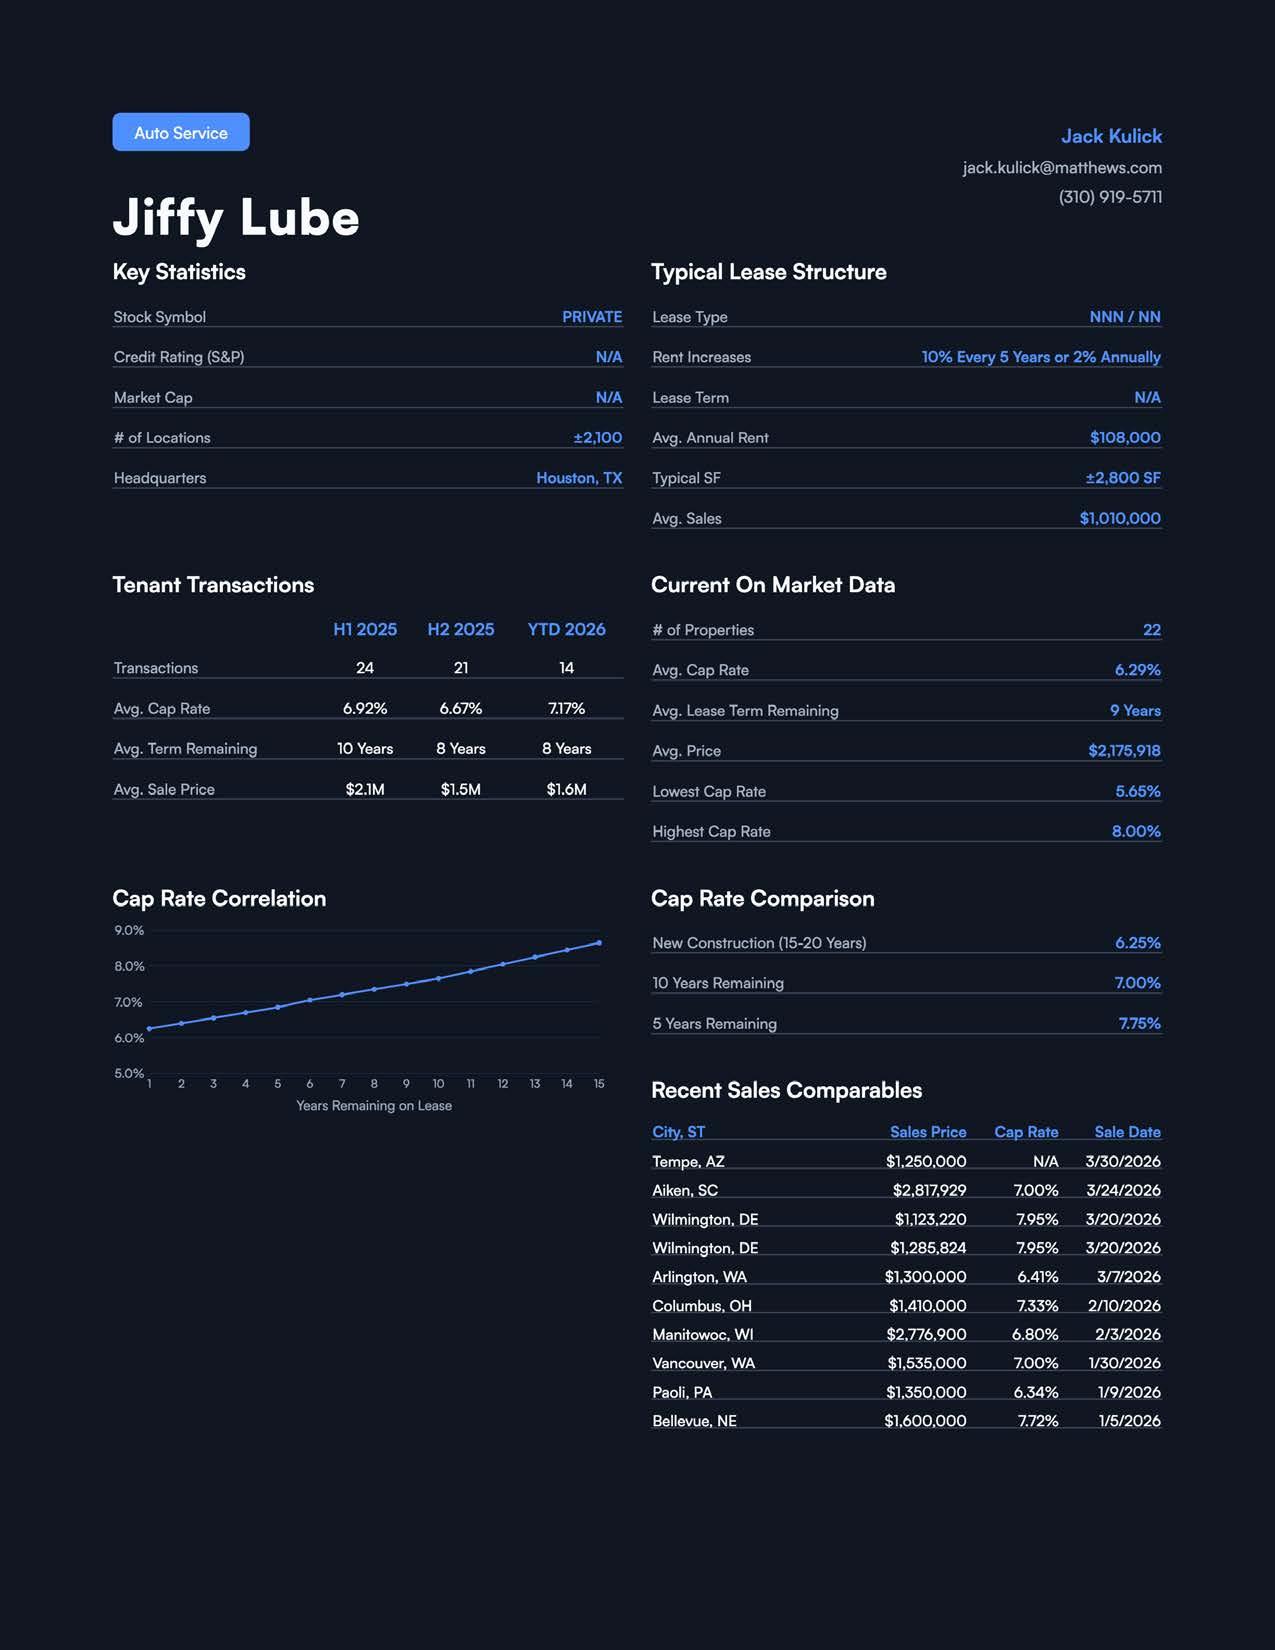
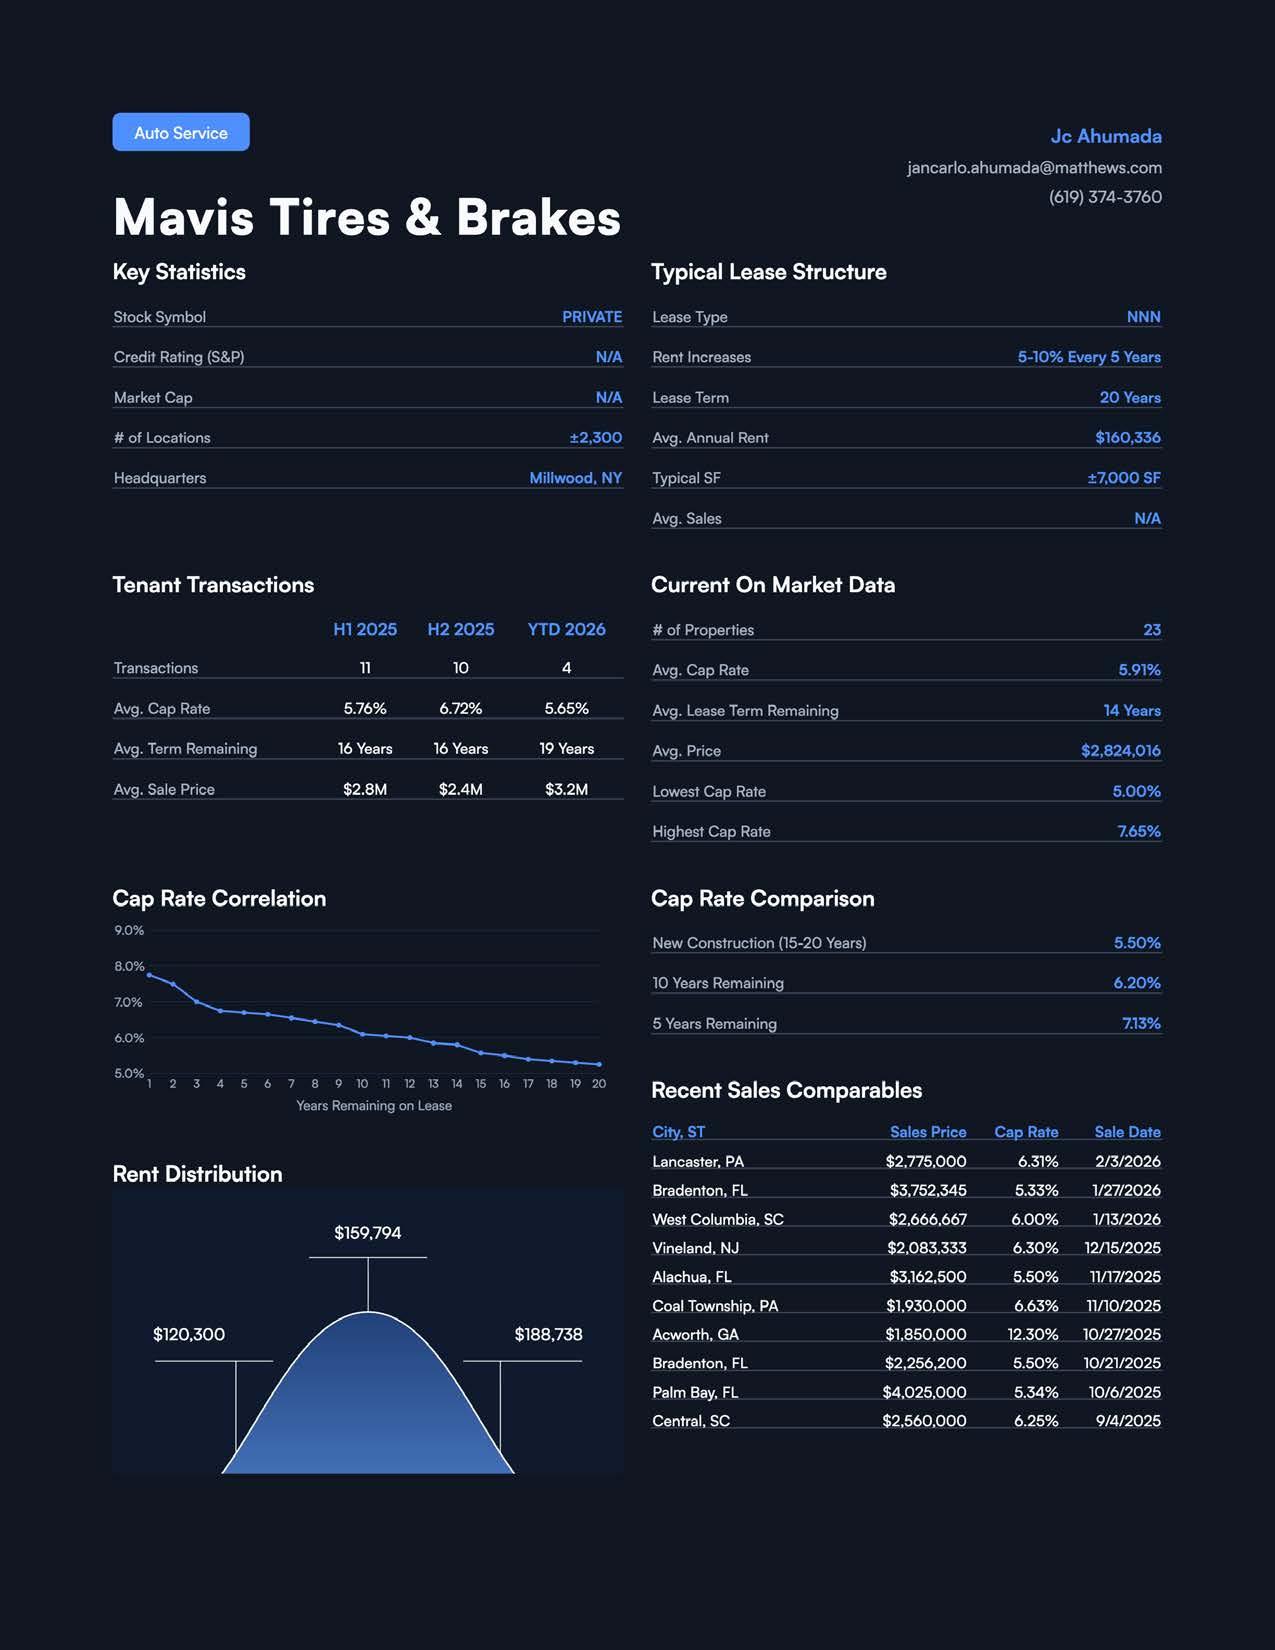
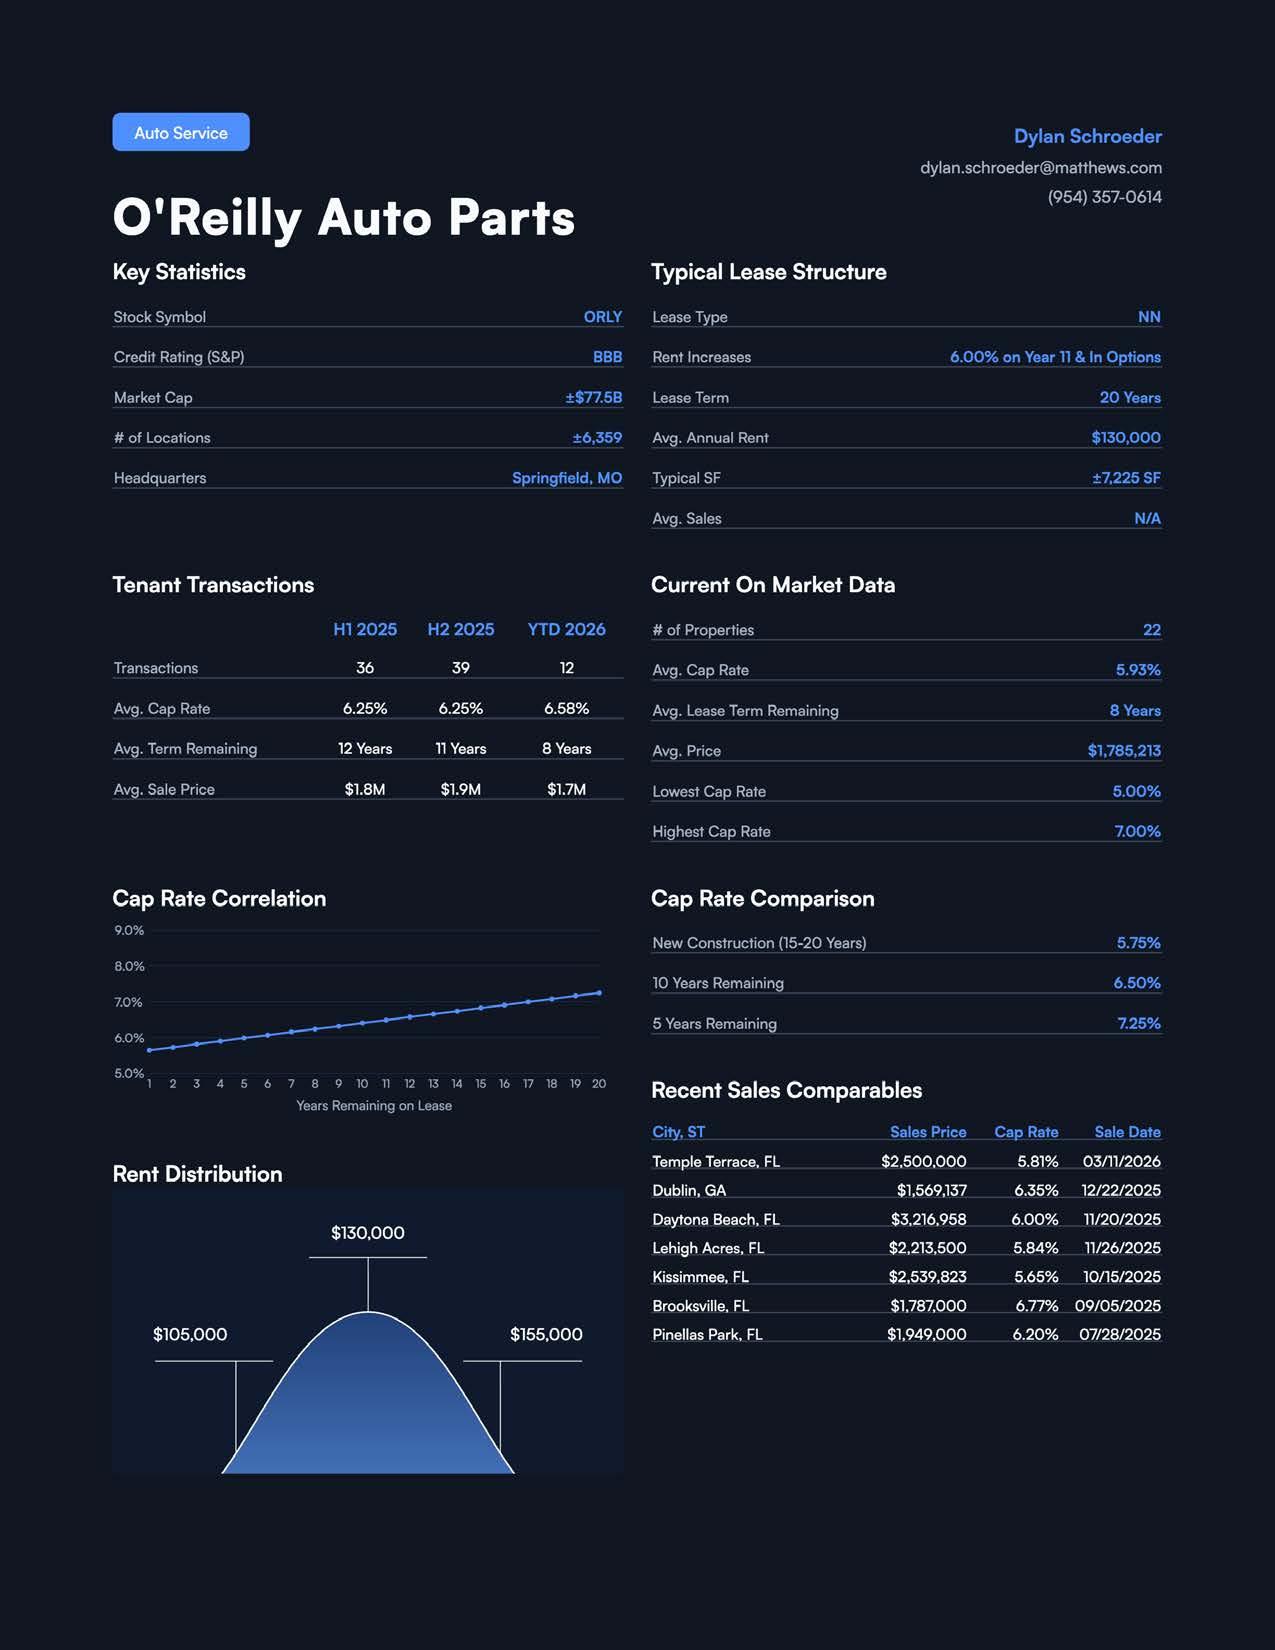
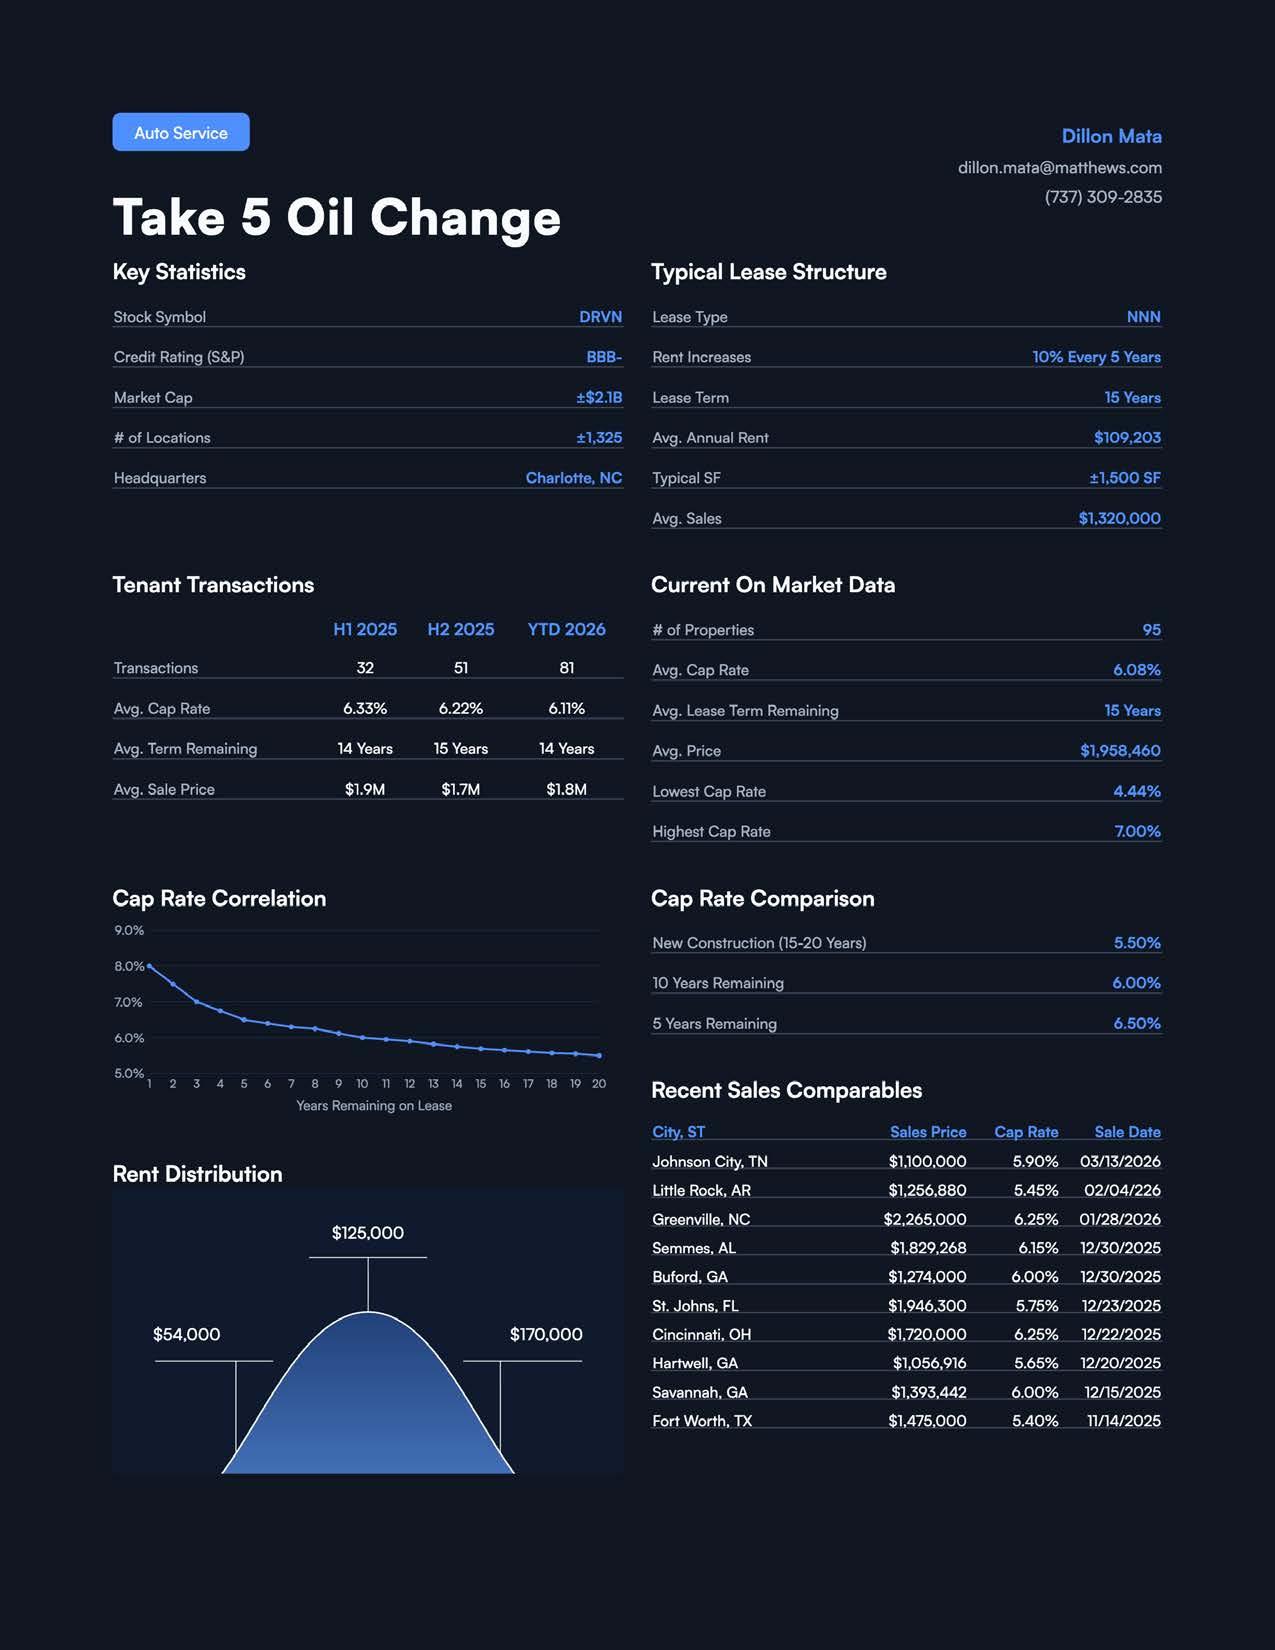
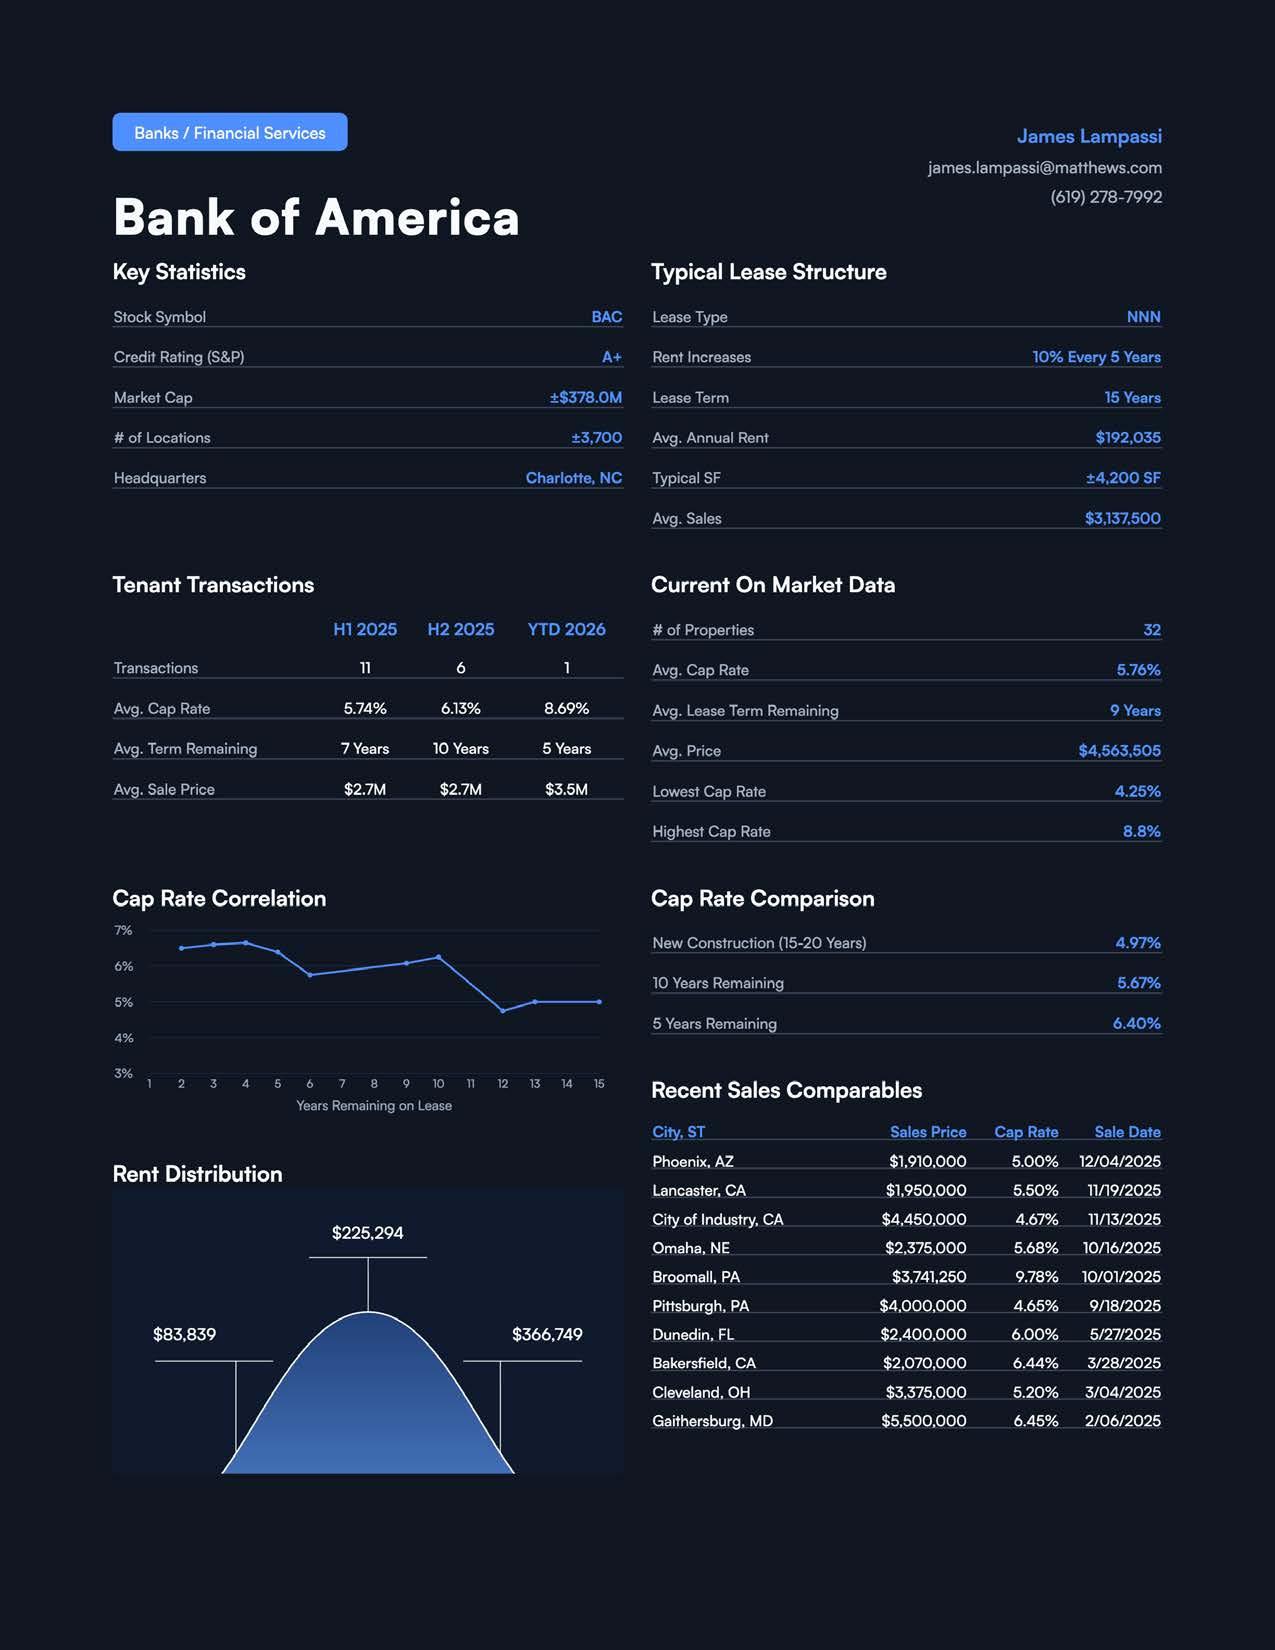
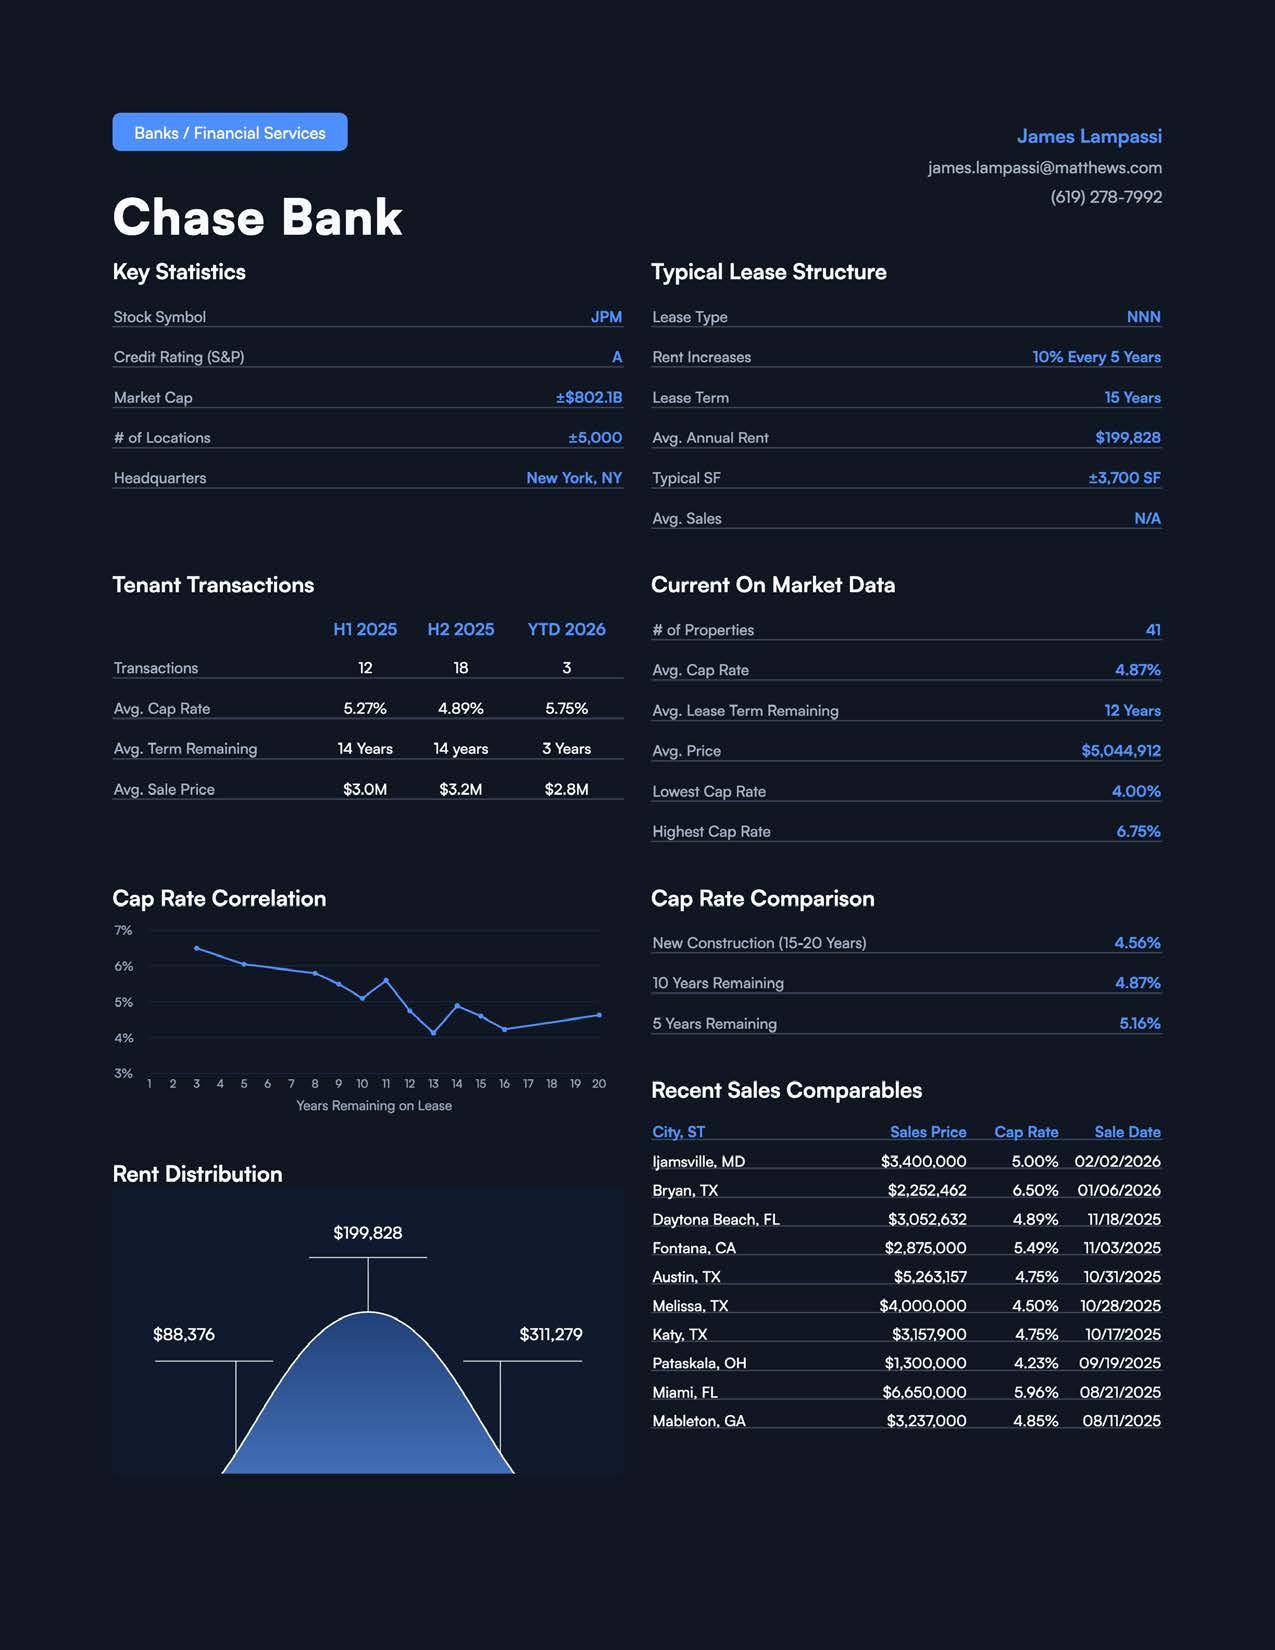
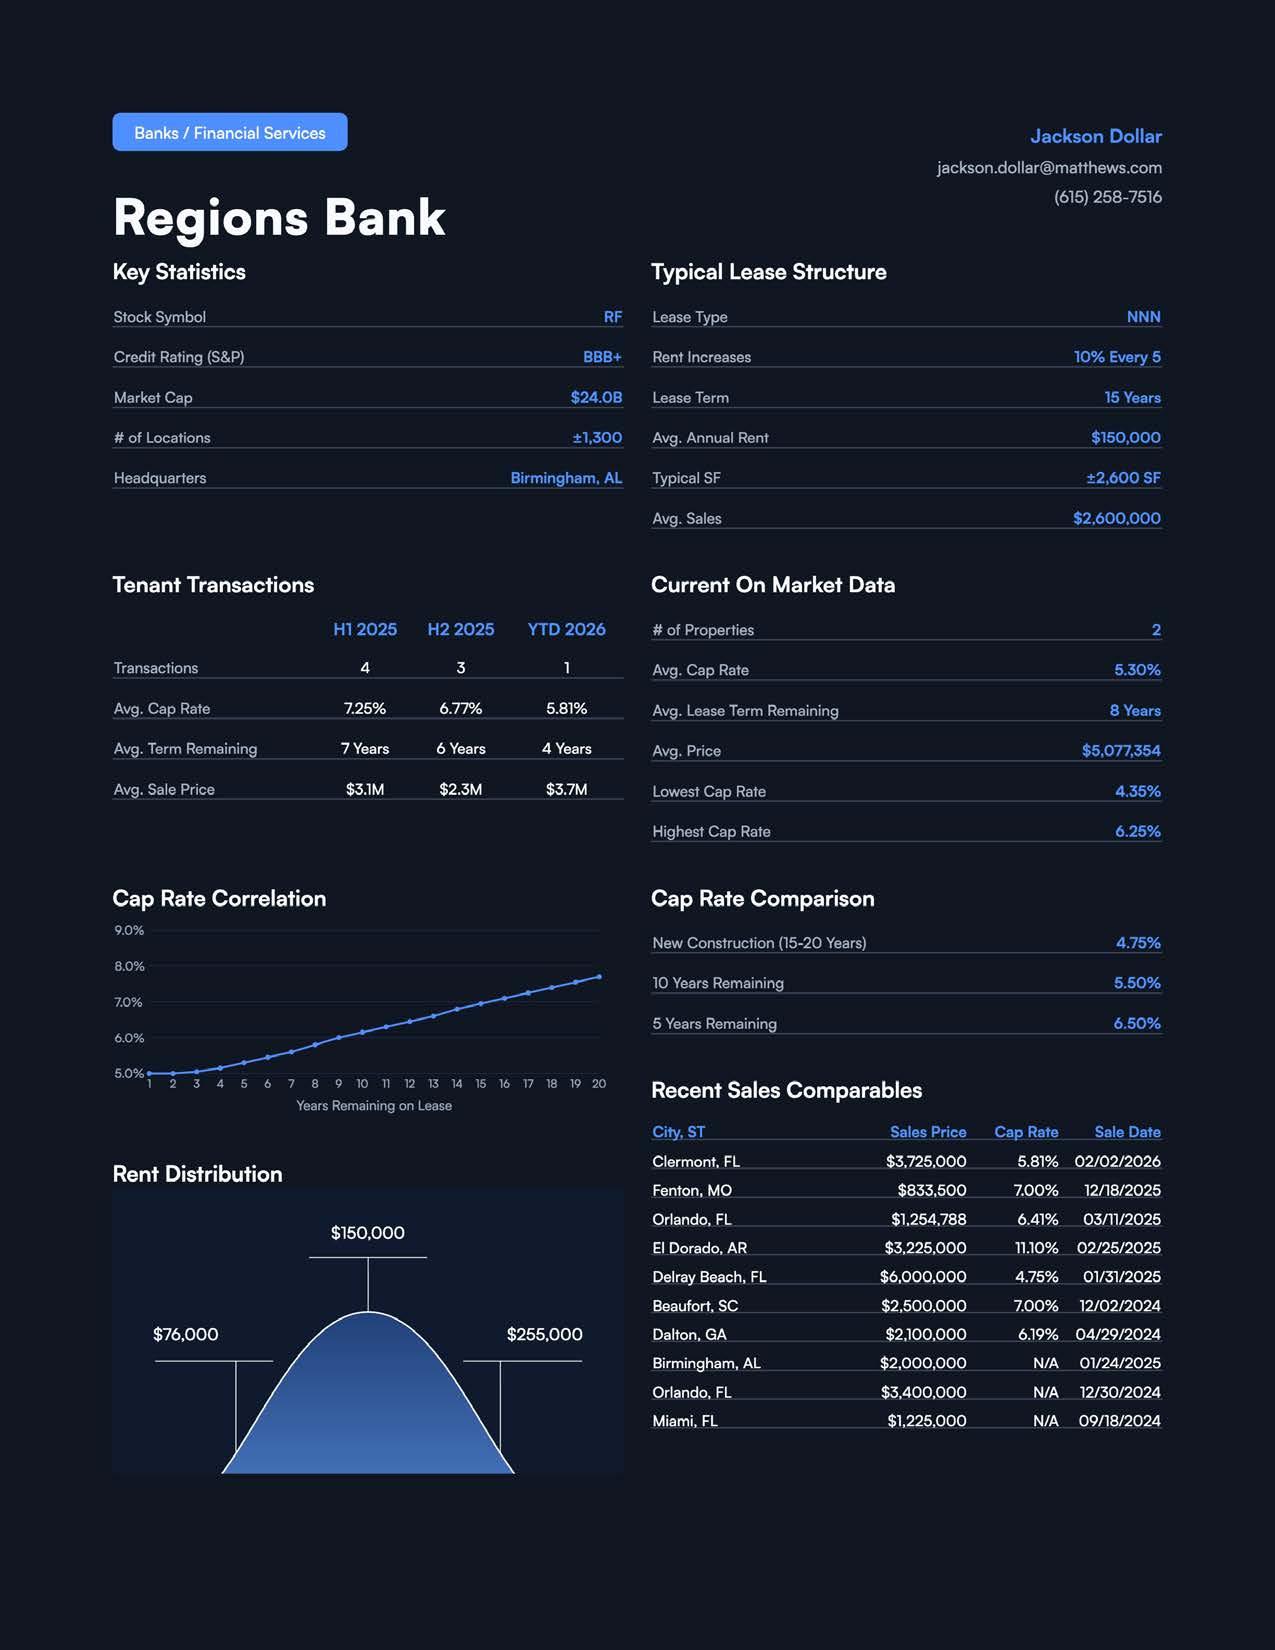
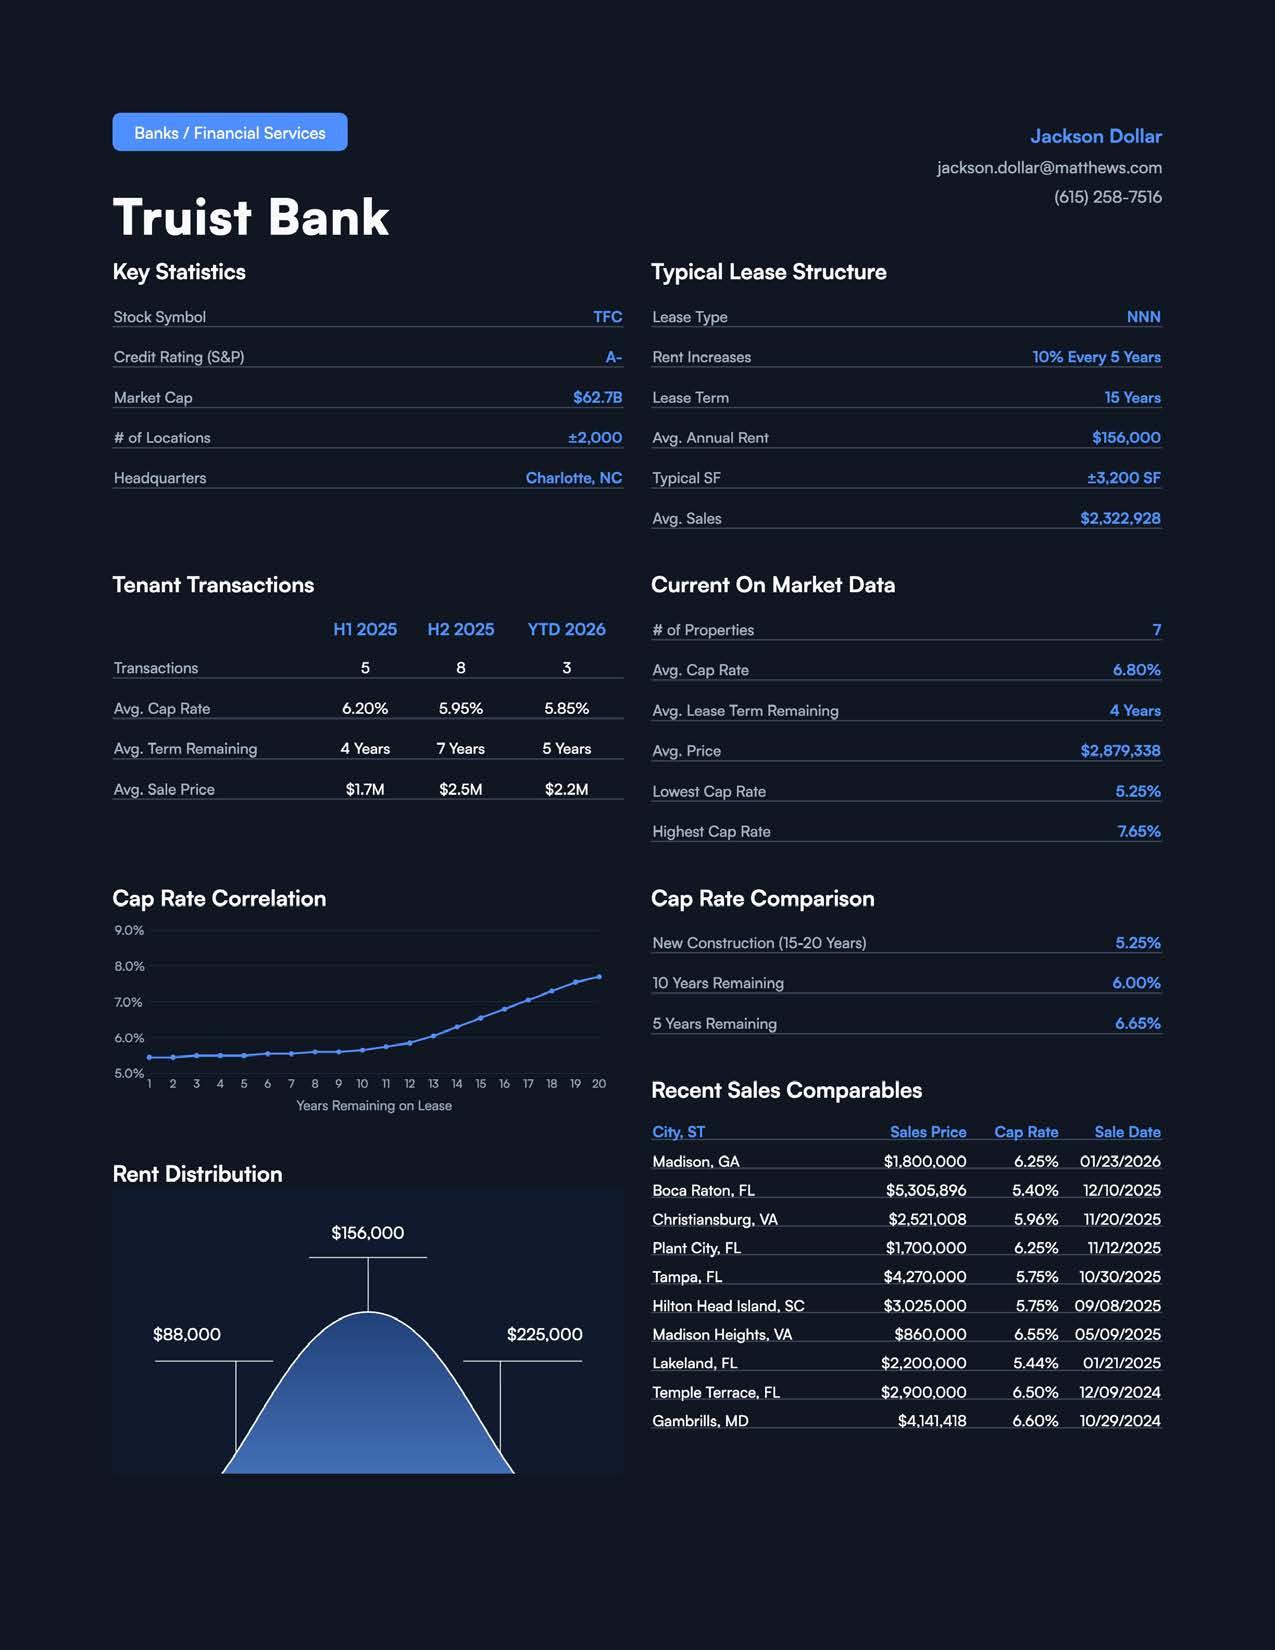
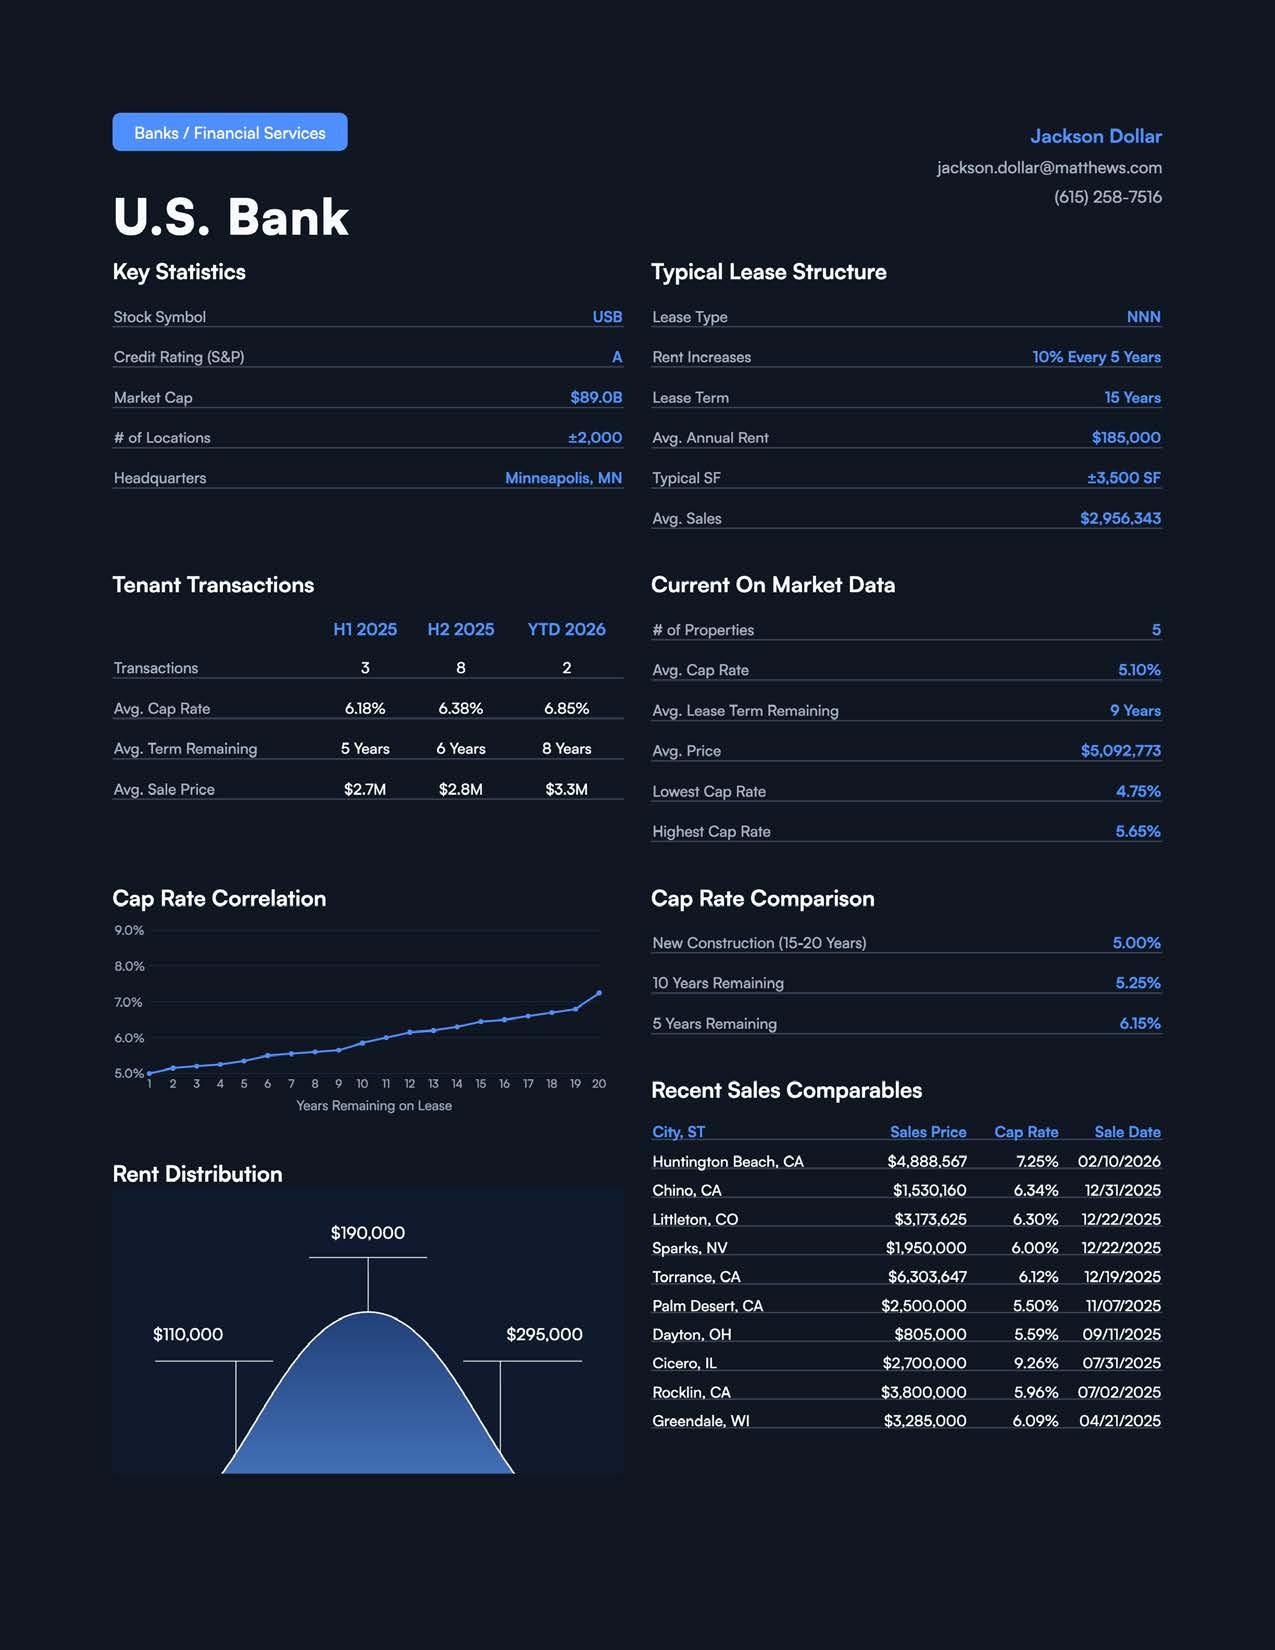
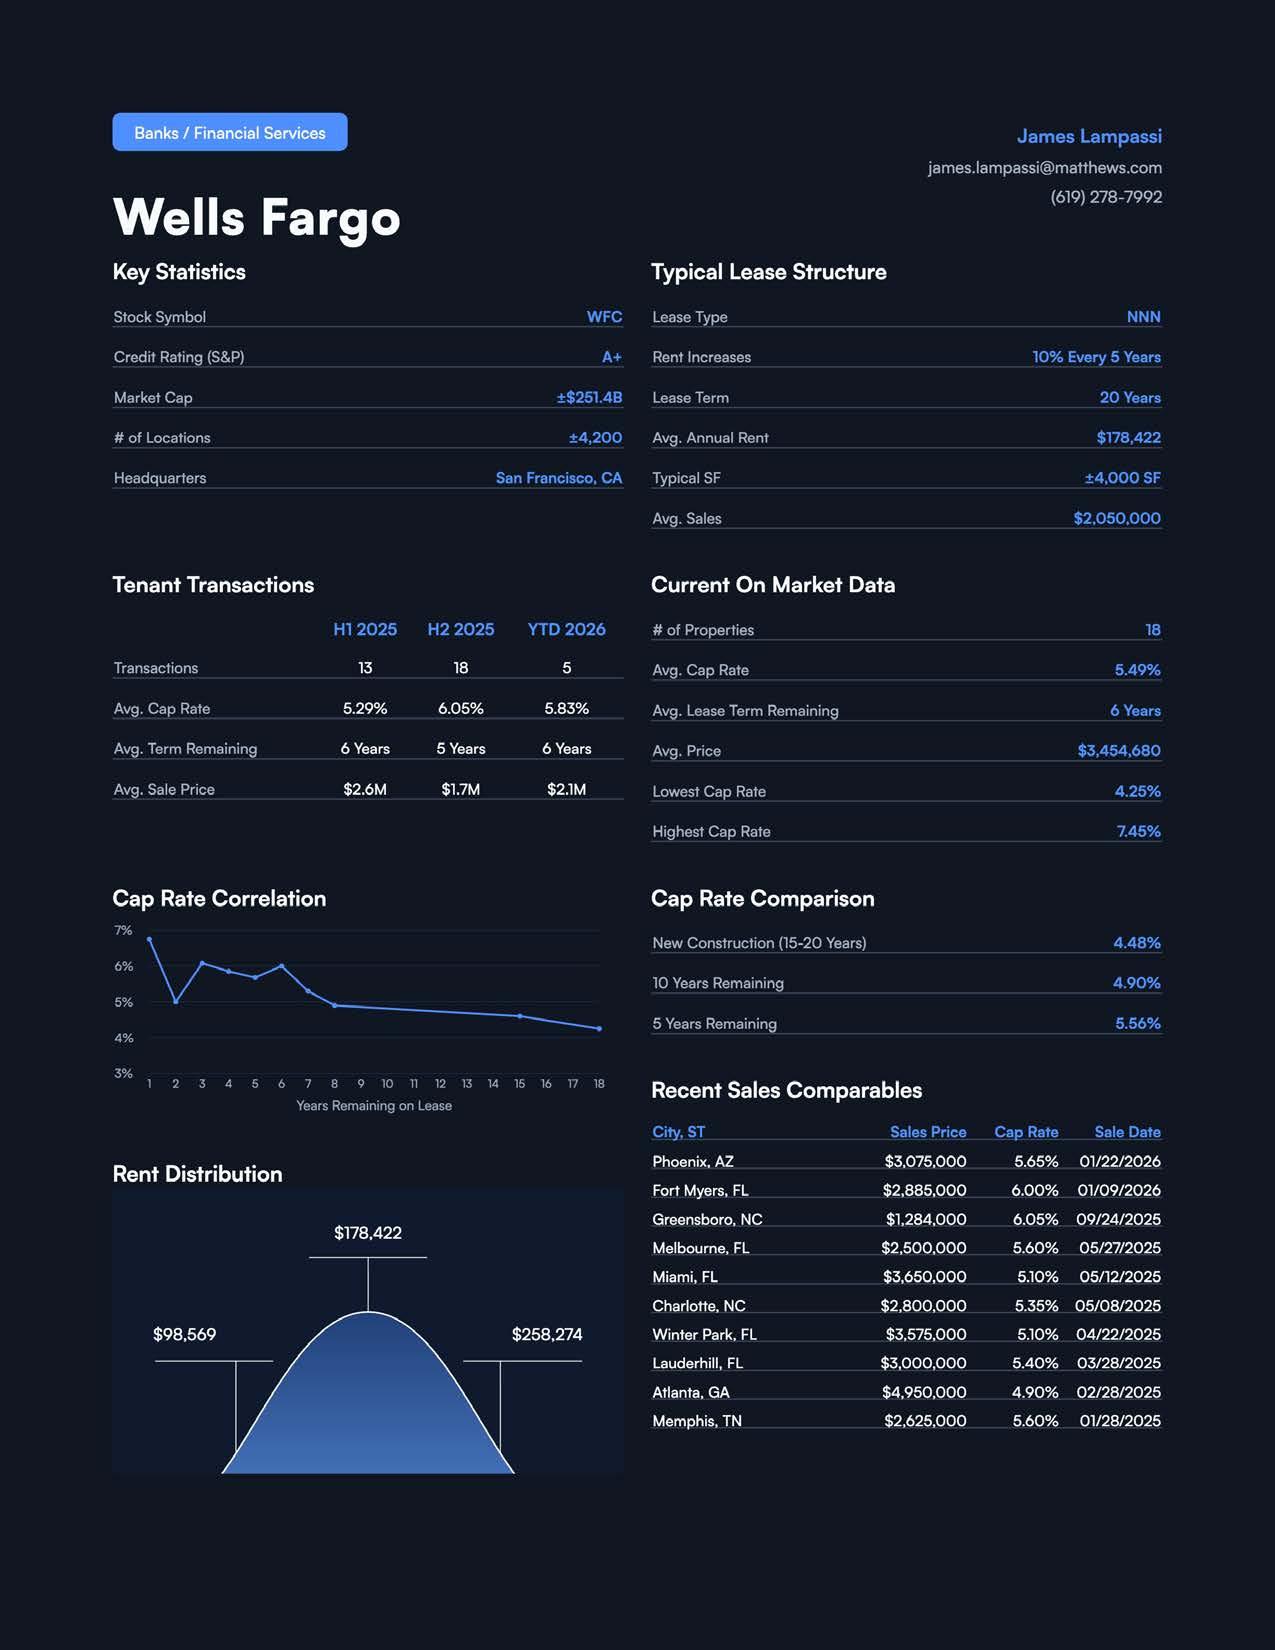
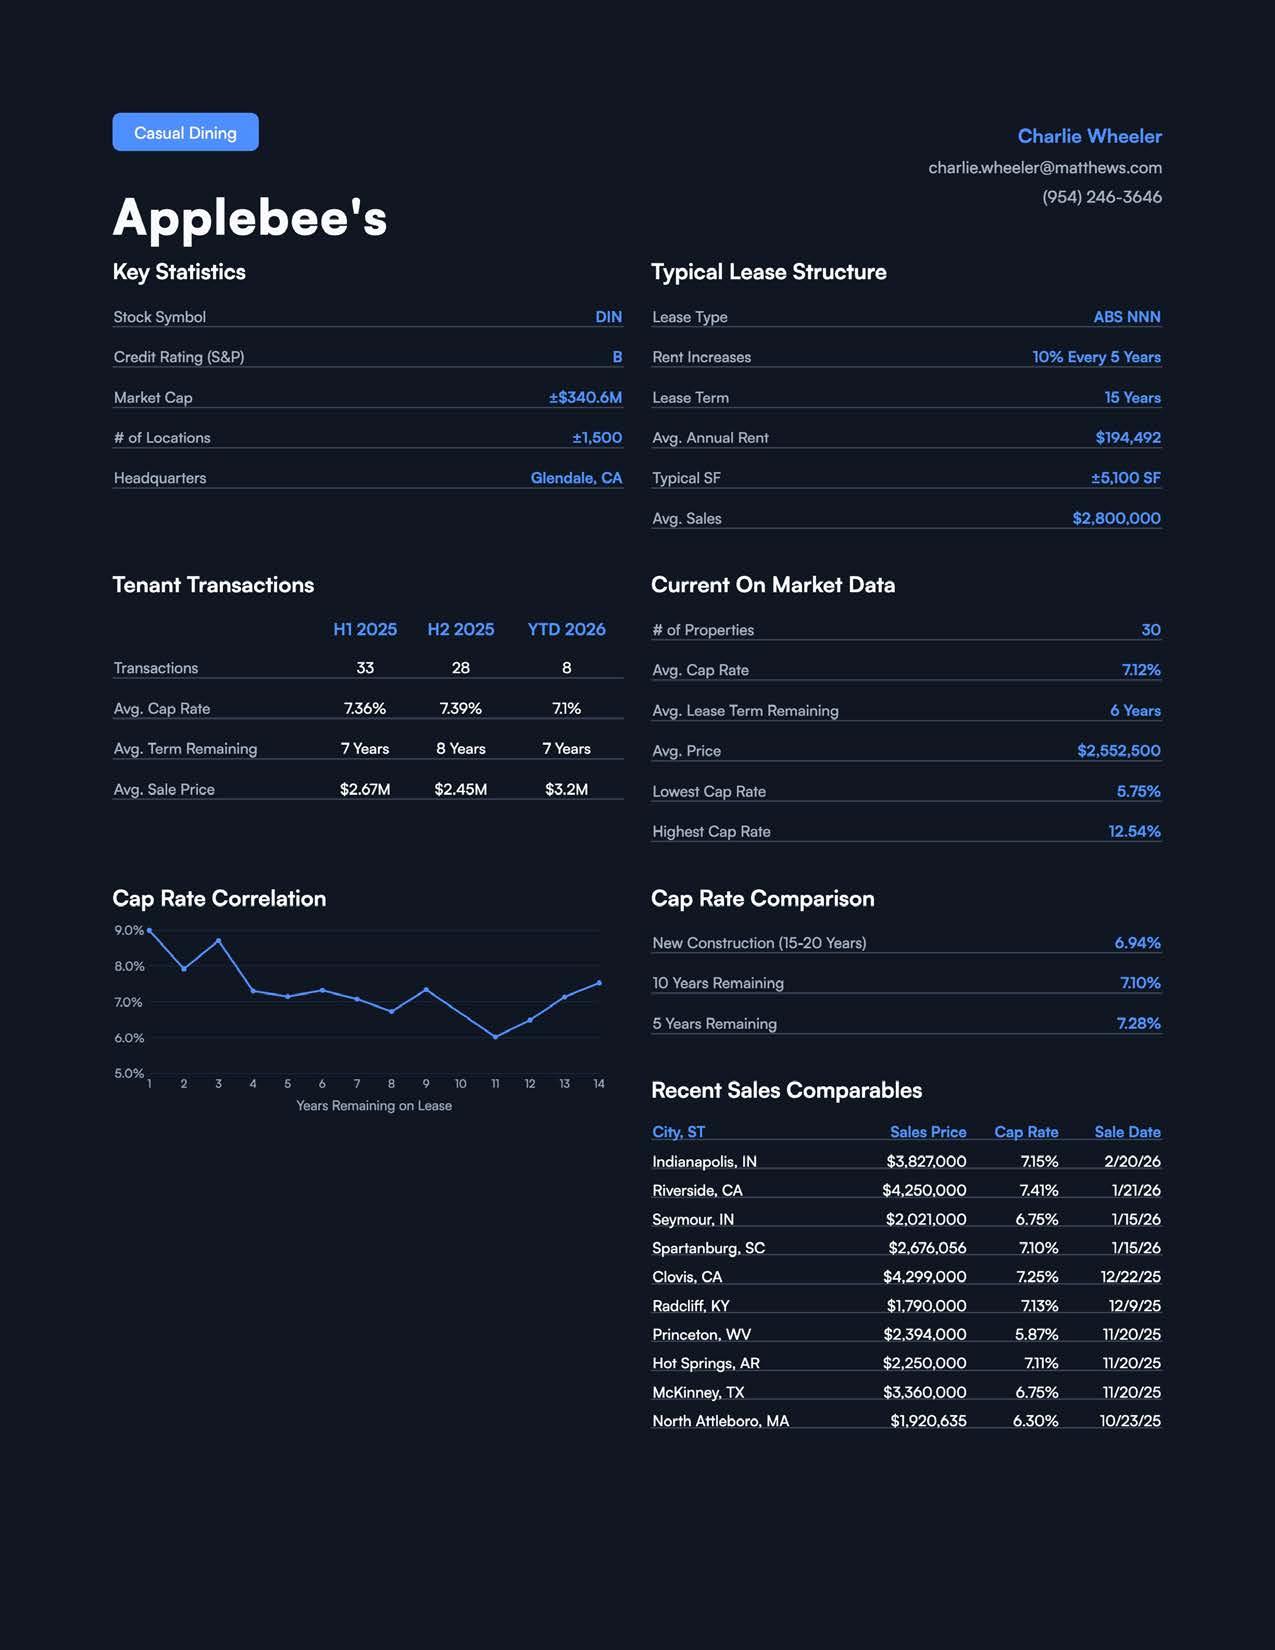
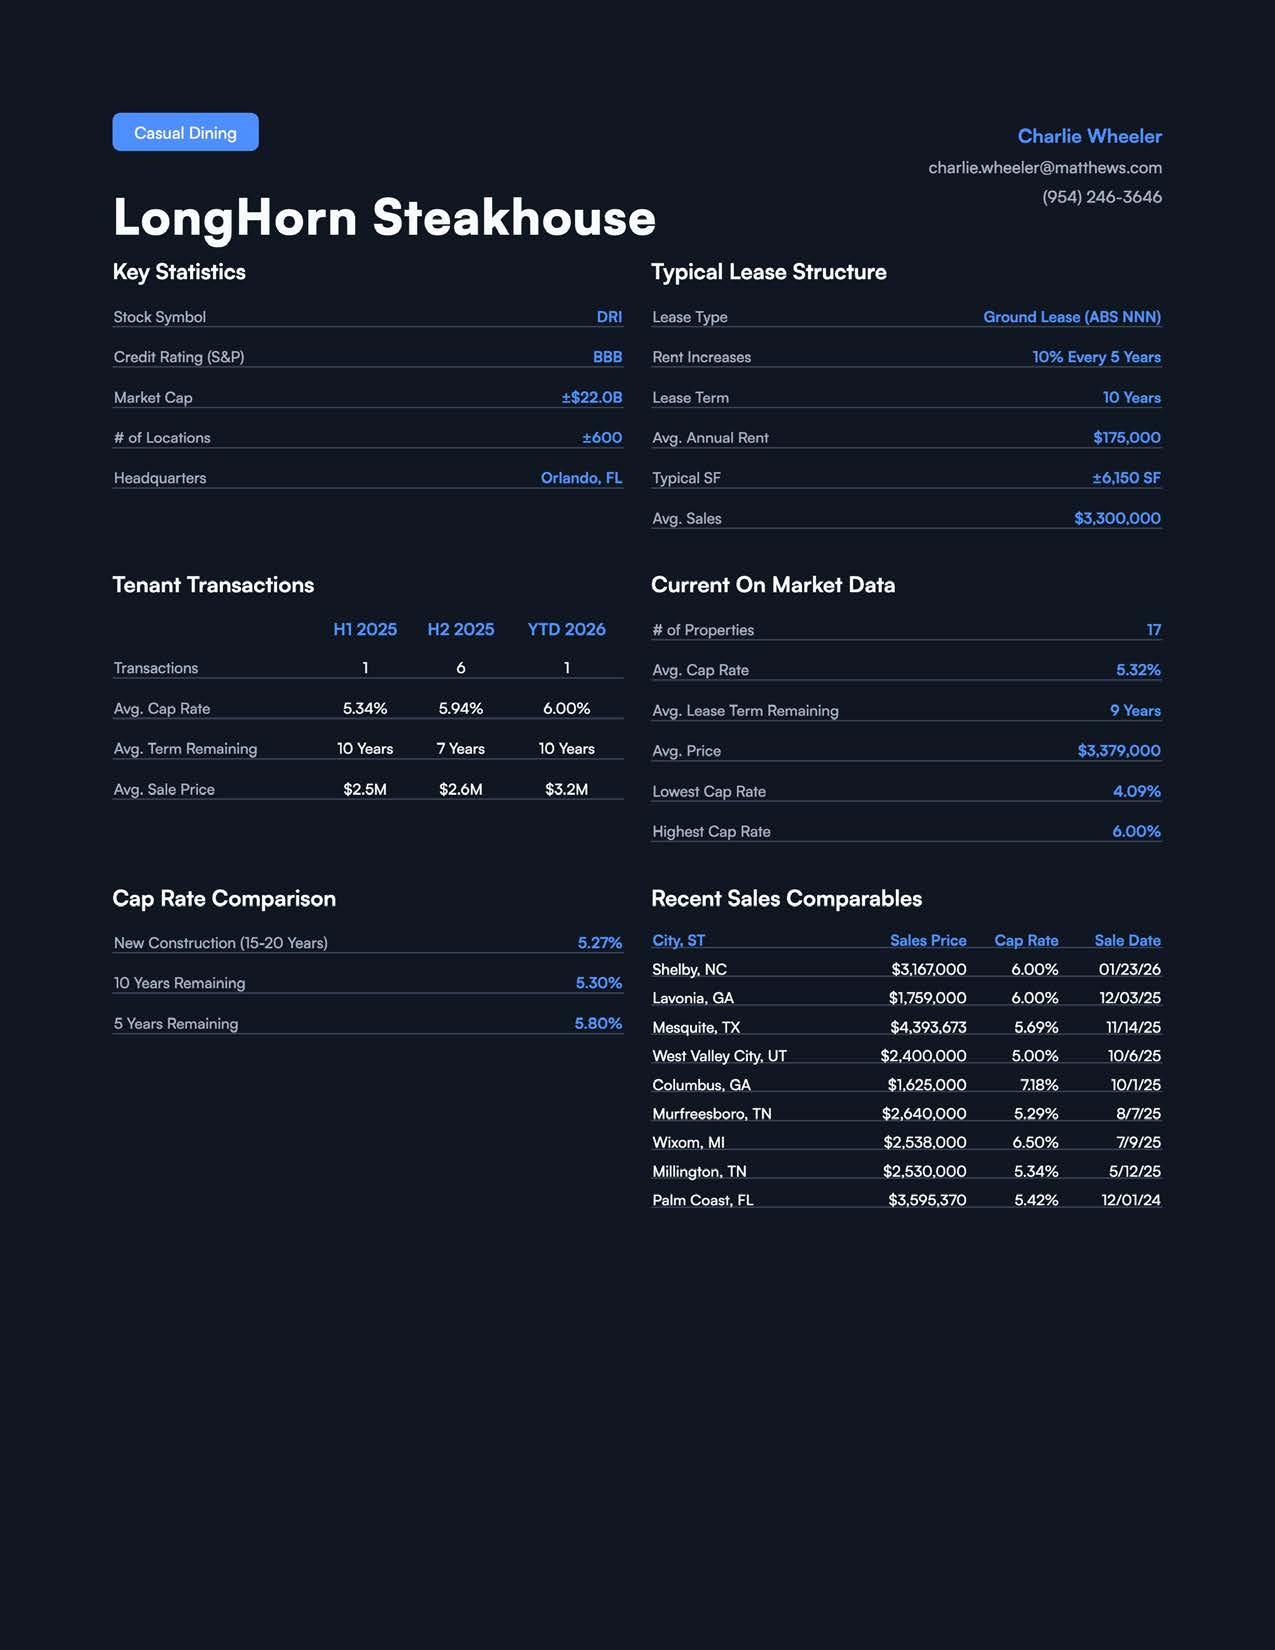
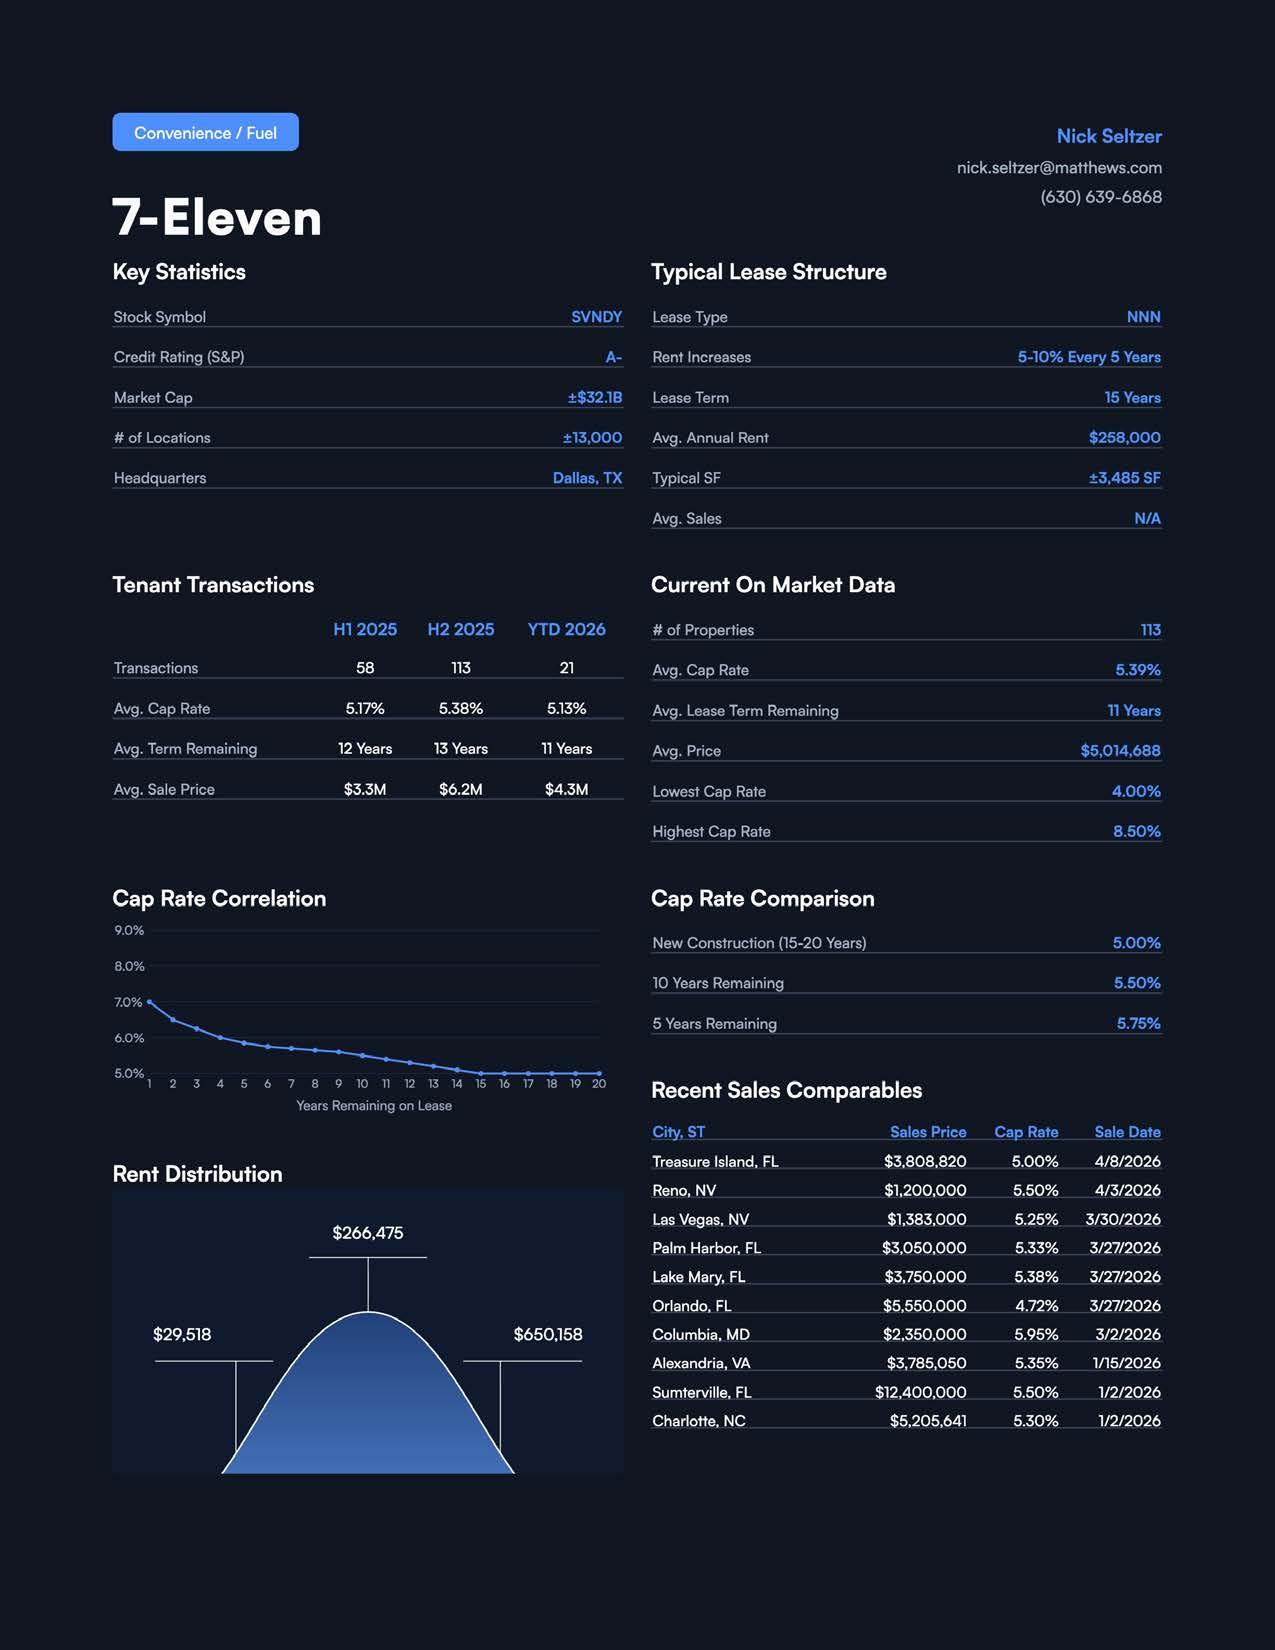
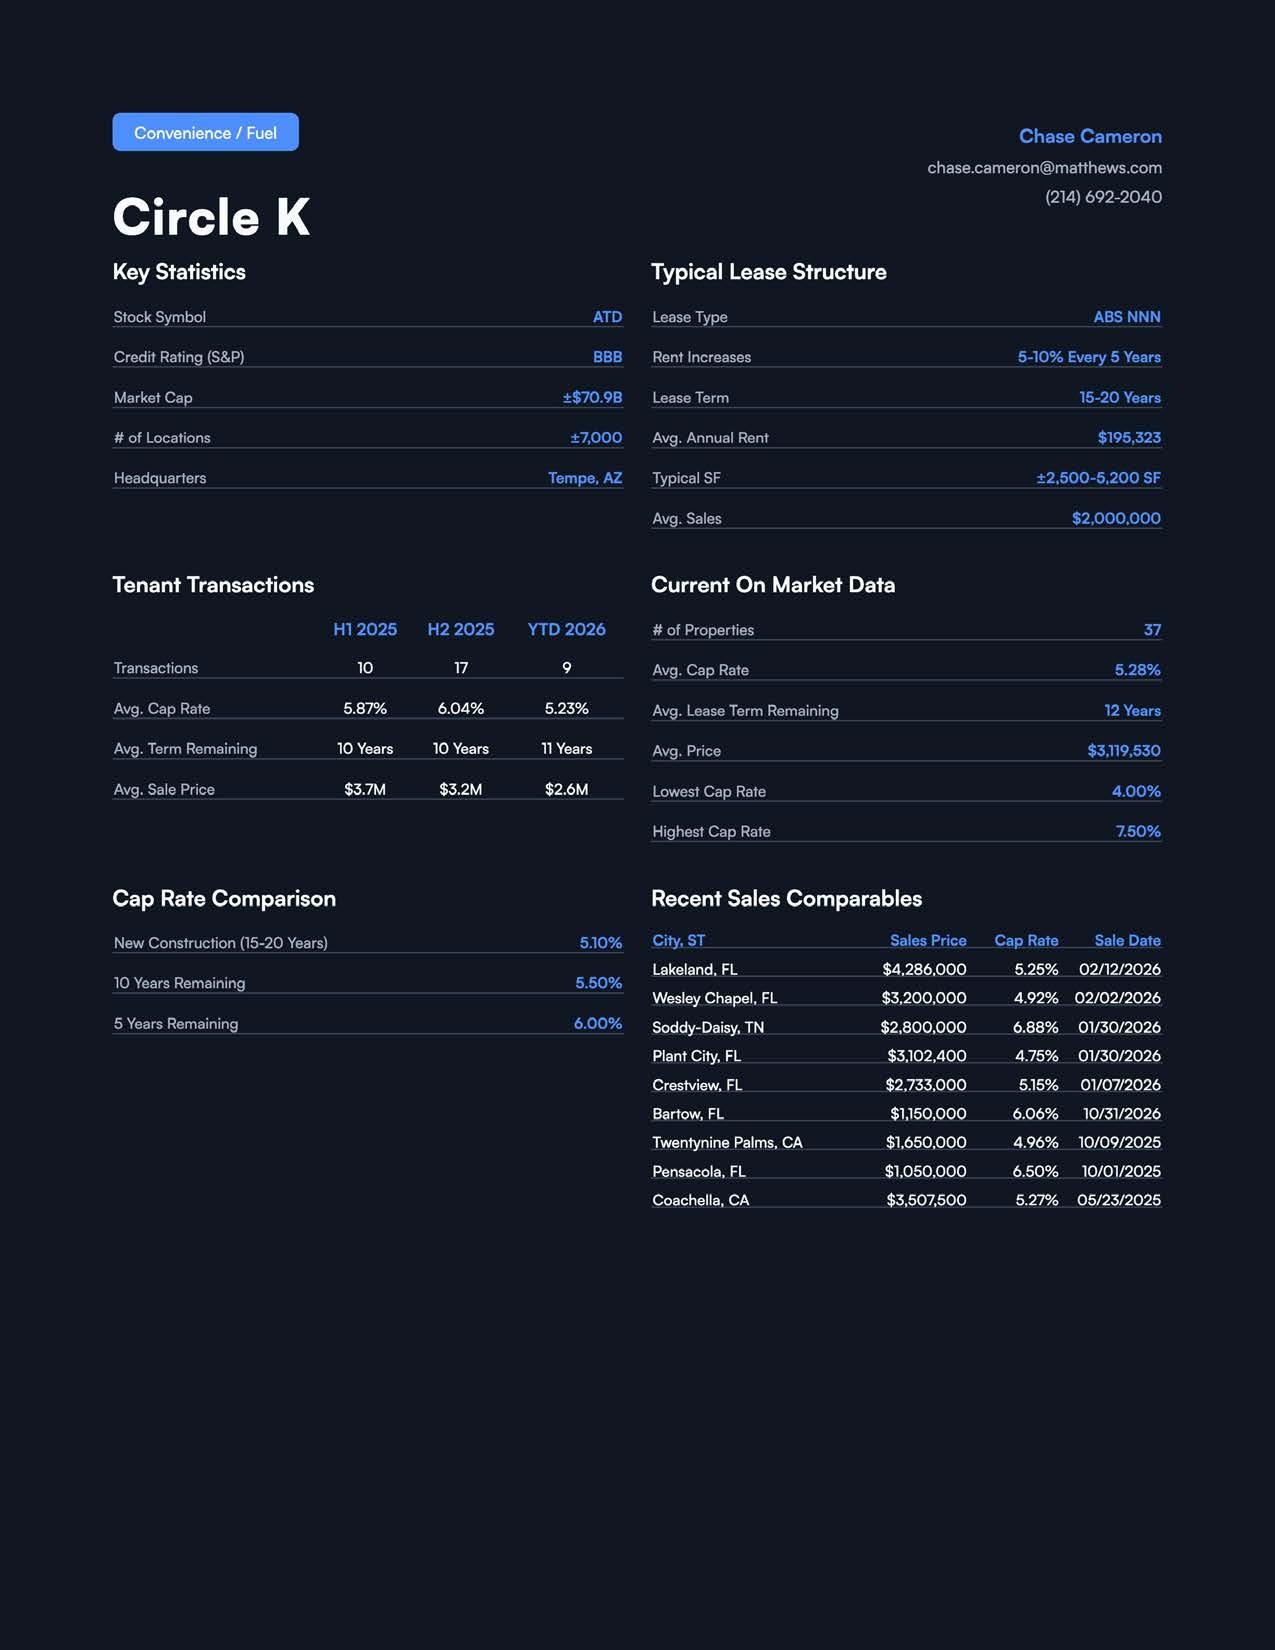
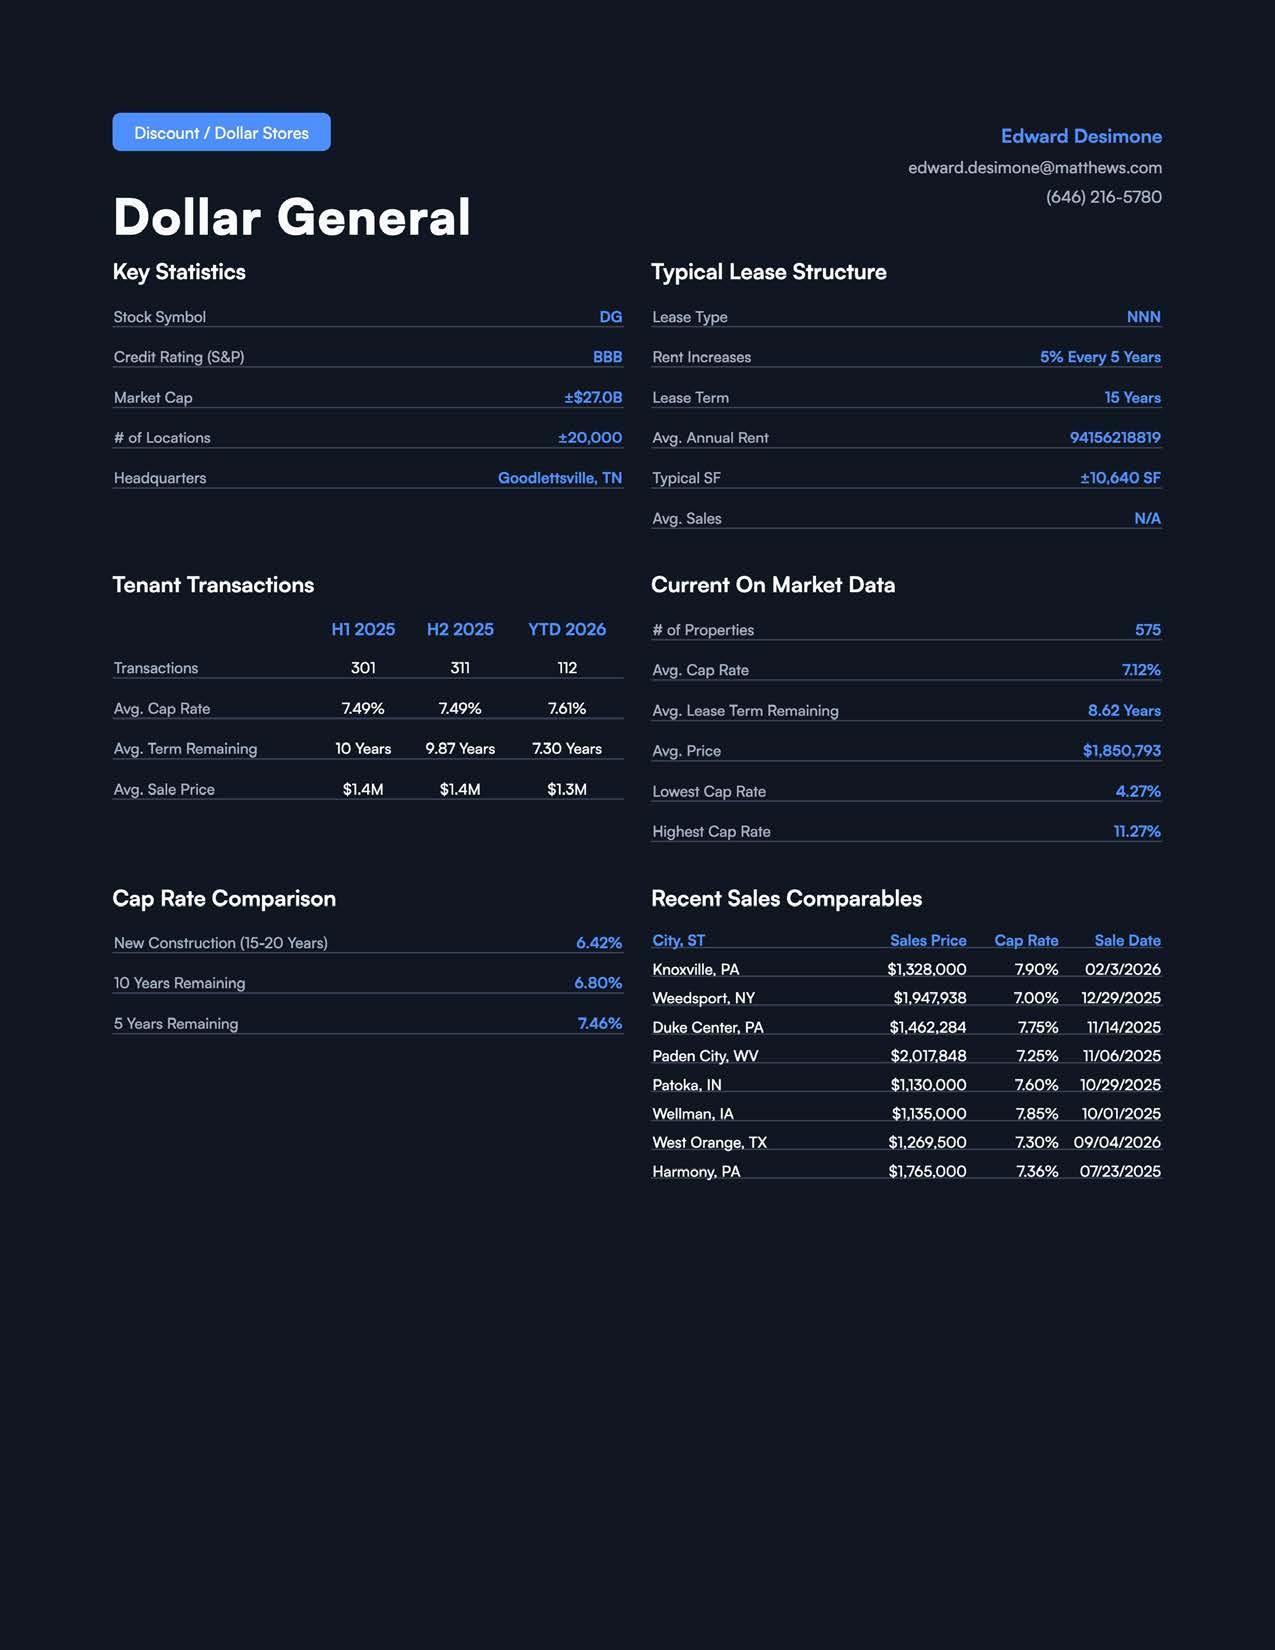
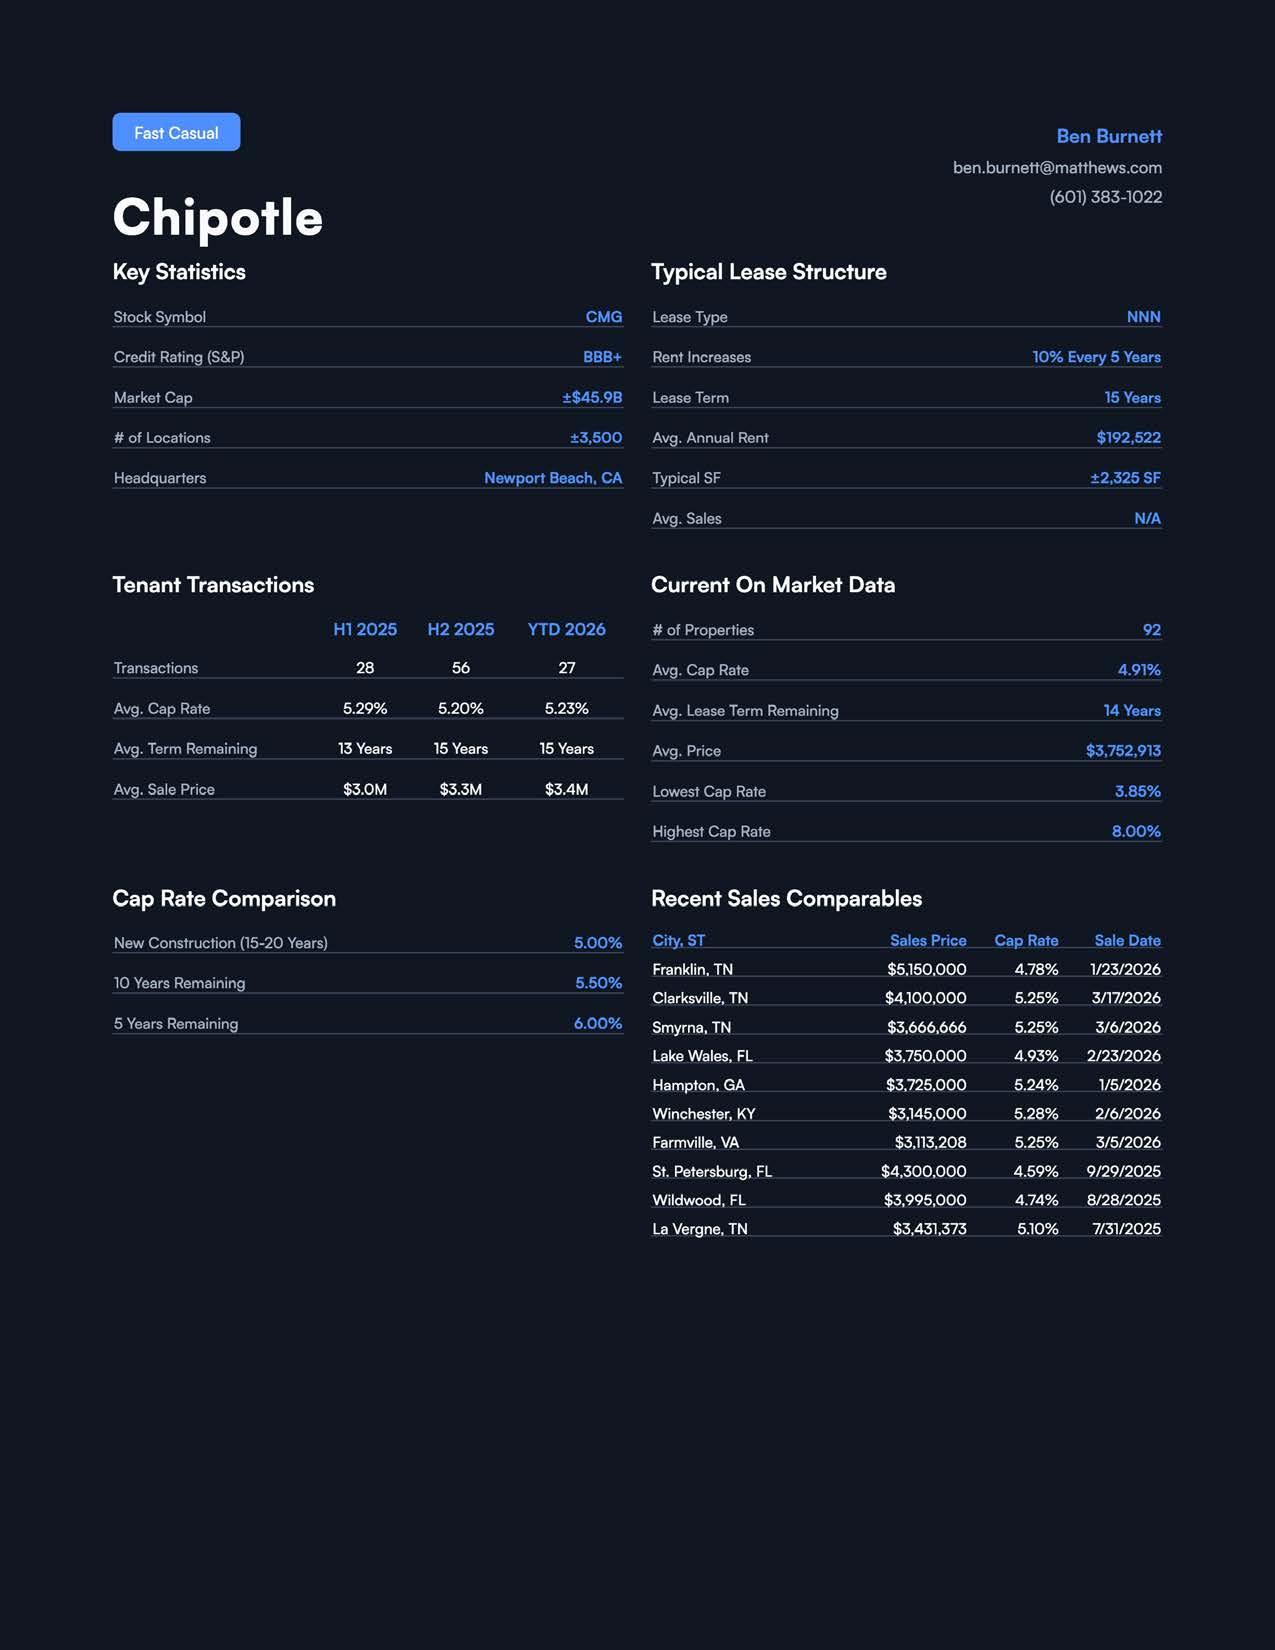
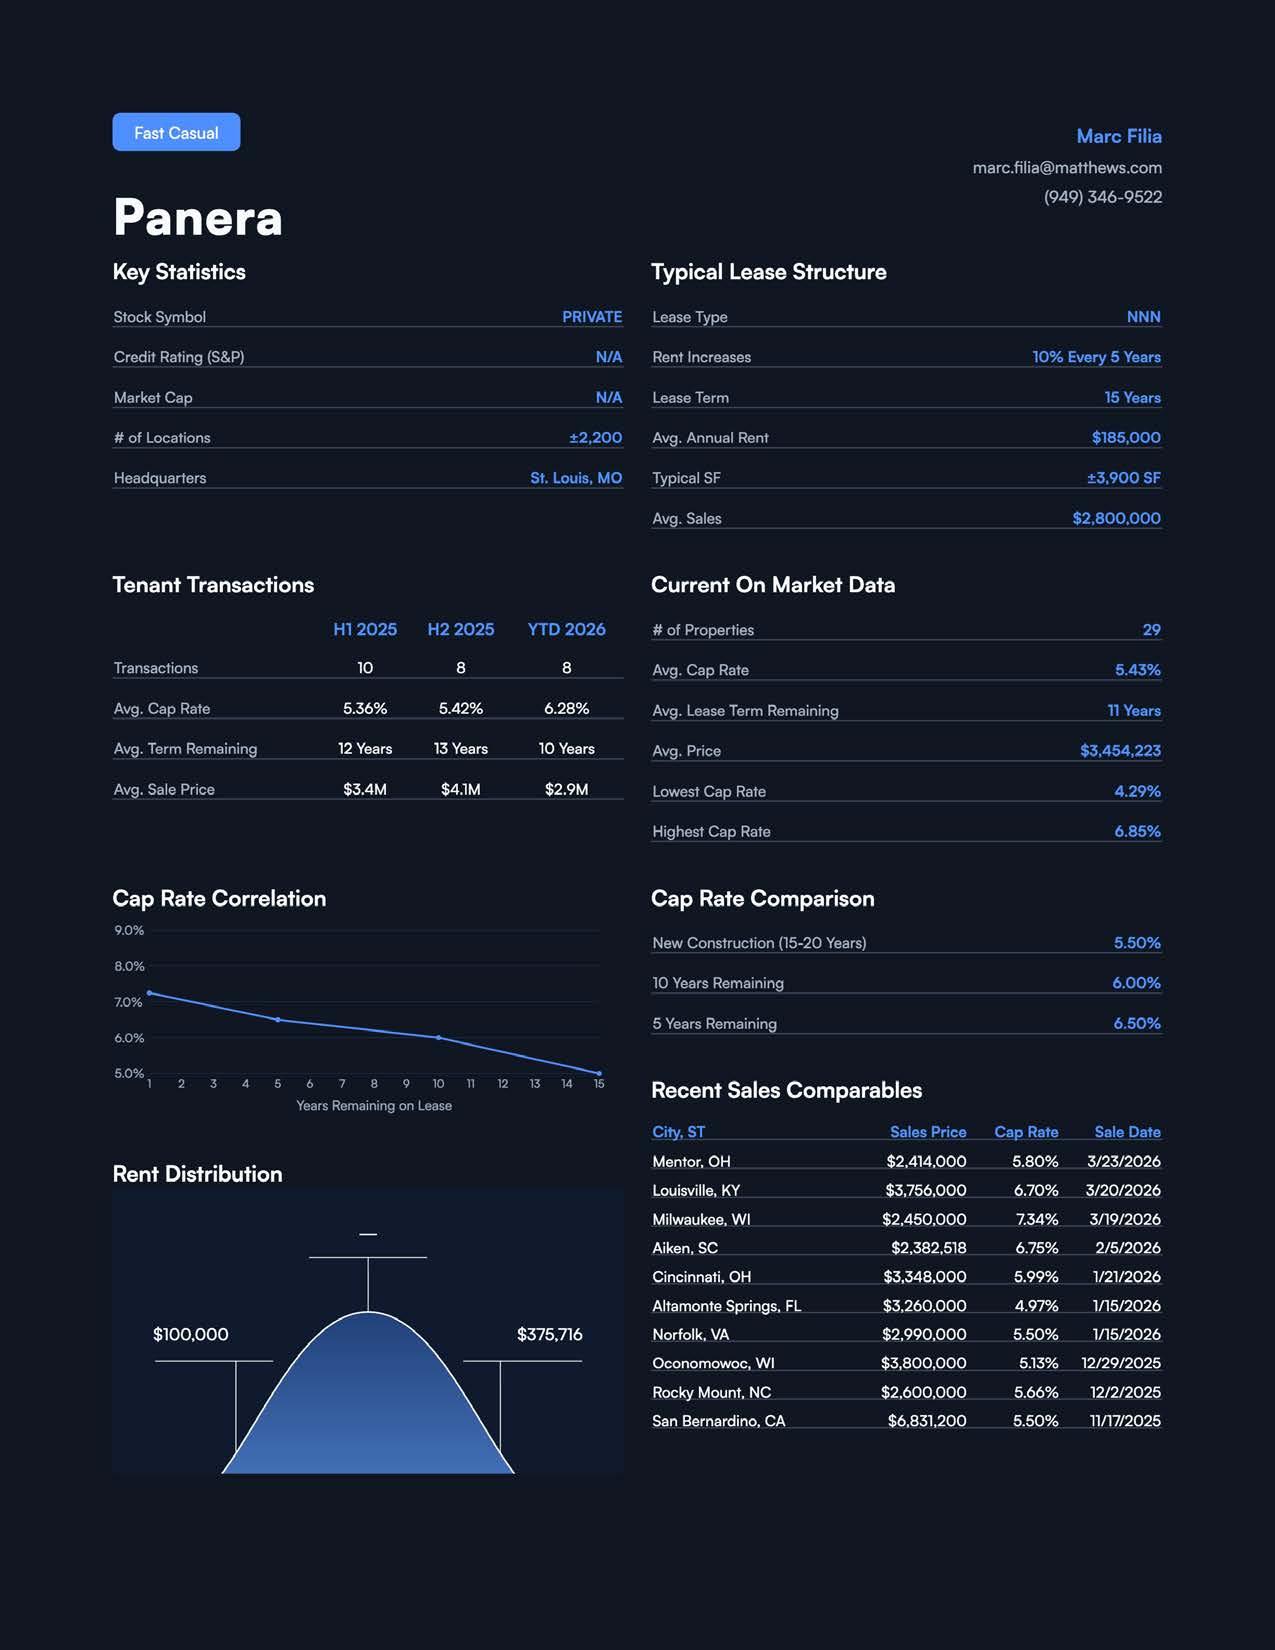
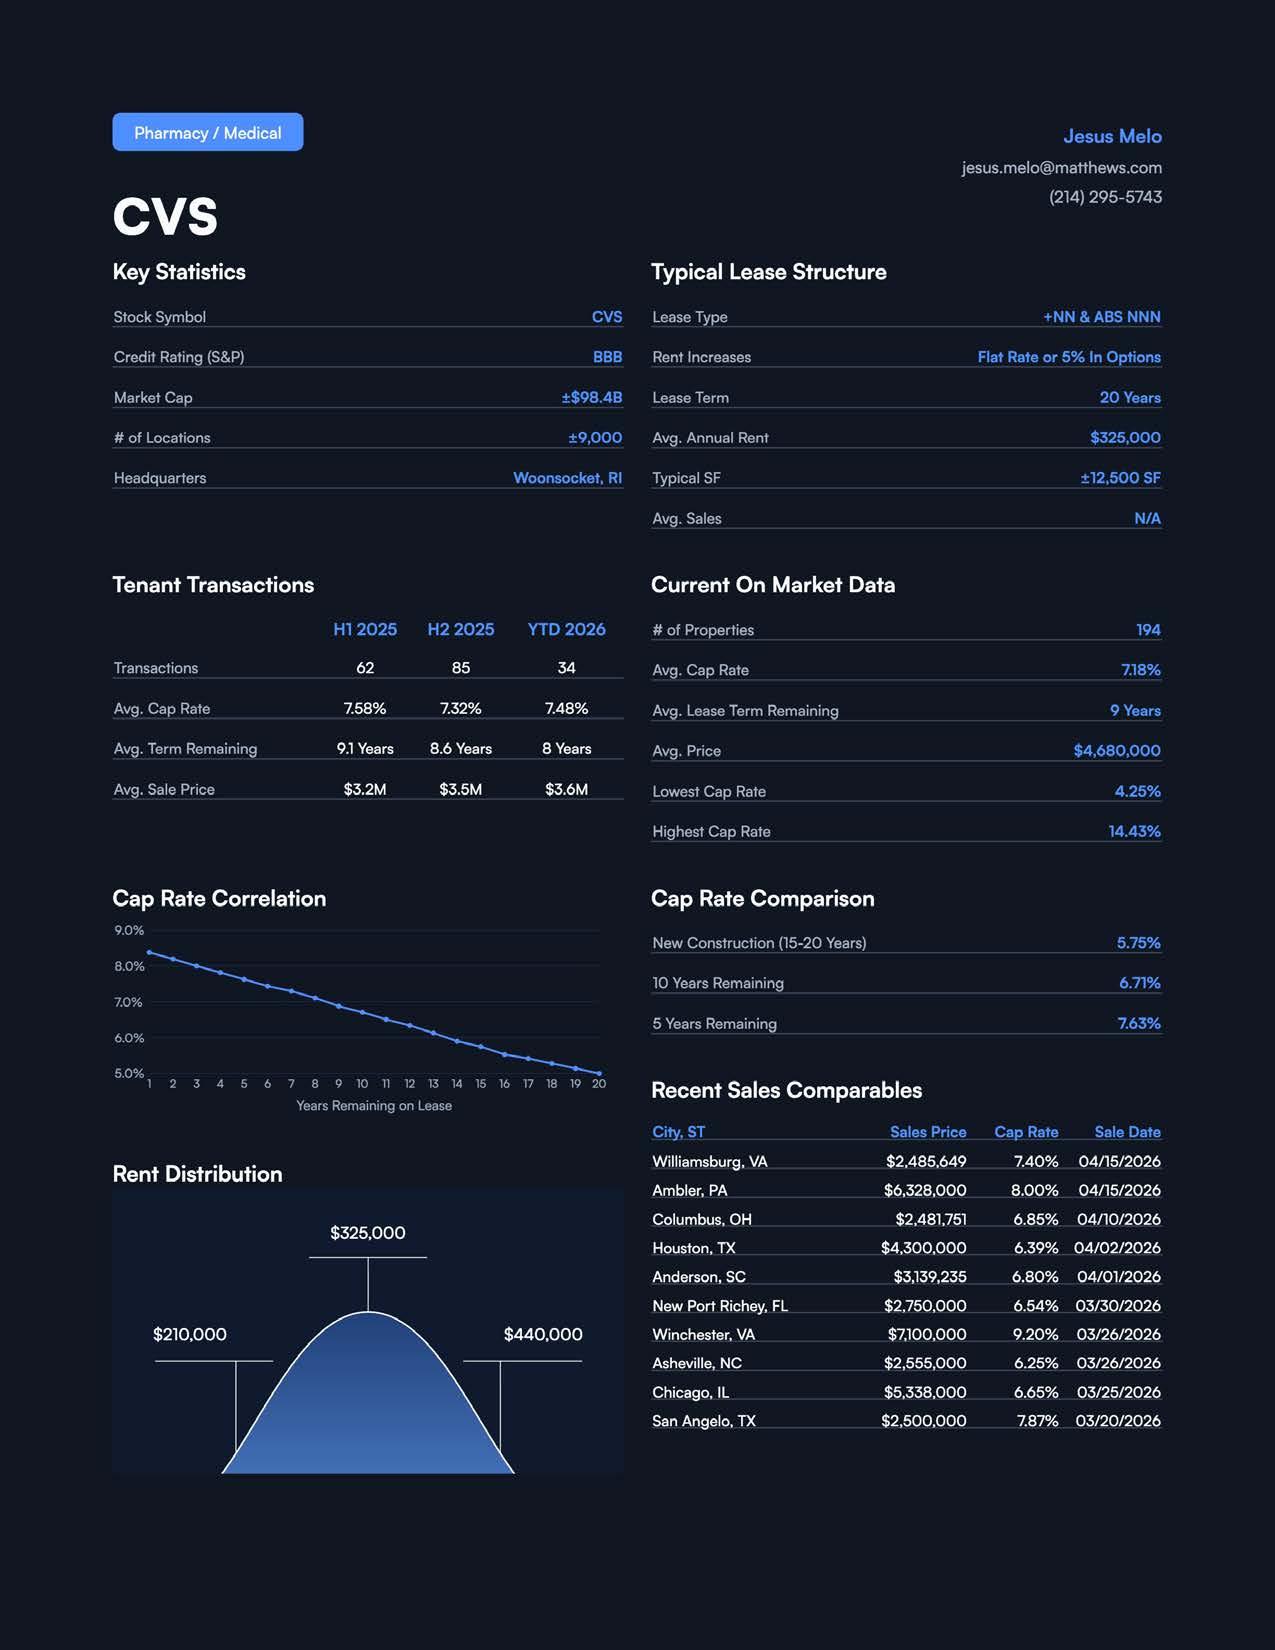
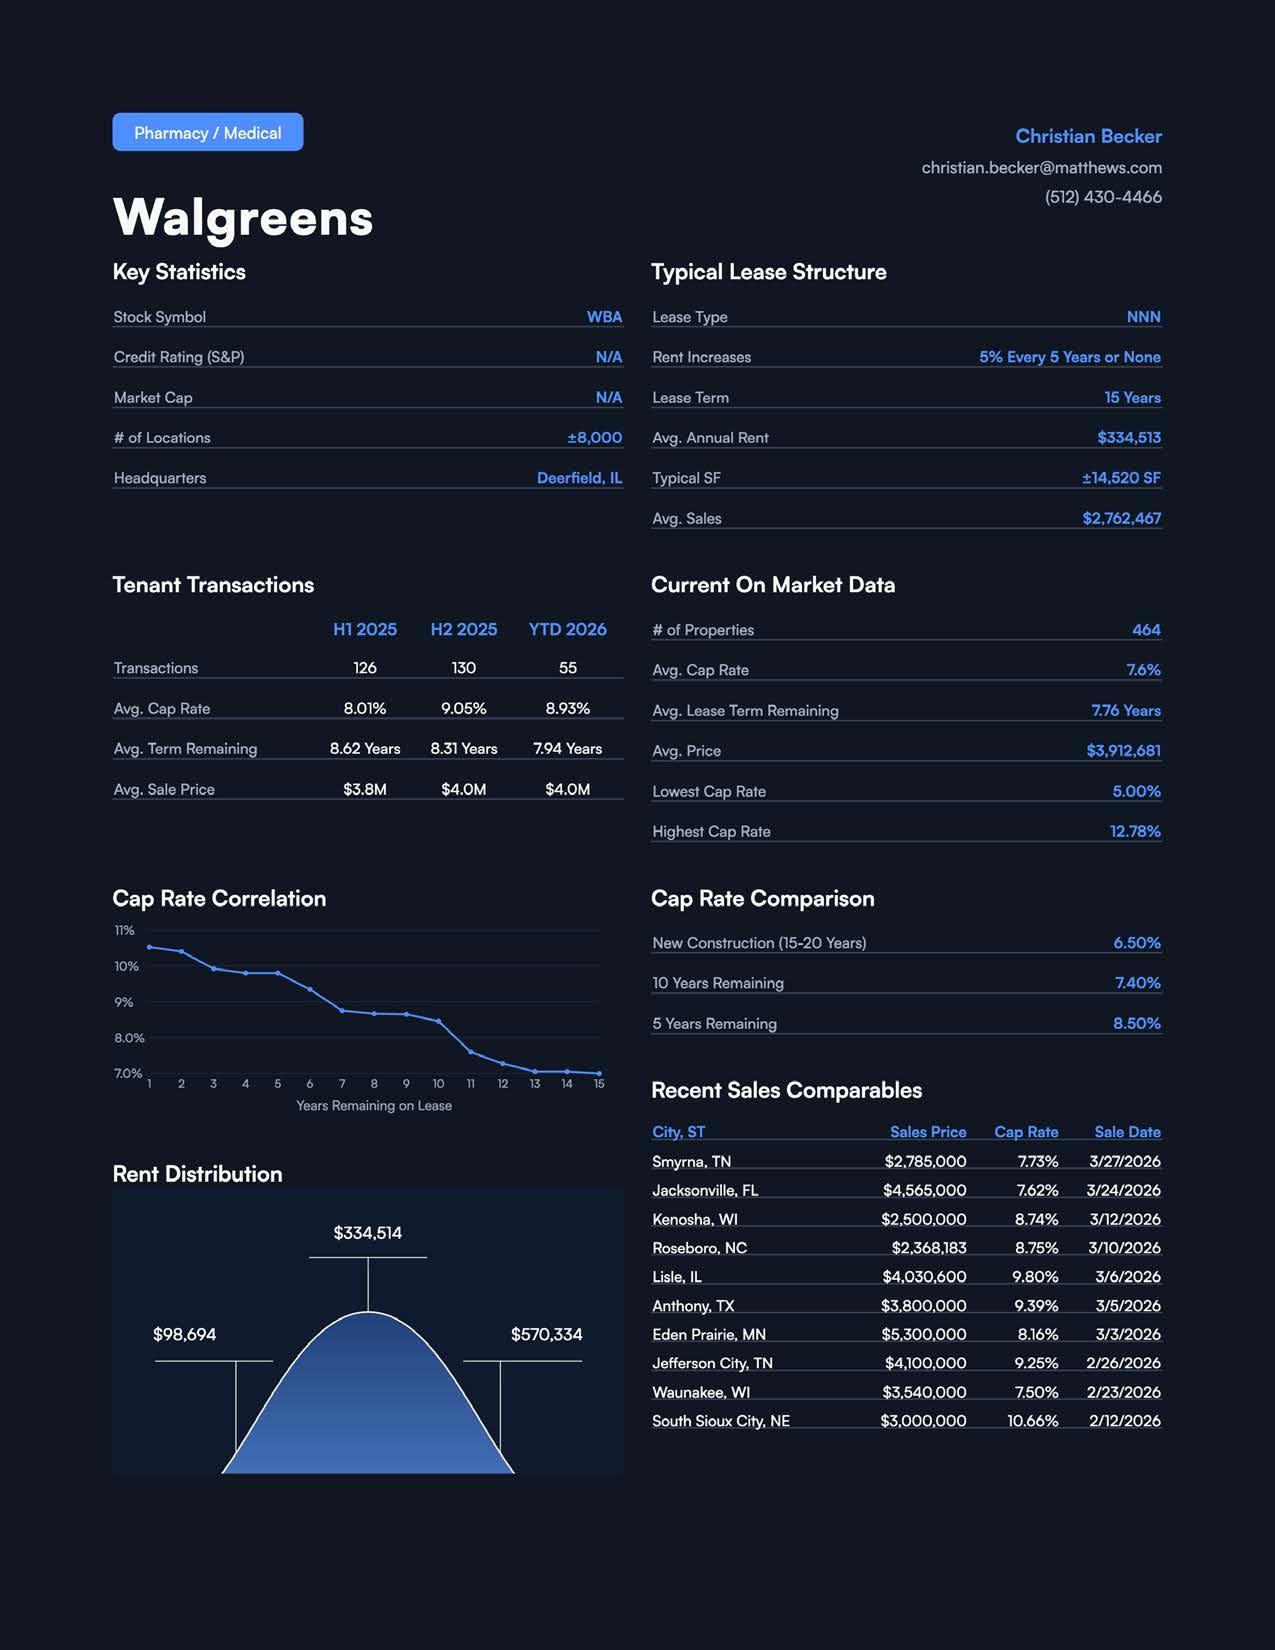
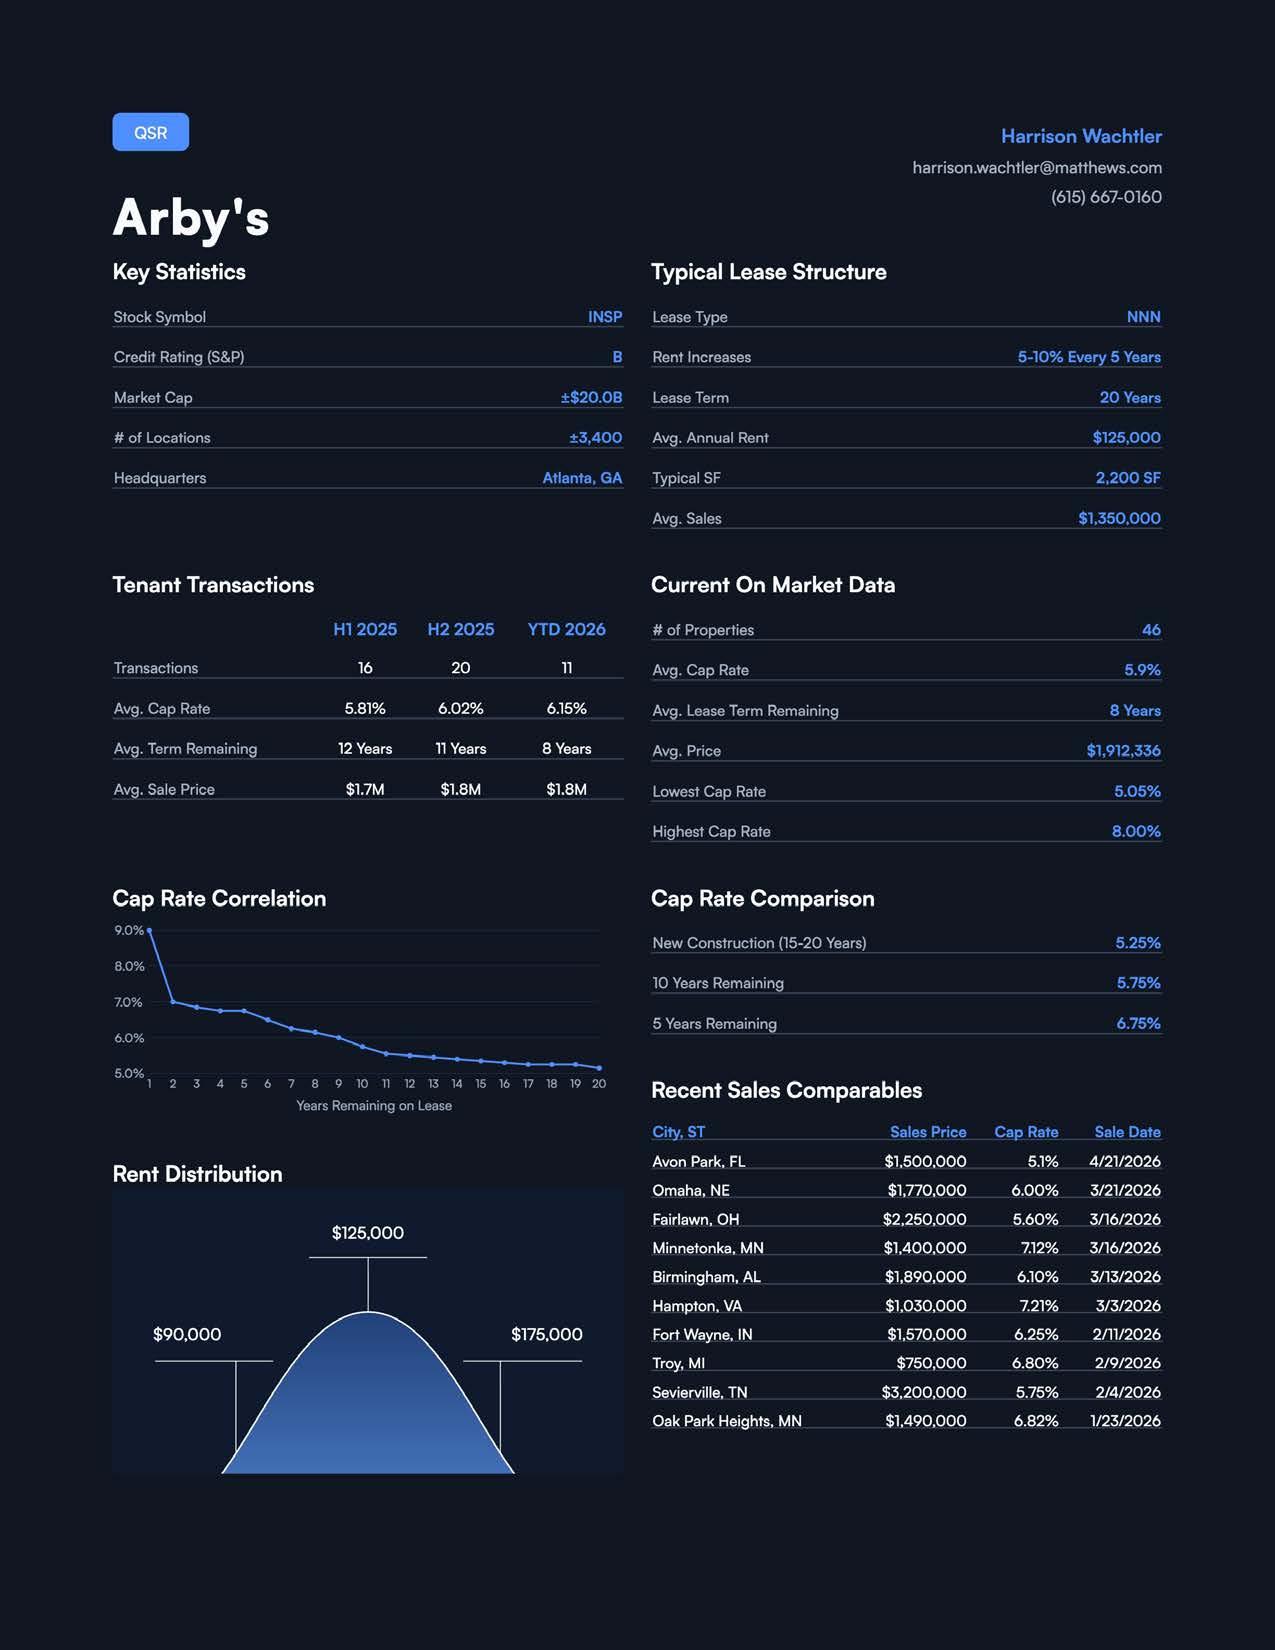
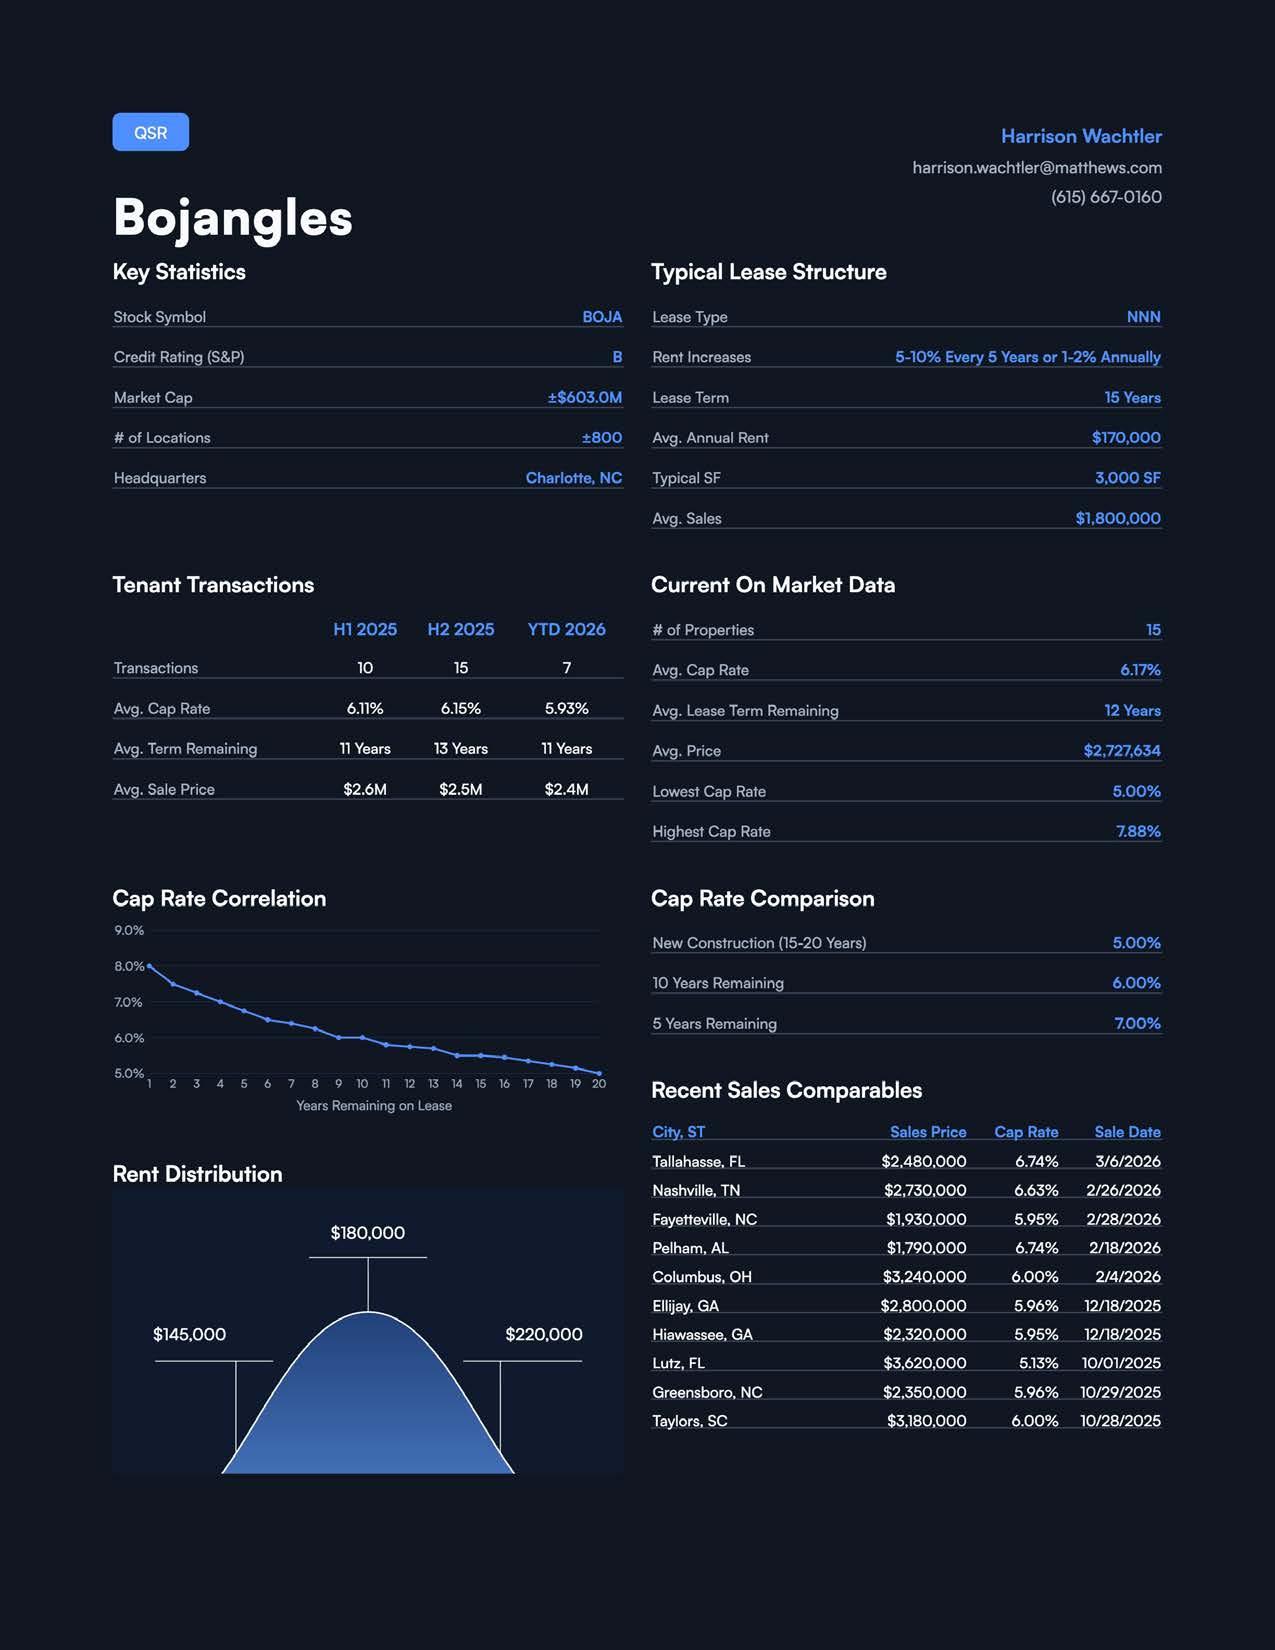
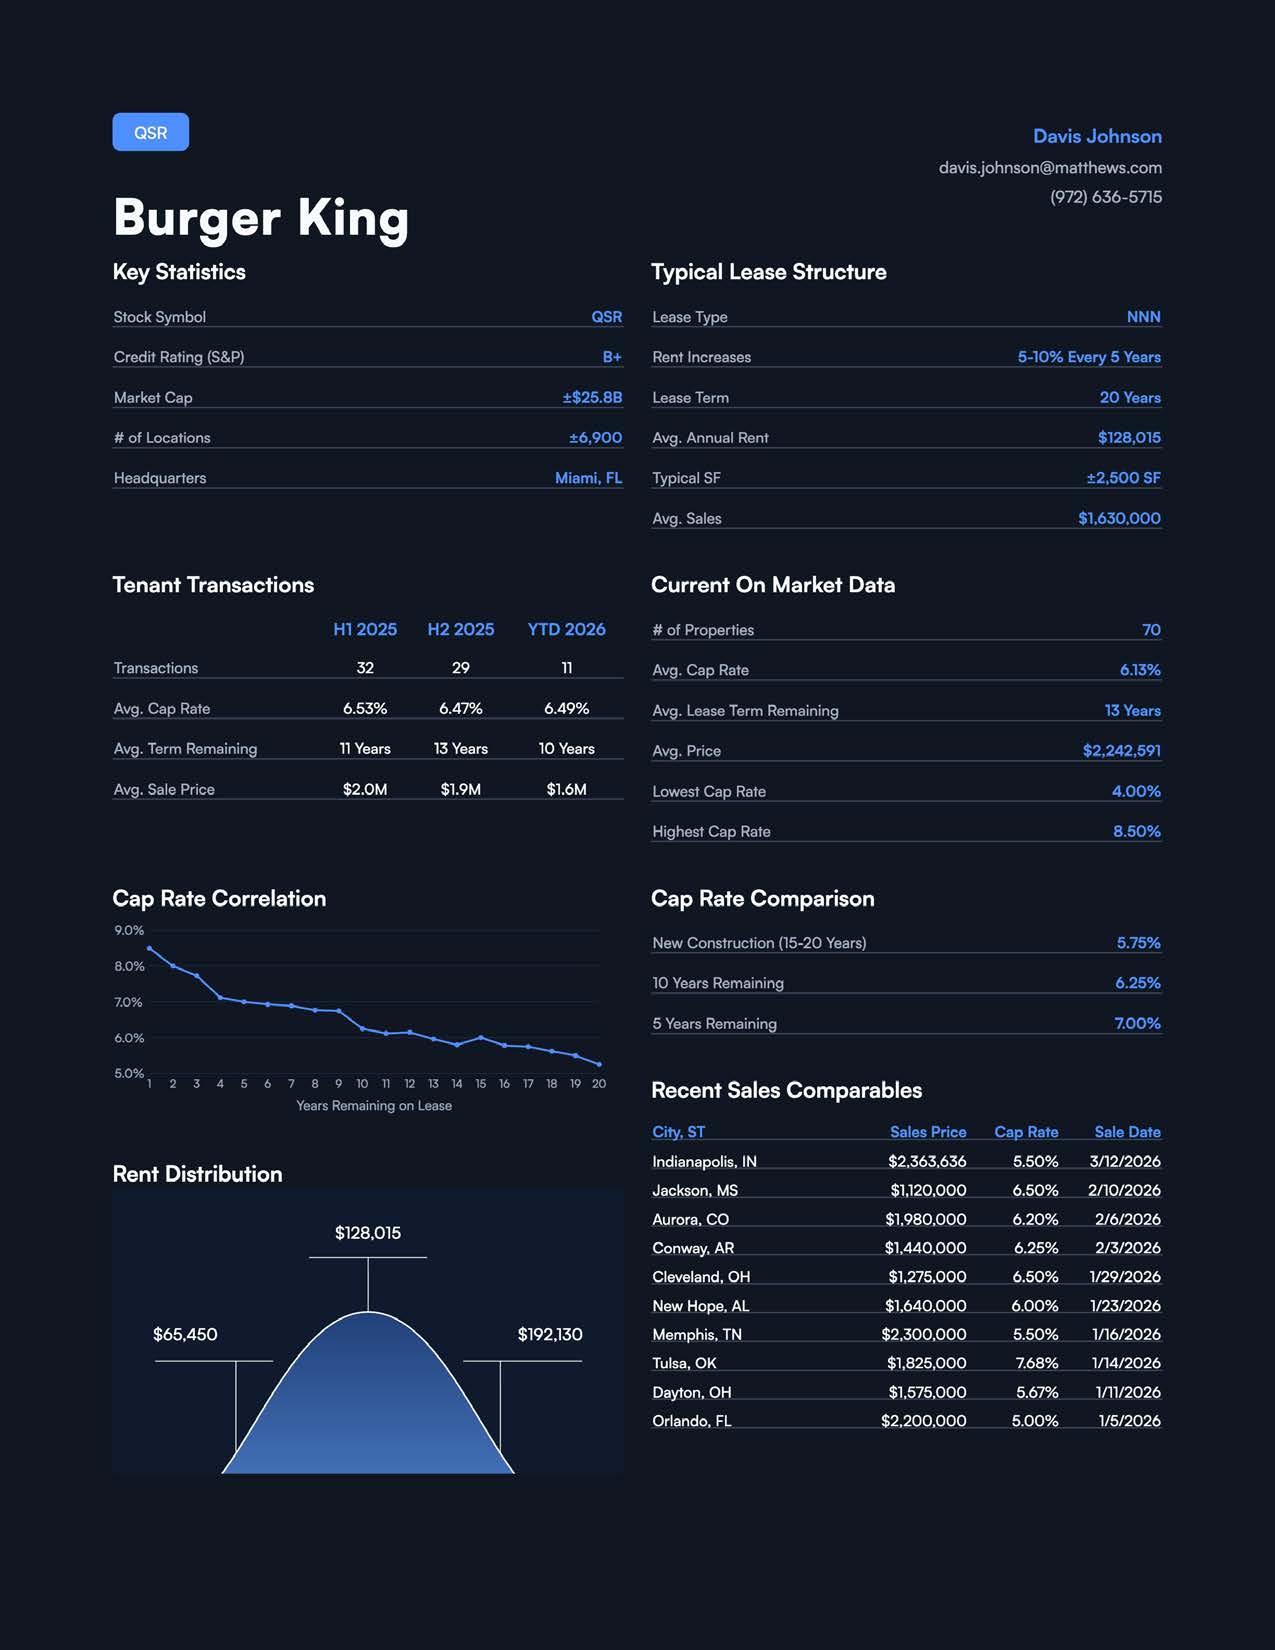

AUTO SERVICE
Advance Auto Parts
Caliber
Jiffy Lube
Mavis Tires & Brakes
O'Reilly Auto Parts
Take 5 Oil Change
BANKS / FINANCIAL SERVICES
Bank of America
Chase Bank
Regions Bank
Truist Bank
U.S. Bank
Wells Fargo
CASUAL DINING
Dylan Schroeder (954)357-0614
dylan.schroeder@matthews.com
Brandon Ellison (214)432-4720 brandon.ellison@matthews.com
Jack Kulick (310)919-5711 jack.kulick@matthews.com
Jc Ahumada (619)374-3760 jancarlo.ahumada@matthews.com
JanCarlo Ahumada
Dylan Schroeder (954)357-0614 dylan.schroeder@matthews.com
Dillon Mata (737)309-2835 dillon.mata@matthews.com
James Lampassi (619)278-7992 james.lampassi@matthews.com
James Lampassi (619)278-7992 james.lampassi@matthews.com
Jackson Dollar (615)258-7516 jackson.dollar@matthews.com
Jackson Dollar (615)258-7516 jackson.dollar@matthews.com
Jackson Dollar (615)258-7516 jackson.dollar@matthews.com
James Lampassi (619)278-7992 james.lampassi@matthews.com
Applebee's Charlie Wheeler (954)246-3646 charlie.wheeler@matthews.com
LongHorn Steakhouse
CONVENIENCE / FUEL
7-Eleven
Charlie Wheeler (954)246-3646 charlie.wheeler@matthews.com
Nick Seltzer (630)639-6868 nick.seltzer@matthews.com
Circle K Chase Cameron (214)692-2040 chase.cameron@matthews.com
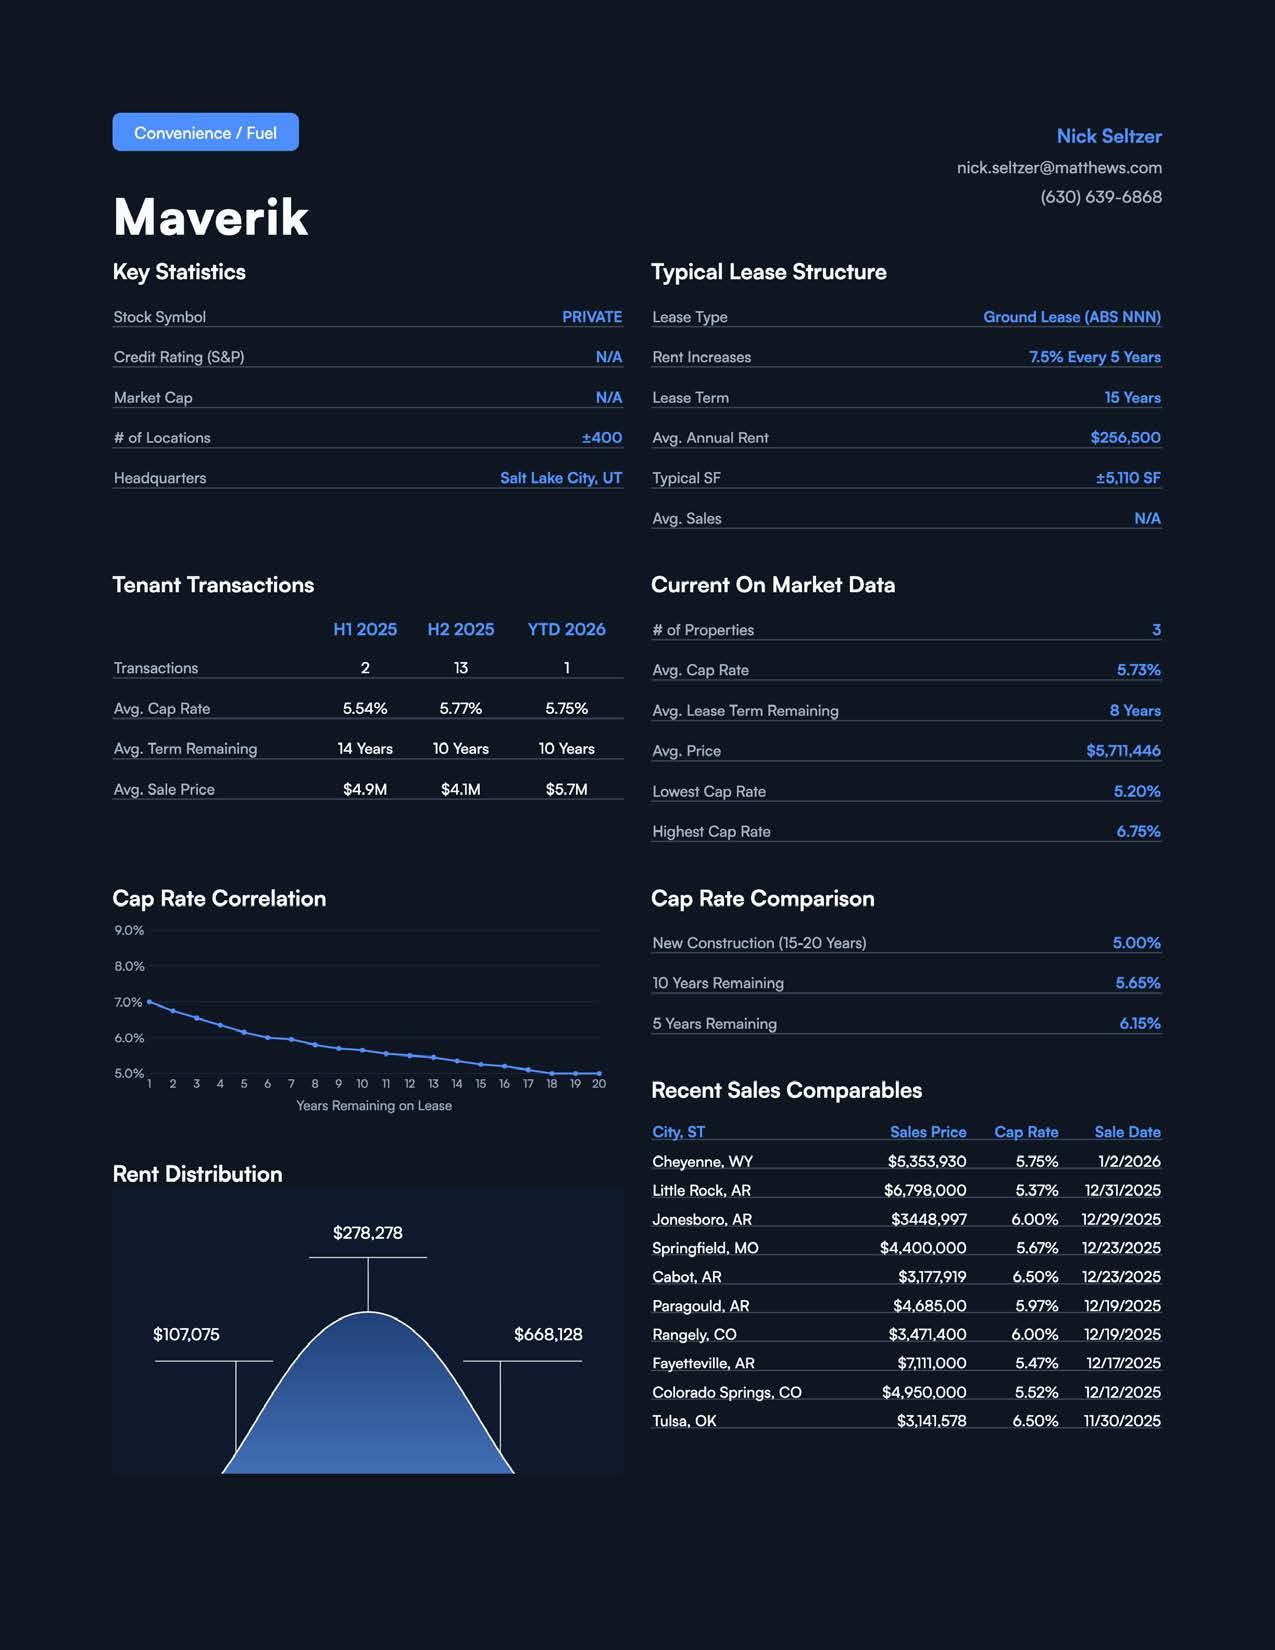
Maverik
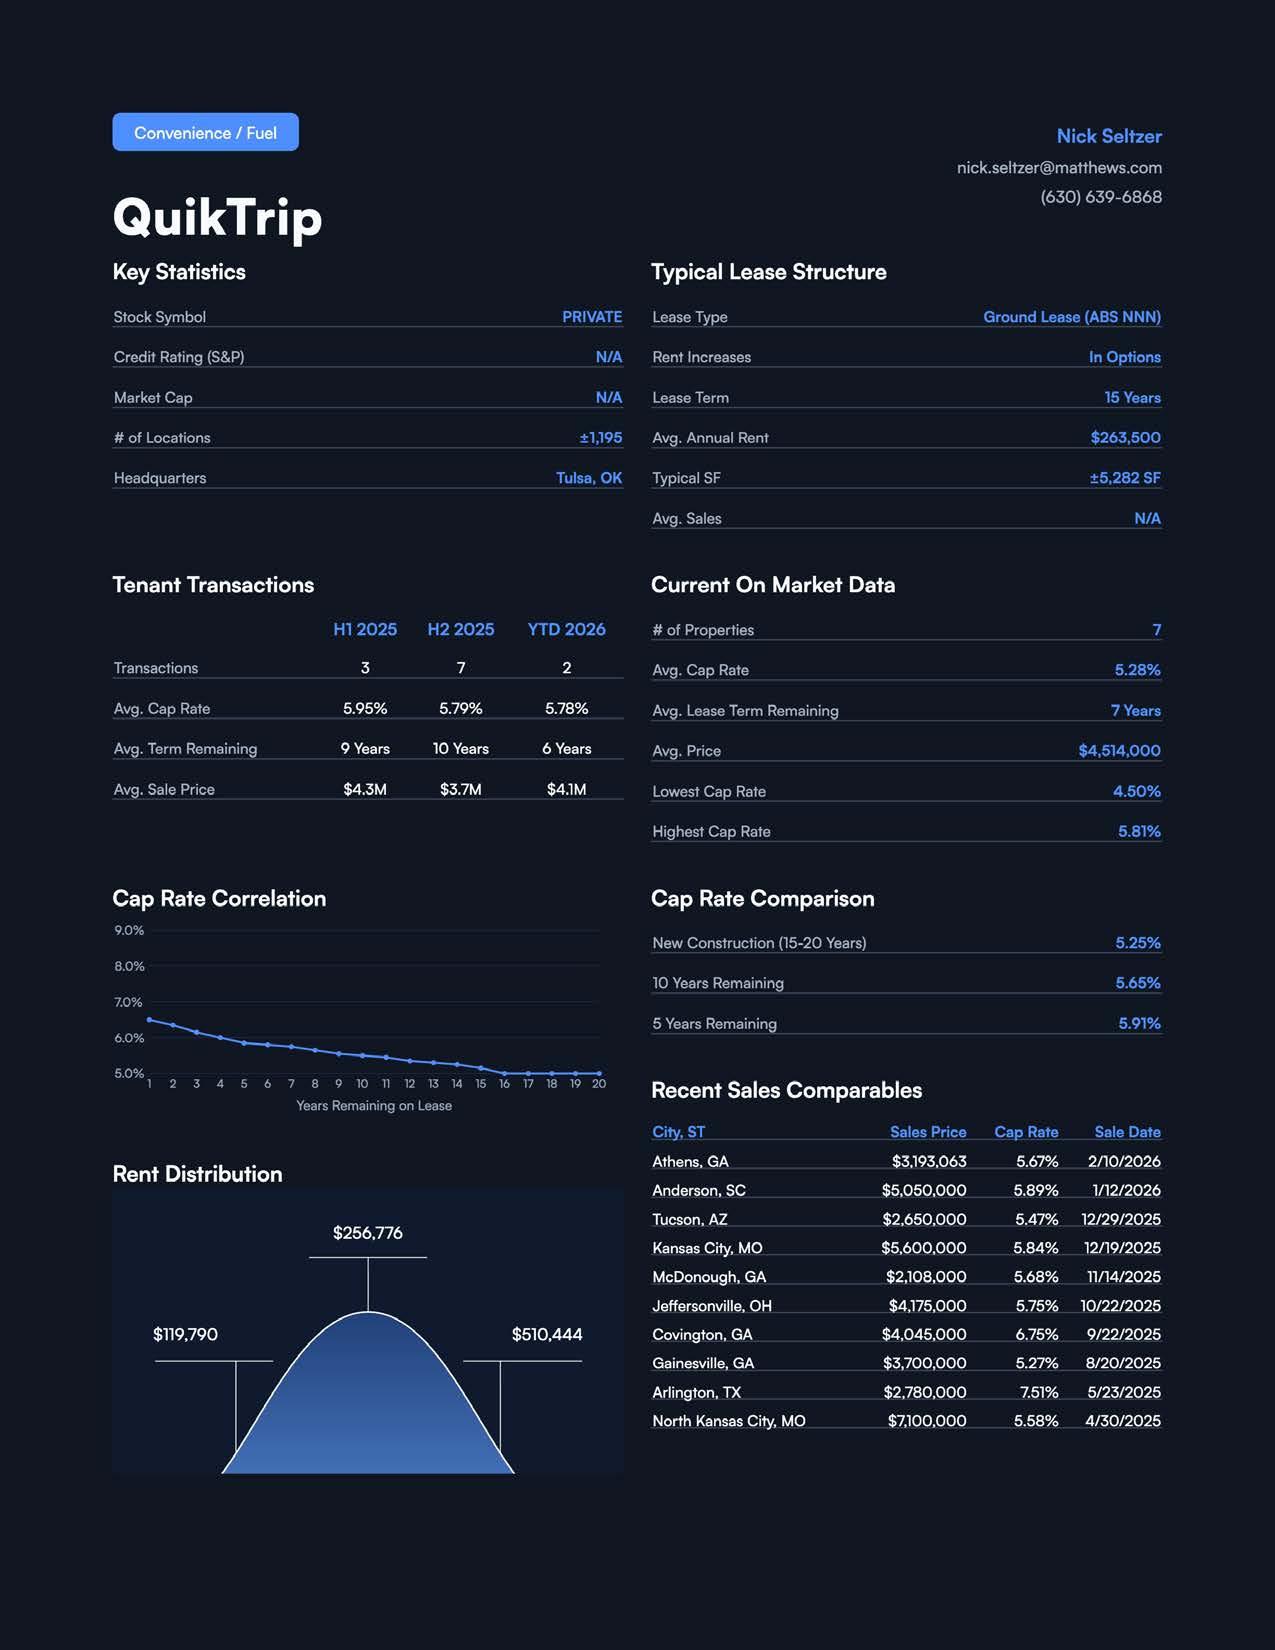
QuikTrip
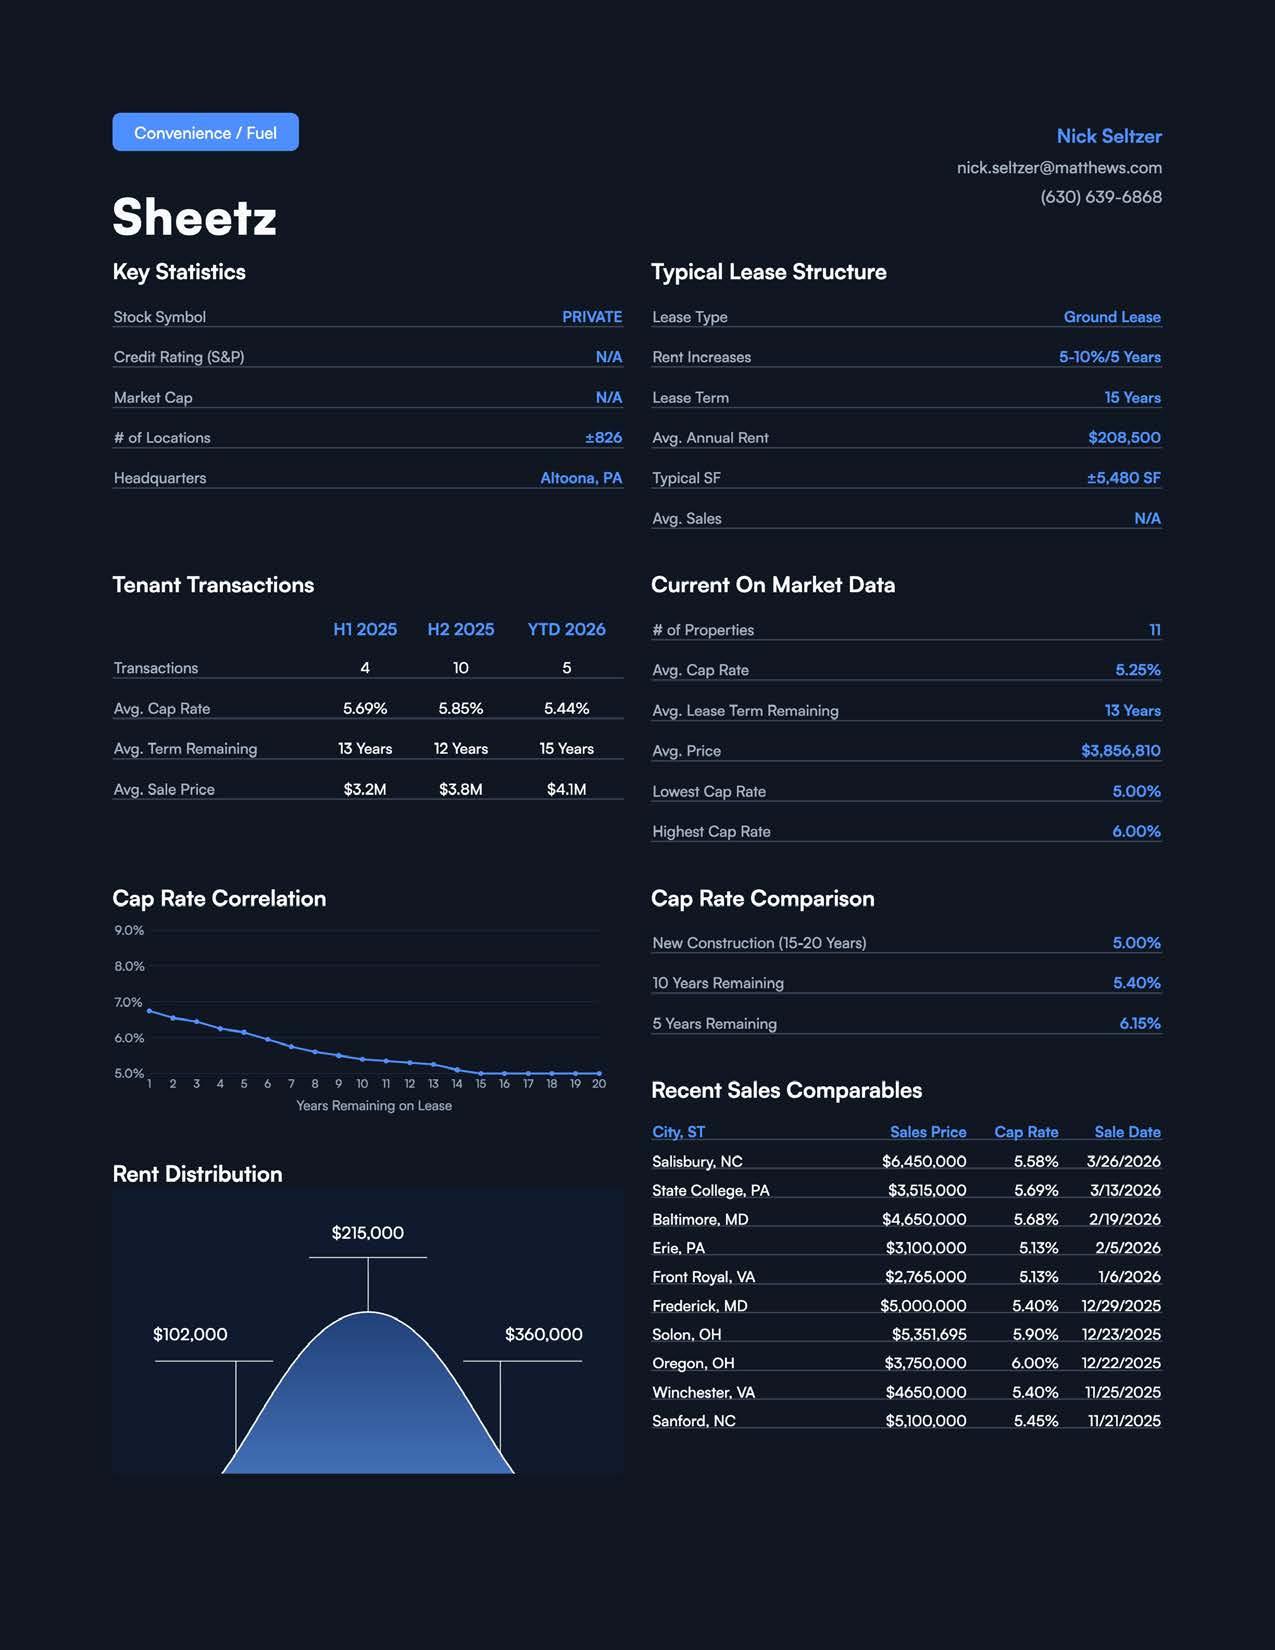
Sheetz
Nick Seltzer (630)639-6868 nick.seltzer@matthews.com
Nick Seltzer (630)639-6868 nick.seltzer@matthews.com
Nick Seltzer (630)639-6868 nick.seltzer@matthews.com
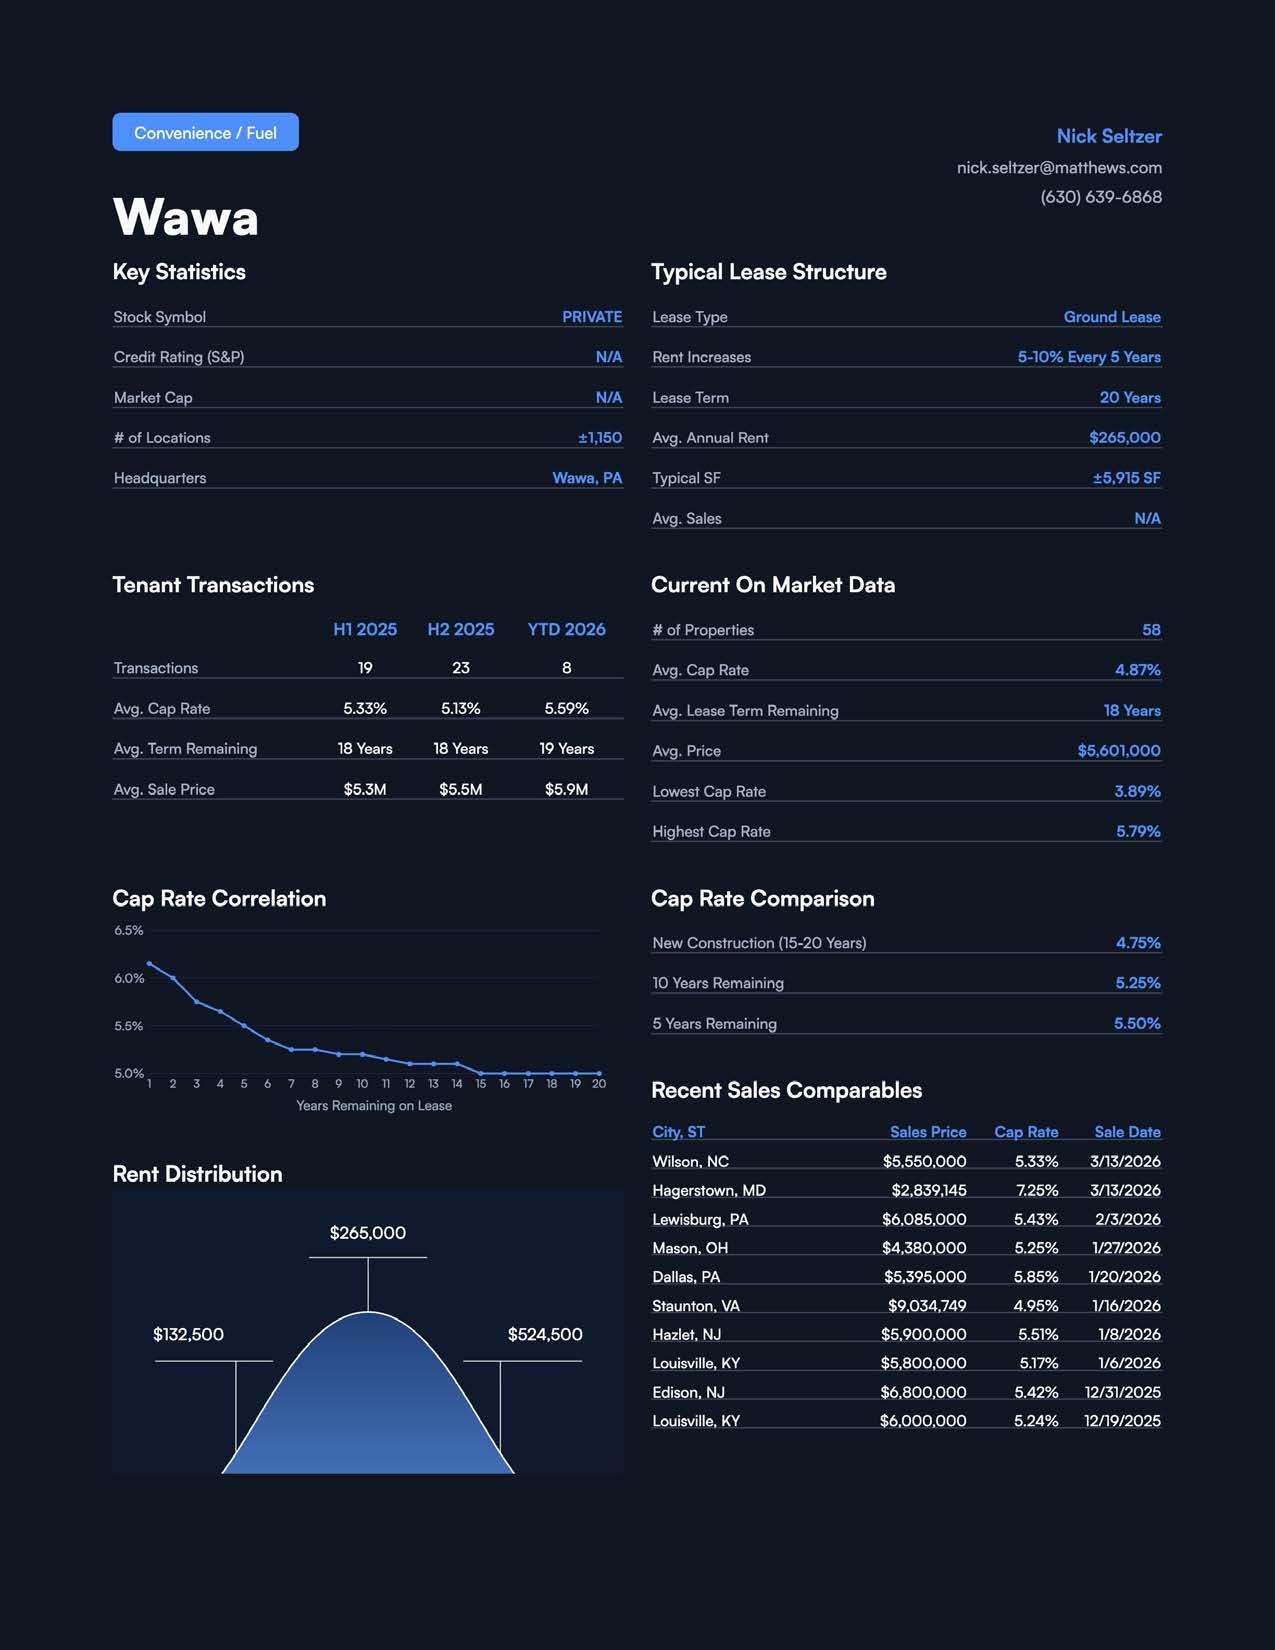
Wawa Nick Seltzer (630)639-6868 nick.seltzer@matthews.com
DISCOUNT / DOLLAR STORES
Dollar General
FAST CASUAL
Edward DeSimone (646)216-5780 edward.desimone@matthews.com
Chipotle Ben Burnett (601)383-1022 ben.burnett@matthews.com
Panera Marc Filia (949)346-9522 marc.filia@matthews.com
PHARMACY / MEDICAL
CVS Jesus Melo (214)295-5743 jesus.melo@matthews.com
Walgreens Christian Becker (512)430-4466 christian.becker@matthews.com
QSR
Arby's Harrison Wachtler (615)667-0160 harrison.wachtler@matthews.com
Bojangles Harrison Wachtler (615)667-0160 harrison.wachtler@matthews.com
Burger King Davis Johnson (972)636-5715 davis.johnson@matthews.com
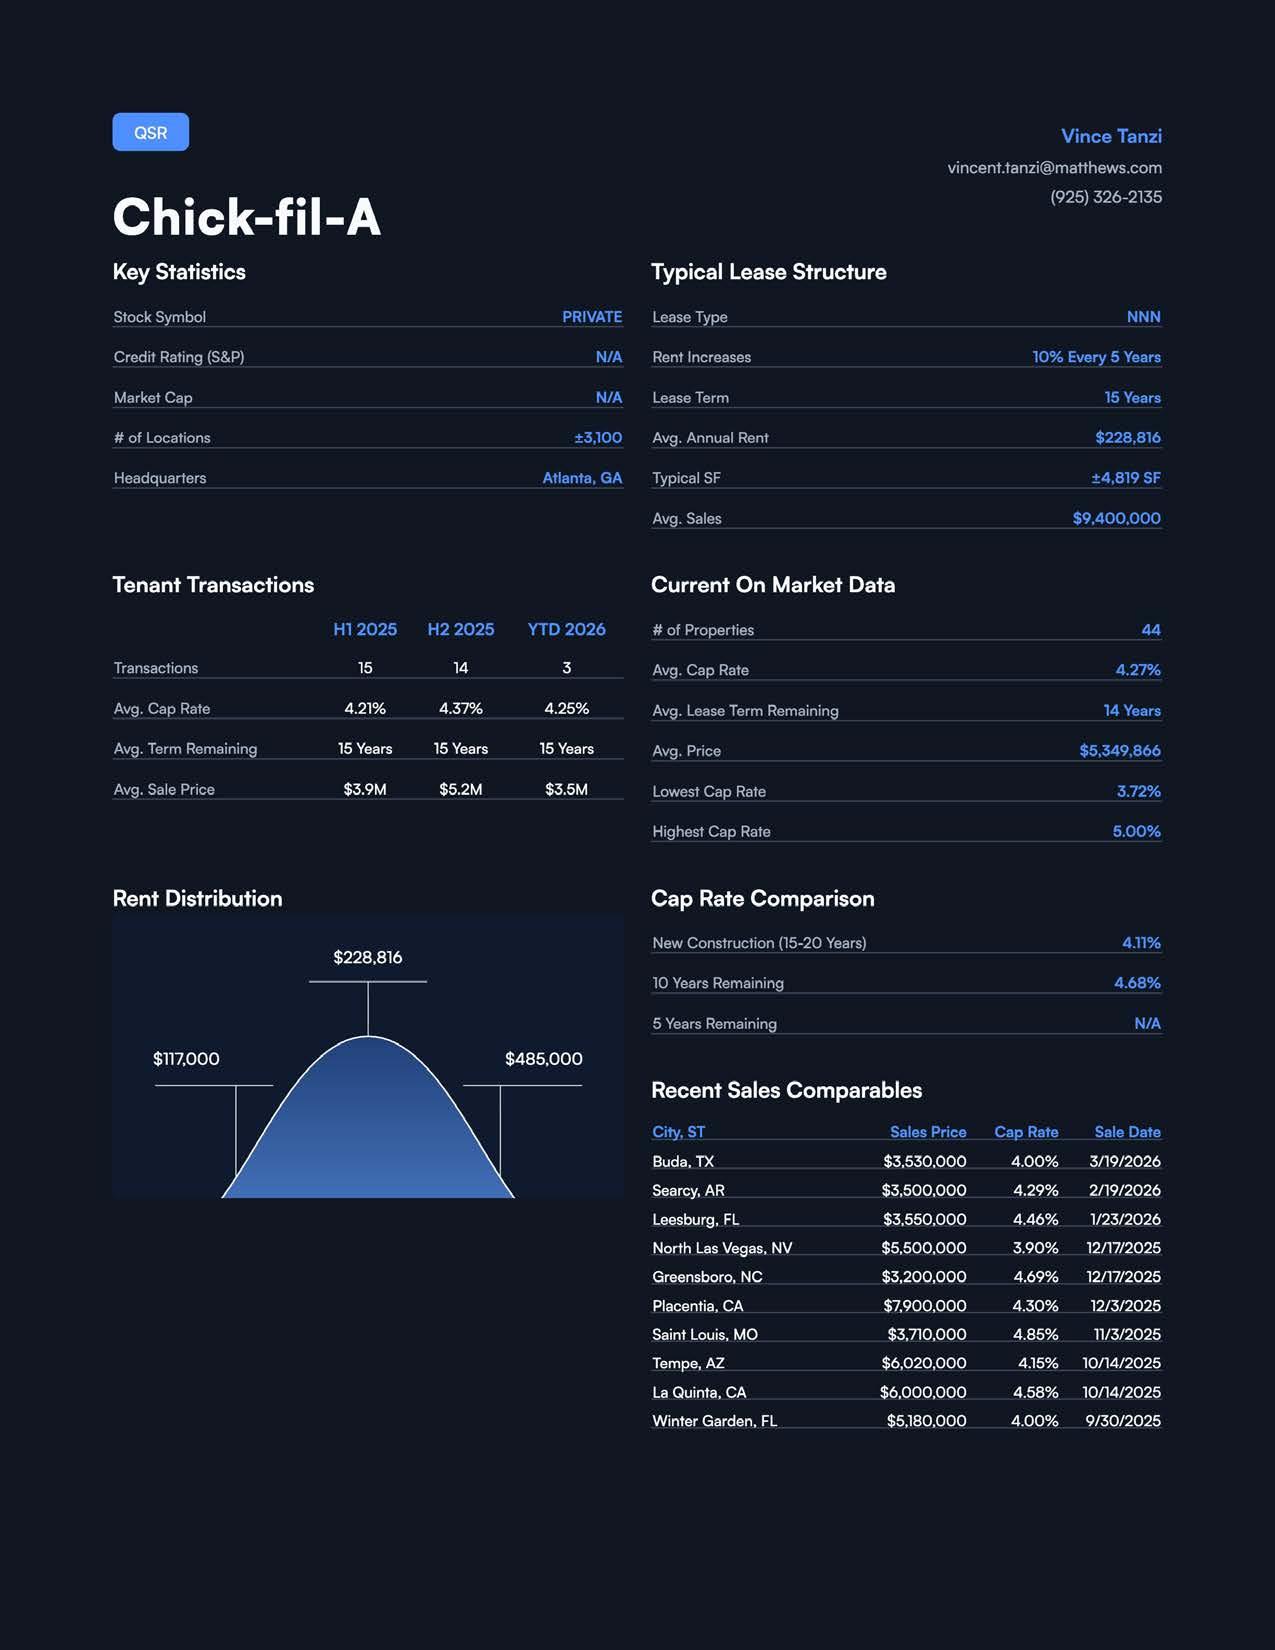
Chick-fil-A Vince Tanzi (925)326-2135 vincent.tanzi@matthews.com
Vincent Tanzi
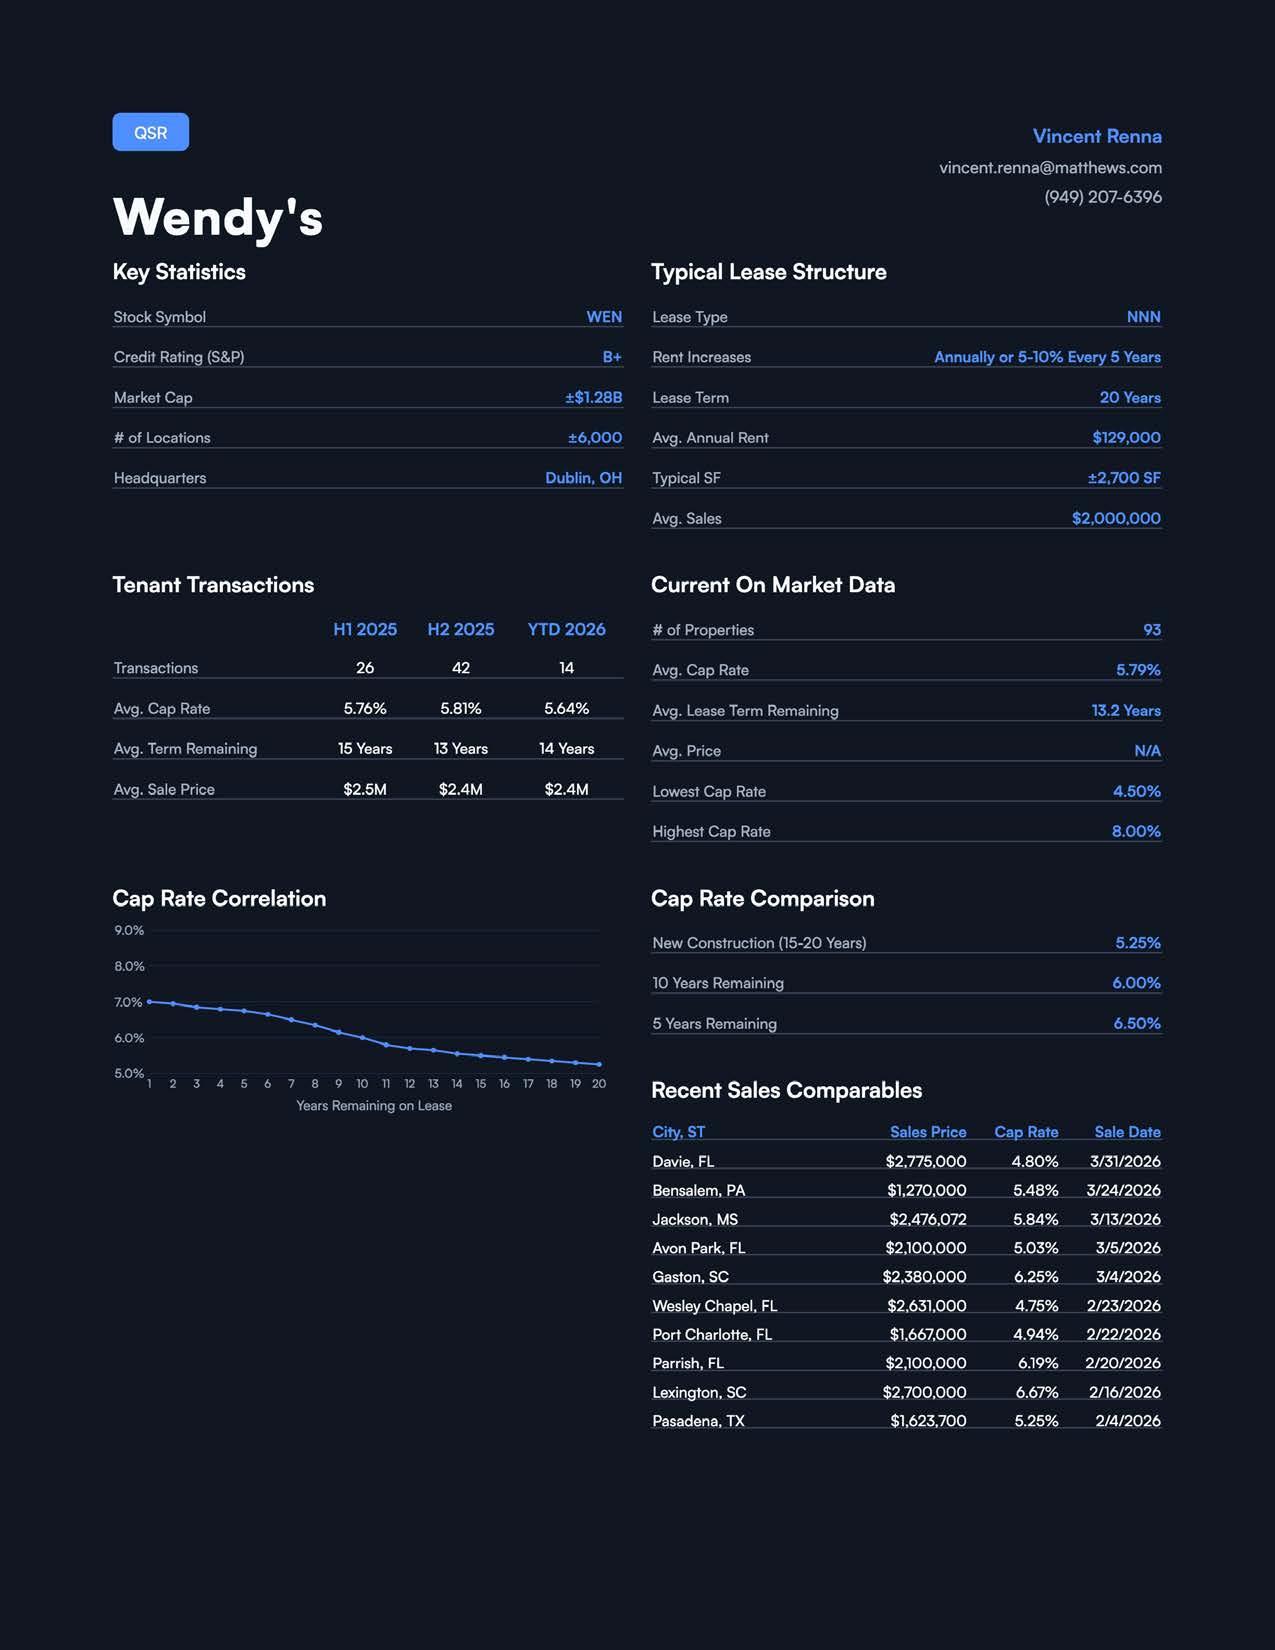
Wendy's Vincent Renna (949)207-6396 vincent.renna@matthews.com
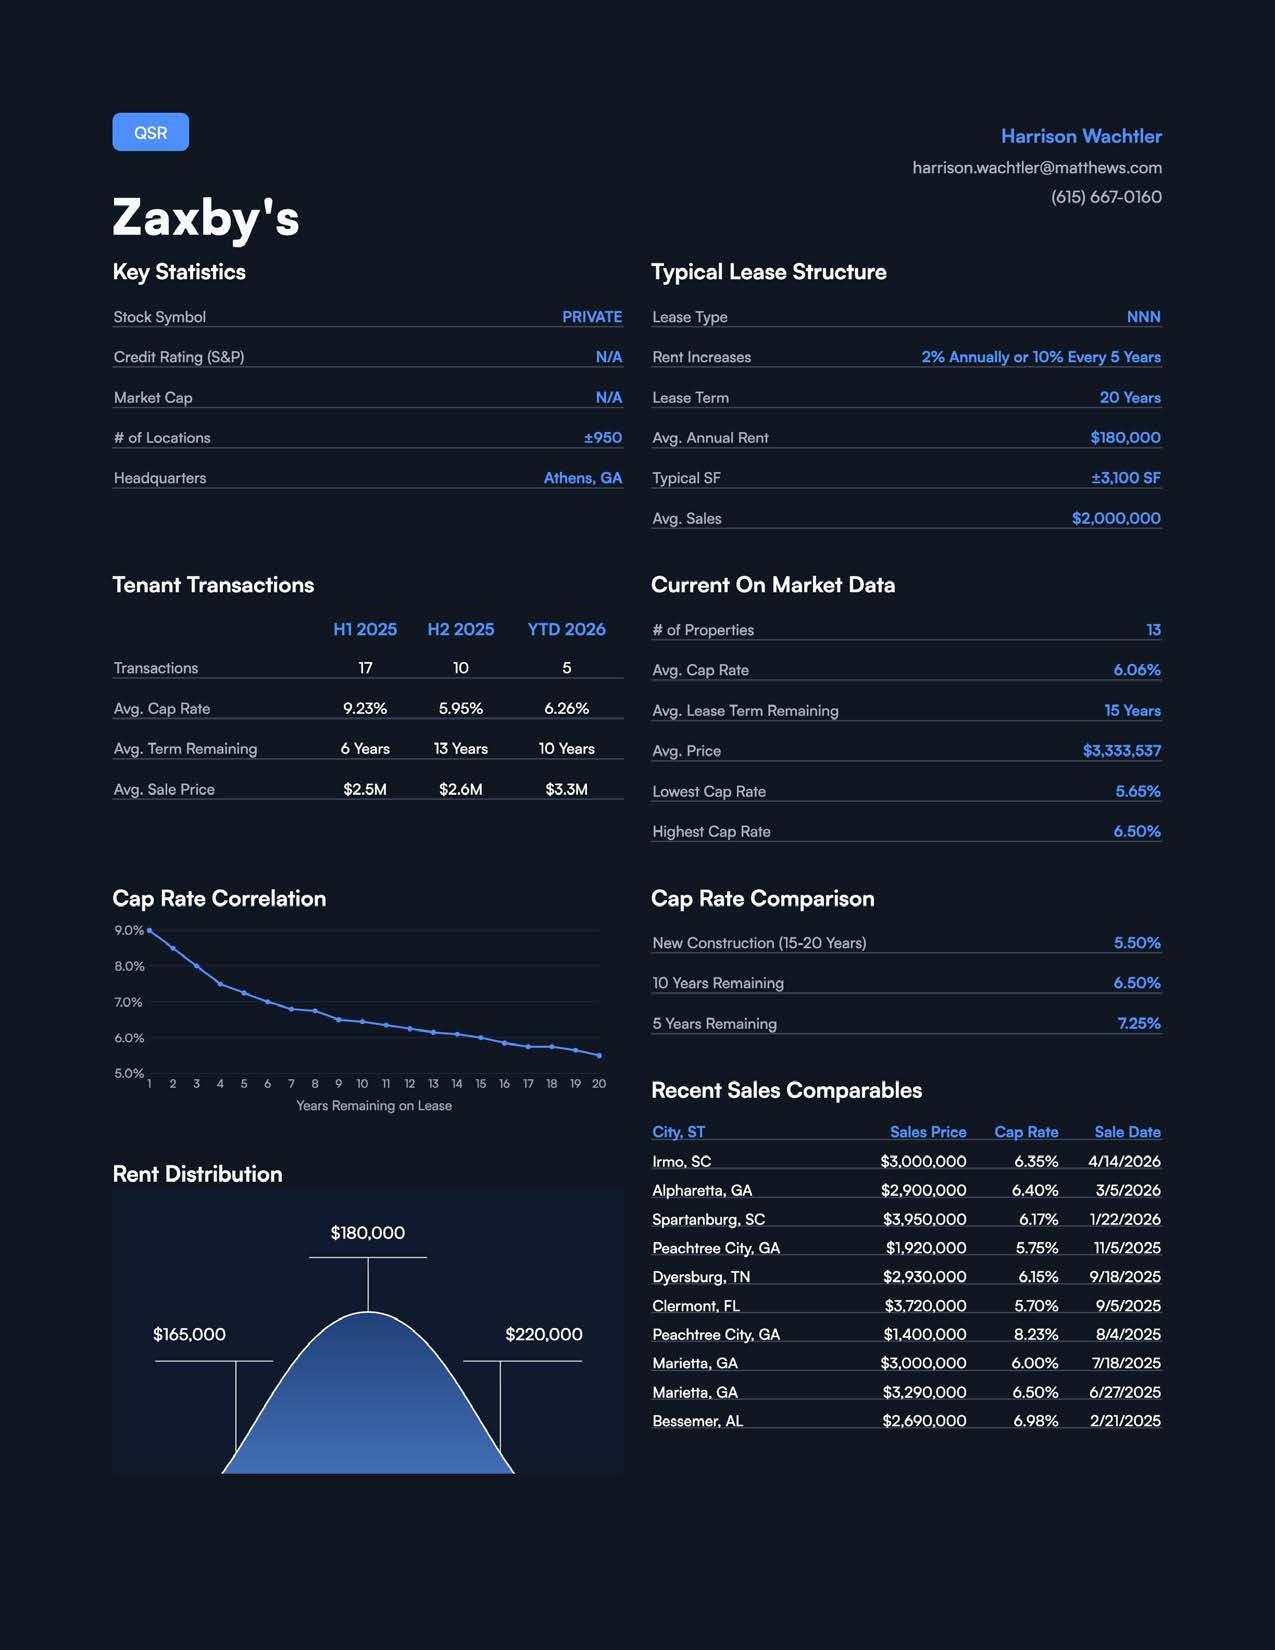
Zaxby's Harrison Wachtler (615)667-0160 harrison.wachtler@matthews.com


Listen Now on As Featured In featured episodes

















Healthcare has remained one of the more resilient sectors across commercial real estate, despite working through a challenging capital environment.
Today, buyers remain focused on well-located, durable assets. As capital markets begin to stabilize, the environment becomes increasingly constructive for transaction activity. According to a recent CoStar Group analysis, year-over-year sales volume has increased by 13.7% for healthcare assets, underscoring continued investor confidence in the sector even as the market recalibrates.
First and foremost, it’s the continued migration from inpatient to outpatient care, along with a supply environment that remains relatively constrained. The shift toward outpatient delivery is not new, but it continues to have a profound influence on how healthcare providers think about location strategy, patient access, and facility planning. Now more than ever, providers are focused on delivering care closer to the consumer in settings that are convenient, efficient, and better aligned with how patients want to engage with the healthcare system.
Rather than representing a dramatic reshaping of demand, it’s simply a continuation of a structural shift that has been unfolding for years. The healthcare system has been moving steadily toward outpatient delivery for some time, and that trend continues to drive demand toward facilities that are more accessible, more consumer-oriented, and better integrated into the communities they serve. Providers want to be closer to their patient base, and real estate has to support that objective.
At the same time, development activity has slowed meaningfully, and that has created a dynamic where demand is still healthy, despite limited new supply. In that kind of environment, you tend to see strong absorption and continued rent growth, especially for well-located, high-quality assets. While 2026 is still largely defined by restricted supply, this period is laying the groundwork for a new wave
What is becoming more pronounced, however, is the quality expectation that comes with that shift. There is now a much higher standard for what healthcare space needs to deliver. Patients increasingly expect a healthcare environment that feels modern, convenient, and intentionally designed. However, these expectations raise challenges for both new development and the repositioning of older assets. In some cases, obsolete or underutilized properties can be adapted for outpatient healthcare use, which creates opportunity. But construction and build-out costs remain elevated, so when a new product does come to market, it often commands premium rents. Over time, that dynamic will continue to widen the gap between high-quality healthcare space and older, less competitive products.








WHICH HEALTHCARE SPECIALTIES ARE SHOWING THE STRONGEST DEMAND FUNDAMENTALS?
Several specialties continue to stand out, particularly orthopedics, cardiology, and oncology. These are areas where demand remains durable and where the underlying patient need is significant and consistent. In many cases, these specialties also benefit from long-term demographic tailwinds, advances in treatment, and a greater emphasis on specialized outpatient delivery models.
From a real estate perspective, those specialties are attractive because they often require thoughtfully designed space and support long-term tenancy. They are not purely interchangeable uses. The operational requirements, patient volumes, and investment in equipment can make these practices particularly sticky within a given location, which in turn supports strong demand fundamentals for the real estate that serves them.
WHAT ROLE IS TECHNOLOGY PLAYING IN THE EVOLUTION OF CARE DELIVERY AND FACILITY DESIGN?
Technology is playing an increasingly important role across the entire commercial real estate industry, especially in healthcare, and AI is only accelerating that trend. One of the biggest impacts is the compression of time. Processes that historically required more manual effort, whether in planning, underwriting, design, research, or market analysis, can now be completed more efficiently and with better information. These tools allow agents to make decisions faster and with greater confidence.
Over time, that kind of efficiency should carry through into care delivery itself. When providers, architects, operators, and investors are able to process information more quickly and execute with greater precision, the result is better and more responsive healthcare environments. Technology is not replacing the need for sound judgment, but it is absolutely increasing the speed and sophistication with which decisions can be made. As a result, these advancements will continue to shape both facility design and operational execution going forward.
The most important demographic driver is the aging population. As a larger share of the population moves into the 65-and-older age bracket, demand for healthcare services will continue to expand, and that naturally supports long-term demand for healthcare real estate as well. This is one of the clearest and most durable tailwinds in the sector.
What makes that especially meaningful is that aging does not just increase demand in a general sense. It also supports sustained need across a range of specialties, treatment settings, and care models. As utilization rises, providers need more space, better-located facilities, and real estate strategies to meet patient demand efficiently. That demographic foundation is one of the reasons healthcare real estate continues to be viewed as such a resilient asset class over the long term.
Consolidation continues to shape strategy in a significant way. Larger health systems are still acquiring or partnering with independent practices, and private equity remains an active force in the space. As capital becomes increasingly accessible at more favorable rates, that activity will accelerate further. Consolidation tends to drive more sophisticated real estate decision-making because scale creates both opportunity and complexity.
As organizations grow, their real estate strategies often become more deliberate. They’re thinking not only about footprint and expansion, but also about operational alignment, access to patients, and how to integrate different service lines across markets. We are also seeing continued partnership structures, including joint ventures involving health systems, rehabilitation operators, and behavioral health providers. All of that reinforces the idea that healthcare real estate is no longer just about site selection; it is increasingly tied to larger strategic and capital allocation decisions within the industry.
Patient preferences have a greater influence on healthcare real estate today than they have in the past. Patients want care delivered in locations that are easy to reach, close to where they live, and designed in a way that feels modern and welcoming rather than institutional or outdated.
That expectation is shaping both where providers choose to locate and how they think about the physical environment itself. Design increasingly matters not just from a branding perspective but also from a care delivery perspective. A modern, thoughtfully designed setting can improve comfort, support efficiency, and better reflect the level of care being delivered. In that sense, patient preference is pushing the market toward more consumer-oriented healthcare formats.
Ambulatory surgery centers stand out as one of the most resilient specialties.The reason is that they are highly specialized, operationally essential, and supported by long-term trends in how care is delivered. The more specialized the facility, the more defensible it tends to be from a real estate standpoint. These are not generic spaces that can be easily replicated or casually replaced.
ASCs require significant infrastructure, whether that’s advanced HVAC systems, filtration, sanitation controls, or other technical elements that support procedural care. Even as technology evolves, including the growth of robotic surgery, that doesn’t reduce the need for dedicated space. If anything, it can reinforce the importance of purpose-built environments that can accommodate increasingly sophisticated care delivery. That’s one of the main reasons why ASCs are particularly well-positioned for long-term resilience.
AS THE SECTOR HAS MATURED, HOW HAS THE STANDARD FOR SUCCESS EVOLVED COMPARED TO TEN YEARS AGO, AND HOW HAVE YOU ADAPTED YOUR APPROACH TO STAY AHEAD IN THIS NEW ERA FOR HEALTHCARE REAL ESTATE?
In many ways, the fundamentals of success have not changed as much as people assume. This is still a relationship-driven business that rewards consistency, market knowledge, and a deep understanding of both transactions and capital markets. For us, staying ahead has always meant remaining active in the market, constantly connecting with clients, understanding the financing environment, and continuing to learn.
What may have changed is the level of sophistication required to compete at a high level. Markets move faster, information is more abundant, and clients expect sharper insights and stronger execution. But even in that environment, success comes back to being in the mix every day, staying close to the market, and continuing to build knowledge over time.
THE
AT MATTHEWS™ THE HEALTHCARE DIVISION HAS SCALED INTO A NATIONAL PLATFORM. WHAT HAS THAT EVOLUTION REQUIRED AS LEADERS, AND WHAT’S BEEN KEY TO ITS SUCCESS?
Building a platform at scale requires patience, conviction, and a real commitment to doing business the right way. Growth is never perfectly linear, especially in a business as demanding as commercial real estate. Over time, many people may enter a platform, but not everyone is built for the pace, pressure, and persistence the industry requires. That’s why leadership is not just about setting standards; it’s also about providing the support, coaching, and structure that allows brokers to reach their full potential.


The people who remain active, engaged, and informed are the ones best positioned to stay ahead.

One of the most important things a leader can do is create an environment where people can grow, both technically and personally. You cannot manufacture success for someone, but you can help them recognize what they are capable of and give them the tools to pursue it. At the same time, building a successful healthcare platform also requires a clear point of view on the market. You have to know where opportunity exists, where competition is limited, and where your advisory can truly create value.
For us, a major part of that value proposition has been helping healthcare providers understand that real estate is not just a background consideration. It can be a strategic and financial lever in its own right. Many physicians and operators spend years building successful practices without fully appreciating

HOW HAS YOUR ABILITY TO INTERPRET THE HEALTHCARE REAL ESTATE MARKET THROUGH BOTH AN OPERATOR’S LENS AND AN INVESTOR’S LENS SHAPED THE WAY YOU IDENTIFY OPPORTUNITY, ASSESS RISK, AND STRUCTURE TRANSACTIONS THAT CREATE VALUE FOR BOTH SIDES?
At the core of that perspective is empathy. When you understand the motivations, pressures, and priorities of all the parties involved in a transaction, you are in a much better position to create solutions that work. That means understanding not just the buyer and seller, but also the lender, the attorneys, the agents, and the broader context in which the deal is happening.
The ability to see a transaction through multiple lenses helps you identify where risk actually sits, where expectations may be misaligned, and where the real opportunity lies. It also allows you to structure deals in a way that creates confidence on both sides. In healthcare real estate, especially, where transactions can be nuanced and operational considerations matter, that broader perspective becomes a real advantage. Ultimately, the best outcomes tend to come from being able to put yourself in multiple pairs of shoes and navigate the process with that awareness.






AS HEALTHCARE REAL ESTATE CONTINUES TO EVOLVE, WHAT DO YOU THINK THE NEXT PHASE OF THE MARKET WILL DEMAND IN TERMS OF EXPERTISE, EXECUTION, AND OPPORTUNITY?
The next phase will continue to reward strong fundamentals, but it will also place a greater emphasis on adaptability and the ability to leverage technology effectively. Market knowledge, transaction experience, and sound judgment will remain essential. Those things don’t go out of style; but the professionals and platforms that can combine those fundamentals with faster, smarter execution will be the ones best positioned for the future.
In particular, there will be increasing value in embracing tools like AI and other technologies that improve efficiency, sharpen analysis, and accelerate decision-making. The opportunity is not simply in using new tools for the sake of it, but in integrating them in a way that enhances execution and helps deliver better outcomes for clients. That combination of traditional expertise and modern capability is where the































Over the past two decades, the rise of e-commerce sparked a widespread belief that traditional shopping centers were doomed. Analysts, journalists, and investors predicted that physical retail would collapse
By:Ashleigh Liguori & Jeff Enck

For over a decade, the story seemed simple: Amazon and e-commerce were bound to wipe out shopping centers. Headlines screamed of a “retail apocalypse,” predicting malls would die and physical stores would become obsolete. Department store sales have declined by over 57% since 2015 according to Federal Reserve Economic Data, and big-box anchors that once defined shopping patterns have struggled to stay relevant. These closures fueled the perception that retail real estate was dying, and many investors and lenders pulled back from retail assets.
Yet reality tells a different story. Retail property sales are growing and pricing is robust, not shrinking. According to CoStar, in 2025 total sales volume increased 14% in the last year, reaching $73 billion, marking the second consecutive year of improvement and passing pre-pandemic levels.
Transaction activity has returned to, and now exceeds, levels reminiscent of the pre-pandemic era, supported by individual investors, REITs, and selective institutional buyers targeting different market segments according to CoStar. Recent U.S. Census data shows that even as e-commerce grows, its sales only account for 16.4% of total retail sales highlighting the continued resilience of in-person shopping. People continue to visit shopping centers, not just to buy, but to socialize, seek services, and enjoy experiences. Shopping centers didn’t disappear, they are just adapting into something fundamentally different.



Post-Pandemic Rebound: U.S. Retail Investment Since 2015
Source: CoStar Group, Inc.

E-commerce didn’t eliminate shopping centers; it eliminated certain types of retail. Commodity-focused stores, mid-market department stores, and large electronics chains lost relevance as consumers turned to online platforms for convenience and endless inventory. 4,100 locations






Other department stores like Macy’s, JCPenney, and Saks Off 5th, have started shutting down stores with more planning to leave malls through 2026. These big-box anchors that once drove traffic before the digital age are fading and being replaced by more
The real casualty was the “transaction-only” retail model. Stores that relied solely on selling products, without customer engagement, struggled to compete with e-commerce shopping. Consequently, this disruption opened new opportunities for shopping centers to reinvent themselves. Retailers and landlords began focusing on what e-commerce could never fully translate: experiences, services, and social engagement that encourage consumers to come in person.



Source: Placer.ai
Shopping centers are evolving into experience, service, and retail environments. This translates to vibrant, walkable hubs where people can shop, dine, work out, access wellness services, and gather socially. The rise of these environments reflects a shift from a purely transactional model to a community-centered approach that blends retail with entertainment, dining, and service-based offerings.
As reported by CoStar, service tenants now occupy just over 50% of total retail square footage, up from 40% fifteen years ago. This evolution underscores the growing importance of experience-driven uses within shopping centers. Restaurant space has increased from an average of 5% a decade ago to 8-9% in U.S. malls, with projections in some international markets reaching 20% by 2025, according to ICSC. Notably, open-air shopping centers, typically anchored by restaurants and service-based tenants, are leading the shift. By February 2026, Placer.ai showed foot traffic at open-air centers had risen 7.3% year-over-year, outperforming traditional formats. Overall, shoppers are returning to shopping centers not just to buy, but to spend time, socialize, and engage with the environment. This shift highlights the growing importance of experiences and services in keeping shopping centers relevant.



Shopping centers reward operators who actively manage their assets. Owners can curate tenant mixes, reposition or redevelop underperforming spaces, and program community-oriented experiences that keep shoppers engaged. Lease structures allow for ongoing management, turning retail real estate into an operational asset.
CoStar shows, as of early 2026, the average asking rents nationally sit near $26 per square foot, offering flexibility for service-based tenants who often prefer leasing smaller spaces rather than purchasing large properties outright. Successful operators focus on tenant curation, active leasing strategies, community programming, and reinvestment in property upgrades. In short, the modern shopping center is not always passive real estate; it’s an asset that rewards operators who understand their

Shopping centers that embrace this model are seeing stronger engagement and sustained foot traffic, as they become not just places to shop, but central hubs for daily life and community interaction.
The next generation of shopping centers emphasizes curated tenant ecosystems, flexible spaces, experiential concepts, and data-driven management. Owners who treat these assets as passive income vehicles risk falling behind, while those who actively engage in strategic leasing, community programming, and experiential partnerships define the future of retail.

This shift is also reflected in pricing, as heightened demand from buyers in the shopping center space has driven increased competition for well-positioned, experience-oriented assets. Investors are placing a premium on centers that demonstrate strong tenant curation, foot traffic, and adaptability, reinforcing the value of active, strategy-driven ownership. ICSC notes that retail spaces featured in mixed-use development command premium rents, at about 10-20% higher than traditional shopping centers.
E-commerce didn’t destroy shopping centers; it forced them to be better and focus on their best attributes. Today, shopping centers are thriving as experience and service-focused hubs, attracting visitors who want more than a transaction. Consumers want connection, entertainment, and convenience. The owners and operators who embrace this active, strategic approach will lead retail into its next chapter, making shopping centers more relevant, resilient, and engaging than ever.
Ashleigh Liguori
ashleigh.liguori@matthews.com (864) 766-4451 and entertainment.
Source: ICSC
Jeff Enck jeff.enck@matthews.com (470) 704-8872







By Noah Lindon · Jonah Yulish · Matthew Wallace
The National Investment Center for Seniors Housing & Care confirms the sector has moved beyond early-stage recovery and into sustained expansion, as the first wave of Baby Boomers turns 80 between 2026 and 2030. Occupancy is tightening, new supply is constrained, and capital is rotating back into the space. For investors, the question is no longer whether the sector is back, but how to position themselves now before pricing fully reflects the demographic shift ahead.
Seniors housing has crossed into a new phase, and the data is no longer subtle. Occupancy continues to rise, inventory growth has stalled, and transaction volume is accelerating as capital moves aggressively into the sector. What was recently a wait-and-see environment has become a narrow and time-sensitive investment window that’s only open for the next few years.


Beginning in 2026, the first wave of Baby Boomers turns 80, the age at which seniors housing demand accelerates meaningfully. This age cohort represents the core demand base for the sector, and its growth is both significant and sustained. The expansion of the 80-plus population will continue for years, creating a steady and predictable increase in demand.
The long-anticipated silver tsunami is not approaching. It’s already here.
For years, the industry expected this moment, but COVID delayed its visibility. Seniors stayed in place longer, and the sector faced elevated mortality and significant labor shortages that compressed margins and slowed performance. Concurrently, development slowed materially due to higher interest rates, rising construction costs, and operational disruption. Many groups paused new projects, which has led to a limited pipeline today.
What makes this moment particularly compelling is the mismatch between demand and supply. That temporary slowdown initially masked demand, but now those conditions have reversed. The demographic wave is colliding with a market that is fundamentally undersupplied.
As a result, the industry is entering a period where demand is increasing rapidly while new inventory remains constrained.
Occupancy has consecutively increased by roughly 200 basis points annually for the last four years. Secondary markets have reached 90 percent occupancy, with seven primary markets already surpassing that level.


Assisted Living (AL) is leading recent gains, outpacing Independent Living (IL) and reflecting the needs-based nature of demand in the sector. Net absorption remains positive across property types, and occupied units have continued to climb for multiple consecutive quarters. With the primary reasoning behind move-in decisions in this sector being family considerations and/or health events as opposed to economic conditions, a more stable demand profile is created, supporting continued occupancy growth despite uncertain macro environments.


Source: NIC MAP
Rising occupancy is the foundation for improved operating performance, as it directly supports revenue growth and margin expansion. The significance of this trend is straightforward: occupancy gains are no longer limited to isolated metros; they are broad-based and supported by demographic momentum.
While demand is strengthening, supply growth has slowed materially. Annual inventory growth in primary markets is now below 1% for the third consecutive quarter, well below the historical averages seen between 2017 and 2021.
Source: NIC MAP
Even as development begins to re-emerge, there is an inherent delay of two to three years before the delivery of new projects. As a result, a clear near-term window has opened where occupancy can continue to rise without meaningful new supply entering the market.
This imbalance between demand and supply is the defining characteristic of the current cycle and is expected to persist over the next several years.


Rising occupancy is translating directly into pricing power. As communities fill and concessions burn off, operators are regaining leverage in rate negotiations, particularly in stabilized assets with strong local positioning.
According to NIC data, annual asking rent growth in Q4 2025 reached 3.9% for Independent Living in primary markets and 4.9% for Assisted Living. Secondary markets are showing similar strength, with Assisted Living exceeding 5% annual growth.
This momentum is expected to accelerate. Seniors housing is now projected to see approximately 9% annual rent growth over the next five years, outpacing nearly every other real estate sector.
Both scarcity and the nature of demand support this growth. With move-in decisions increasingly driven by health and family needs rather than economic cycles, price sensitivity is reduced, adding durability to pricing power as occupancy tightens.
When combined with occupancy gains, moderate annual rent increases can also generate meaningful NOI growth over a multi-year hold. This level of rent growth will not persist indefinitely. As development eventually returns and affordability becomes a factor, growth will normalize. That makes the current period particularly important for establishing basis.
Investors have already recognized the shift as capital has started flowing back into seniors housing in a meaningful way, and transaction volume is increasing as groups move to secure a position early in the cycle.
A defining feature of today’s market is pricing. Many assets are trading below replacement costs, allowing investors to acquire properties at levels that do not reflect current construction economics.
This creates a significant advantage for investors to enter at a lower basis while benefiting from future rent growth and occupancy gains. However, this window is limited. As fundamentals continue to improve, acquisition pricing will adjust and deals will no longer pencil the same way they do today.
The current setup is directly tied to the disruption of the past several years. COVID impacted seniors housing more than most sectors, both operationally and demographically. Labor shortages reduced margins, development slowed, and demand was temporarily deferred.
At the same time, the underlying demographic trend did not change. It accumulated. What was expected as a gradual wave has become a concentrated surge.
The next phase of this cycle is unusually well defined. From 2026 through approximately 2030, the sector is positioned for continued occupancy growth alongside minimal new supply. This creates a window where performance can be driven by both revenue growth and operational improvement, without immediate pressure from new development. These conditions are fostering a period where acquisition opportunities can still be found at prices below replacement cost.
That window, however, will not remain open. Development is beginning to re-enter the pipeline, and while deliveries will lag, they will eventually impact supply. Simultaneously, acquisition pricing will begin to reflect improved fundamentals.
The most compelling opportunities today are centered on basis. Investors are focusing on assets that can be acquired below replacement costs or repositioned to capture rent growth. Newer vintage properties offer the ability to acquire highquality assets at a discounted price, in comparison to today’s construction costs. At the same time, older vintage product presents opportunities for redevelopment and operational improvement at a lower entry price.
This combination allows investors to benefit from current pricing dislocation while positioning for future growth. Success in this environment requires more than recognizing the trend. It requires execution. Identifying the right opportunities depends on market visibility, operator alignment, and a clear understanding of where pricing still lags fundamentals.
The opportunity is clear, but it is time-sensitive. Decisions made over the next four years will define the next decade of performance for seniors housing investors who move now and ride this wave to lasting success.
Noah Lindon noah.lindon@matthews.com (440) 668-8951
Jonah Yulish jonah.yulish@matthews.com (216) 503-3610
Matthew Wallace matthew.wallace@matthews.com (216) 220-8860




Source: Matthews™ Research | 2025, 2026 AT A GLANCE
The Big Picture
$8.70T U.S. Retail Sales 2025 2.4% YoY Annual Growth Dec 2025 84% Retail Sales Occur In-Store 2025 4.4% Retail Vacancy Rate Q1 2026
Consumer spending remains resilient, driving nearly two-thirds of U.S. economic activity, while retail fundamentals are supported by limited new supply and steady demand. The result? A market that is defined less by volatility and more by selective strength.
Retail vacancy remains near historic lows at 4.4% as of Q1 2026, with grocery-anchored centers even tighter at 4.0%, significantly outperforming non-anchored retail recording 6.3%. Demand is strongest where retail aligns with daily needs, convenience, and local demographics, creating a durable foundation for long-term performance.
Source: Matthews™ Research | 2025
Value-oriented shopping is becoming structural rather than cyclical, with consumers continuing to prioritize affordability and convenience, despite stabilizing economic conditions.
Monthly retail sales are currently tracking at approximately $733B+ per month for 2026, reflecting sustained consumer activity despite a more selective spending environment.
$100B/month
One of the largest spending buckets in retail in January 2026

~$77B
monthly sales
Value-oriented retail is capturing a growing share of consumer spend, particularly in price-sensitive trade areas


Growth & Spending Trends

$40.1B
monthly retail sale
Health and personal care spending continues to expand, supported by recurring demand and service-based consumption

$100B+
monthly sales
Spending continues to shift toward experience-driven categories

Growth Markets
Driving Stronger Retail Traffic
RETAIL FOOT TRAFFIC TRENDS SUNBELT
Source: Matthews™ Research | 2025, 2026
Retail foot traffic is growing 1.8% annually across the U.S. with stronger gains in Sunbelt and suburban markets
Visit frequency is highest in +45% of visits are under 15 minutes reflecting a consistent trend over the past two years, as consumers favor short, mission-based trips and omnichannel behaviors such as online ordering and in-store pickup
Performance is increasingly tied to location, density, and demographic alignment, rather than overall market size.
Texas | Florida | Arizona | Southeast
Leading U.S. population growth markets
TX
added +391,243 residents in 2025, the largest increase in the U.S.
The South accounted for the majority of U.S. population growth in recent years, adding ~1.8 million residents, more than any other region.
Driving above-average retail visitation and store expansion.
Strongest traffic in outer-ring and suburban locations
Collin County Dallas
Maricopa County Phoenix AZ
Grocery-anchored centers generate 2-3x higher weekly visit frequency than non-anchored centers
Proximity to residential density → enables short, frequent trips rather than destination shopping
of visits occur within a 10-15 minute drive
LOWER- TO MIDDLE-INCOME TRADE
Majority of visits concentrated in households under $75K income which account for 60%+ of total retail trips in many suburban and neighborhood centers.
Strongest traffic across
Tenant mix focused on necessity and convenience → captures a larger share of weekly consumer activity
Source: Matthews™ Research | 2025
Grocery leaders are increasingly winning on value positioning, fresh offerings, and convenience-driven formats, reinforcing their role as the most resilient retail anchors.
Grocery & Essential Retail THE DOMINANT ANCHOR
WHERE THEY’RE GROWING
$675B+ revenue
~5,200 U.S. stores
Suburban Sunbelt markets
Middle-income trade areas
WHY THEY WIN
2,700+ U.S. stores
2,300+ U.S. stores & expanding rapidly
Highest visit frequency across all retail categories
Anchor grocery-anchored and neighborhood centers


Discount & Value Retail
20,000+ Stores Nationwide $150B+ revenue
2,000+ Locations
WHERE THEY’RE GROWING
Southeast, Texas, Midwest Trade areas with HHI below ~$75K
WHY THEY WIN
Higher-income households are increasingly incorporating off-price and discount retailers into their shopping patterns, not as a substitute, but as a complement to expand the customer base beyond traditional value-oriented consumers.
Strong store expansion pipelines
Consistent performance across economic cycles

Food & Beverage
A LEADING DRIVER OF RETAIL LEASING
Food service generates approximately
$100B/month in U.S. Consumer Sales
more than double the rate of health & personal care (~$40B/month).
This reinforces the category’s role as a key driver of retail demand and leasing activity.
4% Growth YoY
Health & Personal Care
CONSISTENT, HIGH-FREQUENCY DEMAND
Health and personal care tenants drive recurring, necessity-based visits, making them reliable contributors to steady traffic in neighborhood and suburban retail centers.
~$40B-45B monthly sales 2025
WHERE THEY’RE GROWING
Dallas-Fort Worth, Phoenix, Tampa, & Nashville*
Mixed-use & high-density suburban centers
WHY THEY WIN
High sales productivity
Drive traffic across dayparts (lunch, dinner, weekends)
Experiential & Entertainment THE DIFFERENTIATION PLAY
U.S. Venues
*cities where food & beverage is growing 4% Growth YoY outpacing many traditional retail categories
WHY THEY WIN
WHERE THEY’RE GROWING
Mixed-use developments
High-income suburban markets
Large-format tenants that anchor destination retail
Increase dwell time and center visibility
Retail is no longer defined by broad growth, but by where and how demand is captured. Strong performance is concentrated in high-growth markets, particularly across the Sunbelt and suburban trade areas, where population inflows and proximity to consumers drive consistent traffic.
At the same time, necessity-based, value-oriented, and experience-driven retail formats continue to outperform, supported by frequent visitation and recurring spend. As consumer behavior becomes more intentional and convenience-focused, success in retail will depend on alignment with local demographics, tenant mix, and the ability to capture everyday demand.
*Data was compiled through research via the U.S. Census Bureau, Bureau of Economic Analysis, Federal Reserve Economic Data, Placer.ai, CoStar Group, and the National Retail Federation. Data reflects the most recently available figures as of 2025-2026.

By Michael Pakravan and Kyle Pari
The so-called retail apocalypse has given way to a clinical makeover, injecting fresh vitality into the retail leasing landscape. While commodity-driven retail giants have shed millions of square feet, CoStar reports a sector leaner and more resilient than ever, with national vacancy rates compressed to a razorthin 4.3% as of Q1 2026.
The ascendance of medtail isn’t just a change in signage, it’s a pivot from pushing product to prioritizing people.
Today’s powerhouse tenants aren’t selling inventory; they’re selling appointments, routines, and optimized lifestyles. This shift mirrors a decisive move in consumer demand away from mere product accumulation towards preventive health, convenience, and lifestyle integration. By modernizing the brick-and-mortar experience into high-touch health destinations, landlords are capturing a level of patient-client inertia that static rows of inventory simply cannot generate.
Local centers are becoming an integral part of high-frequency rituals, creating dynamic community hubs people visit to invest in their longevity. From pickleball courts to IV drip bars, these wellness anchors are ‘internet-proof’ in execution, yet internet-fueled in demand. While a Botox injection or a Pilates class cannot be downloaded, they are increasingly discovered, vetted, and sold through a digital lens. This creates a unique paradox. The modern strip center has become the physical stage for a social-media-driven lifestyle, where ‘Instagrammable’ clinical interiors and influencerbacked branding are now among the primary engines of foot traffic.
The result? A retail landscape definitively built around how consumers live, not just how they shop.


While the 2020 pandemic initially froze physical commerce, it unequivocally became the catalyst for the “retailization” of healthcare, exposing the vulnerability of product-heavy storefronts while pushing personal health to the center of consumer life. CoStar reports that, for the first time on record, service-oriented tenants led by med spas, fitness studios, and specialized clinics have surpassed goods-based retailers in total leasing activity, accounting for more than 50% of new retail demand in 2025, up from sub-40% levels before the pandemic.
What began as a convenience play resulted in a structural shift. The old big-box formula is being rewritten in real time, not by more merchandise, but by movement, maintenance, and repeat use. Fitness and wellness openings now drive nearly 30% of all service-based leases, while the medical spa industry has seen an estimated 70% increase in new business starts in comparison to pre-pandemic levels, according to CoStar. Health-related tenants now occupy roughly 20% of traditional retail square footage, effectively doubling their presence over the last decade.

Behind this spatial reset is a consumer who spends heavily and views wellness as a necessary luxury rather than a one-off indulgence. According to McKinsey & Company’s The Future of Wellness Trends 2025 Survey, while Gen Z and Millennials make up just 36% of the adult population, they drive more than 41% of the nearly $500 billion spent annually on health and self-optimization.
More than 80% of U.S. consumers now rank wellness as a top priority, creating massive, crossgenerational demand for wellness-driven social spaces. This isn’t just a generational bubble; it’s a total market takeover. The fundamental rewrite of the American lifestyle blueprint has pushed the health and wellness market towards a staggering $6.82 trillion valuation in 2025, with projections set to reach $10.36 trillion by 2030, according to Research and Markets’ 2026 Health and Wellness Market Report.

The market is witnessing the death of chore-based shopping trips and the birth of high-performance rituals. Post-COVID, consumers have prioritized wellness routines over one-off shopping trips.
Source: Placer.ai
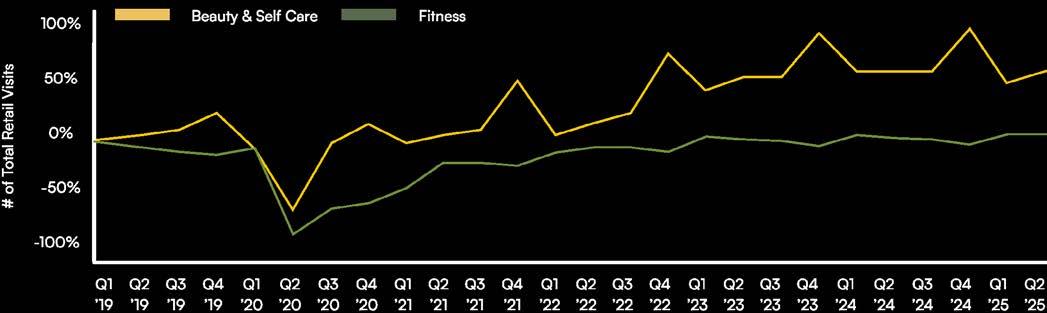
In major Sunbelt metros and coastal hubs, wellness has become the primary thread of the social fabric. The American third space is moving away from alcohol-centric nightlife, as recent Gallup data shows U.S. alcohol consumption has hit a 90-year low. Currently, only 54% of adults report drinking, down 13% since 2022. Driven by high costs and a categorical move toward health-consciousness, Gen Z is trading the bar stool for the cold plunge.
As Gen Z ditches the cocktail as their go-to social kryptonite, medtail is stepping up to fill the gap. The sweat-and-social economy is providing the community connection that bars once offered, as Custom Market Insights reports the U.S. health and fitness club market was valued at $45.8B in 2025 and is expected to grow to $71.5B by 2035.
More importantly, frequency is holding, and the appetite for this lifestyle is only sharpening. Nearly half of fitness chain customers, who visit four or more times a week, now treat gyms like self-care commitments, not drop-ins, with luxury fitness chain Life Time leading at 50% peaks. This drives sustained traffic that landlords underwrite with confidence.
These are not one-time visits or seasonal spikes. They reflect consistent, repeat engagement, reinforcing the idea that wellness is no longer occasional but built into routine.
But this isn’t just about fitness; it’s about shared rituals and members-only wellness clubs that serve as destination anchors. When a center lands a social-forward wellness tenant, it doesn’t just gain a lease; it gains a brand identity that defines the entire asset. That demand is no longer limited to coastal gateways. Luxury fitness brands are increasingly targeting middle-markets, where residents expect city-tier amenities, programming, and design in their local clubs.
Fitness Fuels Frequency
Source: Placer.ai | January 2024 through July 2025
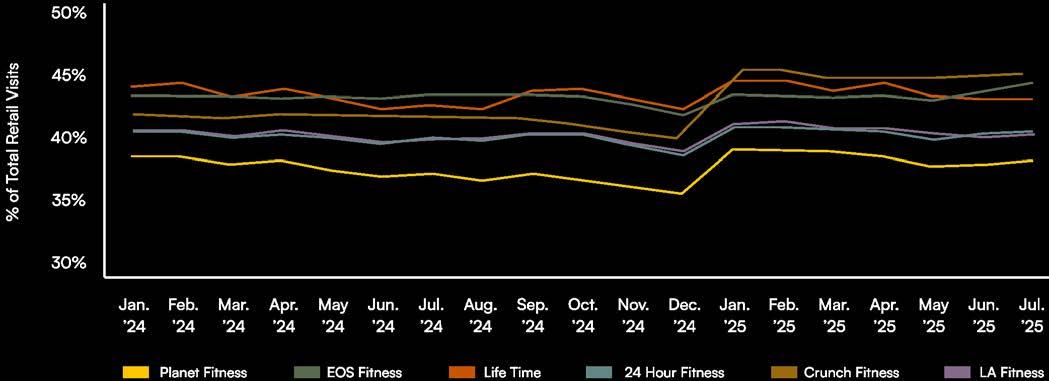


Fitness isn’t the only catalyst; it’s an overarching shift towards aesthetic-forward wellness spaces where injectables, IV therapy, and recovery tech like red-light and infrared panels have become part of the monthly ritual.
High-end med spas are increasingly positioning themselves as members-only wellness labs, where clients are not simply booking treatments but committing to quarterly correction plans, monthly IV drips, and weekly red-light sessions designed to optimize energy, sleep, and recovery.
And that demand is no longer confined to urban dermatology hubs. Luxury med spa brands are expanding into middle markets, where consumers increasingly expect non-invasive aesthetics technology, clinical-grade results, and boutique-spa ambiance in their local clinics.
This medical-lifestyle hybrid is no longer exclusive to the one percent. As consumers shift from buying products to buying outcomes, shopping centers are pivoting from a place to buy to a place to become.
U.S. Medical Spa Market Size & Projections
Source: Precedence Research
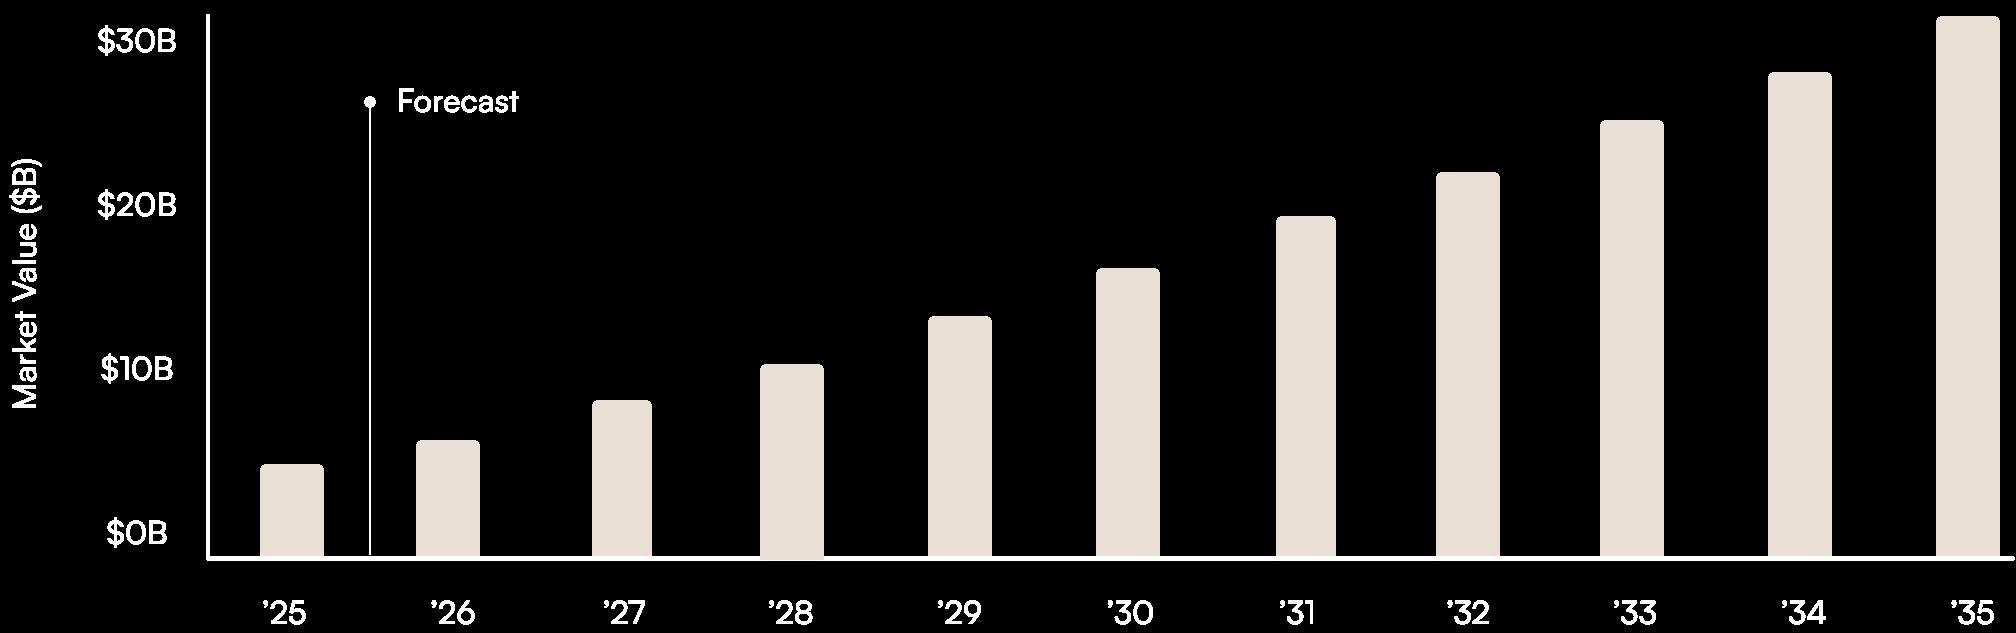
The ideal tenant profile is getting a facelift. Landlords are no longer just collecting rent; they’re curating longevity hubs built on high-margin, physical-start services that cannot be replicated by a browser tab.

They offer an experience physically tethered to the real estate, but sharpened by digital convenience. The traits that once made a retailer desirable, such as massive inventories and seasonal collections, now include a health halo anchored in contractual consistency. By prioritizing services that require physical presence and repeat visits, landlords are trading the volatility of discretionary shopping for the stability of routine-based spending.
The traffic story changes with it. It shifts from something landlords hope for to something that shows up on a schedule. A Botox appointment is booked. A Pilates class is reserved. An IV drip is added to the weekly routine. These are not casual visits. They are recurring demands, generally reinforced by memberships, deposits, and cancellation policies that increase follow-through and, in turn, make NOI more predictable.
That durability is being amplified by a landlordfriendly supply imbalance. CoStar reports national retail construction remains at a multi-cycle low of about 52 million square feet, while leasing activity is dominated by smaller spaces, with nearly 90% of leases signed in spaces under 5,000 square feet. In that environment, high-quality space is moving fast, with a median time-to-lease of just 7.2 months.
And the payoff does not stop at the front desk. According to ICSC, 63% of visitors to medical and wellness facilities cross-shop with neighboring
tenants on the same trip. This creates a powerful synergy, turning a single tenant into a traffic driver for the rest of the center. Because wellness traffic often peaks during mid-morning or early afternoon, these tenants effectively fill the slow hours, sending steady, high-intent foot traffic toward nearby cafes, boutiques, and service providers.
There is a defensive quality to that demand, too. McKinsey & Company found consumers are more likely to cut spending on clothing, entertainment, and home decor first in a downturn, while wellness outpaces apparel and home goods in budget resilience. Physical experiences like spas and studios hold significantly stronger than digital supplements or apps, as consumers treat fitness and recovery as vital as groceries. While this self-care buffer does not make wellness recession-proof, it provides a level of stability that categories built on impulse, novelty, or one-time transactions simply cannot match. For landlords, that matters. It means demand will hold up better when the broader market starts to wobble.
Source: Athletech News, Betway Insider
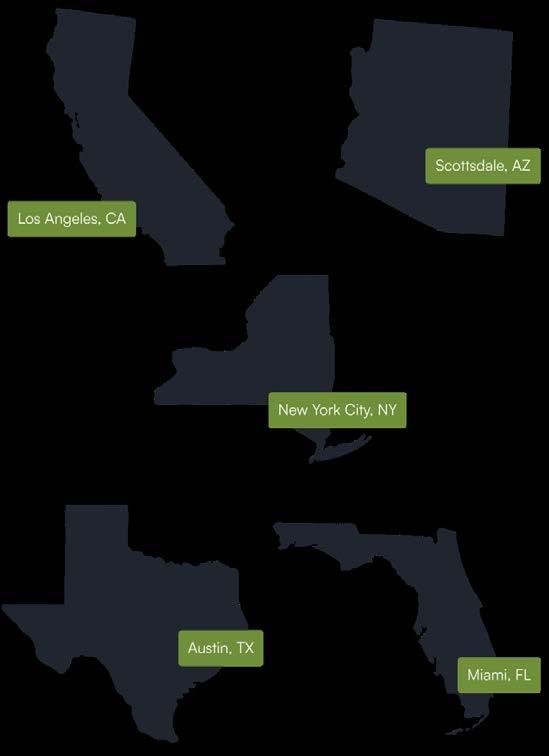

In a retail environment haunted by e-commerce erosion, health and wellness tenants offer a new edge, operating under their own set of rules. The traditional retail playbook was reshaped by the demands of a digital-first world, and COVID-19 only accelerated that evolution.
But medtail? Born into a digitally native marketplace, it has effectively broken the fourth wall. Curated experiences are designed as much for the camera as they are for the client. This dynamic is powerful and has become central to the economic model. As Gen Z consumers are the primary drivers of health and
wellness, they dually shape how these services are marketed and monetized. Sprout Social’s 2025 Pulse Survey found that over 60% of Gen Z discover and vet new brands largely through social content and influencer recommendations, turning the feed into a de facto directory for wellness experiences.
In a category built on visible outcomes, better recovery and improved energy, social media functions as both proof and promotion. Before a client even steps into a space, they have already seen the results, the interiors, and the brand identity through a curated digital lens.


That has fundamentally changed the marketing playbook. Conventional advertising is evolving to influencer-driven discovery, creator partnerships, and location-based visibility, turning a single treatment room into a high-performing acquisition tool. A cold plunge suite, a red-light room, or a sleek injectables bar is no longer just a backdrop for service delivery. It is part of the sales funnel.
In a sense, “Instagrammable” interiors are not aesthetic fluff. They are strategic infrastructure. Well-lit treatment rooms, branded mirrors, custom signage, and highly curated waiting areas are designed to travel beyond the four walls of a space, extending a location’s reach well beyond its immediate trade area. The same is true for brand collaborations and influencer content.
When a creator tags a med spa, recovery studio, or wellness club, the location gains more than visibility. It gains borrowed trust, cultural relevance, and a direct line to a consumer already primed to convert. Foot traffic increasingly follows the feed.
The result is a self-reinforcing loop. Content drives awareness. Awareness drives bookings. Bookings generate more content. And that content feeds directly back into demand. In today’s wellness economy, visibility is not just a byproduct of success. It is part of the product.
This fundamental reorganization of the retail hierarchy forces the surrounding ecosystem to evolve, prioritizing high-frequency lifestyle integration over simple commodity accumulation.
By shifting the focus toward high-frequency lifestyle needs, landlords are creating a ripple effect. Placer.ai reports that wellness anchors typically sustain foot traffic more than 20% above traditional retail averages. The payoff is immediate. More visitors. Longer stays. Stronger spillover. It changes the gravity of every surrounding lease, turning a collection of independent shops into a synchronized lifestyle hub.
This evolution also creates new opportunities for centers willing to rethink co-tenancy, parking ratios, and buildout requirements. Traditional retail centers were often designed around apparel-centric tenant mixes, with parking ratios and circulation patterns optimized for weekend shoppers carrying bags.
Wellness and experience-focused tenants, by contrast, tend to draw mid-week, appointment-based visitation, which shifts peak traffic patterns but can also support higher, more consistent foot traffic across the week. As a result, many owners are updating parking allocation and valet or drop-off capabilities to better serve appointment-driven, service-oriented tenants.
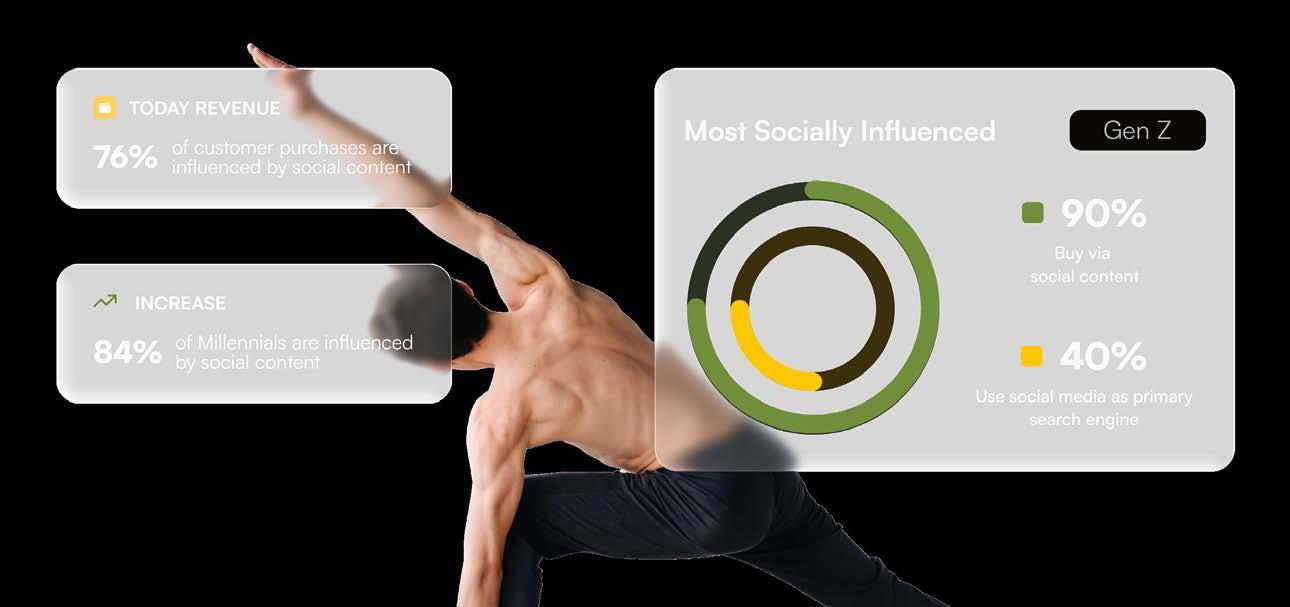
Source: Sprout Social | Q2

If the early appeal of wellness tenancy is foot traffic, the longer-term case is lease durability, which becomes clearest in the buildout itself.
Many wellness, fitness, and healthcare users come with serious upfront investment, from specialized plumbing and treatment rooms to medical-grade systems and customized interiors. These are highbarrier concepts on both ends. They are expensive to open and even harder to move. Once a location is established, relocation becomes costly, disruptive, and often impractical. In effect, landlords are not just securing a tenant. They are locking in tenant capital and client relationships built for long-term valuation.
That staying power only grows once the customer relationship is in place. A traditional retailer may need to win the shopper back with every visit. A med spa, clinic, or boutique fitness operator builds around habit, continuity, and trust. Once that rhythm is established, moving is no longer just a real estate decision. It risks breaking routine, sacrificing convenience, and disrupting a client base built carefully over time.
From an investment standpoint, that can translate into stronger renewal odds, lower rollover risk, and a cash flow profile that is easier to underwrite than traditional discretionary retail. It also helps explain why end caps and outparcels are drawing more interest from these users. Accessibility, signage, and ease of arrival are not just perks. They are part of the operating model.
Still, not every wellness concept deserves the same underwriting. Unit growth has to stay in step with local demand, especially in categories that depend on repeat use. More medicalized concepts bring regulatory and reimbursement considerations that traditional retail rarely faces. And centers that lean too heavily on a single wellness niche can create concentration risk if that segment cools or becomes oversupplied.
The opportunity is real, but it is not automatic. The strongest investments will come from owners and operators who can distinguish broad wellness demand and durable unit economics, then build the lease structure, layout, and tenant mix to protect both.


Consumers are prioritizing health, longevity, and appearance. Retail is simply following suit. The strip center is no longer just a place to pick things up. It is becoming a place to keep things up.
Wellness integration is not a passing theme. It is a signal of where expectations are heading and which assets are flexible enough to meet them.

For landlords and developers, this isn’t just a trend in consumer behavior; it’s a redefinition of the retail asset itself. The broader takeaway is that tenant mix is no longer just about retail vs. non-retail, but about the type of retail and the role it plays within the center.
As wellness-centric spaces are integrated into everyday life, the most competitive centers will be those that deliberately curate a tenant mix capable of fulfilling both functional needs and emotional wants. These experience-driven formats offer convenience, leisure, and wellness in a single, cohesive environment. Far from signaling the decline of traditional retail, this shift underscores the opportunity to evolve centers into higher-value, experience-anchored destinations that are better aligned with how consumers live, work, and recover today.

Michael Pakravan michael.pakravan@matthews.com (310) 919-5737
Kyle Pari
kyle.pari@matthews.com (512) 535-0295















































Vacancy tells one story. The next tenant tells another.
Shock-worthy news cycles have reduced the national retail landscape to a collection of volatile narratives. This retail apocalypse rhetoric now serves as a convenient catch-all for every national bankruptcy, strategic downsizing, or store closure that makes headlines. If you only skim the surface, it’s easy to conclude that the sector is in steady retreat. But, behind every going-out-of-business banner, there’s often a coming soon sign just waiting to go up.
Recent CoStar analysis shows national retail asking rents increased 2.2% quarter-over-quarter to $25.95 per square foot, while availability fell to 4.8% in Q1 2026. What looks like a contraction is not necessarily a decline, but rather an architectural refinement.
Closures aren’t an end state; they’re a starting line.
While bankruptcies and store closures create real disruption, they open the door to a highly active backfill market that is selectively improving the quality of retail space and opening a window of investment opportunity.
The current wave of store closures is less ‘apocalyptic’ and more of a necessary clearing of the underbrush. Retailers are facing multidimensional marginal compression. Labor shortages, limited inventory, surging insurance premiums, and occupancy costs have risen 20% since 2020, according to CoStar. The rise of e-commerce sales have only amplified these pressures.
As a result, chains that overexpanded during the cheap capital era between 2015 and 2021 have been forced to consolidate their physical footprint. And consumers are seeing the repercussions play out in real time.
High-profile Chapter 11 filings and total liquidation often dominate the narrative. While these represent true distress, they serve a broader market function. These bankruptcies act as a catalyst, providing a window of rationalization for even the healthiest national operators to shed underperforming locations and optimize their portfolios.












Strategic consolidation allows disciplined retailers to pivot away from legacy footprints and toward a flight to productivity. This isn’t just about exiting bad stores; it’s about reallocating capital into top-performing, high-traffic centers within strong demographic corridors. Ironically, the very bankruptcies causing headlines are providing the premium second-generation space these healthy brands need to expand selectively. Recent CoStar analysis reveals move-outs normalized sharply in late 2025, with store-closure announcements falling by 45% as the pipeline of previously announced exits emptied. While closure activity tapered, leasing activity climbed to pre-pandemic highs. Highquality space is now moving at a blistering pace as the median time-to-lease fell to a record-low of 7.2 months in 2025.
This leasing speed is the byproduct of a definitive flight to productivity, as retailers ditch growthat-any-cost models for a surgical focus on asset performance. Expansion-minded brands are doubling down on top units with the highest salesper-square-foot, prioritizing grocery-anchored neighborhood centers and dominant power centers for their high foot traffic and omnichannel synergy.
The implication for property owners is a stark bifurcation of quality; while weaker, tertiary locations are being exposed and shed faster than ever, a vacant box in a prime corridor is no longer a sign of distress. Instead, these vacancies represent rare, premium inventory that the market is ready to claim, subsidize, and upgrade for a more productive future.
While national fundamentals remain robust, tenant transitions can still create short-term pressure at the property level. When an anchor goes dark, the effects often reach beyond the storefront. Vacancy may look temporary on paper, but the carrying costs compound quickly.
Co-tenancy clauses kick in, inline tenants push for rent relief, and some use the disruption as an opportunity to leave altogether. Foot traffic can fall 15% to 30% during dark periods, as shoppers respond quickly to an incomplete tenant mix. Even when the center’s fundamentals remain intact, perception drags on, according to CoStar.
The national backfill story is active, however junior anchors and big-box space can accumulate vacancy for 6 to 12 months before they are filled. Meanwhile, owners are left to absorb full carry costs with taxes up 8% and insurance up 25% from 2023, while marketing vacated space. Second-gen premium space absorbs faster, but big-box voids linger.
Buildout costs are rising as well, with allowances now averaging $45 per-square-foot, up 25% since 2023, as incoming tenants demand cleaner layouts, better infrastructure, and more customized space. Deals that once moved briskly now stretch another 45 to 60 days as landlords negotiate free rent, tenant improvement packages, and operating-cost concessions just to get leases across the finish line.
Still, that friction is increasingly a sign of competition, not collapse. In many cases, the very tenants pushing hardest at the negotiating table, such as fitness users, quick-service restaurants, and other high-traffic service concepts, are also the ones driving more than half of leasing activity in 2025. For well-located centers, temporary distress is often the price of landing a more productive tenant mix.

The answer lies in four distinct categories of tenants that are selectively reshaping the retail landscape.
These players are scaling up by leveraging their local agility to claim prime locations previously out of reach, often displacing national laggards. By focusing on high-growth submarkets and specific community needs, they provide landlords with a more authentic, localized tenant mix that drives consistent daily traffic.
Value-oriented and essential retail powerhouses are aggressively claiming backfilled anchor positions.
Demand is not abstract. It is showing up in full force, driven by a diverse set of tenants competing for the same limited pool of quality space. As new retail development remains at multi-decade lows, expanding brands are forced to focus exclusively on second-generation space. This shortage of available prime inventory, particularly well-located junior anchors and high-visibility inline space, has shifted leverage back to landlords in top-tier assets.
As sublet activity hits a 3.6% peak, the backfill engine is shifting into high gear, allowing premium brands to displace legacy laggards in topperforming corridors.
Source: Matthews™ Research, CoStar Group, Inc.

The line between the retail and service economies continues to blur. Landlords are increasingly remerchandising centers by replacing struggling goodsbased merchants with “sticky” service users that drive consistent daily traffic.
The physical storefront is becoming a “phygital” bridge for Digitally Native Vertical Brands (DNVBs). Concepts like Warby Parker, Glossier, and Allbirds previously priced out of prime locations, and they are now entering physical retail to serve as experience centers for brand storytelling.
This cycle of creative leveling is culminating in a profound shift in retail formats. Merchants are increasingly adopting smaller, more efficient footprints that prioritize sales productivity over sheer volume. By integrating omnichannel strategies, brickand-mortar retail now functions as a vital fulfillment hub, making site selection for buy online, pick up in store models a functional necessity rather than a luxury.
The market is choosing quality over quantity.
Inventory-heavy models are shifting towards experiential, engagement-driven spaces that increase consumer dwell time. In this new landscape, value is measured by a store’s ability to drive brand loyalty and digital sales. This shift presents a generational opportunity for landlords to remerchandise their centers. By replacing outdated, goods-based retailers with high-engagement tenants, owners can reset rents to current market peaks and curate a tenant mix that is better insulated against future digital disruption.
With tenant turnover accelerating, risk management has become a far more active discipline. Success is no longer just about filling space; it’s about underwriting the tenant, structuring the lease, and managing exposure across the rent roll.
Proactive owners are increasingly embracing shadow marketing, identifying and courting potential replacement tenants well before an existing lease expires. By maintaining a pipeline of backup operators, landlords can compress the gap between a move-out and a new opening, protecting both cash flow and co-tenancy stability.
Source: Matthews™ Research, CoStar Group, Inc.
Cap rates have stabilized at a five-year high of 7.3% as of Q1 2026, signaling that the market has fully priced in the higher interest rate environment and shifted investor focus toward the credit security of backfill tenants now occupying prime space.
A clear divergence of assets is emerging, creating a winner-takes-all dynamic for premium real estate. Outperforming centers are defined by strong demographic corridors, high-traffic grocery anchors, and a deep tilt toward necessity-based retail. These properties continue to command record rents and operate with near-zero vacancy.
Conversely, challenged assets in stagnant trade areas or tertiary markets face a more difficult path as retailers consolidate. For these properties, incremental leasing strategies no longer be enough. Meaningful capital reinvestment or full adaptive reuse are required to remain competitive and avoid long-term obsolescence.
Store closures create short-term disruption, but increasingly serve as the reset mechanism for longterm value creation. The current backfill cycle is one of the most competitive in recent history, giving owners a rare opportunity to upgrade both the credit and composition of their tenant base.
This is not a story of contraction. It is a story of selection.
The headlines may focus on what’s leaving, but the market is increasingly defined by what comes next. Investors who can navigate short-term friction in exchange for stronger credit, better tenancy, and more durable long-term cash flow will be best positioned to outperform.



Matthews™ Capital Markets (MCM) is a fully integrated and dedicated financing division of Matthews™, providing capital solutions ranging from $500,000 to $100 million for all property types across the U.S. Through long-standing lender relationships, we have the ability to customize and structure financing solutions that best suit our clients’ needs. From Funding to Close, Matthews™ Provides a One-Stop Shop



BY MERVAT BERRY
Leasing strategy is evolving. Where site selection once relied heavily on intuition, precedent, and relationships, today’s landscape demands a more analytical approach. The market has entered a new demand economy, where opportunities are defined less by available space and more by quantifiable consumer demand. Data is no longer a supporting tool, it is the foundation for both tenant expansion and landlord leasing strategies.
In this environment, tools like void analysis, mobility data, and consumer expenditure reports are essential. They provide insights into where demand exceeds supply, how people move and shop in a trade area, and which markets have the spending power to sustain new concepts across retail, food & beverage, and hospitality. Understanding and applying these tools can transform how leasing decisions are made, ensuring both tenants and landlords align their strategies with actual market opportunity. The result is more informed site selection, stronger tenant performance, and environments that are better matched to the communities they serve.
A demand-driven market flips the traditional approach on its head. Supply alone no longer dictates decisions; instead, consumer needs and spending patterns are the starting point. Tenants no longer enter markets simply because a space is available, and landlords no longer lease units based solely on occupancy targets. Instead, both sides are increasingly evaluating trade area demand, demographic trends, and spending behavior before committing to a location.


For tenants, this shift affects site selection strategy. Locations are now chosen where spending exceeds existing supply, reducing the risk of underperforming assets. For landlords, it transforms leasing strategy. Tenant mixes are curated intentionally, designed to meet actual demand, drive foot traffic, and maximize long-term asset performance. In this context, data is the enabling layer that makes these strategies precise and repeatable.
At the heart of a demand-driven approach is void analysis. This methodology measures unmet demand by comparing actual consumer spending against existing supply. Unlike traditional demographic snapshots, which offer only a static view of potential, void analysis identifies real opportunities, highlighting underserved categories and misaligned tenant mixes.
For example, a void analysis might reveal a market where spending on specialty fitness concepts is high, yet few options exist locally. Or it may show that a shopping center’s tenant mix fails to capture the cross-shopping potential of neighboring categories. More than a report, void analysis becomes a decision-making tool, guiding both where tenants expand and how landlords curate operators.
The leasing advisor’s role has evolved from locating space to identifying underserved spending power.




U.S. retail sales growth during the 2025 holiday season apparel sales and +2.9% in-store spending growth
total retail vs. +1.8% foot traffic year-over-year
Source: Retail Dive

Understanding how consumers actually move within and between trade areas can redefine perceived boundaries. A site that seems isolated on paper may, in practice, sit along a high-traffic corridor, while a “prime” location may see less real engagement than assumed. Mobility data validates site selection and provides a more nuanced picture of potential customer flow.
Income alone is not a reliable measure of opportunity. Expenditure data reveals what consumers are truly spending and in which categories. Markets with high income but low discretionary spending are filtered out, while areas with strong spending alignment emerge as highopportunity zones.
Individually, each data source is useful. Together, they create a multi-dimensional view of market demand, enabling smarter, evidence-based decisions.
Void analysis provides a starting point, but mobility data reveals how people actually move within trade areas. Fresh format grocery stores saw double-digit year-overyear increases in foot traffic across 2025, with gains of 10.5% in Q3 and 10.9% in Q4.
Source: Placer.ai
The applications of a demand-driven, datainformed approach differ slightly for tenants and landlords but share the same principle: align supply with real demand.
For tenants, this means selecting sites where unmet demand is highest, reducing speculative risk and prioritizing expansion in areas likely to deliver performance. For landlords, it means optimizing tenant mixes. Instead of filling vacancies with whoever is available, landlords can curate operators that complement existing offerings, fill gaps, and drive overall traffic, enhancing both revenue and asset stability.
Consider a regional market in the Southeast. Void analysis revealed significant unmet demand in specialty food and fitness categories, suggesting that local consumers were spending in these areas but likely traveling outside the trade area to do so. Mobility insights highlighted high-traffic corridors that had previously been underestimated, while expenditure data confirmed that nearby households had strong discretionary spending within these categories.
Taken together, these insights provided a clearer picture of where demand truly existed and how consumers were interacting with the surrounding landscape. Rather than relying on assumptions about where new concepts should be located, the landlord was able to focus on areas where both spending and traffic patterns supported additional supply.
Source: ICSC
Service-oriented operators such as salons, wellness providers, tutoring centers, and pet services generate consistent, repeat visits
Appointment-based businesses increase dwell time and encourage cross-shopping
Many service tenants succeed in secondary locations, helping optimize space while maintaining strong traffic

Armed with this information, the landlord curated a tenant mix centered around specialty food and fitness operators that aligned with the demonstrated demand. The result was stronger foot traffic, improved sales productivity, and greater long-term occupancy stability. The example highlights how combining multiple datasets can turn market insights into practical leasing decisions.
The broader implications for the industry are clear. Data-driven leasing strategies are quickly becoming the standard rather than the exception. As access to mobility data, consumer spending insights, and gap analysis has expanded, both landlords and tenants are better equipped to evaluate where opportunities truly exist.
This shift is gradually changing how leasing decisions are made. Instead of reacting to vacancies or expanding based on precedent, market participants are placing greater emphasis on understanding demand before committing to a location. Landlords are thinking more carefully about tenant mix and how different uses complement one another, while tenants are prioritizing markets where spending patterns suggest long-term viability.
In this environment, the advantage belongs to those who can move beyond simply collecting information and focus on applying it effectively. Understanding consumer demand, spending behavior, and movement patterns is no longer just helpful, it is increasingly necessary to remain competitive.
The shift from intuition-based decisions toward evidence-based strategies is likely to continue. As data becomes more accessible and analytical tools become more sophisticated, tenants and landlords will have greater visibility into how consumers shop, move, and spend within a given trade area.
Demand-driven leasing provides a more durable framework because it aligns supply with actual consumer behavior. When leasing strategies are grounded in measurable demand, both tenants and landlords can reduce risk and position their properties for more consistent performance.
While the tools will continue to evolve, the underlying principle remains the same: successful environments are built around understanding what consumers want, where they are spending, and how they move through a market.