Orange County, CA
Key Findings
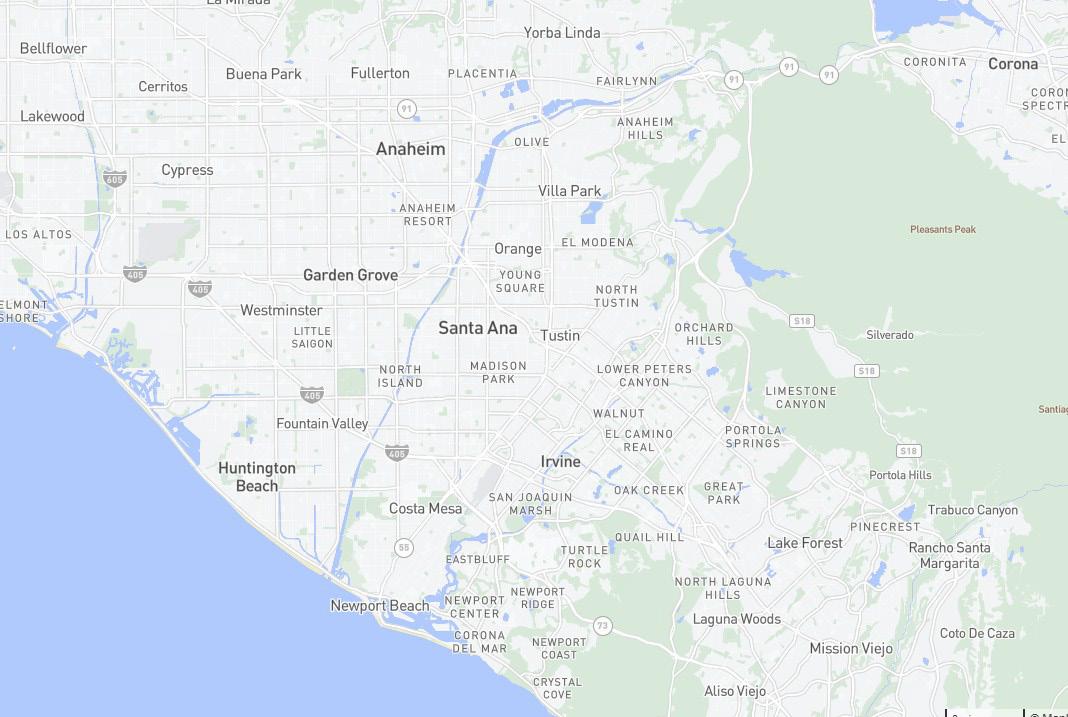
Orange County's industrial sector remains one of the tighter industrial markets across the country, supported by limited new supply and high barriers to entry.
Development remains modest overall, expanding inventory by only 0.7%, as Orange County remains one of the most supply-constrained infill markets nationwide
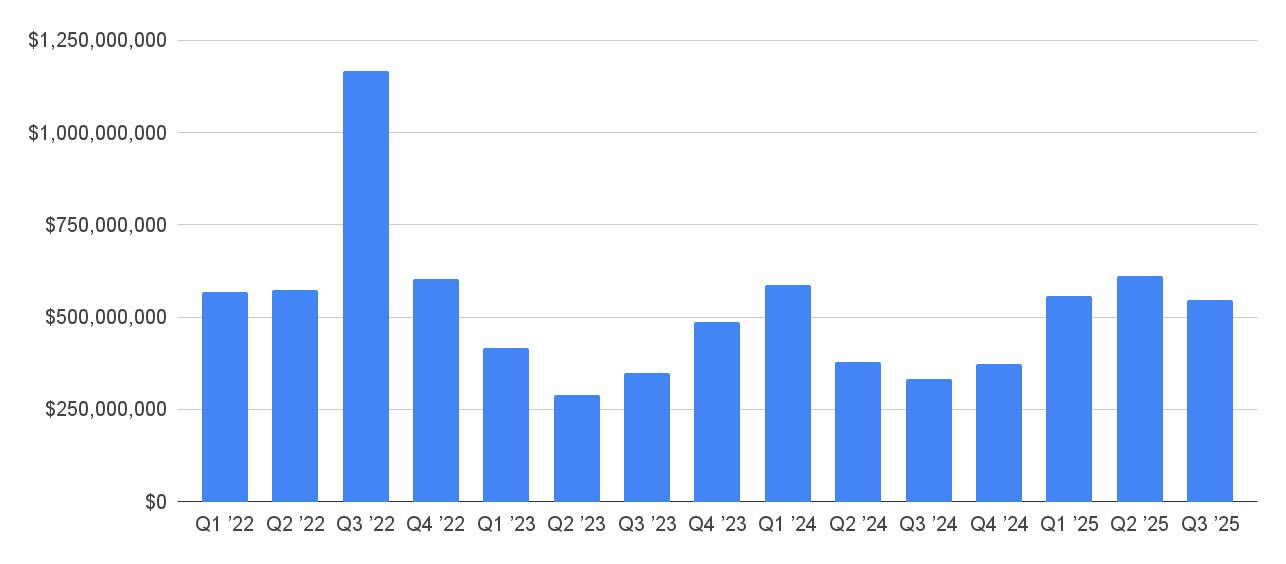
Sales activity across Orange County totaled over $1 billion for the first three quarters of 2025, with institutional buyers and REITs accounting for the majority of deals.
By the Numbers
Source: CoStar Group, Inc.
$545M

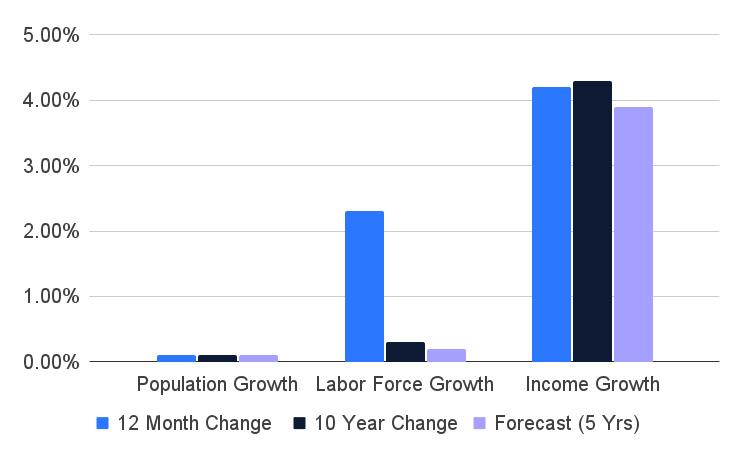
Orange County’s economy continues on a modest growth path, despite lagging behind national employment trends. Employment levels across the metro are about 1% above pre-pandemic figures, compared with national gains exceeding 5%. A limited labor supply has further constrained expansion, keeping unemployment around 5%, indicating a relatively tight job market. The metro's economic base is diverse, led by professional and business services, along with leisure and hospitality. Major employers include The Walt Disney Company and the University of California, Irvine, which drives innovation through partnerships with biotech and medical firms.
Orange County Demographics
Source: CoStar Group, Inc.
Top Tenant Leases
Source: CoStar Group, Inc.
Population, Labor, and Income Growth
Source: CoStar Group, Inc.
helping balance recent deliveries. Rent levels have declined about 10% from their peak but show signs of stabilization. Long-term prospects remain strong given Orange County's limited development pipeline and high barriers to new construction.
Performance by Class Sector
Source: CoStar Group, Inc.
Orange County Industrial Supply & Demand Dynamics
Source: CoStar Group, Inc.
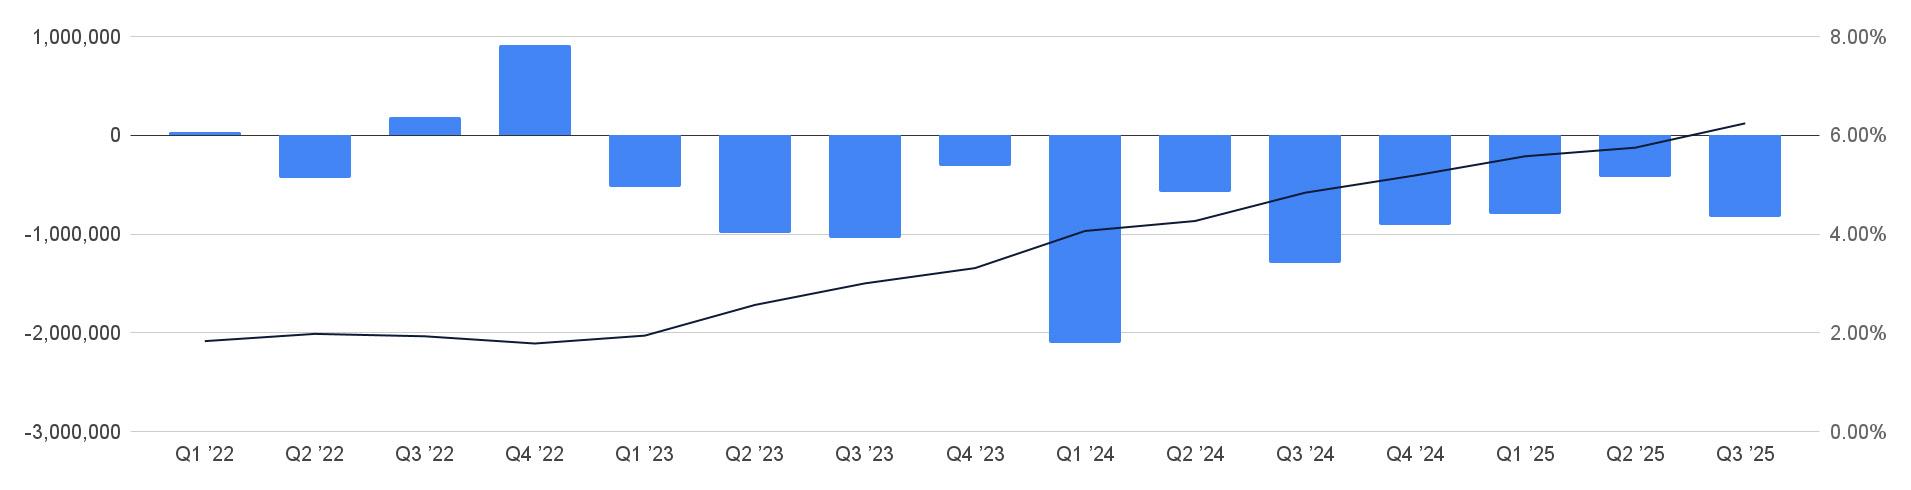
Absorption SF Vacancy
Under Construction Properties
Source: CoStar Group, Inc.
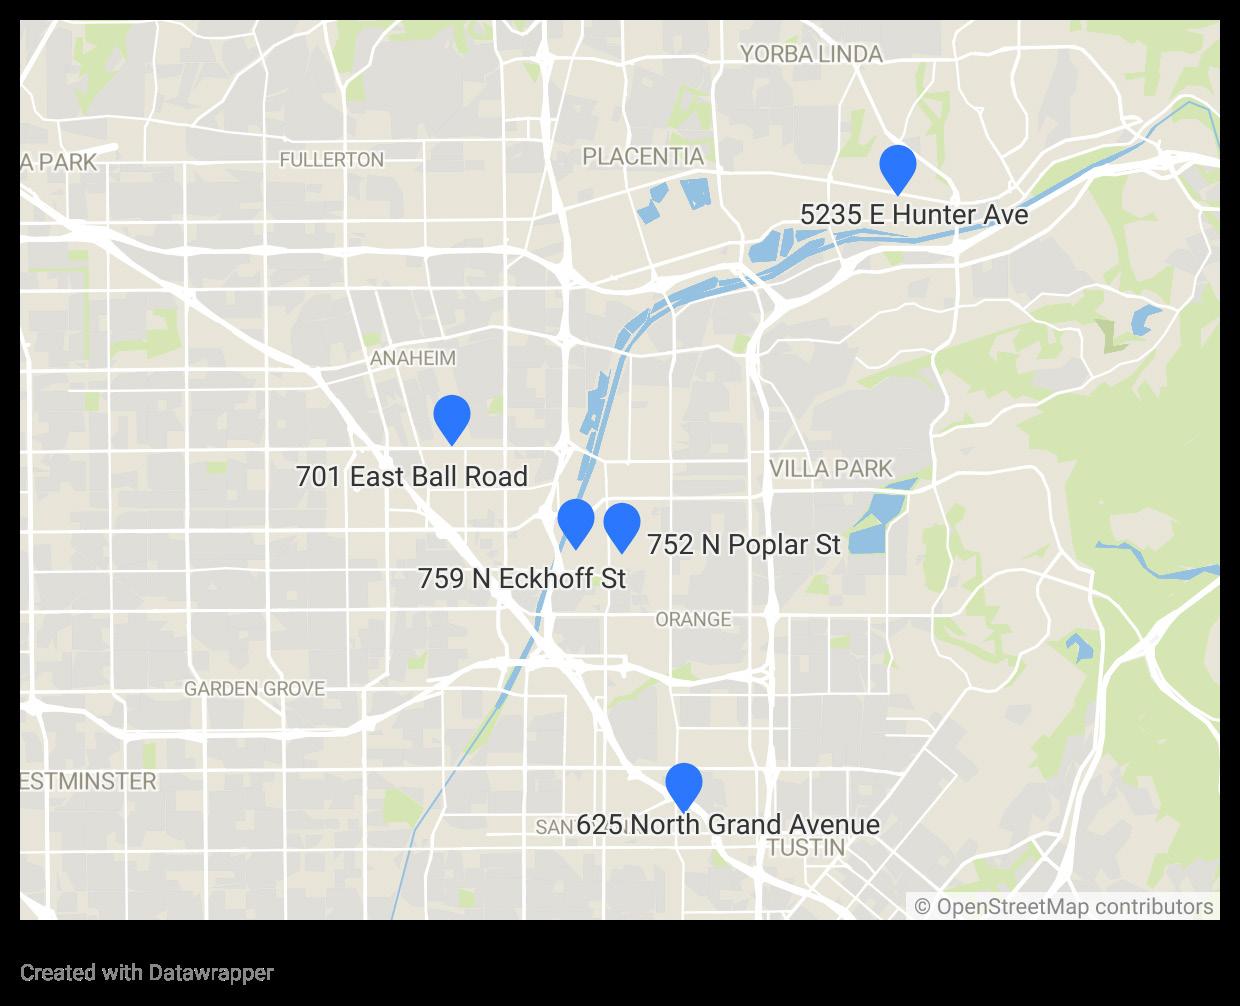
Top 10 Under Construction
Source: CoStar Group, Inc.
Date Oct. 2026
2025
2025
2025
2025
2025
2026
2027
2025
2025
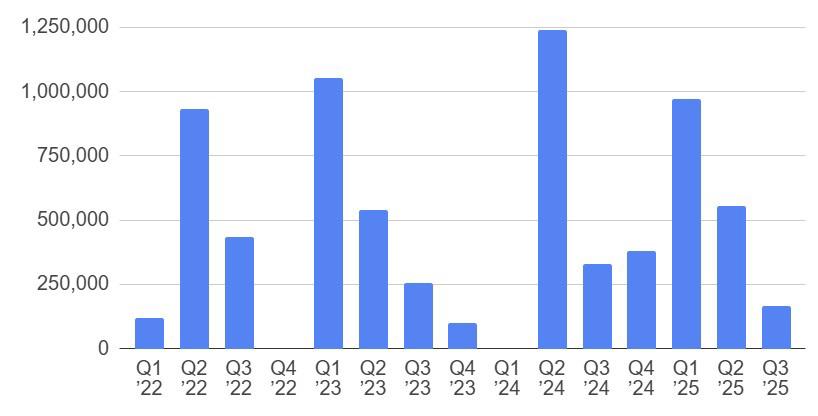
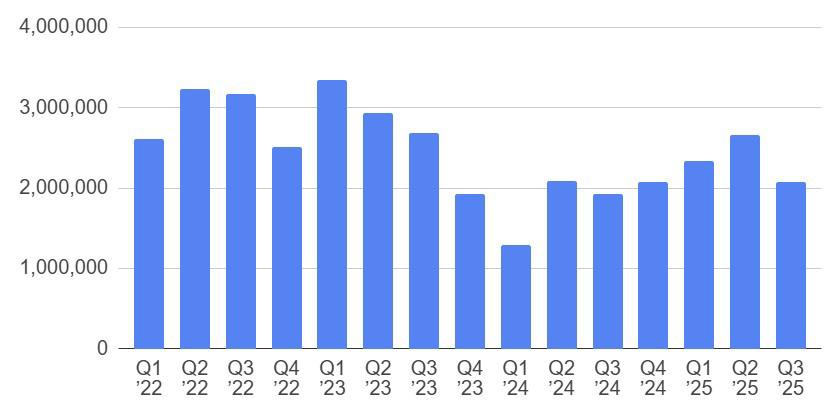
Industrial construction in Orange County remains elevated in 2025, with 2.1 million square feet underway, nearly matching 2023’s multi-decade high. Over 85% of incoming space remains available, adding pressure to vacancy as tenant demand softens. Developers continue breaking ground on entitled projects to avoid delays, though the active pipeline expands across 20 buildings. Despite limited land and strict development barriers, activity is concentrated in Irvine, Anaheim, and Santa Ana. Larger buildings over 100,000 square feet face slower leasing, prompting rent reductions, while smaller facilities under 100,000 square feet continue to lease more quickly.
Construction Starts (SF)
Source: CoStar Group, Inc.
Under Construction (SF)
Source: CoStar Group, Inc.
Investment activity in Orange County’s industrial market was robust in 2025, with third quarter sales volume reaching about $545 million, signaling renewed investor confidence. Buyers continue targeting properties leased at below-market rents for long-term upside. Institutional investors and REITs, including Rexford, Prologis, and Ares, dominate acquisitions, collectively accounting for over a third of total volume. Cap rates for major transactions typically range from the mid-5% to 6% range, reflecting strong pricing despite a 25% drop from peak levels in 2023. Liquidity remains high due to the market’s entry barriers, while pricing continues to stabilize amid improving investment sentiment.
Orange County Industrial Sales Activity
Source: CoStar Group, Inc.
Significant Sales
Source: CoStar Group, Inc.
Submarket Highlights
Source: CoStar Group, Inc.