Reproduction and communication for educational purposes
The Australian Copyright Act 1968 (the Act) allows a maximum of one chapter or 10% of the pages of this work, whichever is the greater, to be reproduced and/or communicated by any educational institution for its educational purposes provided that the educational institution (or the body that administers it) has given a remuneration notice to Copyright Agency Limited (CAL).
Reproduction and communication for other purposes
Except as permitted under the Act (for example, a fair dealing for the purposes of study, research, criticism or review), no part of this book may be reproduced, stored in a retrieval system, communicated or transmitted in any form or by any means without prior written permission. All inquiries should be made to the publisher.
For permission to use material from this text or product, please email hello@mathspace.com.au
Title: Mathspace VCE Foundation Mathematics Units 1 & 2
Print run 1 - January 2026
ISBN: 978-1-968666-48-4
Editors and lead authors: Erin Gallagher, Jeremy Hunter, Nazeel Ali, Katrina Du, Isha Tiwari
Writing and development team: Adam Humphreys, Ma Lourdes Ona, Sheramie Castillo, Regine Jara, Lesley Ann Lopez, Jady Amarillas, Marielle Belen, Macy Castillo, Christian Dinglasan, Adrian Doctolero, Dharent Fernandez, Dhave Fernandez, Albert Jara, Rona Josue, Jessa Lambinicio, Crystel Lontoc, Eric Malabag, Grace Manzano, Kyra Joy Manzano, Glady Mejias, Paul Platero
Images and design team: Scott Nolan, Chastine Marquez, Keith Gimeno, Jonathan Balignasay, Jasper Jumawan, Mary Matheu, Jemark Orevillo, Jessa Ortega
Measurement and space
Algebra and modelling
• Integers, fractions, and decimals provide a comprehensive system for representing and operating on quantities, utilising conventions like the order of operations and rounding to ensure accuracy and reasonableness in calculations.
• Ratios, rates, and percentages are fundamental tools of proportional reasoning that allow for the comparison of quantities, the standardisation of measures, and the calculation of relative change in practical and financial contexts.
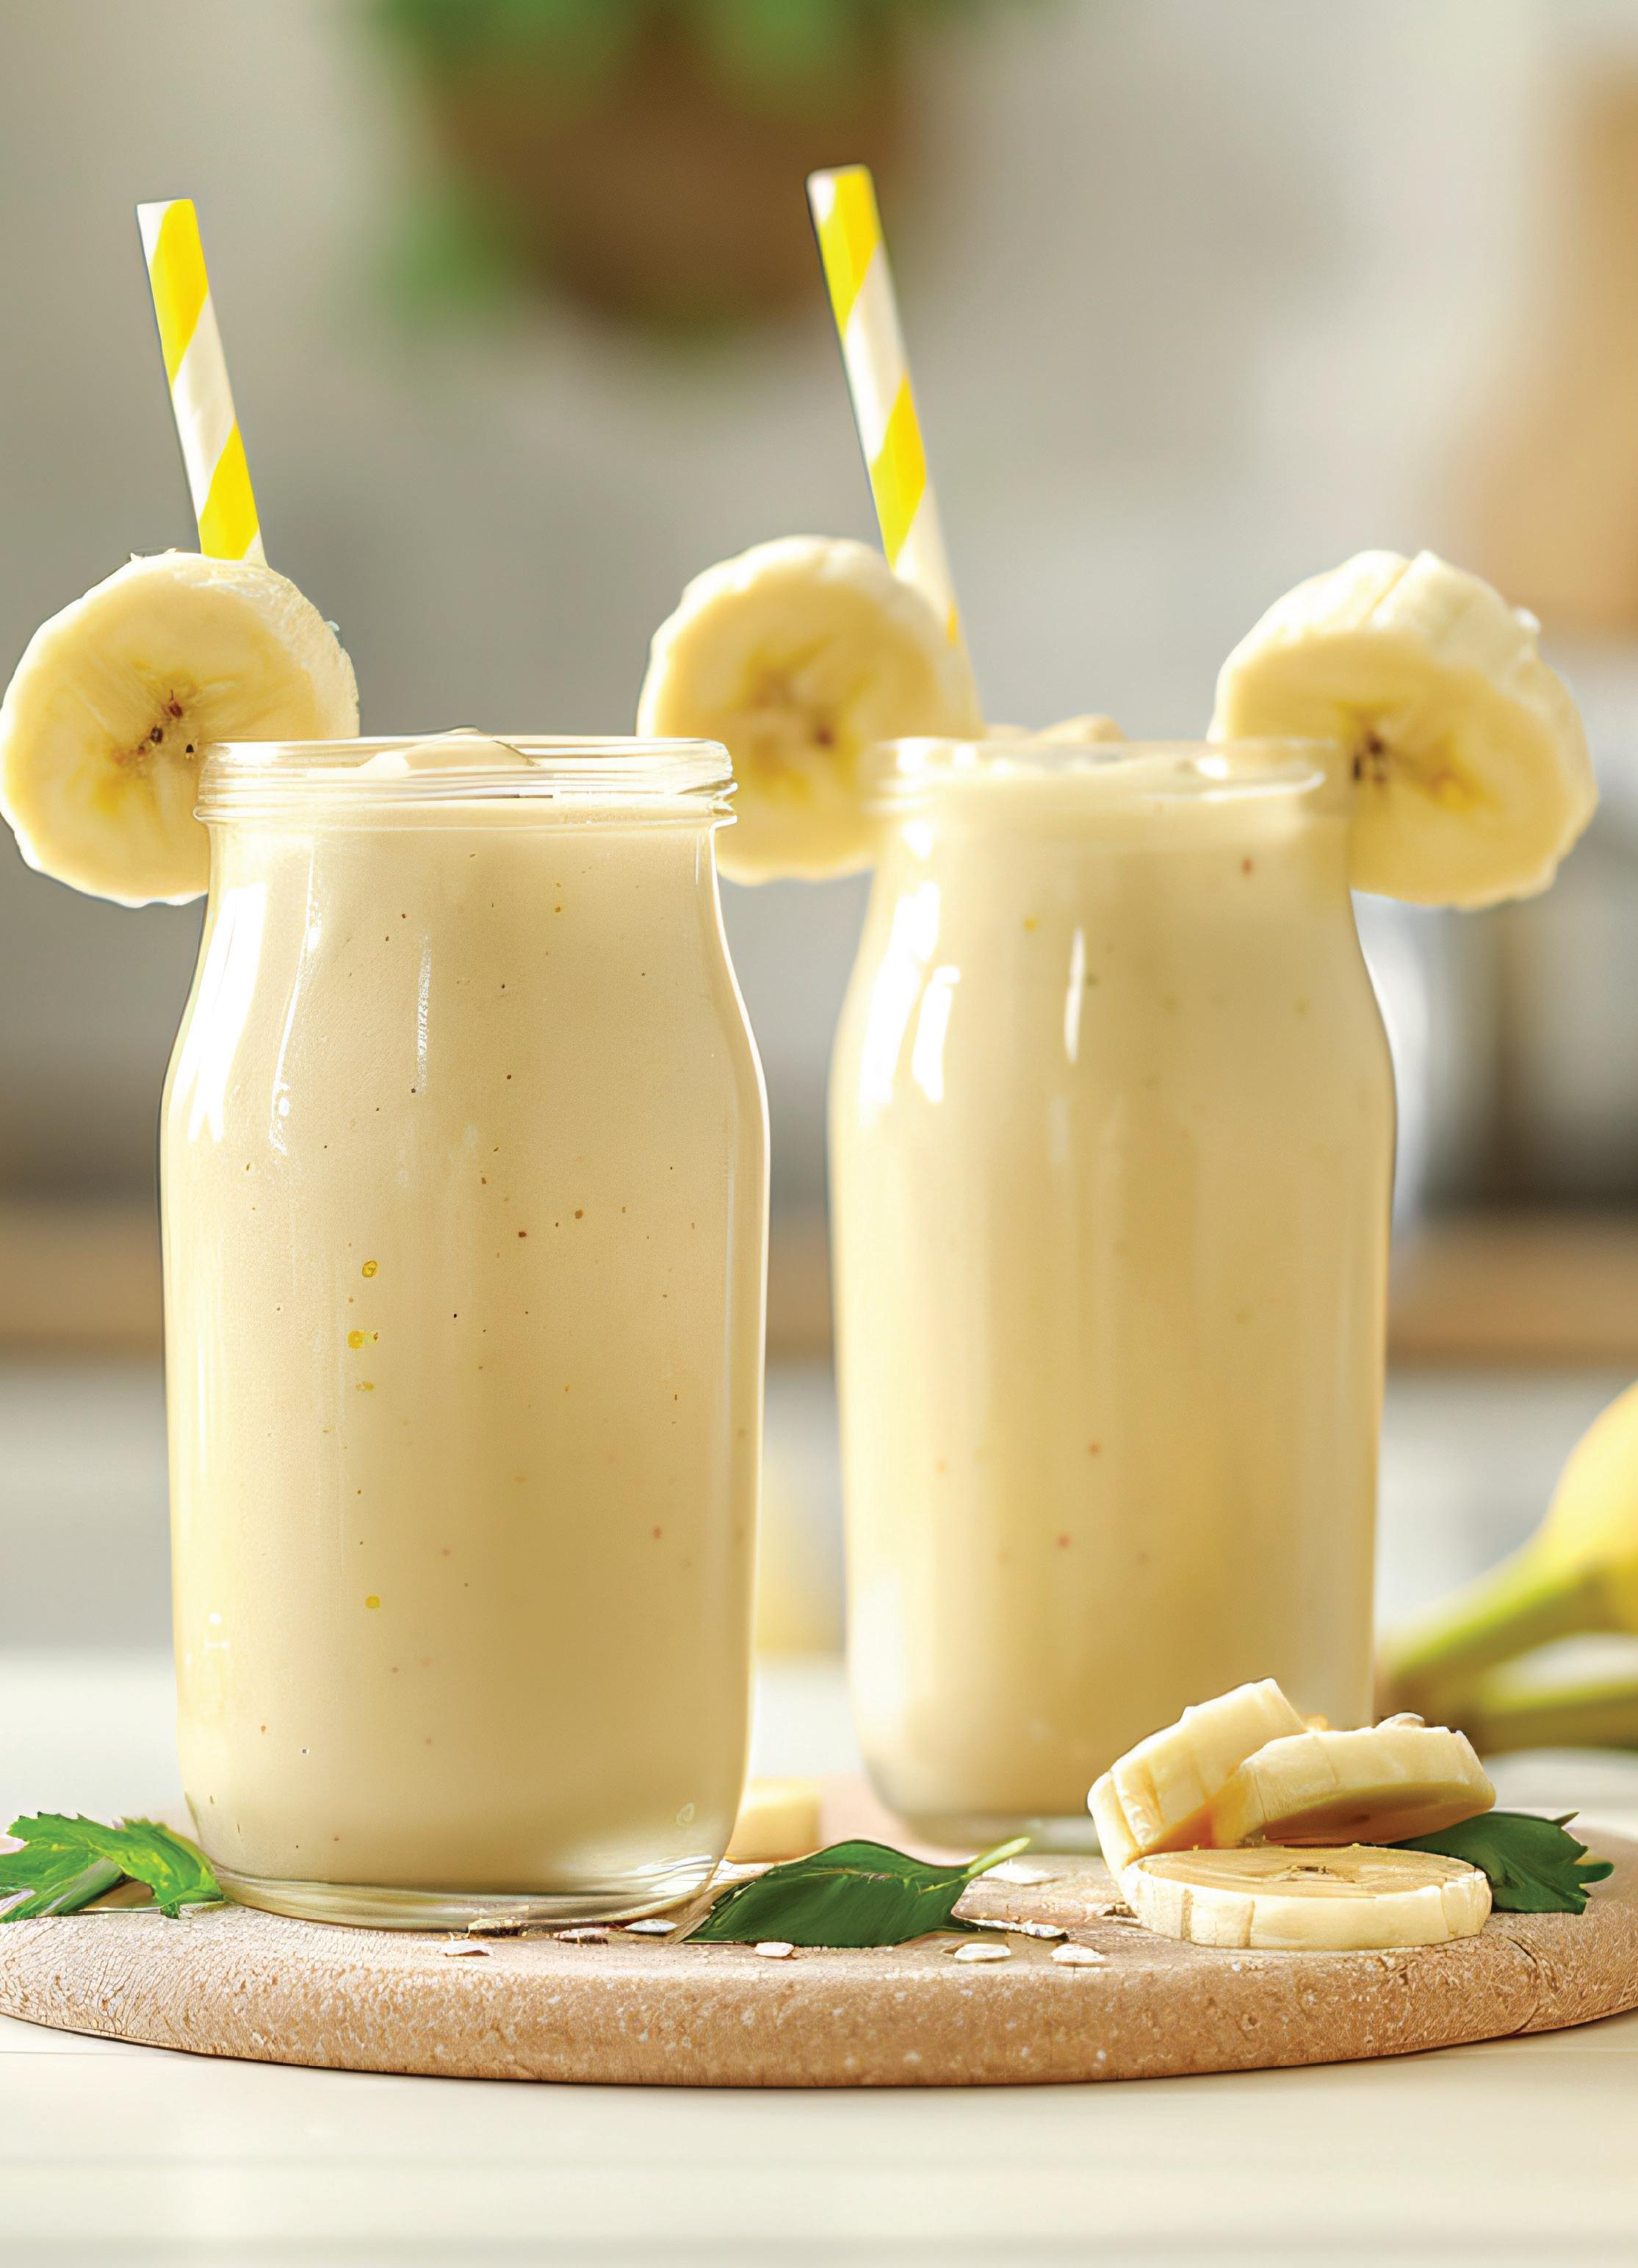
Smoothies are proportional thinking. If 2 bananas make 3 serves, then 5 bananas make 7.5 serves - scale it up, keep it balanced.
1.01 Integers
After this lesson, you will be able to…
• perform calculations involving integers using mental or by hand methods
• apply place value, rounding, and reasonableness checks to whole numbers
Add and subtract integers
Integers
The set of all positive and negative whole numbers, including zero. For example, 3, 2, 1, 0, 1, 2, 3 are all integers.
Adjacent signs
Two mathematical signs (+ or ) that are written next to each other in an expression, such as in 5 + ( 2).
Interactive exploration
Discover this concept in action online mathspace.co
When adding and subtracting integers, this can be thought of as moving along a number line. Adding a positive integer means moving to the right, and subtracting a positive integer means moving to the left.
Sometimes, an expression will have adjacent signs. The first sign is the operation (add or subtract), and the second sign indicates if the integer is positive or negative. These adjacent signs can be simplified into a single operation.
To combine adjacent signs:
• When the adjacent signs are the same (such as + and +, or and ), the single operation is addition.
• When the adjacent signs are different (such as + and , or and +), the single operation is subtraction.
Example 1
Evaluate:
a 9 + 12
Create a strategy
Use a number line to solve the expression.
Apply the idea
Start at 9.
To add 12, move 12 units to the right. This movement ends at 3.
Therefore, 9 + 12 = 3.
Reflect and check
The expression can also be rearranged to write it as a more familiar subtraction.
b 5 6 2
Create a strategy
Solve the expression by working from left to right on a number line.
Apply the idea
Start at 5.
To subtract 6, move 6 units to the left, which results in 11. From 11, to subtract 2, move another 2 units to the left to land on 13.
Evaluate the final subtraction
Example 2
Evaluate:
a 11 + ( 5)
Create a strategy
First, combine the adjacent signs to simplify the expression.
Apply the idea
The adjacent signs (+ and ) are different; therefore, the operation becomes subtraction.
11 + ( 5) = 11 5
Combine the adjacent signs = 6
Evaluate
b 10 + 4 ( 6)
Create a strategy
First, combine the adjacent signs to simplify the expression.
Apply the idea
The adjacent signs ( and ) are the same, so the operation becomes addition.
10 + 4 ( 6) = 10 + 4 + 6
= 6 + 6
Combine the adjacent signs
Evaluate from left to right, simplifying 10 + 4 first = 0
Evaluate
Idea summary
Integers are positive and negative whole numbers, including zero.
Adjacent signs occur when two signs are written next to each other; simplify the expression by merging these into one operation.
To combine adjacent signs:
• When the signs are the same, the operation is addition. For example:
3 ( 4) = 3 + 4
• When the signs are different, the operation is subtraction. For example:
3 + ( 4) = 3 4
Multiply and divide integers
Interactive exploration
Discover this concept in action online mathspace.co
These rules determine the sign of the answer when multiplying or dividing two integers:
• When the two integers have the same sign, their product or quotient will be positive.
Same signs, result is positive
Same signs, result is positive
• When the two integers have different signs, their product or quotient will be negative.
Di erent signs, result is negative
Di erent signs, result is negative
For expressions with more than two integers, the sign of the result can be found by counting the number of negative numbers.
• An odd number of negatives will give a negative result.
• An even number of negatives will give a positive result.
Example 3
Evaluate:
a 7 × ( 8)
Create a strategy
The integers have different signs; therefore, the product will be negative.
Apply the idea
7 × ( 8) = 56
b 36 ÷ ( 9)
Create a strategy
Evaluate the multiplication
The integers have the same signs; therefore, the quotient will be positive.
Apply the idea
36 ÷ ( 9) = 4
c ( 4)3
Create a strategy
Evaluate the division
Write the expression in expanded form and then multiply from left to right.
Apply the idea
Reflect and check
( 4)3 = ( 4) × ( 4) × ( 4)
Write in expanded form = 16 × ( 4)
Evaluate ( 4) × ( 4) = 64
Evaluate the multiplication
In expanded form, there are three negative signs. Since three is an odd number, the final answer must be negative.
Idea summary
These rules determine the sign of the result when multiplying or dividing integers:
• When two integers have the same sign, the result is positive.
Same signs, result is positive
Same signs, result is positive
• When two integers have different signs, the result is negative.
Di erent signs, result is negative
Di erent signs, result is negative
Did you know?
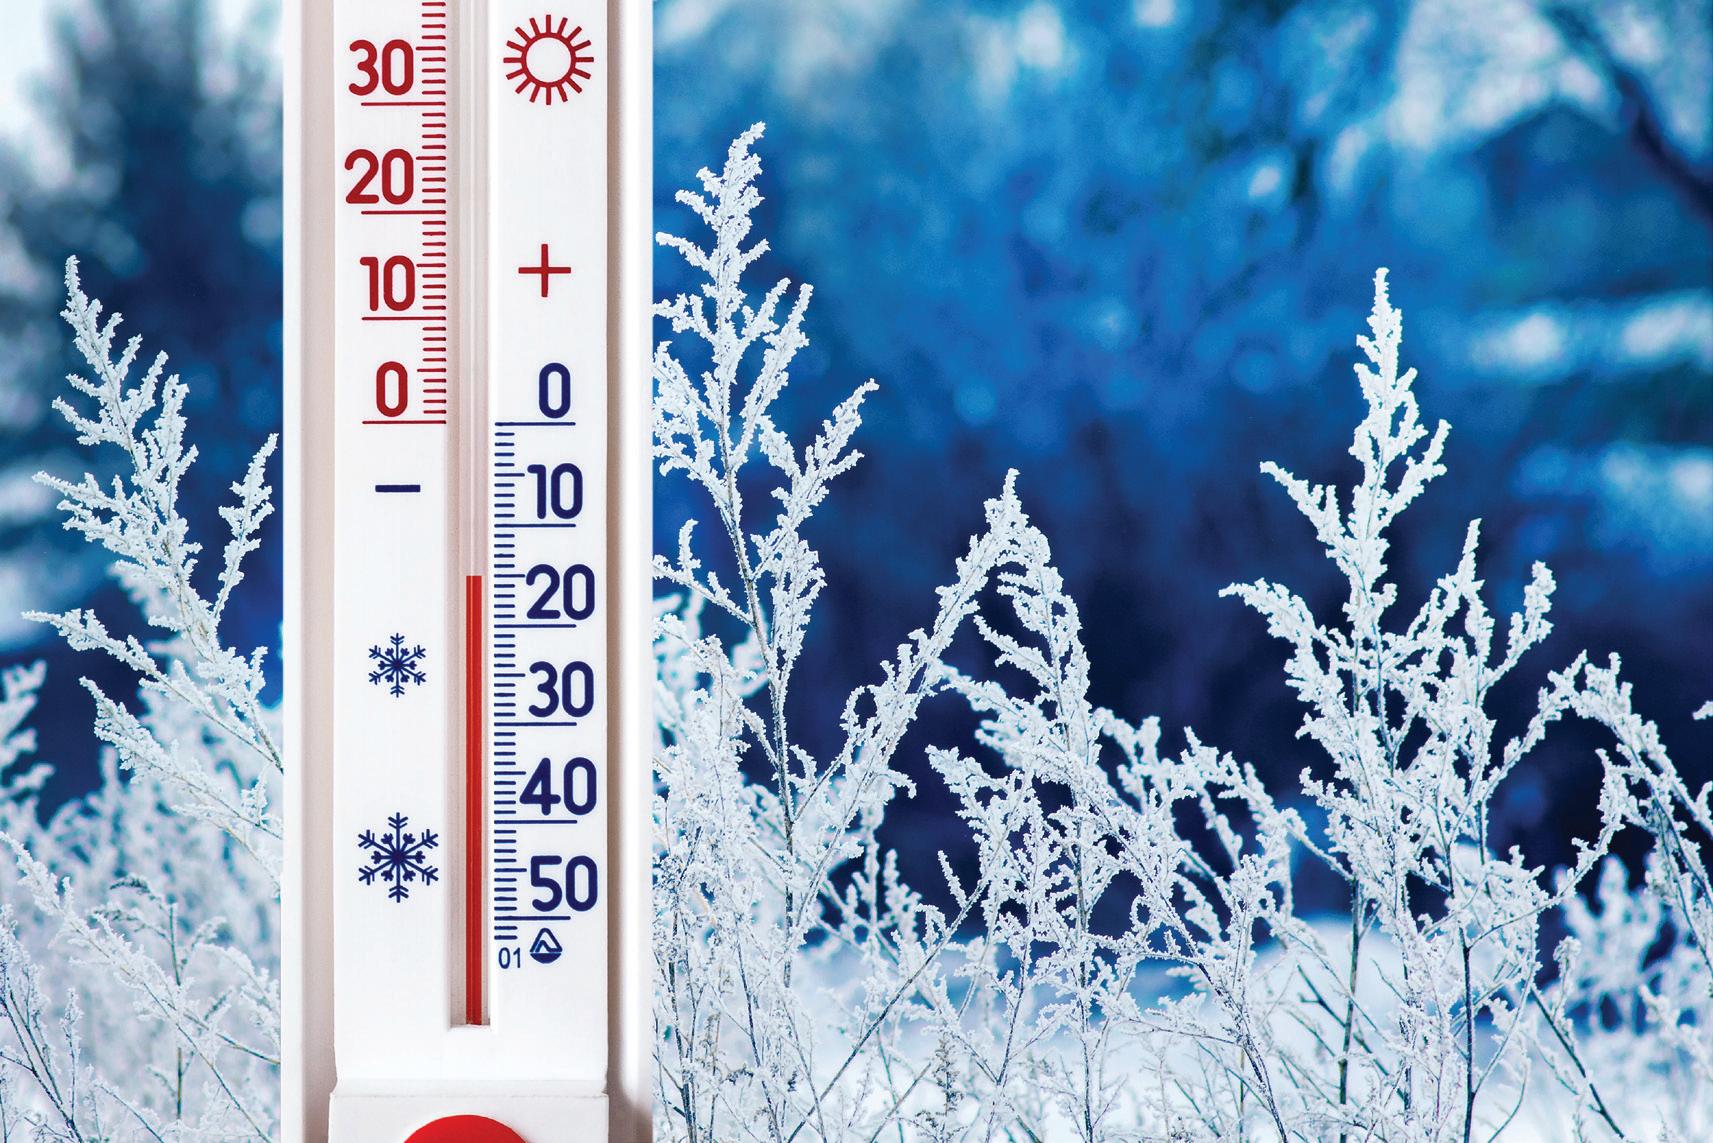
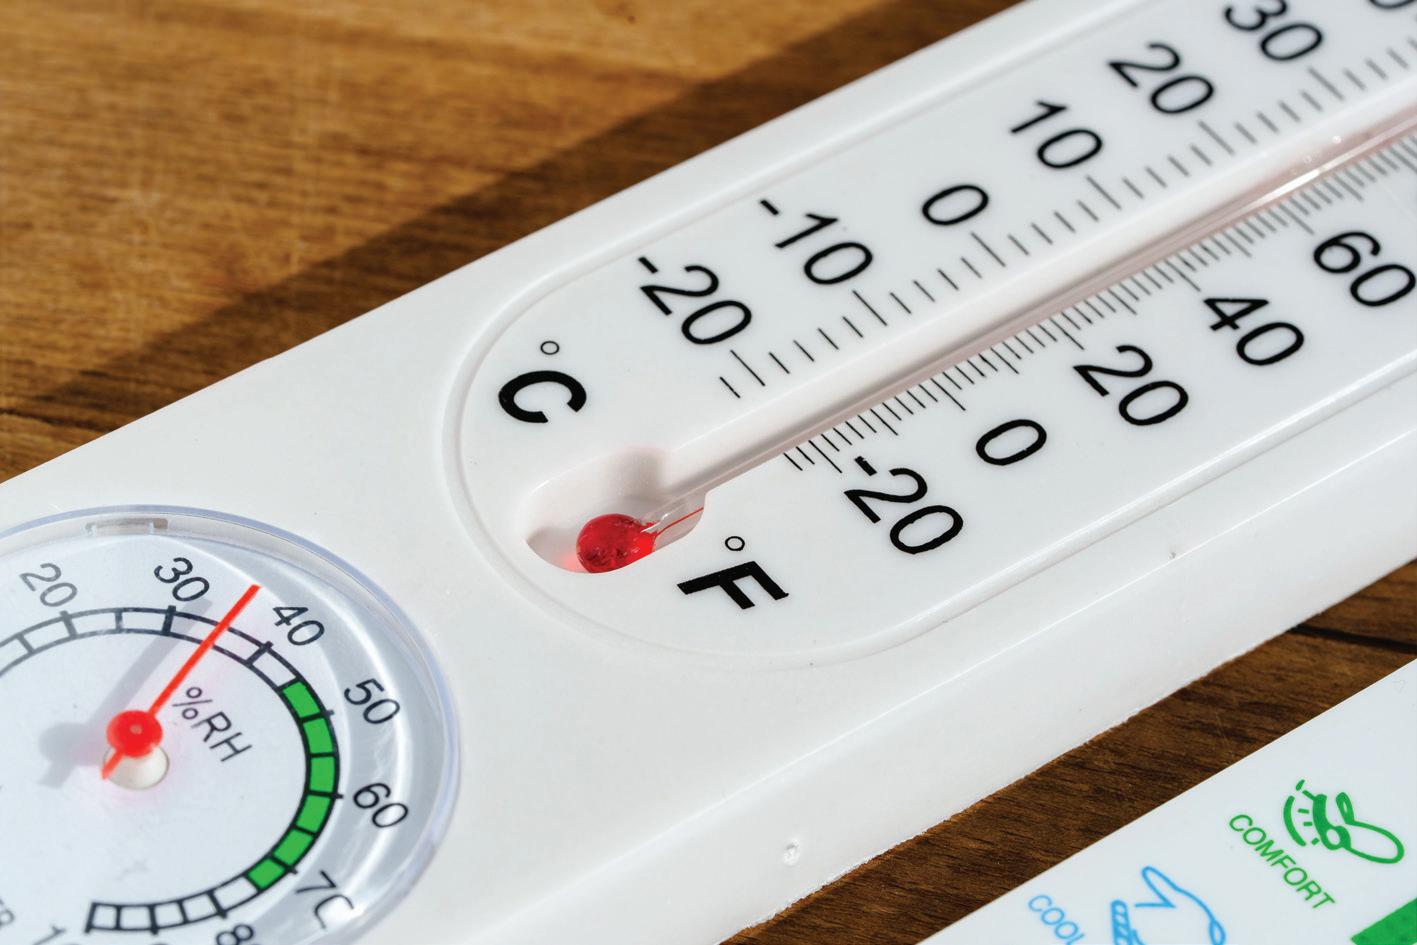
When temperatures fall below 0°C, we use negative integers to measure how cold it gets. In places like Thredbo, winter temperatures often reach –5°C and below. These values help meteorologists track weather patterns and communicate accurate forecasts.
Order of operations
Order of operations
A set of rules that state the correct sequence for solving mathematical expressions with multiple operations.
BOMDAS
An acronym used to remember the order of operations: Brackets, Orders, Multiplication, Division, Addition, Subtraction.
When an expression involves multiple operations, it is important to follow the correct order of operations to ensure a consistent and accurate result. A common way to remember this order is with the acronym BOMDAS.
The order to evaluate an expression is:
1. B - Brackets: Evaluate any expressions inside grouping symbols first. These include parentheses (…), square brackets […], and braces { }
2. O - Orders: Evaluate any powers or roots.
3. MD - Multiplication and Division: Work from left to right, performing any multiplication or division as they appear.
4. AS - Addition and Subtraction: Work from left to right, performing any addition or subtraction as they appear.
Example 4
Evaluate: 20 (5 + 3) × 2 + 18 ÷ 3
Create a strategy
Follow the order of operations (BOMDAS) to solve the expression step by step.
Apply the idea
20 (5 + 3) × 2 + 18 ÷ 3 = 20 8 × 2 + 18 ÷ 3
= 20 16 + 18 ÷ 3
= 20 16 + 6
= 4 + 6
= 10
Evaluate 5 + 3
Evaluate the multiplication
Evaluate the division
Evaluate the subtraction
Evaluate the addition
Idea summary
To ensure consistent and correct answers, always follow the order of operations using BOMDAS:
• B - Brackets
• O - Orders (powers and roots)
• MD - Multiplication and Division (from left to right)
• AS - Addition and Subtraction (from left to right)
Place value, rounding and reasonableness
Place value table
A table used to display the value of each digit according to its position in a number.
Rounding
A method of simplifying numbers to make them easier to use for estimation, while keeping them close to their original value.
Estimation
Finding a value that is close enough to the exact value, usually with some thought or calculation involved.
Leading-digit approximation
A method of estimation that involves rounding numbers to their first (leading) digit before calculating.
The value of each digit depends on its position within a number. A place value table can be used to determine this value. The further left a column is, the larger its place value.
Place value table extending into decimals
Rounding is used to simplify numbers. To round a whole number:
1. Identify the digit in the rounding position specified.
2. Look at the digit to the right (the decider).
• If the decider is 0, 1, 2, 3 or 4, round down (keep the rounding digit the same).
• If the decider is 5, 6, 7, 8 or 9, round up (increase the rounding digit by 1).
3. Replace all digits to the right of the rounding position with zeros.
Estimation helps check if an answer is reasonable. Leading-digit approximation is a common estimation method where numbers are rounded to their first digit before calculating.
Other ways to check reasonableness include using common sense to see if the answer fits the context, or substituting the answer back into the original problem.
Example 5
What is the value of the digit 8 in the number 5832?
Create a strategy
Write the number in a place value table.
Apply the idea
The digit 8 is in the hundreds place. Therefore, it represents 8 hundreds or 800.
Example 6
Round 4781 to the nearest hundred.
Create a strategy
Identify the hundreds digit. If the digit immediately to the right is 5 or greater, round up; otherwise, round down and replace digits to the right with zeros.
Apply the idea
The digit in the rounding position (hundreds) is 7. The decider digit (tens) is 8. Since 8 is greater than 5, the number is rounded up. The 7 becomes an 8 and the digits to the right become zeros. Therefore, 4781 rounded to the nearest hundred is 4800.
Reflect and check
Consider 4781 on a number line. It is closer to 4800 than to 4700.
Example 7
By leading-digit approximation, estimate the value of 8150 4890
Create a strategy
Round each number to its leading digit (the nearest thousand) and then subtract.
Apply the idea
8150 4890 ≈ 8000 5000 Round each number to its leading digit ≈ 3000 Evaluate
Example 8
A beaker contains 450 mL of liquid. A scientist pours out 120 mL. How much liquid remains in the beaker?
Evaluate the reasonableness of these attempted solutions:
a Attempted solution: 450 + 120 = 570 mL
Create a strategy
To evaluate if a solution is reasonable, check it against the context of the problem by considering several factors:
• Logical sense: Does the result align with the actions described in the problem? For example, if a quantity is removed, the final result should be smaller than the initial amount.
• Physical possibility: Is the result possible in the real world? Physical quantities like volume, distance, or time cannot be negative.
• Estimation: Is the result close to a rough calculation? Rounding the numbers in the problem before performing the operation provides a quick estimate to compare against.
Apply the idea
This solution suggests there is 570 mL of liquid remaining. This is a possible volume, but it contradicts the problem, which states that liquid was poured out, so the final amount should be less than the starting amount. Therefore, this answer is not reasonable.
b Attempted solution: 120 450 = 330 mL
Apply the idea
This solution indicates that there is negative 330 mL of liquid remaining. It is impossible to have a negative volume. Therefore, this answer is not reasonable.
c Attempted solution: 450 120 = 330 mL
Apply the idea
This solution says that there is 330 mL of liquid remaining. This is a physically possible volume, and it fits the logic that the final amount should be less than the starting amount.
To check with an estimate, rounding the initial numbers gives 450 100 = 350. The answer 330 mL is close to this estimate.
To confirm exactly, substitute the solution back into the problem: the remaining liquid (330 mL) plus the amount poured out (120 mL) should equal the original amount.
330 + 120 = 450. This matches the initial conditions, so the answer is reasonable.
Idea summary
Digits have values based on their position in a number, which can be shown in a place value table.
Rounding simplifies numbers for estimation.
Check the reasonableness of an answer by using estimation (like leading-digit approximation) or by checking if the answer makes sense in the context of the problem.
Did you know?
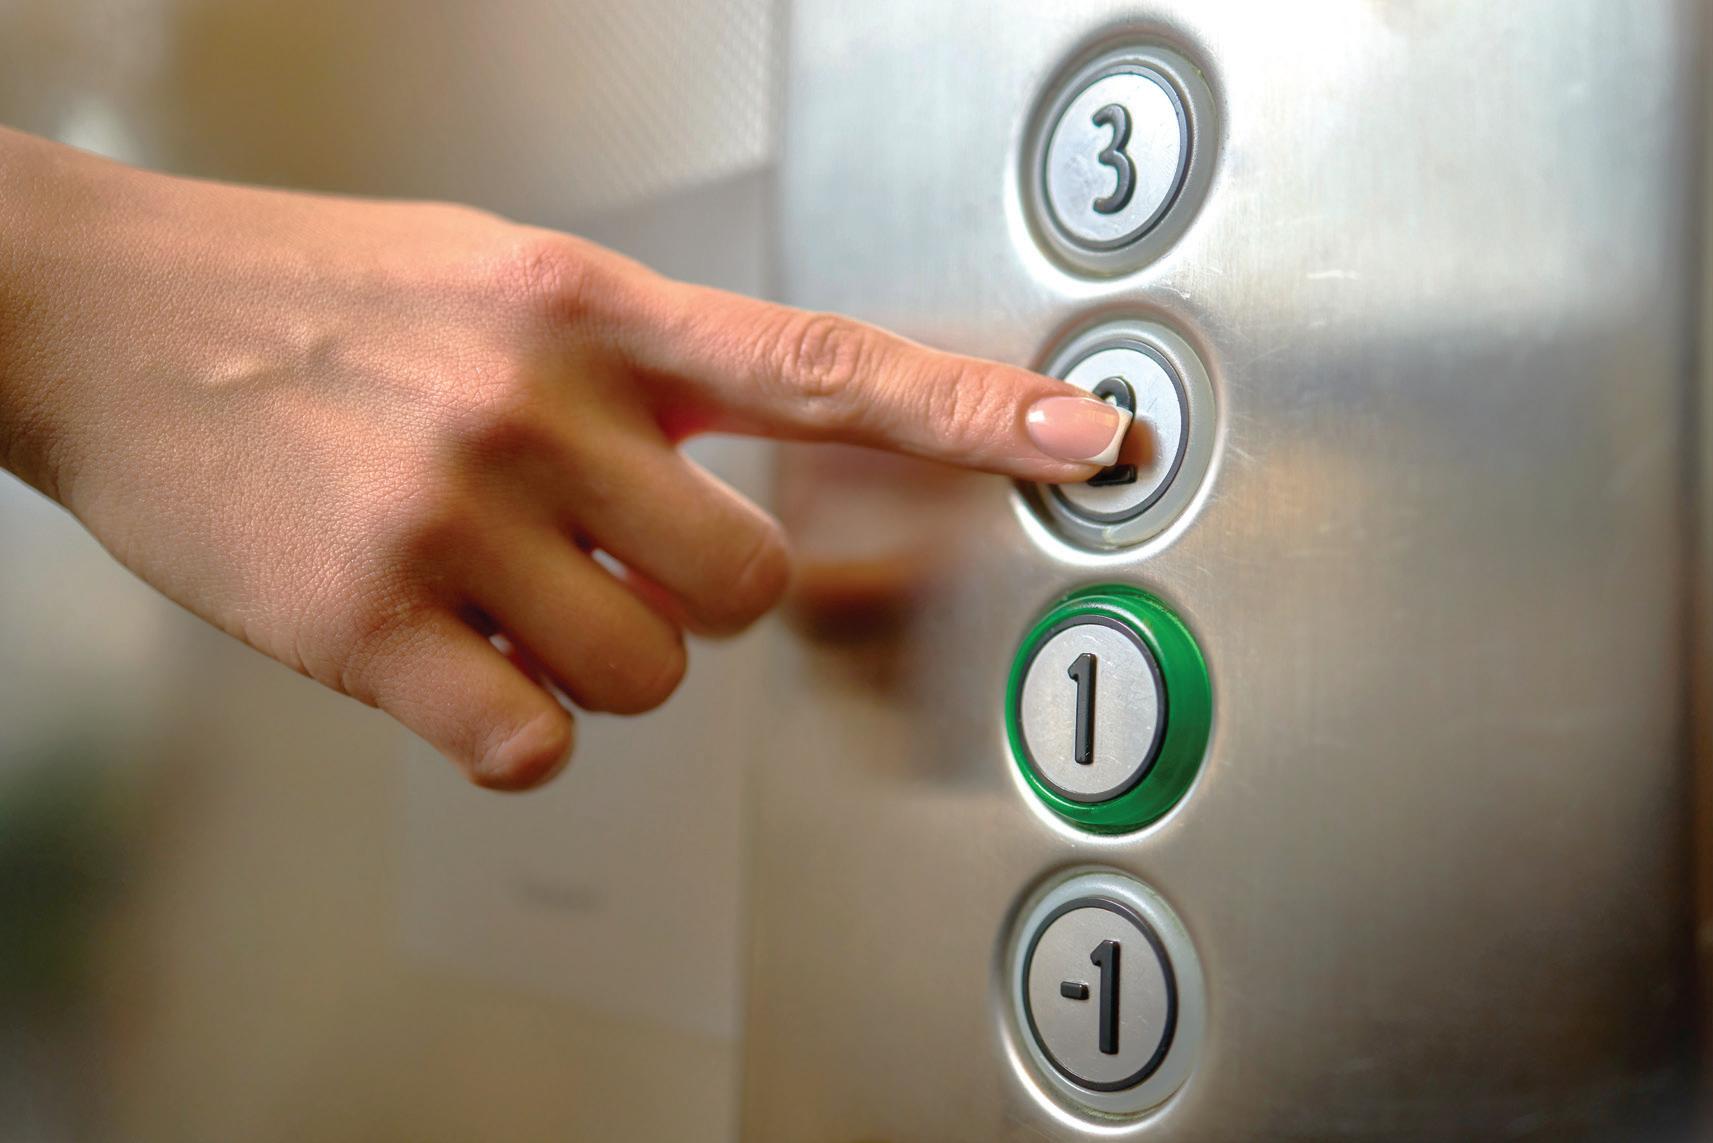
Elevator buttons function like a vertical number line! Floors above ground are represented by positive integers, while floors below ground are represented by negative integers. Each button press corresponds to a movement along that number line, showing both direction and position within the building. This makes it easy to interpret changes in height without needing complex measurements. Integers provide a clear, consistent way to organise and navigate multi-level spaces in the real world.
1.01 Practice questions
What do you remember?
1 Determine whether the statements about integer operations are true or false:
a The expression 10 ( 4) simplifies to 10 4.
b Adding a negative integer is the same as moving to the left on a number line.
c The product of two negative integers is always a positive integer.
d The quotient of a positive integer and a negative integer is always positive.
2 Complete the algebraic working to evaluate the expression 60 ÷ (8 5) + 3 × 42 using the order of operations (BOMDAS): 60 ÷ (8 5) + 3 × 42 = 60 ÷ ⬚ + 3 × 42
Evaluate (8 5) = 60 ÷ 3 + 3 × ⬚
Evaluate 42
= ⬚ + 3 × 16
Evaluate the division = 20 + ⬚
Evaluate the multiplication = ⬚
Evaluate the addition
3 Round the numbers plotted on these number lines to the nearest 100:
4 Determine whether these statements are true or false:
a Dividing by 6 is the same as dividing by 3 and then dividing by 3 again.
b 4000 is a reasonable estimate for 42 × 8.
c 400 is a reasonable estimate for 2002 ÷ 5. Practice
5 Evaluate:
6 Evaluate: a 8 + ( 5)
4 ( 11)
c 9 + ( 6) d 12 ( 3)
e 15 + 10 ( 5) f 25 + ( 18) 10
7 Evaluate:
a 9 × ( 4)
c ( 2) × 5 × ( 3)
( 8) × ( 7)
4 × ( 3) × ( 5) e ( 5)2
8 Evaluate: a ( 24) ÷ 6
c ( 81) ÷ ( 9)
What is the value of the digit 8 in each number?
14 Round 7 812 500 to the nearest million.
15 For each of these expressions:
i Round both numbers to the nearest 10.
ii Calculate the estimate.
16 For each of these expressions:
i Round the numbers to the nearest 100, where appropriate.
ii Calculate the estimate.
17 For each of these expressions:
i Round both numbers to the nearest 1000.
ii Calculate the estimate.
a 9123 + 5789 b 7501 2999
18 Determine whether these statements about the product of 48 × 81 are reasonable:
a The product is less than 4500. b The product is greater than 3200.
c The product is greater than 4500. d The product is less than 3200.
19 Use leading-digit approximation to estimate the value of each expression, showing the rounded expression:
a 4710 + 3288
c 585 × 41
b 7950 1890
d 5610 ÷ 78
20 A car’s fuel tank holds 60 litres when full. After a journey, 25 litres of fuel have been used. For each attempted solution, explain whether each attempted solution is reasonable or not:
a Attempted solution: 60 + 25 = 85 litres
b Attempted solution: 25 60 = 35 litres
c Attempted solution: 60 25 = 35 litres
Extend your thinking
21 Consider the sum 672 + 348 + 55:
a Estimate the sum by rounding each number to the nearest ten.
b Estimate the sum by rounding each number to the nearest hundred.
c Calculate the exact value of the sum.
d Determine which estimate is more accurate.
22 In a game, each letter is assigned an integer value as shown in the table. The score of a word is the sum of the values of its letters. Each letter can only be used once per word:
a Calculate the score of the word COLD.
b Calculate the score of the word WARM.
c Determine a four-letter word using the available letters that has a score of 10.
d What is the highest possible score that can be made from a four-letter arrangement?
23 Insert one or more pairs of brackets into each expression to make the equation true:
a 30 4 × 5 ÷ 5 3 = 20
b 23 10 × 3 + 8 × 9 2 = 109
24 A scientist is making quick estimates. For each calculation, predict whether using a leading-digit approximation will result in an overestimate (larger than the exact value) or an underestimate (smaller than the exact value). Justify the prediction without calculating the exact answer:
a 58 + 89
c 781 124
b 417 + 235
d 645 + 280
1.02 Fractions and decimals
After this lesson, you will be able to…
• perform calculations involving fractions and decimals using technology
• convert between fractions, decimals and percentages
Fractions
Fraction
A number representing equal parts of a whole.
A fraction consists of a numerator (top number), a denominator (bottom number), and a vinculum (the line in between).
Numerator Vinculum Denominator
There are different types of fractions:
In the fraction , the numerator is 4 and the denominator is 5. This means there are 4 parts out of a total of 5 equal parts that make up a whole.
• Proper fractions are less than one whole, for example
• Improper fractions are greater than or equal to one whole, for example .
• Mixed numbers combine a whole number and a proper fraction, for example
This image shows 8 shaded parts, where each whole is made of 5 parts. This can be represented as the improper fraction or as the mixed number
For calculations, technology such as a scientific calculator is a useful tool. The fraction button allows for easy entry of proper fractions, improper fractions and mixed numbers.
Shift button is needed for mixed fractions
Examples of fraction buttons
The way to use the fraction button can differ between calculator brands. However, there are two common approaches:
1. To enter a fraction like , one common method is to press the number keys and fraction button in sequence:
2. An alternative method, found on some calculators, is to press the fraction button first. Then, the arrow keys are used to move between the numerator and denominator boxes before the numbers are entered.
Useful tips:
• The word 'of' in mathematics almost always means multiplication. For example, of is calculated as
• A fraction also represents a division. The fraction is the same as the calculation 7 ÷ 10. Using the division key (÷) can sometimes be a faster alternative to the fraction button.
The mixed number function is a secondary feature on many calculators. To access this function and enter a mixed number, press the SHIFT key followed by the fraction key: SHIFT
Since calculators and electronic devices can operate differently, it is important to use a model that is approved for tests and exams. Familiarity with the calculator's functions is essential, as difficulties can arise during tests from using a borrowed or unfamiliar device.
Example 1
Use a calculator to evaluate these expressions:
a
Create a strategy
Use the fraction button on the calculator to enter each value, then use the addition key to find the sum.
Apply the idea
Evaluate with a calculator
b
Create a strategy
Use the or or ⬚ button by pressing the SHIFT
Enter the values then press the equal sign (=) to simplify.
Apply the idea
Evaluate with calculator
Convert to mixed number
After the calculation, pressing the fraction button or ⬚ again can also convert an improper fraction to a mixed number.
c
Create a strategy
Use the fraction button to enter both fractions, then use the multiplication key. The calculator will automatically simplify the result.
Apply the idea
Evaluate with a calculator
Reflect and check
To multiply fractions manually, multiply the numerators together and the denominators together. The initial result is , which simplifies to by dividing the numerator and denominator by 2. The calculator performs this simplification automatically.
Example 2
David is saving for a new bike. He already has $550 in his savings account. He decides to save of his weekly wage. This week, his wage was $450:
a Use a calculator to determine how much David saved this week in dollars.
Create a strategy
Use the or button to enter the fraction. Multiply the fraction he saves by his total weekly wage.
Apply the idea × 450 = $90
Evaluate with calculator
b Use a calculator to determine the total amount in his savings account now.
Create a strategy
Add the amount saved this week to his existing savings.
Apply the idea
Total savings = 550 + 90
Write the equation = $640
Evaluate
Idea summary
A fraction represents parts of a whole and is made of a numerator, a denominator, and a vinculum
Fractions can be proper (less than 1), improper (1 or greater), or written as mixed numbers.
Technology such as scientific calculators can perform operations with fractions and mixed numbers, which is useful for solving complex problems.
Decimals
Decimal
A number containing a decimal point, which separates the whole number part from the fractional part.
Decimals are used to represent values that fall between whole numbers. A decimal point is used to separate the whole number from the decimal or fraction part.
When working with decimals, the concept of place value is extended to include tenths, hundredths, thousandths, and beyond. Each digit after the decimal point represents a fraction of a whole number.
In 312.45, the digit 3 represents 3 hundreds, and the digit 4 represents 4 tenths. As with whole numbers, the farther to the left a column is, the larger its place value.
Calculations with decimals can also be completed on a calculator using the decimal point button.
When entering decimal numbers into a calculator, use the button. Input decimals by pressing this button after the ones digit and before the tenths digit.
For example, to input 175.92 into a calculator, the buttons would be pressed in this order:
Example 3
Evaluate: 9.15 4.5 × 0.2 + 1.25
Create a strategy
Use a scientific calculator to evaluate the expression. A scientific calculator will automatically follow the correct order of operations (BOMDAS), performing the multiplication before the addition and subtraction.
Apply the idea
Entering the entire expression 9.15 4.5 × 0.2 + 1.25 into a scientific calculator and pressing the equals key will give the final answer of 9.5 directly, as the calculator handles the order of operations automatically.
Reflect and check
If the calculation is done manually, following BOMDAS, perform the multiplication first: 4.5 × 0.2 = 0.9
Then, perform addition or subtraction from left to right.
9.15 4.5 × 0.2 + 1.25 = 9.15 0.9 + 1.25
Evaluate the multiplication = 8.25 + 1.25
Evaluate subtraction = 9.5
Evaluate
Example 4
A runner completed a 5 km race in 23.45 minutes. Find runner’s average speed in kilometres per minute, rounded to two decimal places.
Create a strategy
Divide the total distance by the total time. Use the calculator’s division key and round the answer to two decimal places.
Apply the idea
Average speed
Write the formula for average speed
Evaluate with a calculator
Round to two decimal places
The runner’s average speed in kilometres per minute is 0.21
Reflect and check
Rounding is important when reporting decimal answers. The hundredths place value is the second digit after the decimal point.
Idea summary
Decimals use a decimal point to represent numbers that have a whole number part and a fraction part.
The value of each digit is determined by its position in the place value table.
Hundreds Tens Ones Tenths Hundredths Thousandths
Technology such as calculators can be used to perform operations with decimals by entering the numbers using the decimal point button.
Convert between fractions, decimals, and percentages
Percentage
A special fraction that represents a number as parts out of one hundred, shown with the percent symbol (%).
Fractions, decimals, and percentages are three different ways to represent values that are parts of a whole.
This shape is divided into 5 equal parts, and 3 of them are shaded. This can be written as:
• A fraction:
• A decimal: 0.6
• A percentage: 60%
It is an essential skill to be able to convert between these forms. A scientific calculator is a very useful tool for this.
The key conversion rules are:
• To convert a fraction to a decimal, divide the numerator by the denominator.
• To convert a decimal to a percentage, multiply the decimal by 100.
• To convert a percentage to a decimal, divide the percentage by 100.
Most scientific calculators have a fraction-to-decimal conversion button, which makes these conversions quick and accurate. This button often looks like this:
Example 5
A survey found that of students walk to school:
a Use a calculator to convert to a decimal.
Create a strategy
Divide the numerator by the denominator.
Apply the idea
Write the fraction as division
Evaluate with a calculator
Reflect and check
Using the fraction to decimal button , enter then press S D
b Convert the decimal 0.4 to a percentage.
Create a strategy
Multiply the decimal by 100 and add the percent symbol (%).
Apply the idea
0.4 = 0.4 × 100%
Multiply the decimal by 100% = 40%
Evaluate
Example 6
A store is offering a 25% discount on all items: a Express the discount as a decimal.
Create a strategy
To convert a percentage to a decimal, divide by 100.
Apply the idea
25% = 25 ÷ 100
Divide the percentage by 100 = 0.25
Evaluate with a calculator
b Express the discount as a fraction in its simplest form.
Create a strategy
A percentage is a fraction out of 100. Write 25 as the numerator and 100 as the denominator using the button then press the equals (=) button to simplify.
Apply the idea
Express the percentage as a fraction with a denominator of 100
Use technology to simplify
Idea summary
Fractions, decimals, and percentages are three different ways of representing the same value.
Key conversions:
• Fraction to decimal: Divide the numerator by the denominator
• Decimal to percentage: Multiply by 100
• Percentage to decimal: Divide by 100
• Percentage to fraction: Write as a fraction over 100 and simplify
Fractions, decimals, and percentages are different ways of representing the same proportion. A 30% discount is equivalent to three-tenths, or 0.3, of the original value. Changing the form changes how the number is expressed, not what it means.
Different representations are useful in different contexts. Percentages are common in advertising and data summaries because they are easy to interpret. Decimals are preferred for calculations and precise measurements. Being fluent in all three allows you to switch methods efficiently. These skills are widely used in subjects like economics, science, and technology.
1.02 Practice questions
What do you remember?
1 Express the fraction that is shaded as a proper fraction or a mixed number: a b c d
2 Identify the place value represented by the digit 3 in these numbers: a 51.93 b 0.623 c 93.14 d 20.35
3 Complete the statements using the words ‘divide’ or ‘multiply’:
a To convert a fraction into a decimal, ⬚ the numerator by the denominator.
b To convert a decimal into a percentage, ⬚ by 100.
c To convert a percentage into a decimal, ⬚ by 100.
Practice
4 Add these fractions and express the final answer in its simplest form, as either a proper fraction or a mixed number: a 5 b c 4 d
5 Subtract these fractions and express the final answer in its simplest form, as either a proper fraction or a mixed number:
6 Multiply these fractions and express the final answer in its simplest form, as either a proper fraction or a mixed number:
7 Divide these fractions and express the final answer in its simplest form, as either a proper fraction or a mixed number:
8
A chef is baking a large batch of cookies. The recipe requires a base of 500 g of flour, plus an additional amount of flour equal to of the weight of the sugar used. For this batch, the chef uses 840 g of sugar:
a What is the additional amount of flour required?
b What is the total amount of flour needed for the recipe?
9 Liam paints of a fence and Ava paints of the same fence. What fraction of the fence did they paint altogether?
10 Evaluate:
11 Evaluate:
12 A carpenter earns $42.50 per hour for their work. If they work for 38.5 hours on a project, what is their total pay for that project?
13 A running track is 0.45 km long. If an athlete runs 6 laps, what is the total distance they have covered?
Express
15 Express each decimal as a percentage:
16 Express each percentage as a fraction in its simplest form:
17 Express each fraction as a percentage, rounding the answer to two decimal places when necessary:
a b c d
e f g h
18 In a bag containing 50 marbles, 35 are red. Express the number of marbles that are not red as:
a A simplified fraction b A decimal
c A percentage
19 In a school car park, of the vehicles are cars:
a Convert the fraction to a decimal.
b Convert the decimal from part (a) to a percentage.
20 A survey revealed that 85% of people in a town own a smartphone:
a Express this percentage as a decimal.
b Express this percentage as a fraction in its simplest form.
Extend your thinking
21 A recipe requires cups of flour. How many cups of flour are needed to make 1.5 times the recipe? Give the answer as a mixed number and as a decimal.
22 In a class, of the students are girls and 15 are boys. What is the total number of students, and what percentage of the class are boys?
23 Compare and order this set of numbers from least to greatest: 0.65, , 60%,
1.03 Ratios and proportions
After this lesson, you will be able to…
• understand and write ratios in simplest form
• divide a quantity in a given ratio
• solve practical problems using proportions
Ratios
Ratio
An ordered comparison of two or more quantities, showing how much there is of one thing compared to another.
Equivalent ratios
Ratios that represent the same proportion or relationship.
Simplified ratio
A ratio expressed using the smallest possible whole numbers.
Proportion
A statement that two ratios are equal. It is often written as two equivalent fractions.
A ratio is commonly written in the form a : b, which is read as 'a to b'.
A ratio can be a part-to-part ratio (e.g., circles to squares) or a part-to-whole ratio (e.g., circles to the total number of shapes). The order of the numbers in the ratio must match the order of the words in the question.
Ratios can also be written as fractions. A ratio of a : b can be expressed as the fraction . This link is useful for simplifying ratios.
To create an equivalent ratio, multiply or divide all parts of the ratio by the same number.
The proportion shows that the ratio 1 : 2 is equal to the ratio 5 : 10.
To simplify a ratio, divide all parts by their highest common factor (HCF).
Before simplifying, it is important that all quantities are in the same units. If a ratio contains fractions or decimals, they must be converted to whole numbers first.
Example 1
For this diagram:
Write a ratio for each relationship:
a The number of squares to triangles
Apply the idea
There are 14 squares and 4 triangles. The ratio of squares to triangles is 14 : 4.
Reflect and check
Ratios should be expressed in their simplest form. To simplify the ratio, find the highest common factor (HCF) of both numbers. The HCF of 14 and 4 is 2.
Divide each part by the HCF Evaluate the division
b The number of circles to the total number of shapes
Apply the idea
There are 5 circles and 23 shapes in total. The ratio of circles to the total is 5 : 23
Example 2
A fruit punch is made by mixing orange juice and pineapple juice in the ratio 5 : 2. What fraction of the total punch is orange juice?
Create a strategy
The total number of parts in the ratio is the sum of the individual parts. The parts for orange juice will be the numerator, and the total parts will be the denominator.
Apply the idea
The total number of parts is 5 + 2 = 7. Orange juice makes up 5 parts of the total 7 parts.
The fraction of the punch that is orange juice is .
Example 3
Express the ratio of $4.50 to 75 cents in simplest form.
Create a strategy
First, convert the quantities to the same unit (cents). Then, simplify the resulting ratio by dividing by the HCF.
Apply the idea
Convert $4.50 to cents: 4.50 × 100 = 450 cents
The ratio is 450 : 75.
The HCF of 450 and 75 is 75.
Divide each part the HCF
Evaluate
Example 4
The scale on a map is given as 2 cm : 5 km. If two towns are 15 cm apart on the map, what is the actual distance between them in kilometres?
Create a strategy
Set up a proportion using two equivalent ratios to compare the map distance to the actual distance. Let x represent the unknown actual distance in kilometres. Then, solve the proportion for x.
Apply the idea
The proportion can be written as two equal fractions:
Write the formula
Substitute the values
Multiply both sides by x
Multiply both sides by 5
Divide both sides by 2
Evaluate
Therefore, the actual distance between the two towns is 37.5 kilometres.
Reflect and check
Another way to solve this is to find the scale factor. The scale is 2 cm : 5 km.
First, find what number 2 cm must be multiplied by to get 15 cm. This is the scale factor.
Now, multiply the actual distance by this same scale factor.
This confirms the answer is 37.5 km.
Idea summary
A ratio compares quantities and can be a part-to-part ratio or a part-to-whole ratio
Ratios are commonly written as a : b or as a fraction :
• The order of the numbers must match the order of the quantities being compared.
• Equivalent ratios represent the same proportion and are found by multiplying or dividing all parts of the ratio by the same non-zero number.
• A ratio should be expressed as a simplified ratio by dividing all parts by their highest common factor (HCF).
• Before simplifying, ensure all quantities are in the same units and any fractions or decimals have been converted to whole numbers.
Divide a quantity in a given ratio
Fraction method
A method for dividing a quantity where each part of the ratio is turned into a fraction of the total.
Unitary method
A method for dividing a quantity where the value of a single part (one unit) of the ratio is found first.
There are two main methods to divide a total amount into shares based on a given ratio: the fraction method and the unitary method.
• Method 1: The fraction method
1. Find the total number of parts by adding the numbers in the ratio.
2. Express each number in the ratio as a fraction of this total.
3. Multiply each fraction by the total quantity to find the value of each share.
• Method 2: The unitary method
1. Find the total number of parts by adding the numbers in the ratio.
2. Find the value of one single part by dividing the total quantity by the total number of parts.
3. Multiply the value of one part by each number in the ratio to find the value of each share.
Interactive exploration
Discover this concept in action online mathspace.co
Example 5
A 150 kg bag of dry concrete mix is made by mixing sand and cement in the ratio 4 : 1.
a How much sand is in the bag?
Create a strategy
Use the fraction method to divide 150 kg in the ratio 4 : 1.
Apply the idea
First, find the total number of parts in the ratio.
Total parts = 4 + 1 = 5
Next, write each part as a fraction of the total. The ratio 4 : 1 becomes the fractions .
The first part of the ratio is for sand; therefore, its fraction is
Amount of sand = × 150
Multiply the fraction by the total amount = 120 kg
Evaluate
b How much cement is in the bag?
Create a strategy
Continue using the fraction method from the previous part.
Apply the idea
The second part of the ratio is for cement; therefore, so its fraction is
Amount of cement = × 150
Multiply the fraction by the total amount
= 30 kg Evaluate
Reflect and check
The two shares should add up to the total amount:
120 kg + 30 kg = 150 kg
Example 6
Three business partners, Anna, Ben, and Chloe, share a profit of $2400 in the ratio 5 : 4 : 3. How much profit does each partner receive?
Create a strategy
Use the unitary method. First find the total number of parts, then find the value of one part, and finally multiply to find each person's share.
Apply the idea
First, find the total number of parts.
Total parts = 5 + 4 + 3 = 12
Next, find the value of one part.
Value of 1 part = 2400 ÷ 12
Divide the total amount by the number of parts = $200 Evaluate
Finally, multiply the value of one part by each number in the ratio.
Anna’s share (5 parts) = 5 × 200 = $1000
Ben’s share (4 parts) = 4 × 200 = $800
Chloe’s share (3 parts) = 3 × 200 = $600
Reflect and check
The total of the three shares should equal the total profit:
1000 + 800 + 600 = $2400
Idea summary
The fraction method:
1. Find the total number of parts in the ratio.
2. Write each part of the ratio as a fraction of the total.
3. Multiply each fraction by the total quantity.
The unitary method:
1. Find the total number of parts in the ratio.
2. Divide the total quantity by the total parts to find the value of one part.
3. Multiply the value of one part by each number in the ratio.
1.03 Practice questions
What do you remember?
1 Express, in the form of a : b, the ratio for each pair of quantities:
a $8 to $11
c 9 litres to 14 litres
b 25 grams to 31 grams
d 18 apples to 25 apples
2 A bookshelf contains 15 fiction books and 8 non-fiction books:
a Express the ratio of fiction books to non-fiction books as a fraction.
b Express the ratio of non-fiction books to fiction books as a fraction.
3 A sum of money is shared in the ratio 5 : 2 between two people, Liam and Olivia:
a Determine the total number of parts in the ratio.
b What fraction of the money does Liam receive?
c What fraction of the money does Olivia receive?
Practice
4 Consider this diagram:
Express each relationship as a ratio in its simplest form:
a The number of circles to the number of squares
b The number of triangles to the number of circles
c The number of squares to the total number of shapes
d The number of circles and triangles to the number of squares
5 A bag contains marbles in the ratio 3 : 4 of red to blue:
a What fraction of the total marbles are red?
b What fraction of the total marbles are blue?
6 Express each statement as a ratio in its simplest form:
a In a fruit bowl, there are 8 apples to 12 bananas.
b A sports team has a record of 10 wins to 5 losses.
c A car travels 120 kilometres in 2 hours.
d The length of a rectangle is three times its width.
7 For each pair of quantities:
i Express the two quantities in the same units as whole numbers.
ii Express the pair of quantities as a ratio in its simplest form.
Note that:
60 seconds = 1 minute
60 minutes = 1 hour
a 45 minutes to 2 hours
c 500 metres to 1.5 kilometres
8 Complete each pair of equivalent ratios:
a 3 : 1 = 9 : ⬚
c 4 : 12 = 1 : ⬚
e 5 : ⬚ = 10 : 8
24 hours = 1 day
1000 metres = 1 kilometre
b 40 seconds to 4 minutes
d 8 hours to 3 days
b 3 : 5 = ⬚ : 15
d 10 : 5 = ⬚ : 3
f 7 : ⬚ = 21 : 15
g ⬚ : 18 = 2 : 3 h ⬚ : 12 = 4 : 8
9 The scale of a map is 1 cm : 0.5 km. If the distance between two towns on the map is 4 cm, what is the actual distance in kilometres?
10 A recipe requires 3 eggs for 12 muffins. How many eggs are needed to make 32 muffins?
11 Calculate the total number of parts in these ratios:
a 4 : 5 b 15 : 2
c 8 : 13 d 61 : 29
e 3 : 4 : 5 f 1 : 6 : 9 g 10 : 1 : 6 h
12 For each statement, divide the total quantity into two parts according to the given ratio:
a 50 into the ratio 3 : 7
b 36 kg into the ratio 1 : 5
c $120 into the ratio 7 : 5
13 Divide these quantities into the given ratios:
a 60 into the ratio 1 : 2 : 3
b 28 litres into the ratio 5 : 2 : 7
14 A juice drink is made by mixing orange juice and mango juice in the ratio 5 : 3. A total of 400 mL of the drink is made:
a Determine the fraction that represents the amount of orange juice.
b How much orange juice is in the drink?
c How much mango juice is in the drink?
15 Two friends, Bart and Christie, share $90 in the ratio 7 : 2. How much money does Christie receive?
16 The ratio of students to teachers in a school is 15 : 1. If there are 60 teachers in the school, how many students are there?
17 A concrete mix is made up of cement, sand, and gravel in the ratio 1 : 2 : 4. If 140 kg of the concrete mix is to be made, determine the required mass of:
a Cement b Sand
c Gravel
18 A $300 prize is shared between three winners—Ava, Ben, and Chloe—in the ratio 5 : 3 : 2 respectively. Determine the amount of prize money each person receives:
a Ava b Ben c Chloe
19 A sports drink is made by mixing water, juice, and electrolytes in the ratio 10 : 5 : 1. A total of 800 mL of the drink is to be made. Determine the volume of:
a Water b Juice
c Electrolytes
20 A rope 24 metres long is cut into three pieces in the ratio 2 : 3 : 1. Determine the length of each piece.
21 In a paint mixture, colours are mixed in the ratio 3 : 2 : 1. How many litres of each colour are needed to make 18 litres of paint?
22 A carpenter spends time on projects in the ratio 5 : 3 : 2 for furniture, repairs, and custom work. If they work 40 hours per week, how many hours are spent on each type of work?
23 If 250 grams of sugar makes 15 cookies, how many cookies can be made with 750 grams of sugar?
24 A fruit salad contains apples, bananas, grapes, and strawberries in the ratio 5 : 3 : 2 : 2. If the total weight of the fruit salad is 480 grams, what is the weight of the apples?
Extend your thinking
25 A gardener is making a custom fertiliser blend. The blend requires a mix of nitrogen and phosphate in the ratio of . How many kilograms of nitrogen are needed to make 62 kilograms of this fertiliser?
26 Three numbers are in the ratio 2 : 3 : 5. If the sum of the first and second numbers is 30, what is the third number?
27 In a bag of marbles, the ratio of red to blue to green marbles is 3 : 4 : 5. If there are 72 marbles in total, and 8 red marbles are removed, what is the new ratio of red to blue to green marbles?
1.04 Rates
After this lesson, you will be able to…
• identify and use common rates (e.g., km/h, $/kg)
• perform calculations involving rates, including speed and cost
• estimate and check the reasonableness of results involving rates
Rates
Rate
A ratio that compares two quantities that have different units. It is often written using the word “per”, a colon, or as a fraction.
Unit rate
A rate where the second quantity in the comparison is one unit.
Example:
If a car travels 160 kilometres in 2 hours, its speed is 80 kilometres per 1 hour (or 80 km/h), which is a unit rate.
Best buy
The product or service that offers the most favourable value, often determined by comparing unit prices. The cheapest option is typically the best buy.
Rates describe how one quantity changes in relation to another. They are used in everyday life to express speed, cost, flow, or productivity.
For example:
• Speed: 60 kilometres per hour
• Heart rate: 72 beats per minute
• Wages $25 per hour
• Fuel consumption 8 litres per 100 km
Understanding rates helps compare situations and make predictions about how quantities change together.
A rate is usually considered simplified when it is represented as a unit rate. To calculate a rate, divide the first quantity by the second quantity. The result includes two components:
• A numeric value
• A compound unit showing the relationship between the two quantities such as kilometres per hour (km/h) or dollars per kilogram ($/kg).
Comparing rates is a key mathematical skill used to determine which of two or more options is more cost-effective, faster, or offers the best value or the best buy. To determine which item offers better value, it is common to calculate and compare the unit price for each item. This involves calculating the cost per unit of measurement, such as per litre, per kilogram, or per item.
Example 1
A family drove 495 km on a road trip that took 5.5 hours. What was their average speed in km/h?
Create a strategy
To calculate a rate (in this case, speed), divide one quantity (distance) by the other quantity (time).
Apply the idea
Write the formula
Substitute the values
Simplify
Reflect and check
The distance driven, around 500 km, in approximately 5.5 hours gives an estimated speed of around 90 km/h. This number is close enough to the actual answer of 90 km/h, making the answer reasonable.
Example 2
A supermarket offers two brands of cereal:
• Brand A: 500 grams for $4.20
• Brand B: 750 grams for $6.00
Which brand offers the better value?
Create a strategy
Calculate the unit cost (cost per gram) for each brand and compare them.
Apply the idea
For Brand A:
per gram For Brand B
per gram
Comparing the unit costs, Brand B ($0.0080 per gram) is cheaper than Brand A ($0.0084 per gram).
Therefore, Brand B offers the better value.
Reflect and check
To make the comparison easier, the cost for a standard amount, such as per 100 grams, can be calculated for each brand.
For Brand A:
For Brand B:
Cost per 100 g = × 100 g = $0.84
Cost per 100 g = × 100 g = $0.80
Comparing the unit costs, Brand B ($0.80 per 100 g) is cheaper than Brand A ($0.84 per 100 g). Calculating the cost per 100 g or per kilogram often provides numbers that are easier to compare than the cost per gram, which can result in very small decimal values. The conclusion remains the same regardless of the unit chosen, as long as the same unit is used for both items.
Idea summary
A rate compares two quantities that are measured in different units, such as kilometres per hour (km/h) or dollars per kilogram ($/ kg).
A rate is calculated by dividing the first quantity by the second quantity.
A unit rate is a simplified rate where the second quantity is one unit (e.g., price per 1 litre). This is useful for making comparisons.
Comparing unit rates is a common way to find the best buy between different products.
Calculations with rates
Rates are fundamental in solving a wide array of real-world scenarios, such as calculating hourly earnings or determining the cost-effectiveness of different products. When performing calculations with rates, ensure that the units are consistent or converted appropriately. For example, if speed is in kilometres per hour, then distance must be in kilometres and time in hours.
A general approach to using rates in calculations involves understanding the relationship between the quantities:
This fundamental relationship can be rearranged to find any of the three quantities if the other two are known.
Quantity A
To find the Rate, divide Quantity A by Quantity B.
Rate =
To find Quantity B, divide Quantity A by the Rate.
Quantity B =
A common application of rates is in calculating speed, distance, and time. In this context:
Speed is the rate
Distance is Quantity A
Time is Quantity B
It is important to pay attention to the units. If the rate is given in kilometres per hour, then distance must be in kilometres and the time in hours to ensure consistent calculations. Unit conversions may be necessary before applying these formulas.
Example 3
A car is travelling at a constant average speed of 95 km/h. How far will it travel in 2.5 hours?
Create a strategy
Use the formula that relates distance, speed, and time. Multiply the speed by the time.
Distance = Speed × Time (Cover 'S' to find the formula) (Cover 'D' to find the formula)
Apply the idea
Distance = Speed × Time
Write the formula = 95 × 2.5
Substitute values for speed and time = 237.5 km
Evaluate The car will travel 237.5 kilometres.
Reflect and check
To check if the answer is reasonable, an estimation can be made. The speed is close to 100 km/h. In 2.5 hours at 100 km/h, the car would travel 250 km. The answer of 237.5 km is very close to this estimate; therefore, it is a reasonable result.
Example 4
Christa earns $21 per hour working as a receptionist. If she earned $735 in one week, how many hours did she work?
Create a strategy
This problem can be solved by rearranging the general rate formula: Quantity A = Rate × Quantity B
Apply the idea
In this context:
• Quantity A is the total earned ($735)
• The Rate is the pay per hour ($21 per hour)
• Quantity B is the number of hours worked (the unknown) Referring to the triangle diagram, to find Quantity B (Hours worked), Quantity A (Total earned) must be divided by the Rate (Rate per hour).
Write the formula
Substitute the given values
Evaluate the division
Christa worked 35 hours that week.
Reflect and check
To check the answer, multiply the hours worked by the hourly rate. This should equal the total earnings.
35 hours × $21/hour = $735
Idea summary
Rates compare quantities with different units and are used in many real-world problems. The general relationship for calculations involving rates is:
Quantity A = Rate × Quantity B
Quantity A Quantity B Rate
To find the total amount (Quantity A), multiply the rate by Quantity B.
To find the rate, divide Quantity A by Quantity B.
To find Quantity B, divide Quantity A by the rate.
Always ensure all units are consistent before performing calculations, converting them if necessary.
1.04 Practice questions
What do you remember?
1 Identify whether each of these rates is a unit rate:
a Driving 100 kilometres in 2 hours
b Earning $25 per hour
c Typing 300 words in 5 minutes
d A heart beating 72 times per minute
e Paying $15 for 3 sandwiches
2 A baker is tracking her oven's performance. She records the temperature in degrees Celsius and the time it has been on in hours. Determine the compound unit for the rate at which the oven is heating up.
3 A tap fills a 20-litre bucket in 4 minutes. Determine whether the statements are true or false:
a The quantities compared are volume and time.
b The unit of the flow rate can be expressed as minutes/litre.
c The unit rate is 5 litres/minute.
d In 4 minutes, the tap fills 1 litre.
4 A car travels 540 km on 45 litres of fuel:
a What two quantities are being compared?
b What is the ratio of the two quantities for the car's fuel consumption?
c What is the unit rate for the car's fuel efficiency in km/L?
Practice
5 A water pump operates at a rate of V litres per minute. If it pumps a total of L litres in M minutes, express the rate V in terms of L and M
6 A baker decorates 120 cupcakes in 3 hours:
a Determine the compound unit that measures the rate of decorating.
b Express the rate at which the cupcakes are being decorated.
7 Express each of these as a unit rate:
a 360 calories in 4 servings
c 2400 heartbeats in 30 minutes
8 Calculate the hourly pay rate for each person:
a Alex earns $150 in 5 hours
b $180 for 12 tickets
d 150 km on 10 litres of fuel
b Charlie earns $95 in 2.5 hours
9 A car travels 360 km in 4 hours. Calculate its average speed in kilometres per hour.
10 A printer prints 24 pages in 2 minutes. How many pages can it print in one hour?
11 Bananas cost $5.40 for 900 g. Calculate the cost per kilogram.
12 Orange juice costs $4.50 for 1.5 L. What is the cost per millilitre?
13 A tap fills a 1200 mL container in 30 seconds. What is the flow rate in litres per minute?
14 Rice costs $12.60 for 1.8 kg. What is the cost per 100 grams?
15 Store A sells a 400 g bag of coffee for $10.80. Store B sells a 1 kg bag of the same coffee for $25.00. Which store offers the better buy? Justify your answer by comparing the cost per 100 g.
16 A high-speed train travels between two cities that are 450 km apart. The train maintains an average speed of 180 km/h for the entire journey. How long will the journey take?
17 A factory needs to produce 4500 widgets. If the machinery produces widgets at a rate of 300 per hour, how many hours will it take to complete the order?
18 If the currency exchange rate is 1 Euro to 1.58 Australian Dollars, calculate the number of Australian Dollars that would be received for 250 Euros.
19 A phone battery drains at a rate of 12% per hour while watching videos. If the battery is at 84%, how many minutes of video can be watched before the battery is completely drained?
Extend your thinking
20 If a cyclist maintains a speed of 15 km/h, how far will they travel in 45 minutes?
Hint: First, convert the time from minutes to hours.
21 A car travels at an average speed of 95 km/h. Estimate how long it would take to travel 310 km. Then, use a calculator to find the exact time and check whether the estimate is reasonable:
a Estimate the time without using a calculator by rounding the speed to 100 km/h.
b Use a calculator to find the exact time using the given rate.
c Compare the estimate and exact calculation. Comment on whether the estimate was reasonable.
22 A plumber charges a $85 call-out fee plus $95 per hour. If a job takes 2.5 hours, what is the effective hourly rate including the call-out fee?
23 Liam and Noah work at their local supermarket as checkout operators. They both work 8 hours every week. Liam's hourly rate is $21 and Noah's hourly rate is $25. How much more money does Noah earn than Liam each week?
1.05 Percentages
After this lesson, you will be able to…
• calculate percentages of quantities
• solve practical problems requiring the use of percentages, including increases and decreases
Percentages and part of a quantity
Percentages are used to express a part of a whole out of 100. They appear in many real-life situations such as:
• Shopping discounts: 20% off a marked price
• Finance: 5% interest on savings
• Statistics: 60% of people prefer a certain product
• Health and science: 70% alcohol solution, 10% sugar content
25 out of 100 squares are shaded
A percentage represents a part of a whole, specifically a number out of 100. For example, if 25 out of 100 squares are shaded, this represents 25%.
Understanding percentages helps in comparing quantities, calculating increases or decreases, and making informed decisions in everyday and financial contexts.
To find a percentage of a quantity, use the formula:
Percentage of a quantity = × Whole
This involves two main steps:
1. Convert the percentage to a decimal or fraction (by dividing by 100).
2. Multiply this value by the original quantity (the whole).
Example 1
Calculate 15% of $240.
Create a strategy
Convert the percentage to a decimal and multiply by the amount.
Apply the idea
15% of 240 = 0.15 × 240
Convert percentage to decimal and multiply = $36 Evaluate
Reflect and check
The answer is reasonable as 15% is less than one-fifth of the original amount.
Example 2
An investment of $40 is now worth 250% of its original value. What is its current value?
Create a strategy
The most direct method is to first convert the percentage into a decimal. Then, multiply the decimal by the original quantity to find the final value. This is the most efficient way to solve using a calculator.
Apply the idea
Convert 250% to decimal by dividing by 100.
Note that: 250 ÷ 100 = 2.5
250% × 40 = 2.5 × 40
Convert percentage to decimal = $100 Evaluate
Reflect and check
To check the answer mentally, the percentage can be broken down into simpler parts. Notice that 250% is the same as 10 lots of 25%.
Find 25% (a quarter) of $40, which is $10. Then, multiply that by 10. 10 × $10 = $100
This confirms the calculated answer is correct.
Idea summary
A percentage is a part of a whole, expressed as a number out of 100:
1. Convert a percentage to a decimal by dividing by 100 (e.g., 25% = 0.25).
2. To calculate a percentage of a quantity, convert the percentage to a decimal or fraction and multiply it by the quantity.
Percentage increase and decrease
Percentage increase
A rise in a quantity expressed as a percentage of the original quantity.
Example:
If a price of $100 increases to $120, it is a 20% increase.
Percentage decrease
A fall in a quantity expressed as a percentage of the original quantity.
Example:
If a price of $100 decreases to $80, it is a 20% decrease.
A percentage increase or percentage decrease describes how much a value changes relative to its original amount. It can be calculated using the formula:
Percentage change = × 100%
If the new amount is larger than the original amount, the original amount has increased. Therefore, the formula can be rewritten as:
Percentage increase = × 100%
If the new amount is smaller than the original amount, the original amount has decreased. Therefore, the formula can be rewritten as:
Percentage decrease = × 100%
• To increase by n%:
1. Calculate n% of the original amount
2. Add this increase to the original amount
3. Or multiply the original amount by (100 + n)%
• To decrease by n%:
1. Calculate n% of the original amount
2. Subtract this decrease from the original amount
3. Or multiply the original amount by (100 n)%
Interactive exploration
Discover this concept in action online
The decimal multiplier method provides an efficient way to calculate percentage changes in one step:
• For an increase of n%, multiply by 1 +
• For a decrease of n%, multiply by 1 .
To find the original amount when the final amount is known after a percentage change, use reverse percentages. The original amount (the whole) can be found by dividing the final amount (the part) by the decimal equivalent of the final percentage.
Original amount = p
This can be applied to both percentage increases and decreases:
• After an increase of n%, the final percentage is (100 + n)%, so the multiplier is 1 + .
Original amount =
• After a decrease of n%, the final percentage is (100 n)%, so the multiplier is 1 .
Original amount =
Example 3
Determine the percentage multiplier:
a What single percentage can be used to represent an increase of 25%?
Create a strategy
An increase of 25% means the initial 100% of the quantity, plus an additional 25%.
Apply the idea
Add the percentages.
Single percentage = 100% + 25% Write the equation = 125% Evaluate
b What decimal multiplier can be used to represent a decrease of 15%?
Create a strategy
The quantity starts at 100% of its value. To decrease this by 15%, subtract 15% from 100%.
Apply the idea
Subtract the percentages.
Single percentage = 100% 15%
Write the equation = 85%
Decimal multiplier = 0.85
Example 4
Evaluate
Convert the percentage to a decimal
A shop increases the price of a $80 jacket by 25%. Calculate the new price.
Create a strategy
Calculate the increase amount and add it to the original price, or use the decimal multiplier method.
Apply the idea
• Method 1: Calculate and add
Increase amount = 25% of 80
Write the equation = 0.25 × 80
Convert the percentage to decimal = $20 Evaluate
New price = Original price + Amount of increase
Write the equation = 80 + 20
Substitute the values = $100
Evaluate
• Method 2: Decimal multiplier
An increase of 25% is equivalent to finding 125% of the original price or 1.25 × Original price.
This also means: 25% increase multiplier = 1 + = 1.25
New price = Percentage multiplier × Original price
= 1.25 × 80
Write the formula for new price
Substitute the values = $100 Evaluate
The new price is $100.
Reflect and check
The new price is higher than the original, which is expected for a percentage increase.
Example 5
A store offers a 15% discount on a $60 item. What is the sale price?
Create a strategy
Calculate the discount amount and subtract it from the original price, or use the decimal multiplier method.
Apply the idea
• Method 1: Calculate and subtract:
• 15% of 60 = 60 × = $9
• Sale price = 60 9 = $51
• Method 2: Decimal multiplier:
• 15% decrease multiplier = 1 = 0.85
• Sale price = 60 × 0.85 = $51
Reflect and check
The sale price is lower than the original price, which is correct for a discount.
Example 6
The price of a share increased from $50 to $55. Calculate the percentage increase.
Create a strategy
Find the amount of the increase. Then, express this increase as a percentage of the original price.
Apply the idea
Amount of increase: 55 50 = $5
Percentage increase = × 100%
= × 100%
= 0.1
0.1 × 100% = 10%
The percentage increase is 10%.
Reflect and check
Write the equation
Substitute the values
Evaluate
Convert decimal to percentage
A 10% increase on $50 is 0.10 × $50 = $5; therefore, adding this to $50 gives $55, which matches the new price. The answer is correct.
Example 7
A phone is on sale for $450 after a 25% discount. What was the original price of the phone?
Create a strategy
The sale price is the result of a 25% decrease from the original price. Find the original price by reversing this process. Divide the final price by the decimal multiplier for a 25% decrease.
Apply the idea
A 25% decrease means the final price is 100% 25% = 75% of the original price.
The decimal multiplier is 1 = 0.75.
To find the original price, divide the sale price by this multiplier:
Original Amount = p Write the formula for original amount
Original Amount = Use the decimal multiplier = Substitute the values = $600 Evaluate
The original price of the phone was $600.
Reflect and check
Check the answer by applying the discount to the original price. 25% of $600 is 0.25 × $600 = $150.
The sale price is $600 $150 = $450, which matches the price given in the question. Therefore, the answer is correct.
Idea summary
Percentage increase and percentage decrease describe how a value changes relative to its original amount.
• To calculate a new value after an n% increase:
1. Calculate n% of the original, then add it to the original.
2. Multiply the original amount by the decimal multiplier 1 +
• To calculate a new value after an n% decrease:
1. Calculate n% of the original, then subtract it from the original.
2. Multiply the original amount by the decimal multiplier 1 .
• To calculate the percentage change between two values, find the amount of change, divide it by the original amount, and multiply by 100%.
• To find the original amount after a percentage change (reverse percentages), divide the new amount by the decimal multiplier used for the change.
1.05 Practice questions
What do you remember?
1 Complete these statements:
a 40% is the same as ⬚ out of 100 and ⬚ out of 10.
b 25% is the same as ⬚ out of 100 and ⬚ out of 4.
c 60% is the same as ⬚ out of 100 and ⬚ out of 5.
d 90% is the same as ⬚ out of 100 and ⬚ out of 10.
2 Which of these shows how to calculate 20 as a percentage of 50?
× 1
× 100%
3 Ava wants to increase 120 by 40%:
a Convert 40% to a fraction out of 100.
× 50%
b Multiply the answer from part (a) by 120. This is the amount of the increase.
c Determine whether the amount from part (b) should be added to or subtracted from 120. Explain the reasoning.
d What is the final value after increasing 120 by 40%?
4 David wants to decrease 80 by 15%:
a Convert 15% to a decimal.
b Multiply the answer from part (a) by 80. This is the amount of the decrease.
c Determine whether the amount from part (b) should be added to or subtracted from 80.
d What is the final value after decreasing 80 by 15%?
5 Calculate: a 50% of 80 b 20% of 150 c 35% of 200 d 80% of 60 e 5% of 400 f 120% of 50 g 175% of 20 h 200% of 95
6 A meal costs $60. If the tip is 15%, how much is the tip?
7 A collectible action figure, originally purchased for $60, is now valued at 200% of its original price. What is its current value?
8 The number of visitors to a museum this year was 150% of the number of visitors last year. If there were 8000 visitors last year, how many visitors were there this year?
9 Determine the decimal multiplier to increase a quantity by: a 5% b 45%
8.2% d 125%
10 Determine the decimal multiplier to decrease a quantity by:
3% b 25%
11 A water tank contains 80 litres. After a heavy rainfall, the volume of water in the tank increases by 25%:
a What percentage should the initial 80 litres be multiplied by to find the new volume?
b Calculate the new volume of water in the tank.
12 A monthly phone bill is normally $60. Due to extra data usage, the bill increases by 15%:
a What percentage should the original bill be multiplied by to find the new total?
b Calculate the new total of the phone bill.
15 The value of a gold coin was initially $500. After a surge in market demand, its value increased by 8%. Calculate the new value of the coin.
16 A $400 television is on sale with a 25% discount. Calculate the sale price.
17 A shirt priced at $75 is reduced by 20%. Find the sale price.
18 A collectible card was bought for $20 and its value increased to $24. Calculate the percentage increase in its value.
19 A jacket is on sale for $120 after a 20% discount was applied. What was the original price of the jacket?
20 After receiving a 5% pay rise, an employee’s new annual salary is $54 600. What was their original salary before the rise?
Extend your thinking
21 A shop increases its prices by 20% and then offers a 20% discount. A jacket originally cost $100. What is the final price?
22 An item's price is increased by 40% and then decreased by 25%. Express the overall percentage change.
23 A car loses 15% of its value each year. If the car costs $20 000 new, what will it be worth after 3 years?
24 A city is analysing the traffic volume on two major highways, Highway X and Highway Y, before and after a major road improvement project. The traffic volume is measured in vehicles per hour.
Before the road improvement project:
• Highway X had an average traffic volume of 2500 vehicles per hour.
• Highway Y had an average traffic volume of 3200 vehicles per hour. After the road improvement project:
• Highway X now has an average traffic volume of 3750 vehicles per hour.
• Highway Y now has an average traffic volume of 4480 vehicles per hour.
Determine the overall percentage increase in traffic volume for both highways combined after the road improvement project.
INVESTIGATION
Plan a road trip
Plan a hypothetical road trip, using mathematical modelling to create a comprehensive budget.
Objectives
• To formulate a problem by extracting mathematical information from a realworld scenario.
• To use calculations, technology, and computational thinking to model a realworld scenario.
• To communicate findings and justify decisions in a structured format.
Materials
• A computer with internet access
• Spreadsheet software
• Calculator
Part 1: Formulate the problem
The Scenario
Plan your dream road trip
Your first task is to define the scope of your project. You will need to make some key decisions and research some initial data. This process is the first step in mathematical modelling, identifying variables and gathering the necessary information.
Choose your route. Use an online mapping service to plan a road trip. It should have a clear start and end point and be at least 1000 km in total distance. Decide how many days the trip will take.
Gather your data. Research these key variables for your trip. You will need to make some logical assumptions. Record your sources and any assumptions you make.
• Vehicle fuel efficiency: Choose a realistic car for the trip. Find its fuel efficiency in litres per 100 km (L /100 km) or kilometres per litre (km/L).
• Average fuel cost: Research the current average price of fuel per litre in the region you are travelling.
• Accommodation: Decide on your style of accommodation (e.g., camping, motel, hotel) and find an average cost per night.
• Food and activities: Set a reasonable daily budget for food, drinks, and any special activities you want to do along the way.
Investigate
1. Determine your starting point, your destination, and the total distance of your trip in kilometres.
How many days will your trip last?
2. List all the numerical data you gathered (e.g., fuel efficiency, costs). For each value, explain any assumptions you made. For example, "I assumed a fuel price of $1.95/L because this is the current average in my city."
3. Why is it important to state your assumptions when creating a mathematical model?
Part 2: Build the model
Spreadsheet modelling
A spreadsheet is a powerful tool for computational thinking
It allows you to organise your information, perform calculations automatically, and see how changing one variable affects the entire budget. You will now build a spreadsheet to model the total cost of your road trip.
Your spreadsheet should be clearly organised. A good model will have a section for your initial assumptions (variables) and a main section for the daily breakdown of costs. Use formulas to perform all calculations. See the example layout for inspiration.
Road trip budget
Fuel price: $1.85/L Fuel efficiency: 8.5L/100km
1. Set up your spreadsheet: Create a section for your key assumptions (fuel price, efficiency, etc.). Create a main table to break down the costs for each day of your trip.
2. Write your formulas: Use spreadsheet formulas to calculate the costs. The formula for daily fuel cost will depend on the units of your fuel efficiency. For efficiency in km/L, use: = (Daily distance / Fuel efficiency) × Fuel price per litre. For efficiency in L/100km, use: = (Daily distance / 100) × Fuel efficiency × Fuel price per litre. You will also need formulas to calculate daily totals and the grand total for the trip.
3. Test your model: Change one of your initial assumptions (e.g., increase the price of fuel). Do the totals update automatically? If so, your model is working.
Investigate
1. What is the total estimated cost of your road trip according to your model?
2. Write down the exact formula you used to calculate the total fuel cost. Explain what each part of the formula represents.
3. Imagine the price of fuel suddenly increases by 15%. Use your model to calculate the new total cost of the trip. How much more expensive did the trip become?
4. Your friend wants to join you, splitting the costs for fuel and accommodation. How could you adapt your model to calculate the cost per person? Describe the changes you would make.
Discussion
1. How did using a spreadsheet (a form of computational thinking) help you solve this problem more effectively than if you had used only pen, paper and a calculator?
2. What were some limitations of your model? What real-world costs or factors did you not include that could influence the final budget?
3. This investigation involved creating a financial model. Describe another real-world scenario (outside of travel) where building a similar mathematical model would be useful for planning and making decisions.
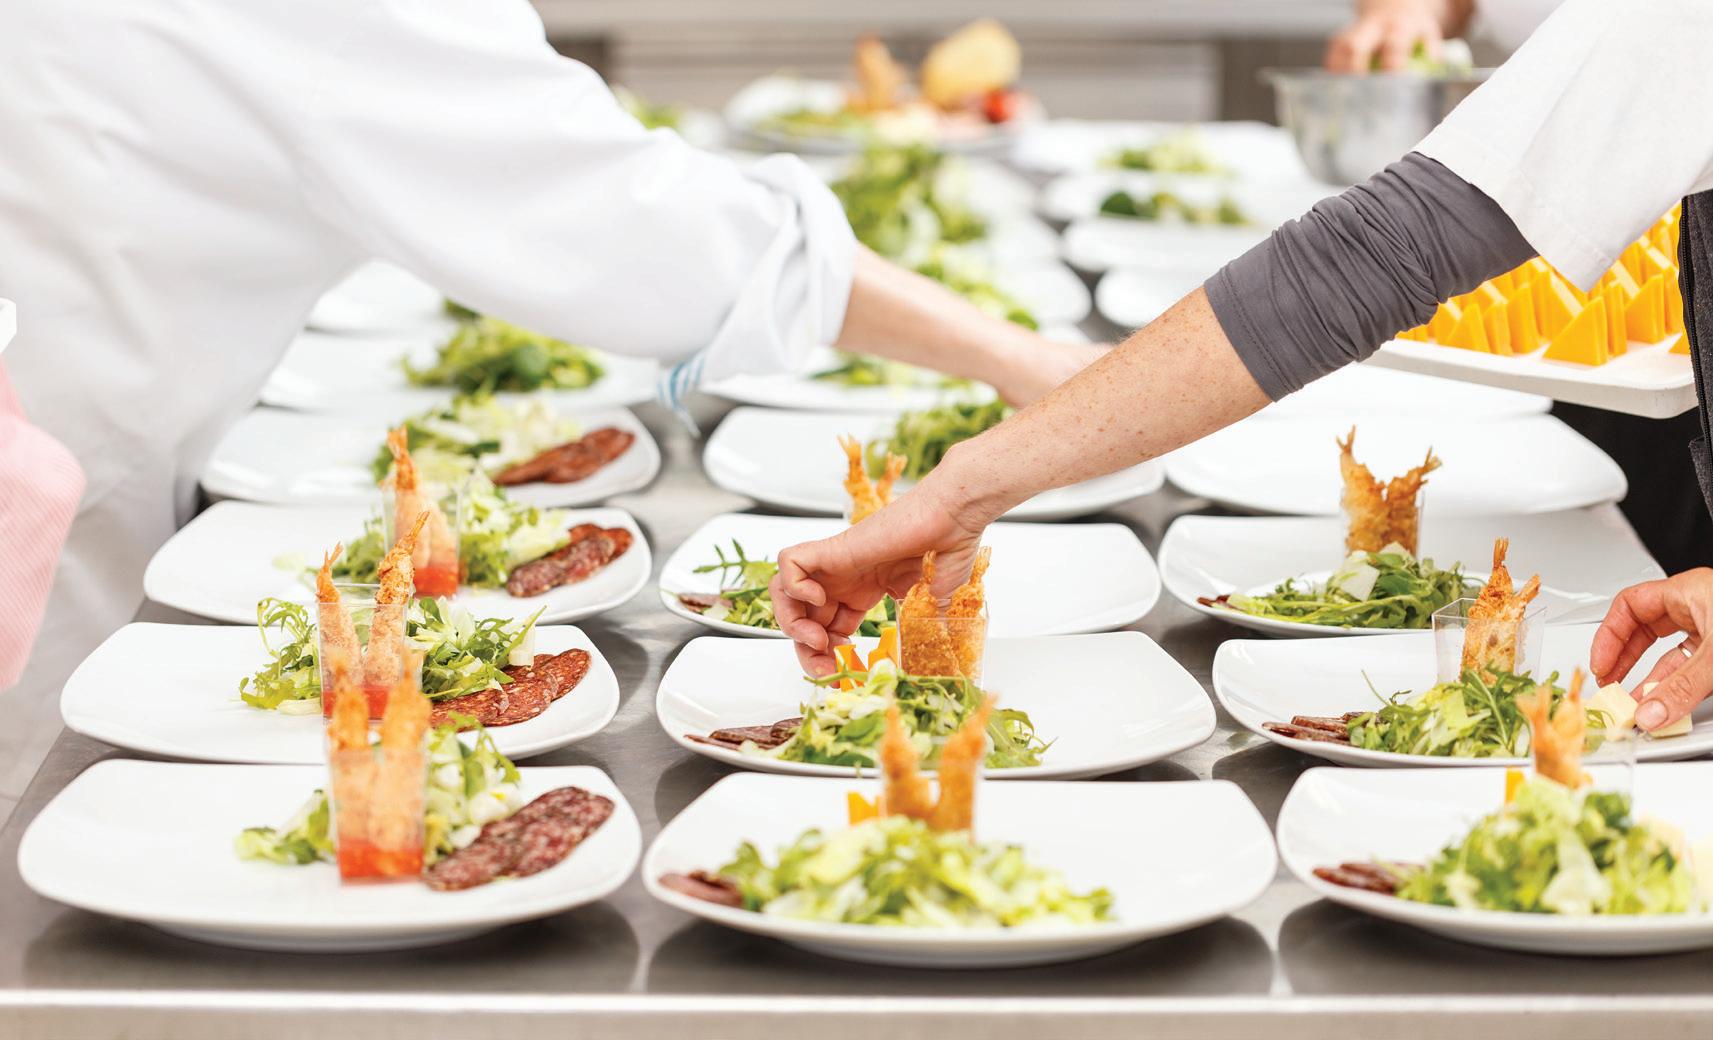
Catering for an event often works like an assembly line. Each plate must contain the same portions so every guest receives an equal serving. This requires careful measurement and consistency across dozens — sometimes hundreds — of dishes. Even small differences in portion size can affect costs and food supply. Maths helps caterers scale recipes accurately while maintaining quality and balance. It also ensures ingredients are used efficiently without unnecessary waste. Behind every perfectly plated dish is careful calculation and planning.
Chapter review
1 In the number 9 471 305, what is the place value of the digit 7?
2 Evaluate: 8 ( 5) × 4 + 2
3 Evaluate 15 + ( 22).
4 Round 5861 to the nearest hundred.
5 Evaluate ( 3)2 × ( 4).
6 Use leading-digit approximation to estimate the value of 5890 ÷ 58.
7 Evaluate:
8 Evaluate:
9 A recipe requires of a 600 g block of chocolate. How many grams of chocolate are needed?
10 Evaluate 18.5 4.2 × 2.5 + 5.75.
11 A cyclist completes 7 laps of a 3.5 km track. What is the total distance the cyclist has covered?
12 In a survey, 18 out of 48 students said they walk to school. Convert this fraction to a decimal and a percentage.
13 A drink is made by mixing cordial and water in the ratio two parts cordial to seven parts water. How much cordial is needed to make a 450 mL drink?
14 A rope 36 metres long is cut into three pieces in the ratio 3 : 4 : 2. Find the length of the longest piece.
15 $540 is to be shared between three people in the ratio 4 : 3 : 2. Calculate each person's share.
16 Express the ratio of 800 g to 2 kg in its simplest form.
17 The scale on a map is 1 : 200 000. What is the actual distance in kilometres if the distance on the map is 4.5 cm?
18 A car travels 450 km in 5 hours. Calculate its average speed in kilometres per hour.
19 A 400 g bag of coffee costs $12.80. A 1 kg bag of the same coffee costs $30.00. Which bag is the better buy? Justify your answer.
20 A train travels at an average speed of 90 km/h. How long will it take to travel 315 km?
21 What is the decimal multiplier for a percentage increase of 6.5%?
22 What is the decimal multiplier for a percentage decrease of 7%?
23 A book priced at $45 is reduced by 30%. Find the sale price.
24 An investment grew from $4000 to $4500. Calculate the percentage increase in the investment.
25 A floor has a length of 4.52 m and a width of 3.81 m. By rounding each dimension to the nearest whole number, calculate the percentage error of the estimated area compared to the actual area. Round your answer to two decimal places.
Did you know?
The abacus is one of the world’s oldest calculation tools, and it’s still used today to develop incredible mental maths skills! By moving beads along rods to represent place value, users can perform addition, subtraction, multiplication, and division with lightning speed. This tactile method helps students in visualising numbers and internalising the base-10 system. In fact, many people who master the abacus eventually perform “mental abacus,” where they calculate complex sums in their heads by simply imagining the movement of the beads. It’s a brilliant way to turn abstract arithmetic into a physical, logical process!
“All results of the profoundest mathematical investigation must ultimately be expressible in the simple form of properties of the integers.”
Leopold Kronecker
Big ideas
• Statistical analysis involves classifying and collecting data, organising it into visual displays, and summarising distributions using measures of centre and spread to reveal patterns and trends.
• Probability quantifies uncertainty by measuring the likelihood of events on a scale from 0 to 1, connecting theoretical predictions with experimental outcomes.
2 Represent and analyse data
Chapter outline
Probability is the maths of ‘maybe’. It does not predict one outcome — it measures how likely outcomes are across heaps of repeats.
2.01 Data types
After this lesson, you will be able to…
• classify data as categorical (nominal or ordinal) or numerical (discrete or continuous)
Categorical vs numerical data
In statistics, a variable refers to any characteristic that can be measured or observed. Data variables can be classified into two main types:
Categorical data
Data represented by words or labels that describe qualities or attributes. Even when numbers are used (like postcodes), they have no mathematical meaning.
Example:
Types of pets, postcodes, car manufacturers
Numerical data
Data represented by numbers that are obtained through counting or measuring. This is also known as quantitative data.
Example:
Temperature measurements, height in centimetres, number of goals scored
Classify each of the data types as categorical or numerical: a Favourite ice cream flavours
Create a strategy
Determine if the data represents a quality described by a word (categorical) or a quantity that can be counted or measured (numerical).
Apply the idea
Favourite ice cream flavours are described using words such as vanilla, chocolate, or strawberry. These are labels that describe a quality. Since these descriptions are not numerical quantities, this is categorical data.
Example 1
b Maximum rainfall
Create a strategy
Consider how rainfall is recorded. If it is a measurement represented by a number where the value represents a quantity, it is numerical.
Apply the idea
Maximum rainfall is measured in units such as millimetres or centimetres. These are numbers that represent a measurable quantity. Therefore, this is numerical data.
c Mobile phone numbers
Create a strategy
Although phone numbers are made of digits, determine whether the sequence represents a mathematical quantity or serves as a unique identifier or label.
Apply the idea
A mobile phone number is a sequence of digits used to identify a specific phone. It would not make sense to perform mathematical calculations like finding the average of a list of phone numbers.
Because the numbers are used as labels, this is categorical data.
Reflect and check
Remember that the presence of numbers alone does not make data numerical — the numbers must represent actual quantities or measurements.
Example 2
A researcher collects these data about students: height in centimetres, eye colour, number of siblings, and postcode. Identify which are categorical and which are numerical.
Create a strategy
Each variable should be assessed to determine whether it represents a measurable quantity or a descriptive category.
Apply the idea
• Height in centimetres: This is measured using numbers that represent actual quantities. Therefore, this is numerical data.
• Eye colour: This is described using words (blue, brown, etc.). Therefore, this is categorical data.
• Number of siblings: This involves counting whole numbers. Therefore, this is numerical data.
• Postcode: Although written as numbers, postcodes are identifiers that do not represent quantities. Therefore, this is categorical data.
Reflect and check
Verify that each classification aligns with whether the data represents actual quantities (numerical) or labels/categories (categorical).
Idea summary
Key points for data classification:
• Categorical data represents qualities or attributes using words or labels.
• Numerical data represents quantities obtained through counting or measuring.
• Numbers can be categorical when used as labels rather than quantities.
• The classification of a variable depends on how the data is used, not just its appearance.
Data subtypes
Categorical and numerical data can be further classified into subtypes:
Nominal data
A type of categorical data where categories do not have a natural or logical order.
Example:
Car brands (e.g., Ford, Toyota), nationalities (e.g., Australian, German)
Ordinal data
A type of categorical data where categories have a natural ranking or order.
A type of numerical data that consists of separate values that are usually counted.
Example:
Number of siblings (0, 1, 2, …); shoe sizes (7, 7.5, 8)
Continuous data
A type of numerical data that can take any value within a given range. It is obtained by measuring.
Example:
Height (175.2cm), temperature (23.5°C)
Example 3
Classify each of these data types: mobile phone numbers, daily rainfall, exam grades, and number of siblings
Create a strategy
Each data type must be assessed based on whether it represents categories or numbers, and then further classified into its specific subtype based on its properties.
Apply the idea
• Mobile phone numbers: Though represented by digits, these serve as labels rather than quantities – Categorical (Nominal)
• Daily rainfall: Measured values that can take any value within a range – Numerical (Continuous)
• Exam grades: Categories with a natural order (e.g., A, B, C, D) – Categorical (Ordinal)
• Number of siblings: Values that are distinct and countable – Numerical (Discrete)
Reflect and check
Each classification is verified by examining whether the data represents categories or quantities, and whether those values are ordered, continuous, or discrete.
Example 4
Determine whether temperature readings taken every hour (°C) and shoe sizes in a store are discrete or continuous data.
Create a strategy
Consider whether each measurement can take any value within a range or only specific distinct values.
Apply the idea
• Temperature readings (°C): Can take any value within a range
Might read 22.4°C or 22.43°C
Classification: Continuous data
• Shoe sizes: Come in specific, distinct sizes
Limited to predetermined values (e.g., 7, 7.5, and 8)
Classification: Discrete data
Reflect and check
The distinction between discrete and continuous data is confirmed by determining whether intermediate values between two given values are possible.
Idea summary
Key points for classifying data subtypes:
• Categorical data comprises nominal (unordered) and ordinal (ordered) subtypes
• Numerical data comprises discrete (countable) and continuous (measurable) subtypes
2.01 Practice questions
What do you remember?
1 Match each data type to its correct description:
a Nominal
b Ordinal
c Discrete
d Continuous
i Numerical data that is counted in distinct values.
ii Numerical data that is obtained through measurement.
iii Categorical data with no order or ranking.
iv Categorical data that can be ranked or ordered.
2 Determine whether these statements are true or false:
a A postcode is an example of numerical data.
b The weight of a person is an example of continuous data.
c The number of students in a class is an example of discrete data.
d Survey responses like ‘Agree’ or ‘Disagree’ are nominal data.
3 Which of these is an example of ordinal data?
A Eye colour (blue, brown, green)
C Height in centimetres
B T-shirt size (small, medium, large)
D Favourite type of music Practice
4
Classify each of these as categorical or numerical data:
a Blood type
c Student ID numbers
5
b Distance travelled
d Number of pets
Classify these data about a car as categorical or numerical:
a Fuel efficiency (km/L)
c Number of seats
b Licence plate number
d Colour
6 Classify the data from these survey responses as nominal or ordinal:
a Satisfaction rating (1-5 stars)
b Favourite colour
c Agreement level (Strongly disagree to Strongly agree)
d Type of transportation used
7 Classify each categorical data type as nominal or ordinal:
a Military ranks
b Hair colours
c Education levels
d Brand names
8 Identify the data type for each variable in a sports competition:
a Jersey numbers
c Medal placement (Gold/Silver/Bronze)
b Race completion times
d Number of fouls
9 Classify each numerical data type as discrete or continuous:
a Time spent exercising
c Weight of a package
b Number of books read
d Number of siblings
10 Determine whether each numerical variable is discrete or continuous:
a Height of plants in centimetres
c Volume of water in a bottle
Extend your thinking
b Number of emails received
d Pages in a book
11 A researcher is studying rainfall patterns. The researcher records:
• Daily rainfall amounts
• Weather conditions (Sunny/Cloudy/Rainy)
• Number of storms per month
• Storm intensity (Mild/Moderate/Severe)
• Time between storms
Classify each measurement and explain why some seemingly similar data points might be classified differently.
12 In a hospital system, patient data includes:
• Body temperature
• Patient ID numbers
• Pain level (1-10)
• Blood pressure
• Number of medications
• Room numbers
Classify each data point and organise them into a hierarchy showing main types and subtypes. Explain any cases where the classification might be debatable.
13 A fitness app collects these data points:
• Steps per day
• GPS coordinates
• Heart rate
• Workout intensity level (Low/Medium/High)
• Exercise types
• Achievement badges
Classify each data type and explain how the same data might be classified differently depending on how it is used or recorded.
2.02 Data collection
After this lesson, you will be able to…
• identify methods of data collection (e.g., survey, observation)
• understand the purpose of a sample versus a census
Methods of data collection
Exploration
Consider how information could be gathered to answer these research questions:
1. Which subject is the most popular among Year 12 students?
2. Do more cars turn left or right at a specific intersection?
3. Does a new type of fertiliser make tomato plants grow faster than standard fertiliser?
Think about the differences in how the data would be obtained for each scenario.
1. For which question would people need to be asked directly?
2. For which question would events need to be watched and recorded without interfering?
3. For which question would a test need to be set up to compare results?
Data collection is the process of gathering information to answer a question. The chosen method depends on what information is required. There are four primary methods for obtaining data.
1. Survey: A method of collecting data by asking a group of people questions, either in person, on the phone, or on paper.
• A questionnaire asking students to rate the school canteen
• An online poll asking people their favourite type of movie
2. Observation: A method of collecting data by watching and recording actions or events as they occur, without interference.
• Tallying the colours of cars that pass the school gate in one hour
• Recording how many people use the recycling bin versus the rubbish bin in a park
3. Experiment: A method where a researcher changes one variable to observe its effect on another variable in a controlled environment.
• Testing which brand of paper towel absorbs the most water
• Growing one set of plants with a special fertiliser and another set without it to compare their growth
4. Existing records (Secondary data): A method involving the use of data that has already been collected by someone else from other sources.
• Using weather data from the Bureau of Meteorology (BOM) website for a report
• Using census data from the Australian Bureau of Statistics (ABS) to learn about the population of a town
Example 1
Identify the method of data collection used for each scenario (Survey, Observation, Experiment, or Existing records):
a A student sits by the road and records the number of passengers in each passing car.
Create a strategy
Read each scenario carefully and match it to the definition of the data collection method that best describes how the information was gathered.
Apply the idea
This is an observation because the student is watching and recording without interfering.
b A company emails a questionnaire to its customers to ask about their satisfaction with a recent purchase.
Apply the idea
This is a survey because the company is asking questions to gather opinions.
c A researcher uses data from the Australian Institute of Health and Welfare to analyse health trends over the last decade.
Apply the idea
This uses existing records because the data was previously collected by another organisation.
d A pharmaceutical company gives a new medicine to one group of patients and a placebo to another group to test the medicine’s effectiveness.
Apply the idea
This is an experiment because the company is actively changing a condition (giving a medicine) to a group to test its effect.
Reflect and check
The key difference between observation and experiment is interference. An observation involves watching without interference, while an experiment involves actively changing something to see what happens.
Idea summary
There are four main methods of data collection:
• Survey: Asking questions.
• Observation: Watching and recording.
• Experiment: Testing a change under controlled conditions.
• Existing records (Secondary data): Using data that someone else has already collected.
The best method depends on the research question being asked.
Sample vs census
When collecting data, it is important to define the group of interest. Data can be collected from an entire group or just a part of it.
Population
Every member within a specified group of interest.
Census
A method that involves collecting data from every member of the population.
Sample
A smaller, representative group selected from the population.
Census Advantages
Provides complete and accurate information
Census Disadvantages
High cost and resource requirements
Sample Advantages
Sample Disadvantages
Usually more costeffective and timeefficient May not be fully representative
Eliminates sampling error Time-consuming to implement Faster data collection May result in sampling error
Suitable for small populations May be impractical for large populations
Practical for large populations Requires careful selection methods
Example 2
A school has 1200 students. The principal wants to determine the proportion of students who bring their own device (BYOD) to school. A survey of 300 randomly selected students finds that 240 bring their own device.
Estimate how many students in the entire school bring their own device.
Create a strategy
The proportion found in the sample can be used to estimate the proportion in the population. Multiply the total population by the sample proportion to estimate the total number of students.
Apply the idea
Sample proportion = = 0.8
Estimated number in whole school = 1200 × 0.8 = 960
Reflect and check
The estimate of 960 students is reasonable as it represents the same proportion (80%) as found in the sample. Note: This is an estimate. The actual number might be slightly different because only a sample of students was surveyed.
Example 3
For each scenario, determine whether a census is required or if a sample would be appropriate: a Counting the number of students in each class for the school register.
Create a strategy
Consider the size of the population, required accuracy, and practical constraints for each scenario to determine the appropriate method.
Apply the idea
A census is required because:
• Complete accuracy is essential for school records.
• The population is relatively small and defined.
• All students must be accounted for.
b Measuring customer satisfaction at a large retail chain.
Apply the idea
A sample is appropriate because:
• The population is very large.
• Perfect accuracy is not required.
• Cost and time constraints make a census impractical.
Reflect and check
The choice between census and sample depends on balancing accuracy requirements with practical constraints.
Idea summary
A census collects data from every member of a population.
A sample collects data from a subset of the population.
A census provides complete accuracy but is costly and time-consuming.
Samples are more efficient but may have sampling error. The choice between a census and a sample depends on the population size, the required accuracy, and the available resources.
2.02 Practice questions
What do you remember?
1 Complete the sentences using these terms: Survey, Observation, Experiment, Existing records.
a Watching events without interfering is called an ⬚.
b Asking people questions to gather their opinions is a ⬚
c Using data from the Australian Bureau of Statistics is an example of using ⬚.
d Testing how a change to one variable affects another is an ⬚
2 Match each term to its correct definition:
a Population
b Sample
c Census i A smaller group selected from the population.
ii Collecting data from every member of the population.
iii The entire group of people or items being studied.
3 Determine whether each statement is true or false:
a Conducting a census is usually cheaper and faster than taking a sample.
b An observation involves the researcher changing a condition to see what happens.
c A sample is a smaller group selected from the population.
d A census is the most practical method for a very large and widespread population.
Practice
4 For each scenario, identify the data collection method used (Survey, Observation, Experiment, or Existing records):
a A biologist observes and tracks a flock of birds to study their migration patterns.
b A town council uses Australian Bureau of Statistics data to plan for future services.
c A fast-food chain gives customers a QR code on their receipt to answer questions online about their dining experience.
d To test the effectiveness of a new fertiliser, a farmer plants two identical fields of corn. One field is treated with the new fertiliser, and the other is not. The crop yield from both fields is then compared.
e A food scientist measures the sweetness of different apple varieties by assigning each a score.
f A council checks every household’s recycling bin for contamination.
g A cafe asks customers to fill out a comment card about their experience.
h A student uses historical weather data from the Bureau of Meteorology website for a report.
5 A university library conducted a sample survey of 200 students out of 2000 total students. If 160 students in the sample reported using online resources, estimate the number of students in the total population who use online resources.
6 In a city with 40 000 registered voters, a pre-election poll samples 500 voters. Of these, 280 say they will vote for Candidate A. Estimate the total number of votes Candidate A is likely to receive in the election.
7 A local council surveys 150 residents out of a total population of 3000. If 90 of the surveyed residents support a new park, estimate how many residents in the total population support the park.
8 In a factory producing 10 000 light bulbs, a sample of 200 is tested, and 4 are found to be faulty:
a Estimate the total number of faulty bulbs likely to be in the entire batch.
b Explain why conducting a census (testing every bulb) would be impossible or impractical in this context.
9 For each scenario, identify whether a census or a sample would be more appropriate and explain why:
• Taking attendance at a school assembly.
• Surveying movie preferences at a national cinema chain.
Extend your thinking
10 A school’s P&C committee wants to decide whether to spend its funds on new library books or new sports equipment. Propose a suitable data collection method and justify its appropriateness.
11 A snack company wants to find out if Australian high school students prefer their new brand of chips. They conduct a survey by asking students who are leaving a single, large public school in a major city. Identify and explain two potential issues with this data collection plan that might lead to biased results.
12 A researcher wants to determine if people wash their hands after using a public toilet. Compare these two methods and determine which would provide more accurate data, explaining your reasoning.
• Method A (Survey): Posting a questionnaire online asking people if they wash their hands.
• Method B (Observation): Standing unobtrusively in the toilet and recording whether people wash their hands.
2.03 Display categorical data
After this lesson, you will be able to…
• construct and interpret frequency tables and bar charts for categorical data
• choose appropriate displays for data type/scale and purpose
Frequency distribution tables
Frequency distribution table
A table that organises data by listing categories or labels and showing the number of times (frequency) each one occurs.
A frequency distribution table is a systematic way to organise and display data. It usually includes three components:
• Categories or labels of the data
• Tally marks to track occurrences (optional)
• Frequency counts showing total occurrences
When constructing frequency tables for categorical data:
1. List all distinct categories in the first column.
2. Record each data point using tally marks (optional).
3. Count the tallies to determine the frequencies.
4. Include a total row at the bottom.
The choice between frequency tables and bar charts should align with the purpose of the data display:
Display type
Best used for
Frequency tables Precise frequency counts and summary of data
Bar charts Visual comparisons, identifying patterns quickly
Example 1
This data shows the types of pets adopted from an animal shelter in one week: Dog, Fish, Cat, Fish, Bird, Fish, Dog, Bird, Cat, Fish, Bird, Fish, Rabbit
Construct a frequency distribution table for this data.
Create a strategy
Create a three-column table listing pet types, tally marks, and frequencies. Record each data point with a tally mark in the appropriate category, then count the tally marks to determine the frequencies.
Apply the idea
Reflect and check
Verify that the total frequency (13) matches the total number of data points in the original list.
A survey recorded students’ favourite colours: Blue, Red, Green, Blue, Yellow, Blue, Red, Green, Blue, Yellow, Blue, Red
Construct a frequency table and determine which colour is most popular.
Create a strategy
Organise the data into a frequency table with columns for colour, tally marks, and frequency counts. Compare frequencies to identify the most common response.
Example 2
Apply the idea
Since Blue has the highest frequency (5), it is the most popular colour.
Reflect and check
The total frequency of 12 matches the total number of responses in the original data set.
Example 3
A teacher has a list of 30 students’ birth months and wants to quickly see if the birthdays are spread evenly throughout the year or if some months are more common. Would a frequency table or a bar chart be more suitable for this purpose? Explain your choice.
Create a strategy
Consider the teacher’s goal of obtaining a quick visual overview of the distribution. Think about which display type excels at showing patterns and comparisons at a glance.
Apply the idea
A bar chart would be more suitable.
While a frequency table would accurately list the number of birthdays per month, the teacher’s goal is to quickly see the distribution and identify patterns. A bar chart provides an immediate visual comparison of the frequencies for each month, making it easy to identify which months are the most or least common just by looking at the heights of the bars.
Reflect and check
The most important factor is the purpose of the data display. For precise numbers and data entry, a frequency table is excellent. For visual analysis and communicating a pattern to an audience, a bar chart is often the better choice.
Idea summary
Key points about using frequency distribution tables:
• Organising data into categories with corresponding frequencies.
• An optional tally column helps track counts accurately.
• Including a total row to verify that all data is accounted for.
• Most effective for providing precise counts and summaries.
• Converting data to bar charts for visual display.
Bar charts
Bar charts are used to visually compare the frequencies or values of different categories in data.
Bar chart
A chart that uses vertical bars of equal width to show comparisons among categories. The height of each bar represents the frequency or value for that category.
It usually includes three components:
• For categorical data, gaps are placed between bars to show distinct categories.
• The horizontal axis shows the categories or values.
• The vertical axis shows the frequency scale (counts or percentages).
Essential elements of bar charts include:
• A clear, descriptive title
• Clearly labelled axes with appropriate scales
• Equal bar widths with consistent spacing
• Bar heights must precisely match data values
This bar chart displays the pet adoption data. Notice the clear title, labelled axes, and equally spaced bars whose heights correspond to the frequency of each pet type.
Dog Cat Fish Bird Rabbit
Exploration
Examine these two displays of data for vehicle colours passing through an intersection:
Consider which display makes it easier to:
1. Find the most common vehicle colour.
2. Compare frequencies between different colours.
3. Calculate the total number of vehicles observed.
Sneaker brands utilise side-by-side bar charts to compare the popularity of different shoe models across various global cities. By analysing these categorical datasets, companies can identify regional trends and ensure that the most popular styles are stocked in the specific locations where they are trending.
Example 4
A store recorded t-shirt sizes sold over one week: S (15), M (25), L (20), XL (10)
Construct a bar chart to display this data.
Create a strategy
Follow these specific steps to create the bar chart:
1. Draw and label the horizontal axis with size categories.
2. Create a vertical axis with a scale to accommodate the highest frequency (25).
3. Draw equal-width bars to represent each frequency.
4. Add a title and axis labels.
Apply the idea
Following the steps to create and label the axes and drawing the bars for each size results in this chart:
Reflect and check
Verify that the bar heights match the frequency values and the spacing between bars is consistent. Confirm that the axis scale allows all frequencies to be read clearly.
A bar chart shows the results of a survey asking Year 7 students about their favourite type of movie: Favourite movie genre
a Which movie genre is the most popular?
Create a strategy
To find the most popular genre, look for the tallest bar on the chart. This category has the highest frequency.
Apply the idea
The tallest bar corresponds to Comedy, with a frequency of 15. Therefore, Comedy is the most popular genre.
b How many students chose Action or Sci-Fi?
Create a strategy
Read the frequency (height) of the Action bar and the Sci-Fi bar from the vertical axis. Then, add these two values together.
Apply the idea
Read the frequencies for the two genres from the chart:
• Action: 12 students
• Sci-Fi: 8 students
Add them together: 12 + 8 = 20
A total of 20 students chose Action or Sci-Fi.
c How many students were surveyed in total?
Create a strategy
To find the total number of students surveyed, read the frequency for each of the four categories and add all the frequencies together.
Always double-check that the scale on the vertical axis is being read correctly. For example, the bar for Comedy is halfway between 14 and 16, so its value is 15. This ensures the frequencies are accurate before any calculations are performed.
Idea summary
Key points for creating effective bar charts:
• Include a clear title and labelled axes.
• Use consistent bar widths and ensure there are clear gaps between the bars.
• Choose an appropriate scale for the vertical axis to represent the data accurately.
• Ensure bar heights precisely match the frequencies of each category.
• List categories in a logical order (alphabetical, frequency, or natural order for ordinal data).
2.03 Practice questions
What do you remember?
1 Complete the sentences about frequency tables using the words: tally, total, frequency
a A frequency table lists data categories and their corresponding ⬚
b An optional ⬚ column helps to count data accurately.
c The sum of the frequencies should equal the ⬚ number of data points.
2 A teacher wants to quickly see the most popular subject in a class by looking at a graph. Which display would be most suitable for this purpose?
A A frequency table B A raw list of data C A bar chart D A tally table
3 Determine whether each statement about bar charts is true or false:
a All bars in a bar chart must have the same width.
b The gaps between the bars indicate that the data is continuous.
c The height of each bar represents the frequency of that category.
d A bar chart does not need a title if the axes are labelled.
Practice
4 Students were asked about their favourite sport. The results were: Football, Basketball, Tennis, Football, Swimming, Basketball, Tennis, Football, Swimming, Football, Basketball
Construct a frequency distribution table for this data.
5 This data shows ice cream flavours sold in one day: Vanilla, Chocolate, Strawberry, Vanilla, Mint, Chocolate, Vanilla, Strawberry, Chocolate, Vanilla, Mint
Construct a frequency table and determine the most popular flavour.
6 For each scenario, would a frequency table or bar chart be more appropriate? Explain why.
a Showing monthly sales figures to company shareholders.
b Recording detailed inventory counts of different products.
c Comparing population sizes of different cities.
7 Construct a bar chart to display this data about favourite colours in a class: Red (8 students), Blue (12 students), Green (6 students), Yellow (4 students)
8 Given this data set of pets in a neighbourhood, calculate the total number of pets and identify the most common pet:
Dogs (15), Cats (12), Fish (8), Birds (5), Hamsters (3)
9 This bar chart shows the results of a survey asking students about their favourite after-school activity:
a Which activity is the most popular?
b Determine the number of students who chose Gaming as their favourite activity.
c How many more students chose Sport than Reading?
d How many students were surveyed in total?
10 This data shows students’ grades: A(8), B(12), C(15), D(7), F(3)
Construct both a frequency table and a bar chart to display this data.
11 A survey recorded transportation methods used to travel to school: Bus (15), Car (22), Walk (8), Bicycle (5)
Construct a bar chart and calculate what percentage of students use each method.
Extend your thinking
12 A school wants to track both the number of students participating in each sport and their performance levels (Beginner, Intermediate, Advanced). Propose and describe an appropriate way to display this data and explain your choice.
13 In a survey regarding favourite fruits, 150 responses were collected. The results are shown: Apples (45), Bananas (30), Oranges (25), Grapes (20), Others (30)
Construct a bar chart and calculate the relative frequency of each category as a decimal, rounded to two decimal places.
14 A researcher created this frequency table based on reading habits data:
35
Examine the frequency table and identify any mathematical inaccuracies, and explain how to correct them.
2.04 Display numerical data
After this lesson, you will be able to…
• construct and interpret dot plots, stem plots, histograms, and frequency tables for numerical data
• choose appropriate displays for data type/scale and purpose
Dot plots and stem plots
Dot plot
A graphical display showing the distribution of discrete numerical data. Each data value is represented by a dot positioned above a horizontal axis, with dots stacked vertically when values are identical.
Stem plot
Also known as a stem-and-leaf plot, this display organises numerical data by separating each value into two parts: a stem (the leading digits) and a leaf (the final digits). For example, in the number 43, 4 is the stem and 3 is the leaf. (e.g., Key: 4∣3 = 43)
Key features of dot plots include:
• Best suited for small to medium data sets
• Effectively shows data spread, gaps, and outliers
• Requires an evenly spaced horizontal scale
• Values are plotted on a horizontal scale that increases from left to right
Key features of stem plots include:
• Stems are listed in ascending order
• Leaves are arranged horizontally in ascending order
• A vertical line separates stems from leaves
• A key indicates how to interpret the values
Dot plots and stem plots can be interpreted to identify the overall shape of the data distribution, such as symmetry (where data is balanced around the centre) or skewness (where data is bunched to one side with a long ‘tail’ on the other).
Example 1
The quiz scores for a class are: 65, 72, 65, 68, 72, 75, 68, 65, 70, 72
a Create a dot plot for these quiz scores.
Create a strategy
First, organise the data in ascending order (from smallest to largest). Then, plot each value as a dot above a horizontal axis, stacking dots for repeated values.
2. Create a horizontal axis that includes all values from 65 to 75.
3. Plot a dot for each data value above its corresponding number on the horizontal axis. Stack dots vertically for repeated values.
The final dot plot is:
65 68 70 72 75
Test scores
Reflect and check
The dot plot reveals that 65 and 72 are the most frequent scores, each occurring three times.
b Using the dot plot, determine the range of the quiz scores.
Create a strategy
Use the formula: Range = Maximum Minimum.
Apply the idea
The range is the difference between the highest (maximum) and lowest (minimum) scores. Range = Maximum Minimum Write the formula = 75 65
Substitute the values = 10 Evaluate
The range of the quiz scores is 10.
Example 2
Consider these temperatures (in °C): 23, 25, 28, 31, 24, 27, 26, 29, 25, 30
a Create a stem plot for the data.
Create a strategy
Separate each value into a stem (tens digit) and a leaf (ones digit), then arrange the leaves in ascending order for each stem.
Apply the idea
1. Sort the data in ascending order: 23, 24, 25, 25, 26, 27, 28, 29, 30, 31
2. Identify the stems (tens digits) and leaves (ones digits). The stems are 2 and 3.
3. Write the stems vertically. For each stem, write the corresponding leaves horizontally in ascending order.
4. Include a key to explain how to read the plot.
The completed stem plot is:
b How many days had a temperature above 28°C?
Create a strategy
Look for values in the stem plot that are greater than 28.
Apply the idea
In the ‘2’ stem row, the leaf ‘9’ represents 29.
In the ‘3’ stem row, the leaves ‘0’ and ‘1’ represent 30 and 31. There are 3 days with temperatures above 28°C.
Idea summary
• Dot plots display discrete numerical data using stacked dots above a horizontal scale.
• Stem plots separate values into stems and leaves, preserving individual data points. Always include a key with units to show how to read the plot (e.g., 2∣3=23 °C).
Both displays are effective for small to medium data sets. Both methods reveal patterns, clusters, and potential outliers in the data.
Histograms
Histogram
A statistical display used to represent the distribution of continuous numerical data or grouped discrete data. Unlike bar charts, which have gaps between columns, histograms use adjacent columns to represent continuous intervals of a numerical data set.
Key features of histograms:
• The horizontal axis represents a continuous numerical scale showing class intervals.
• Columns have no gaps between them to represent continuous data.
• The height of each column represents the frequency (when intervals are of equal width).
• Class intervals must be of equal width with no overlaps or gaps.
• Numerical values are marked at the boundaries (edges) of each column on the horizontal axis.
To construct a grouped frequency table for histogram data:
1. Determine appropriate class intervals of equal width.
2. Record the frequencies for each interval.
3. Ensure every data value belongs to exactly one interval.
4. Calculate the frequency for each interval and ensure the overall total matches the number of data points collected.
Class intervals can be written in different forms:
• [20, 25) means greater than or equal to 20 and less than 25.
• 20 ≤ x < 25 shows the same interval in inequality notation.
• 20 25 conventionally implies that the lower bound is included and the upper bound is excluded.
Example 3
The total sales (in dollars) for a small cafe were recorded over 24 consecutive days. The results are shown:
Construct a grouped frequency table with class intervals of width $30, starting with the interval $300 ≤ x < $330.
Create a strategy
Create class intervals of width $30, starting from 300 ≤ x < 330. Then, count the number of days whose sales fall into each interval and organise the data in a frequency table.
Apply the idea
The class intervals are
300 ≤ x < 330, 330 ≤ x < 360, 360 ≤ x < 390, 390 ≤ x < 420, 420 ≤ x < 450, 450 ≤ x < 480, and 480 ≤ x < 510.
The completed frequency table is:
Reflect and check
The total frequency equals 24, confirming all data points are included. The intervals are of equal width with no gaps or overlaps.
This frequency table shows the height distribution of 30 students:
a Construct a histogram to display this data.
Create a strategy
Plot the class intervals on the horizontal axis and frequencies on the vertical axis, ensuring columns are adjacent with no gaps.
Apply the idea
1. Draw and label the horizontal axis for ‘Height (cm)’ and the vertical axis for ‘Frequency’.
2. Mark the class intervals on the horizontal axis (150, 155, 160, 165, 170, 175, 180, 185, and so on).
3. Scale the vertical axis to accommodate the highest frequency, which is 10.
4. For each class interval, draw a column with a height corresponding to its frequency. Ensure that there are no gaps between the columns.
5. Add a clear title to the histogram.
b Identify the class interval with the highest frequency.
Create a strategy
Locate the tallest column in the histogram.
Apply the idea
The tallest column corresponds to the class interval 170 ≤ x < 175 cm, which has the highest frequency (10).
Idea summary
Histograms represent continuous or grouped data with adjacent columns.
• Class intervals must be of equal width with no gaps or overlaps.
• Frequency tables organise grouped data before creating histograms.
• Column heights represent frequencies when intervals are of equal width.
• Numerical values are marked at the column boundaries on the horizontal axis.
Choosing the right display
Choosing the right way to display data is crucial for clearly communicating its story. The best choice depends on the type of data, the size of the data set, and what features the display aims to highlight.
Display Best for...
Dot plot
Stem plot
Small data sets with discrete numerical data
Small to mediumsized numerical data sets
Histogram
Medium to large data sets and continuous numerical data
Advantages
Shows every individual data point
Easy to see clusters, gaps, and outliers
Preserves all individual data values while showing the shape of the distribution
Excellent for showing the overall shape, spread, and central tendency of the data Handles large ranges well
Disadvantages
Becomes cluttered and hard to read with large data sets or a wide range of data
Can be cumbersome for data with many digits or very large data sets
Individual data values are lost because data is grouped into intervals
Example 5
For the student heights data presented in the previous section (30 data points ranging from 152 cm to 182 cm), which display—a dot plot, a stem plot, or a histogram—is most appropriate? Justify your answer.
Create a strategy
To choose the best display, evaluate how effectively each display represents the characteristics of the height data: its size (30 points), type (continuous), and range (30 cm).
Apply the idea
• Dot plot: With a range from 152 to 182, the horizontal axis would need to be very wide to show each individual centimetre. This would make the plot spread out and potentially difficult to interpret. It is not ideal for this data.
• Stem plot: A stem plot could work. The stems would be the tens and hundreds digits (15, 16, 17, 18) and the leaves would be the units digits. This would preserve all data values and show the distribution. However, with 10 values in the 170s, one row of leaves might become long.
• Histogram: A histogram is an excellent choice. The data is continuous (height), and the data set size (30) is large enough to benefit from grouping. A histogram clearly and compactly shows the shape of the distribution, making it easy to see that most students’ heights are in the 165 ≤ x < 180 cm range.
Conclusion: A histogram is the most appropriate display. It effectively summarises a medium-sized, continuous data set and clearly reveals the shape and centre of the distribution.
Reflect and check
While a stem plot is a possible option, a histogram provides a cleaner summary for this type of data. The choice of display often involves a trade-off between showing individual data points and providing a clear overview of the entire data set.
Idea summary
The choice of data display depends on the data set’s size, type (discrete or continuous), and purpose.
• Dot plots are best for small, discrete data sets where preserving individual data points is important.
• Stem plots are good for small to medium data sets, as they show shape while retaining original values.
• Histograms are ideal for large, continuous data sets to show the overall distribution shape.
2.04 Practice questions
What do you remember?
1 Match each type of plot to its main purpose:
a Dot plot
b Stem plot
c Histogram
2 Determine whether each statement is true or false:
a A histogram is used to display categorical data.
i Best for showing the shape of large, continuous data sets by grouping data into intervals.
ii Best for showing the frequency of individual values in a small, discrete data set.
iii Organises data to show the distribution’s shape while keeping all original data points.
b A stem plot must always include a key to explain how to read it.
c A dot plot is the best choice for displaying a data set with over 500 data points.
d The columns in a histogram have no gaps to show that the data is continuous.
3 A researcher has collected the heights of 500 adults. Which is the most appropriate display for this data?
A Dot plot B Stem plot C Histogram D Bar chart
Practice
4 The quiz scores for a class are: 85, 82, 85, 88, 90, 82, 85, 88, 82, 90
a Construct a dot plot for the quiz scores.
b Using the dot plot, determine the range of the scores.
5 Consider these temperatures (in °C): 12, 15, 18, 11, 16, 19, 13, 17, 14, 15
a Construct a stem plot for these temperatures (in °C).
b How many days had a temperature above 15°C?
6 This data shows the daily commute times (in minutes) of 20 employees: 22, 18, 31, 25, 16, 29, 20, 24, 33, 27, 21, 19, 26, 23, 30, 15, 28, 26, 24, 25
Construct a grouped frequency table using inequality notation with class intervals of width 5 starting at 15.
7 This frequency table shows the weights (in kg) of 20 packages:
a Construct a histogram to display this data.
b Identify the class interval with the highest frequency.
8 This histogram shows the time (in minutes) a group of students took to complete a maths puzzle:
a Which interval has the highest frequency?
b How many students took part in the puzzle challenge in total?
c How many students completed the puzzle in less than 10 minutes?
9 This histogram shows the ages of people attending a community fair:
community fair
a Describe the shape of the distribution shown in the histogram. For example, are the data values spread out evenly, or are they clustered more on one side?
b Explain what this shape indicates about the ages of people at the fair.
10 For a data set showing student quiz scores (ranging from 0 to 100), which display would be most appropriate: dot plot, stem plot, or histogram? Justify the choice.
11 Construct a dot plot for these running times (in minutes): 22, 25, 22, 24, 26, 23, 25, 24, 22, 23
12 Construct a stem plot for these quiz scores: 92, 85, 88, 95, 87, 91, 86, 89, 93, 90
Extend your thinking
13 A teacher wants to compare two classes’ test results using the same scale.
• Class A has 15 students with scores: 65, 70, 75, 75, 80, 80, 80, 85, 85, 85, 90, 90, 95, 95, 95
• Class B has 25 students with scores ranging from 65 to 95.
Identify which type of comparative display would be best for this data and explain your choice.
14 Construct a display to show monthly rainfall data (in mm) over two years:
Explain the choice of display type and the reasoning.
15 A data set shows the number of daily steps taken by 50 people, ranging from 2000 to 12 000 steps. Some participants recorded their steps rounded to the nearest 1000, others to the nearest 100, and some to the exact number.
Discuss a method for handling this inconsistency in data recording when creating a display.
2.05 Measures of centre
After this lesson, you will be able to…
• calculate and interpret the mean, median, and mode for numerical data sets
Mean
Mean
A measure of centre that represents the average value in a data set. It is calculated by adding all the values in the data set and then dividing by the number of values.
Example:
For the data set 2, 3, 7, the sum is 12. Since there are 3 values, the mean is 12 ÷ 3 = 4.
To calculate the mean of a data set:
• Add all values in the data set.
• Divide by the total number of values. is the mean (pronounced ‘x-bar’) is the symbol used to represent the mean
Example 1
Calculate the mean of these daily maximum temperatures: 25°C, 27°C, 24°C, 26°C, 28°C
Create a strategy
Calculate the mean ( ) by summing all the daily maximum temperatures and dividing the total by the number of days (n).
Apply the idea
Sum of temperatures = 25 + 27 + 24 + 26 + 28
Write the equation = 130
Evaluate
Write the formula =
Substitute the values = 26°C
Evaluate
Reflect and check
The mean temperature of 26°C is reasonable as it falls within the range of the given temperatures, representing the arithmetic average value.
Example 2
Calculate the mean score for these test results: 85, 92, 78, 95, 88, 82
Create a strategy
Sum all scores and divide by the total number of scores.
Apply the idea
Reflect and check
Write the formula = Substitute the values =
Sum the numerator = 86.7
Evaluate and round
The mean of 86.7 is reasonable as it falls between the minimum score of 78 and the maximum score of 95.
Idea summary
The mean is calculated by adding all values and dividing by the number of values. The formula for the mean is
The mean represents a typical or average value in the data set. The mean is sensitive to outliers and extreme values, meaning a single very large or very small value can significantly affect its measure.
Median and mode
The median and mode are statistical measures that help describe the central tendency of numerical data sets. The median represents the middle value when data is arranged in order, while the mode identifies the most frequent value.
Median
The middle value in a data set that has been arranged in numerical order.
Example:
For the ordered data set 2, 5, 8, 11, 15, the median is 8.
Mode
The value that appears most frequently in a data set. A data set can have one mode, more than one mode, or no mode.
Example:
For the data set 3, 5, 5, 6, 8, the mode is 5.
To find the median:
1. Arrange all values in ascending order.
2. For an odd number of values, select the middle number.
3. For an even number of values, take the mean of the two middle numbers.
A data set can have:
• One mode (unimodal)
• Multiple modes (multimodal)
• No mode (if all values occur exactly once)
Example 3
Determine the median and mode of these quiz scores: 65, 72, 72, 75, 78, 78, 80, 85
Create a strategy
To find the median, determine if the data set contains an odd or even number of values. To find the mode, identify the frequency of each value.
Apply the idea
Median calculation:
• The data is already in order. There are 8 values (even).
• The middle position is between the 4th and 5th values.
• Median = = 76.5
Mode identification:
• The value 72 appears twice.
• The value 78 appears twice.
• The data is bimodal with modes 72 and 78.
Reflect and check
The median of 76.5 represents the middle value or the central value of the ordered data, while the two modes 72 and 78 indicate the most frequently occurring scores in the data set.
Example 4
Determine the median and mode for this data set: 23, 25, 25, 26, 27
Create a strategy
To find the median, locate the middle position within the five values. To find the mode, identify any repeated values.
Apply the idea
Median calculation:
• The data has 5 values (odd).
• The middle position is the 3rd value.
• Median = 25
Mode identification:
• Only 25 appears more than once.
• Mode = 25
Reflect and check
The median of 25 represents the central value, while the mode of 25 shows the most frequent value.
Idea summary
The median represents the middle value in an ordered data set.
• For even-numbered data sets, the median is the mean of the two middle values.
The mode represents the most frequent value(s) in a data set.
• A data set can have one mode, multiple modes, or no mode.
Unlike the mean, the median is not easily affected by outliers (extremely high or low values).
Choose the best measure of centre
The mean, median, and mode each describe the centre of a data set in a different way. The best measure to use depends on the shape of the data and whether there are any extreme values, known as outliers. An outlier can significantly affect the mean, while the median is less affected.
Outlier
A value in a data set that is significantly smaller or larger than the other values.
Example:
In the data set 10, 12, 14, 15, 95, the value 95 is an outlier.
Here is a guide to choosing the best measure:
• Use the mean when the data is symmetric and has no outliers. It is a good measure because it includes every value in its calculation.
• Use the median when the data is skewed or has outliers. The median is not affected by extremely high or low values, so it gives a better idea of the typical value.
• Use the mode to identify the most frequent value or when the data is categorical (e.g., favourite colours, types of pets).
Example 5
The annual salaries for five employees at a small company are $45 000, $50 000, $52 000, $55 000, and $150 000. Calculate the mean, median, and mode for this data set and determine which measure best represents the typical salary.
Create a strategy
First, calculate the mean, median, and mode. Then, identify any outliers in the data set. Finally, compare the measures of centre to decide which one most accurately describes a typical salary at the company, considering the effect of the outlier.
Apply the idea
Mean calculation:
Write the formula
= Substitute the values
= Evaluate the numerator
= $70 400 Evaluate
Median calculation:
• The salaries are already in order: $45 000, $50 000, $52 000, $55 000, $150 000.
• There are 5 values (odd), so the median is the middle value.
• Median = $52 000
Mode identification:
• Each salary value appears only once. • There is no mode.
Interpretation:
• The salary $150 000 is an outlier because it is much higher than the other salaries.
• The mean salary of $70 400 is higher than what four of the five employees earn. It is influenced by the outlier.
• The median salary of $52 000 is a much better representation of a typical salary because it is not affected by the very high salary.
Reflect and check
In this case, the median is the best measure of centre. The single high salary (the outlier) pulled the mean upwards, making it a misleading representation of the typical employee’s earnings. The median provides a more realistic picture.
Idea summary
The choice of the best measure of centre (mean, median, or mode) depends on the data set’s distribution and whether it contains outliers.
• An outlier is an extremely high or low value that can distort the mean.
• The median is often a better measure of centre than the mean for data sets with outliers because it is not affected by extreme values.
• The mean is best for symmetrical data with no outliers, while the mode is best for identifying the most frequent value.
2.05 Practice questions
What do you remember?
1 Complete the sentences using these words: average, middle, frequent.
a The mean represents the ⬚ of a data set.
b The median represents the ⬚ value in an ordered data set.
c The mode represents the most ⬚ value in a data set.
2 Determine whether each statement is true or false:
a To find the median, the data must first be arranged in order.
b A data set can have more than one mode.
c An outlier will have a large effect on the median.
d The mean is always the best measure of centre to use.
3 For the data set 5, 6, 8, 9, 50, which is the most appropriate measure of centre? A Mean B Median C Mode D Range
4
Calculate the mean for each of these data sets:
a Daily rainfall: 12, 8, 15, 10, 5 (in mm)
b Quiz scores: 68, 75, 82, 79, 71, 88
c Prices: $24.50, $19.99, $22.50, $21.00, $23.00
5 For each of these data sets:
i Determine the median. ii Determine the mode(s).
a 22, 18, 25, 15, 20, 18, 22
6 For each of these data sets:
b 50, 47, 52, 45, 50, 48, 47, 50
i Determine the mean. ii Determine the median. iii Determine the mode(s).
a 94, 98, 91, 96, 94
b 12, 15, 19, 21, 25
c 24, 31, 28, 24, 35, 29, 26, 28, 30, 25
7 Calculate the median of this data set:
35, 38, 31, 36, 33, 35
8
A group of children voted for their favourite fruit. The votes were: Apple, Banana, Apple, Orange, Banana, Apple, Pear
Identify the mode of this data set.
9 Identify the outlier in this data set: 12, 15, 11, 13, 98, 14
10 A company is reporting on the salaries of its employees. The salaries are: $55 000, $58 000, $61 000, $65 000, and $250 000.
Calculate the mean and median salary. Which measure of centre is a better representation of a typical employee’s salary? Explain your reasoning.
Extend your thinking
11 The mean of a data set with 8 values is 12. Calculate the sum of all the values in this data set.
12 The mean of five numbers is 20. If four of the numbers are 15, 18, 22, and 24, what is the fifth number?
13 A data set has a mean of 40, median of 38, and is unimodal with mode 35. Because the mean is noticeably higher than the median, what does this suggest about the values in the data set?
14 The mean score of 30 students on a test is 82. Two new students join the class and take the test. If the new mean is 83, what is the sum of the two new scores?
2.06 Measures of spread
After this lesson, you will be able to…
• calculate and interpret the range and interquartile range (IQR) for numerical data sets
Range
Range
A measure of spread in a numerical data set, calculated as the difference between the maximum and minimum values.
Exploration
Consider two archers, Archer A and Archer B, who both shot 5 arrows at a target. The scores for their shots are listed:
• Archer A: 4, 5, 5, 5, 6
• Archer B: 1, 2, 5, 8, 9
Both archers have the same average (mean) score of 5. However, their performance looks very different.
1. Look at the highest and lowest scores for Archer A. What is the difference between them?
2. Look at the highest and lowest scores for Archer B. What is the difference between them?
3. Which archer is more consistent? Why?
The range measures the difference between the largest and smallest values in the data. To calculate the range:
• Identify the maximum value in the data set.
• Identify the minimum value in the data set.
• Calculate the difference between the maximum and minimum values.
Range = Maximum value Minimum value
The range provides a basic indication of data spread but can be heavily influenced by outliers — values that differ significantly from the main body of data.
A larger range suggests greater variability in the data, while a smaller range indicates that the values are more clustered together.
Example 1
Calculate the range of these daily maximum temperatures (in °C): 23, 25, 22, 24, 28, 23, 21
Create a strategy
The range is calculated by finding the difference between the highest and lowest values in the data set.
Apply the idea
Order the data to easily identify the minimum and maximum values: 21, 22, 23, 23, 24, 25, 28
Maximum value: 28
Minimum value: 21
Range = Maximum value Minimum value
Write the formula = 28 21
Substitute the values = 7 Evaluate
Reflect and check
The range of 7°C represents the spread of temperatures.
Idea summary
The range measures the spread of numerical data.
Range = Maximum value - Minimum value
The range is sensitive to outliers in the data set. A larger range indicates greater spread in the data.
Quartiles and interquartile range
Quartiles
Values that divide an ordered data set into four equal parts. The first quartile (Q1) is the median of the lower half, the second quartile (Q2) is the median of the entire set, and the third quartile (Q3) is the median of the upper half.
Interquartile range (IQR)
A measure of spread that describes the middle 50% of a data set. It is calculated as the difference between the third quartile (Q3) and the first quartile (Q1).
Interpreting the IQR gives insight into the consistency of the data. A small IQR indicates that the middle half of the data points are close together, suggesting greater consistency. A large IQR means the data points in the middle are more spread out, indicating less consistency.
To calculate the IQR:
1. Order the data from least to greatest.
2. Find the median of the data set. This is the second quartile, Q2
3. Identify the lower half and upper half of the data.
• If the number of data points is odd, the median is excluded from both the lower and upper halves.
• If even, the data is split equally into lower and upper halves.
4. Find the median of the lower half. This is the first quartile, Q1
5. Find the median of the upper half. This is the third quartile, Q3.
6. Calculate the IQR by subtracting the first quartile from the third quartile:
IQR = Q3 Q1
Example 2
For this data set:
Calculate the range and IQR.
Create a strategy
2, 3, 4, 7, 8, 9, 11, 15, 16
Find the minimum and maximum values to calculate the range. Then, find the median of the entire data set, the median of the lower half (Q1), and the median of the upper half (Q3) to calculate the IQR.
Apply the idea
The data is already ordered: 2, 3, 4, 7, 8, 9, 11, 15, 16
Calculate the range:
• Maximum value: 16
• Minimum value: 2
• Range = 16 2 = 14
Calculate the IQR:
• The median (Q2) is the middle value, which is 8
• The lower half of the data (excluding the median) is 2, 3, 4, 7
• The first quartile (Q1) is the median of the lower half: = 3.5
• The upper half of the data (excluding the median) is 9, 11, 15, 16
• The third quartile (Q3) is the median of the upper half: = 13
• IQR = Q3 Q1 = 13 3.5 = 9.5
Reflect and check
The range of 14 represents the spread, while the IQR of 9.5 indicates the spread of the middle 50% of values.
Example 3
Calculate the IQR for this data set: 5, 5, 6, 7, 8, 8, 9, 12, 15, 22
Create a strategy
Order the data set and find the median values of the lower and upper halves to calculate the IQR.
Apply the idea
The data is already ordered: 5, 5, 6, 7, 8, 8, 9, 12, 15, 22
• The median (Q2) is the average of the two middle values: = 8
• The lower half of the data is 5, 5, 6, 7, 8
• The first quartile (Q1) is the median of the lower half, which is the middle value: 6
• The upper half of the data is 8, 9, 12, 15, 22
• The third quartile (Q3) is the median of the upper half, which is the middle value: 12
• IQR = Q3 Q1 = 12 6 = 6
Reflect and check
The IQR of 6 shows the spread in the central portion of the data, which is not affected by the potential outlier 22.
This stem plot shows the time taken (in minutes) for a group of students to complete a puzzle:
1|5 = 15 minutes
Calculate the range and interquartile range (IQR) for this data.
Create a strategy
First, list the data values in order from the stem plot. Then, find the minimum and maximum values to calculate the range. Finally, find the median and the quartiles to calculate the IQR.
Apply the idea
Step 1: List the data values from the plot in ascending order.
The data values are: 8, 9, 11, 12, 12, 15, 18, 20, 23, 26, 31.
There are a total of 11 data points.
Step 2: Calculate the range
• Maximum value: 31
• Minimum value: 8
• Range = 31 8 = 23 minutes
Step 3: Calculate the IQR
1. Find the median (Q2). Since there are 11 data points, the median is the 6th value, which is 15.
2. Identify the lower half of the data (excluding the median): 8, 9, 11, 12, 12
3. Find the first quartile (Q1 ) by finding the median of the lower half. The middle value is 11. Therefore, Q1 = 11.
4. Identify the upper half of the data (excluding the median): 18, 20, 23, 26, 31.
5. Find the third quartile (Q3 ) by finding the median of the upper half. The middle value is 23. Therefore, Q3 = 23.
The range is 23 minutes, and the IQR is 12 minutes. The stem plot provides an ordered set of data, which simplifies the process of finding the quartiles.
Example 5
The quiz scores (out of 100) for a small group of students in two different classes, Class A and Class B, are shown:
• Class A: 78, 80, 82, 85, 88
• Class B: 65, 70, 82, 90, 98
a Calculate the range and IQR for each class.
Create a strategy
For each class, calculate the range by subtracting the minimum score from the maximum score. Then, find the median (Q2), the first quartile (Q1), and the third quartile (Q3) to calculate the IQR.
Apply the idea
For Class A:
The scores are already ordered: 78, 80, 82, 85, 88
• Range = Maximum value Minimum value = 88 78 = 10
• Median (Q2 ) = 82
• Lower half: 78, 80. So, Q1 = = 79
• Upper half: 85, 88. So, Q3 = = 86.5
• IQR = Q3 Q1 = 86.5 79 = 7.5
For Class B:
The scores are already ordered: 65, 70, 82, 90, 98
• Range = Maximum value Minimum value = 98 65 = 33
• Median (Q2 ) = 82
• Lower half: 65, 70. So, Q1 = = 67.5
• Upper half: 90, 98. So, Q3 = = 94
• IQR = Q3 Q1 = 94 67.5 = 26.5
b Compare the IQRs and describe the consistency of the quiz scores in each class.
Create a strategy
Compare the two IQR values. A smaller IQR means the data is more consistent (less spread out), while a larger IQR means the data is less consistent (more spread out).
Apply the idea
Class A has an IQR of 7.5, and Class B has an IQR of 26.5
Since Class A has a much smaller IQR, the quiz scores for the middle 50% of its students are clustered closely together. This indicates that the results for Class A are more consistent.
The larger IQR for Class B shows that the scores for the middle 50% of its students are more spread out, which means the results are less consistent.
Reflect and check
Notice that both classes have the same median score of 82. However, the IQR reveals a key difference in the distribution of scores. The IQR is a powerful tool for comparing the spread or consistency of data sets, especially when medians are similar.
Idea summary
The range measures the spread of data as the difference between maximum and minimum values.
Quartiles divide ordered data into four equal parts.
The interquartile range (IQR) measures the spread of the middle 50% of data as Q3 Q1. The IQR is a robust measure of spread that is less sensitive to outliers than the range.
A smaller IQR indicates more consistent data, while a larger IQR indicates less consistent, more spread out data
2.06 Practice questions
What do you remember?
1 Complete the sentences using these words: maximum, quartiles, spread, minimum
a The range and IQR are both measures of ⬚.
b The range is the difference between the ⬚ and ⬚ values.
c The IQR is the range of the middle 50% of the data, found by using ⬚
2 Determine whether each statement is true or false:
a The range is heavily affected by outliers.
b A large IQR means the data is very consistent.
c The IQR describes the spread of all the data in a set.
d Q2 is another name for the median.
3 Calculate the range for the data set: 5, 8, 10, 14, 20
4 Calculate the range for each of these data sets:
a Temperatures (°C): 22.5, 23.0, 23.5, 24.0, 24.5, 25.0
b House prices ($′000s): 245, 289, 312, 267, 298
c Daily rainfall (mm): 0.5, 1.2, 0.8, 2.5, 1.5, 0.9
6 Calculate the interquartile range (IQR) for each data set:
a Ages: 18, 19, 20, 21, 21, 22, 23, 25, 28, 35
b 4, 7, 8, 9, 10, 12, 15, 18
7 For each of these stem plots:
i Calculate the range.
a The weights (in kg) of parcels:
ii Calculate the IQR.
b The time taken (in minutes) to complete an escape room:
8 A data set has a minimum value of 14 and a range of 32. Calculate the maximum value in the data set.
9 A teacher has two classes with these quiz scores:
• Class A: 65, 70, 75, 80, 85, 88
• Class B: 60, 70, 75, 80, 90
Which class shows more spread in the middle 50% of scores? Justify the answer using the IQR.
10 For the data set 12, 15, 16, 17, 18, 19, 20, 35
a Calculate the range and IQR.
b Explain why these measures give different impressions of spread.
11 A researcher collected height data (in cm) from two groups:
• Group 1: 160, 165, 168, 170, 172, 175, 178
• Group 2: 158, 160, 170, 170, 170, 180, 182
Which measure (range or IQR) better represents the difference in spread between these groups? Explain why.
Did you know?
The difference between a “god-tier” cafe and a mediocre one is how they manage the standard deviation of their coffee. While a machine might average the correct volume over a day, a high measure of spread means some customers get a burnt, bitter shot while others get a weak, watery one. To prevent this, baristas set a strict tolerance range for every pour; if a shot is even a few seconds too slow or fast, it is treated as a statistical outlier and tipped down the sink.
To keep these “fails” from happening, technicians analyse the uniformity of the coffee grounds. If the grinder produces a high variance—a messy mix of big chunks and fine dust—the coffee will brew unevenly and taste terrible. By minimising the spread of particle sizes, engineers ensure the machine hits a consistent “gold standard” every single time, so you aren’t gambling on whether your morning caffeine hit will actually be drinkable.
2.07 Introduction to probability
After this lesson, you will be able to…
• use the language of chance (impossible, unlikely, likely, certain)
• represent simple probabilities as fractions, decimals, or percentages
• conduct and interpret simple chance experiments (single-stage); compare informal expectations with results
Language of chance
In probability, specific language is used to describe how likely events are to occur. The likelihood of an event can be described using specific probability language:
• Impossible: An event that cannot happen (Probability = 0).
• Unlikely: An event that might happen but probably will not (Probability between 0 and 0.5, but closer to 0).
• Even chance: Equally likely to happen or not happen
• Likely: An event that will probably happen (Probability between 0.5 and 1, but closer to 1).
• Certain: An event that must happen (Probability = 1).
Example 1
A bag contains 20 marbles: 15 red and 5 blue. Describe the likelihood of drawing a red marble using probability language.
Create a strategy
Calculate the probability as a fraction and compare it to benchmark values to determine appropriate probability language.
Apply the idea
The probability of drawing a red marble is calculated as:
Probability of red = = 0.75
Since this probability is closer to 1 than to 0.5, drawing a red marble is likely.
Reflect and check
The probability of 0.75 is between 0.5 (even chance) and 1 (certain), making likely an appropriate description.
For a standard six-sided die, describe the likelihood of rolling a number greater than 6.
Create a strategy
Identify all possible outcomes that satisfy the condition and determine if any exist.
Apply the idea
The possible outcomes on a six-sided die are {1, 2, 3, 4, 5, 6}
There are no outcomes greater than 6.
Since no possible outcomes satisfy the condition, this event is impossible.
Reflect and check
With no possible favourable outcomes, the probability is 0, confirming this event is impossible.
Idea summary
Probability describes the likelihood of events occurring.
• Events can be described as impossible ( p = 0), unlikely, even chance , likely, or certain ( p = 1).
• The probability scale ranges from 0 to 1.
Theoretical probability
Theoretical probability
The likelihood of an event occurring based on mathematical reasoning, assuming all outcomes are equally likely. It is calculated as the ratio of the number of favourable outcomes to the total number of possible outcomes.
It is calculated using the formula:
Theoretical probability =
Number of favourable outcomes is the count of outcomes that satisfy the specific event condition
Total number of possible outcomes is the count of all possible results that could happen in the experiment
Theoretical probability can be expressed as:
• A fraction
• A decimal between 0 and 1
• A percentage between 0% and 100%
Example 3
A standard six-sided die has numbers 1 to 6. Calculate the theoretical probability of rolling an even number and express the answer as a fraction, decimal, and percentage.
Create a strategy
Identify the favourable outcomes (even numbers) and total possible outcomes, then convert between different numerical representations.
Apply the idea
The favourable outcomes are the even numbers: 2, 4, 6 (a total of 3 outcomes).
The total possible outcomes are 1, 2, 3, 4, 5, 6 (a total of 6 outcomes).
The probability can be expressed in different forms:
As a fraction:
As a decimal: = 0.5
As a percentage: 0.5 × 100% = 50%
Reflect and check
The probability is 0.5 or 50%, representing an even chance of rolling an even number.
Example 4
In a bag of marbles, there are 12 red marbles, 8 blue marbles, and 5 green marbles. Calculate the theoretical probability of randomly selecting a blue marble.
Create a strategy
Calculate the total number of marbles, then determine the probability of selecting a blue marble using the ratio of blue marbles to total marbles.
Apply the idea
Find the total number of marbles:
There are 8 blue marbles.
12 + 8 + 5 = 25
The probability of selecting a blue marble is:
As a fraction:
As a decimal: = 0.32
As a percentage: 0.32 × 100% = 32%
Reflect and check
The probability is 0.32 or 32%, indicating the event is unlikely but not impossible.
Idea summary
Theoretical probability is calculated as the ratio of favourable outcomes to total possible outcomes.
• Can be expressed as a fraction, decimal (0 to 1), or percentage (0% to 100%).
• Describes events from impossible (0) to certain (1).
• Assumes all outcomes are equally likely.
Experimental probability
Experimental probability
The likelihood of an event occurring based on the results of an actual experiment or observation. It is calculated as the ratio of the number of times an event occurs to the total number of trials.
Experimental probability is determined by conducting experiments and calculating the relative frequency of outcomes.
It provides a practical way to estimate the likelihood of events through repeated trials. Experimental probability is calculated using the formula:
Experimental probability =
Number of favourable outcomes is the number of times the specific event was observed during the trials
Total number of trials is the total number of times the experiment was performed
Interactive exploration
Discover this concept in action online
Example 5
A fair coin is tossed 50 times. Heads appears 28 times. Calculate the experimental probability of obtaining heads.
Create a strategy
Use the experimental probability formula by dividing the number of successful outcomes by the total number of trials.
Apply the idea
The number of heads is 28 and the total number of trials is 50.
The experimental probability is:
As a percentage, this is 0.56 × 100% = 56%.
Reflect and check
The experimental probability is reasonable as it is close to the theoretical probability of 0.5 for a fair coin.
Example 6
In 200 rolls of a die, the number 6 appears 38 times. Calculate the experimental probability and compare it to the theoretical probability.
Create a strategy
Calculate the experimental probability using the formula, then compare to the theoretical probability of .
Apply the idea
The experimental and theoretical probabilities are calculated and compared:
Reflect and check
The experimental probability (0.19) is close to the theoretical probability (0.167), with only a small difference of 0.023
Idea summary
Experimental probability is based on the results of actual trials.
• It is calculated by dividing the number of successful outcomes by the total number of trials.
• Results can be expressed as fractions, decimals, or percentages.
• As the number of trials increases, experimental probability tends to approach theoretical probability.
• Probability ranges from impossible (0) through unlikely and likely to certain (1).
2.07 Practice questions
What do you remember?
1 Complete the sentences about the probability scale using the words: Impossible, Even chance, Certain
a An event with a probability of 0 is described as ⬚.
b An event with a probability of 0.5 is described as an ⬚
c An event with a probability of 1 is described as ⬚.
2 Determine whether each statement is true or false:
a Experimental probability is calculated based on the results of an actual experiment.
b If an event is ‘likely’, its probability is less than 0.5.
c Probability can be expressed as a negative number.
d As the number of trials increases, experimental probability gets closer to theoretical probability.
3 What is the theoretical probability of rolling a 4 on a standard six-sided die?
4 Complete the table by converting the probabilities into different forms:
5 In a box of chocolates, 60% contain nuts. Describe the likelihood of each outcome for a randomly selected chocolate using probability language and justifying the answers:
a Getting a chocolate with nuts
b Getting a chocolate without nuts
6
7
A six-sided die is rolled. What is the probability of rolling a number less than 7? Use probability language to describe this event.
A spinner has 8 equal sections: 3 red, 2 blue, and 3 green. Express the probability of spinning blue as a fraction, decimal, and percentage.
8 The probability of rain on a given day is 0.3:
a What is the probability that it does not rain?
b Describe the likelihood of it raining using probability language.
9 In a standard deck of 52 cards, calculate the probability of drawing a heart. Describe this probability using probability language.
10 In a bag of 40 marbles, there are 15 red, 10 blue, 8 green, and 7 yellow marbles. Calculate the probability of selecting each, expressing each answer as a fraction and percentage:
a A blue marble
b A red or yellow marble
11 A survey asked 50 students about their favourite sport. The results are shown in this table: Sport
Students 15 20 10 5
a Calculate the probability that a randomly selected student chose Netball.
b Calculate the probability that a student did not choose Soccer.
12 A fair coin is tossed 30 times and it lands on heads 18 times. Calculate the experimental probability of getting heads.
13 A spinner has sections coloured red, blue, yellow, and green of equal size. After 100 spins, blue was spun 28 times. Calculate:
a The experimental probability of spinning blue
b The theoretical probability of spinning blue
c The difference between these probabilities
Extend your thinking
14 A coin is flipped and a six-sided die is rolled at the same time:
a List all the possible outcomes in the sample space (e.g., H1, H2, etc.).
b How many total outcomes are there?
c What is the probability of getting a Head and an even number?
15 A bag contains 3 red marbles and 2 blue marbles. A marble is drawn, its colour is recorded, and then it is replaced in the bag before a second marble is drawn.
Calculate the probability that both marbles drawn are the same colour.
16 A spinner has three sections: red, blue, and yellow. After 300 spins, red appeared 120 times and blue appeared 90 times:
a Calculate the experimental probability for each colour.
b Based on these results, are the sections likely to be equal in size? Explain your reasoning.
17 A fair six-sided die is rolled twice:
a Complete the table to show all possible sums of the two dice:
b Using the table, calculate the probability of getting a sum of 7.
c Calculate the probability of getting a sum greater than 10.
18 In a game where two fair dice are rolled, an even sum results in a $2 win and an odd sum results in a $1 loss:
a What is the probability of rolling an even sum?
b If this game is played 100 times, what is the expected number of wins?
c Calculate the total expected profit or loss after 100 games
INVESTIGATION
Analyse sports data
Investigate the role of data analytics in sports by sourcing, organising, and analysing data to draw conclusions and report findings.
Objectives
• To source data from secondary sources (e.g., online)
• To use technology (e.g., spreadsheets) to organise and create data displays
• To analyse and interpret the data to draw conclusions and report findings
Materials
• A computer with internet access
• Spreadsheet software
• Paper for brainstorming
The research question
Choose your arena
The first step of any investigation is to decide what you want to find out. Your question should be interesting to you and answerable with data. Think about your favourite sport, team, or player. What debates do you have with your friends? What have you always wondered about?
Example questions
Here are some ideas to get started:
• Who is the greatest basketball player of all time: Michael Jordan or LeBron James? (You would need to define ‘greatest’ with statistics like points, rebounds, assists, and championships).
• How has the number of 3-point shots attempted in the NBA changed over the last 20 years?
• In football, is there a correlation between a team’s possession percentage and the number of games they win in a season?
• Which cricket batter has been the most consistent performer in Test matches since 2010? (You might use batting average and number of centuries).
Getting the spreadsheet set up correctly is a great first step. Here is a helpful example for organising the columns:
1
Note: Always use the first row for clear, descriptive headings.
Step 1: Brainstorm a research question about a sport that interests you. Write it down.
Step 2: Identify the key pieces of data (variables) you will need to collect to answer your question. For example, to compare two players, you might need data on points per game, assists per game, and years played.
Step 3: Find a reliable online source for your data. Official league websites (e.g., AFL.com.au, NBA. com, PremierLeague.com) or major sports statistics sites (e.g., ESPN, Stats Perform) are good places to start.
Step 4: Open your spreadsheet software and create a new file. Set up your columns with clear headings for each variable you are collecting.
Step 5: Carefully enter the data you have found into your spreadsheet. Aim to collect at least 15 20 data points to ensure you have enough information to analyse.
Investigate
Discuss these questions with a partner or in a small group.
1. What is your research question, and why did you choose it?
2. What makes your chosen data source reliable? How can you tell if a source is trustworthy?
3. What specific features of the website suggest the data is accurate and unbiased?
Data displays and analysis
Telling the story
Raw data in a table can be hard to understand. We use summary statistics and graphs to see patterns, compare values, and tell a story. Your spreadsheet software is a powerful tool for this.
Useful tools
Consider using these spreadsheet functions:
• Summary statistics: Calculate the mean (AVERAGE), median (MEDIAN), maximum (MAX), minimum (MIN), and the five-number summary (including quartiles) of your numerical data.
• Column or bar charts: Excellent for comparing values between different players, teams, or categories.
• Line charts: Perfect for showing how a variable changes over time (e.g., a player’s performance across several seasons).
• Scatterplots: Used to see if there is a relationship (correlation) between two different numerical variables.
Use these formulas in your spreadsheet to speed up your analysis (replace ‘Range’ with your actual data cells, such as A2:A21):
• Mean: = AVERAGE(Range)
• Median: = MEDIAN(Range)
• Range: = MAX(Range) MIN(Range)
• Interquartile range (IQR): = QUARTILE.EXC(Range, 3) QUARTILE.EXC(Range, 1)
• First quartile: = QUARTILE.EXC(Range, 1)
• Third quartile: = QUARTILE.EXC(Range, 3)
Step 1: In your spreadsheet, calculate at least two summary statistics that are relevant to your question (e.g., the mean points per game for two different players).
Step 2: Create at least two different types of charts that help to answer your research question. Choose the chart types that best represent your data.
Step 3: Ensure your charts are clear and easy to read. Give each chart a descriptive title and label the axes properly (including units).
Investigate
1. What do your summary statistics reveal? Was there anything surprising?
2. Describe one of your charts. Why was this chart type the best choice for displaying this part of your data?
3. What patterns, trends, or interesting points (like outliers) can you identify from your charts?
Conclusions and findings
The final whistle
You have collected, organised, and visualised your data. The final step is to bring it all together and answer your original research question. A good conclusion is always supported by evidence from your analysis.
Investigate
Prepare a short summary of your findings to share with the class. Use your answers to these questions to structure your report.
1. Determine your original research question. Based on your analysis, what is the answer?
2. What are the three most important pieces of evidence from your data, statistics, or charts that support your conclusion? Be specific.
3. Were there any limitations to your investigation? For example, did you have enough data? Was there other data you wished you could have found?
4. Based on what you have discovered, what is a new question you could investigate next?
5. What is one major assumption you made about your data or the sport during this investigation? How might this impact the reasonableness of your conclusion?
Discussion
1. How do professional sports teams use data analysis to gain a competitive advantage?
2. What are the potential dangers of making important decisions (like signing a player for millions of dollars) based on a limited set of statistics?
3. Besides sports, describe another real-world field where collecting, displaying, and analysing data is crucial. Explain your choice.
INVESTIGATION
Conduct a survey
Investigate a survey on a topic of interest to collect, organise, and analyse data.
Objectives
• To formulate survey questions and a data collection plan
• To collate, represent, and summarise collected data using appropriate displays and statistics
• To communicate findings from the survey
Materials
• Paper for survey forms
• Graph paper or access to digital tools (e.g., spreadsheets) for data representation
• Scientific calculator
Plan your survey
Survey
A method of collecting data from a group of people to gain insights on a particular topic. Surveys can explore various topics.
For example, favourite foods, study habits, or opinions on school activities. Choose a topic that is relevant and engaging for your classmates.
Effective survey questions should be clear, unbiased, and easy to answer. Consider using multiplechoice, yes or no, or rating scales.
Data collection plan
Decide who to survey (e.g., classmates), how many responses to collect, and how to record the data to avoid errors.
Some questions to consider are:
• What is the purpose of your survey?
• How will you ensure your questions are not leading or confusing?
• How will you organise the data collection to be efficient in class time?
• When formulating questions, compare these two styles:
• Leading question (Biased): Do you agree that school lunches are too expensive?
• Neutral question (Unbiased): How would you rate the value for money of school lunches? (Options: Excellent, Good, Fair, Poor)
Using neutral questions ensures your data is reliable and reflects the actual opinions of the group.
Step 1: Brainstorm a survey topic with your group ( 2 4 students). Ensure it can be completed within the class.
Why did you choose this topic? How does it connect to real-life applications of mathematics?
Step 2: Formulate 3 5 survey questions. Write them clearly on paper.
How can you test if your questions are easy to understand?
Step 3: Create a data collection plan: Decide on the sample size (e.g., 20 classmates) and how to record responses (e.g., tally sheet).
What potential issues might arise during data collection, and how can you address them?
Investigate
Work in your group to complete the steps and answer these questions.
1. How might the wording of a question affect the data collected?
2. In what ways can surveys be used outside of school, such as in business or science?
Collect and collate data
Data collection
Approach respondents politely and record responses accurately. Ensure anonymity if the topic is sensitive.
Collating data
Organise the raw data into a table or list for easier analysis.
Organising data is simple with a frequency table. Imagine asking 10 people to name a favourite fruit:
Conduct the survey by asking classmates your questions and recording responses.
• Were there any unexpected responses? How might they influence your findings?
• Collate the data: Group similar responses and count frequencies.
• What patterns do you notice in the collated data?
Investigate
Discuss in your group as you collect and collate.
1. How does the sample size affect the reliability of your data?
2. What creative ways could you use to make data collection more engaging?
Represent, summarise, and communicate findings
Data representation
Use graphs like bar charts, pie charts, or histograms to display data visually.
Summary statistics
Calculate measures like mean, mode, median, or percentages to summarise the data.
Communication
Present findings clearly, highlighting key insights and possible implications.
Summary statistics help describe the centre of your data. For example, if 8 out of 20 students chose Sport as their favourite subject:
Percentage calculation: 8 ÷ 20 × 100 = 40%
To find the mean of numerical data, add all scores together and divide by the total number of responses.
Choose a bar chart for categorical data (like subjects) and a histogram for grouped numerical data (like heights).
Step 1: Represent the data using an appropriate display (e.g., draw a bar graph).
Why did you choose this type of display? What alternatives could work?
Step 2: Summarise the data with statistics (e.g., most common response as mode).
What do these statistics reveal about your survey topic?
Step 3: Prepare a short presentation or written report to communicate your findings.
How can you make your communication engaging and easy to understand?
Investigate
Reflect in your group on the analysis and communication.
1. What novel applications of mathematics did you discover through this survey?
2. How might biases in survey design or data collection affect your conclusions?
3. In what ways can surveys connect to other subjects, like science or social sciences?
Did you know?
Most reviews tend to cluster around very high or very low ratings, even though many experiences are more moderate. This happens because of voluntary response bias, where people with stronger opinions are more likely to leave feedback. Those with neutral or mixed experiences are less likely to respond, making extreme views more visible over time.
This leaves out many users with average or balanced experiences, which can distort the overall picture. As a result, ratings don’t always reflect what most people actually think, so it’s important to look beyond the numbers and consider how the responses were gathered.
Chapter review
1 Classify these data examples as one of these types:
• Numerical discrete
• Numerical continuous
a The brand of a car
b The finishing position in a race (1st, 2nd, 3rd, etc.)
c The number of students in a classroom
d The weight of a person in kilograms
• Categorical ordinal
• Categorical nominal
2 For each scenario, identify the most appropriate method of data collection:
• Survey
• Observation
• Experiment
• Existing records
a To test a new type of plant food, a gardener grows two sets of plants. One set gets the new food, and the other does not. The growth is then compared.
b A researcher uses data from the Australian Bureau of Statistics to analyse population trends.
c A company sends an online questionnaire to its customers to gather feedback on a new product.
d A scientist watches a pride of lions in the wild to study their social behaviour without interfering.
3 In a town with 15 000 households, a survey of 500 households finds that 150 own a pet dog. Estimate the total number of households in the town that own a pet dog.
4 Would a census or a sample be more appropriate to determine the most popular TV show among all residents of Australia? Explain why.
5 The favourite colours of a group of students were recorded as follows: Blue, Red, Green, Blue, Red, Yellow, blue, green, red, blue
a Construct a frequency table for this data.
b Identify the modal colour.
6 A café owner wants to show the number of different types of coffee sold in a day. Would a frequency table or a bar chart be more effective for a quick visual comparison?
7 The number of students in different school clubs are: chess (15), debating (25), art (20), and coding (10)
Construct a bar chart to display this data.
8 This bar chart shows the favourite movie genres of a group of students: Favourite movie genres
a Which genre is the most popular?
b How many more students chose the most popular genre than drama?
9 The number of goals scored by a soccer team in 10 matches are: 2, 3, 1, 2, 0, 3, 2, 4, 2, 1
Construct a dot plot for this data.
10 The heights (in cm) of a group of students are: 155, 162, 158, 171, 165, 159, 162, 173
Construct an ordered stem plot for this data.
11 This data represents the time (in minutes) it took 15 people to complete a puzzle: 12, 18, 25, 14, 21, 28, 19, 15, 22, 29, 17, 23, 20, 26, 16
a Construct a grouped frequency table with class intervals of width 5, starting at 10.
b Using the grouped frequency table from part (a), construct a histogram.
12 For a large data set of house prices in a suburb, which display would be most appropriate: a dot plot, a stem plot, or a histogram? Justify your choice.
13 The annual incomes for five employees are:
$52 000, $55 000, $59 000, $62 000, and $220 000
a Calculate the mean, median, and mode for this data set.
b Which measure of centre (mean or median) is a better representation of a typical employee’s income? Explain why.
14 The mean score of Team B in a 10-game season is 28. The scores for Team A in the same season are: 67, 25, 19, 14, 38, 29, 27, 39, 24, 54
What is the difference between the mean score of Team A and Team B?
15 The speeds of 10 cars were recorded: 82, 84, 90, 93, 89, 87, 95, 91, 90, 97
A new car is recorded at a speed of 120 km/h. How does this new value affect the mean and median?
16 The daily sales (in dollars) at a small shop were: 350, 410, 320, 450, 300
Calculate the range of the daily sales.
17 Find the range and IQR for the data set: 10, 12, 15, 18, 20, 21, 25
18 Find the IQR for the data set: 5, 8, 10, 14, 16, 20
19 The stem plot shows the points scored by a player in a season:
Key 1|2 = 12 points
Find the range and IQR.
20 Two data sets have the same median but Data set A has an IQR of 10 and Data set B has an IQR of 20. Which data set has a greater spread in its middle 50% of data?
21 A weather forecast states there is a 75% chance of rain. Using probability language such as impossible, unlikely, likely, certain, describe the chance of rain.
22 A standard six-sided die is rolled. What is the probability of rolling a number that is a whole number? Describe the likelihood of this event using probability language.
23 A bag contains 10 marbles: 5 red, 3 blue, and 2 green
a Express the probability of drawing a red marble as a: i Fraction ii Decimal iii Percentage
b What is the probability of drawing a red or a green marble?
24 A die is rolled 60 times, and the number 4 appears 12 times:
a What is the experimental probability of rolling a 4?
b How does this compare to the theoretical probability?
Big ideas
• Effective financial management relies on interpreting banking documents and calculating simple interest on savings and loans, as well as understanding how gross and net income are determined through various payment methods.
• Meeting financial obligations involves calculating income tax and the Medicare levy within a progressive system, while securing future financial stability requires an understanding of mandatory superannuation contributions and fund growth.
Tax feels like money disappearing, but it funds the stuff you use daily — roads, schools, hospitals, even the footy oval lights.
3.01 Banking and financial services
After this lesson, you will be able to…
• read and interpret banking information, bank statements, utility bills, and GST
• perform calculations for savings and loans, including fees/charges and buynow-pay-later services
Read financial documents
Financial documents provide detailed records of monetary transactions and account activities. Understanding these documents is essential for effective financial management.
Balance
The total amount of money in a bank account at a specific point in time.
Credits
Money added to an account, such as deposits or transfers received.
Debits
Money removed from an account, such as withdrawals, payments, or fees.
Simplified bank statement Description
Opening balance
Payroll deposit
Online Transfer (Friend)
Rent payment
Grocery store
ATM Withdrawal
Closing balance
$1500.00
A bank statement shows the opening balance, all credits (money in), and all debits (money out) over a period, to arrive at a closing balance.
This simplified bank statement shows how credits increase the balance and debits decrease it, leading to a new closing balance for the period.
Supply charge
A fixed daily or periodic fee for having a service (such as electricity or water) connected to a property, regardless of usage.
Usage charge
A variable cost on a utility bill that is based on the actual amount of service consumed (e.g., per unit of electricity or kilolitre of water).
Meter readings
Records of the amount of electricity, gas, or water consumed, taken from a utility meter at the beginning and end of a billing period. These can be actual or estimated.
Utility bills typically include a fixed supply charge and a variable usage charge based on meter readings. The difference between the current and previous meter reading determines the number of units used for billing.
This example utility bill breaks down the charges, including the fixed daily supply charge and the variable usage charge, often presented with both current and previous meter readings.
Simplified utility bill
Account
Exploration
Review the example bank statement and utility bill provided. Identify key features and information:
1. On the bank statement, how can it be determined if more money was deposited or withdrawn during the period?
2. If a utility bill shows estimated meter readings, why might it be beneficial to provide actual readings?
3. Why is it important for a consumer to understand both the supply charge and the usage charge on a utility bill?
In Australia, most goods and services include a Goods and Services Tax (GST). The standard rate is 10%, which is added to the pre-tax price of an item. Essential items, such as basic food, are ‘GSTfree’.
There are two common calculations involving GST:
• Calculate the GST to be added to a pre-tax price.
• Find the amount of GST included in a total price.
To find 10% GST on a pre-tax amount, multiply the amount by 0.10. This is because “per cent” means “per hundred”; therefore, 10% is the same as the fraction , which is equal to the decimal 0.10:
GST amount = Pre-tax price × 0.10
The total price including GST is then the pre-tax price plus the GST amount.
A price that already includes GST is made up of the original pre-tax price (100%) and the GST (10%). This means the GST-inclusive price represents 110% of the original price.
The GST amount is of the total inclusive price. To find the GST amount, divide the GST-inclusive price by 11.
Pre-tax price (10 parts)
GST (1 part)
GST-inclusive price (11 parts)
This model shows that the GST-inclusive price is made of 11 equal parts. The pre-tax price makes up 10 parts, and the GST is 1 part. Therefore, the GST is of the total price:
Example 1
A quarterly electricity bill shows a previous meter reading of 4582 and current reading of 5147. The usage rate is $0.25 per unit and the supply charge is $0.95 per day:
a Calculate the total bill amount including 10% GST, assuming a 91-day quarter.
Create a strategy
Calculate the units used, determine usage and supply charges for the quarter (91 days), then add GST.
Apply the idea
Units used = 5147 4582
= 565 units
Usage charge = 565 × $0.25
= $141.25
Supply charge = 91 × $0.95
Calculate the difference in meter readings
Evaluate
Multiply units used by the rate per unit
Evaluate
Multiply days by the daily supply charge = $86.45
Subtotal = $141.25 + $86.45
= $227.70
GST = $227.70 × 0.10
Evaluate
Add usage and supply charges (pre-GST)
Evaluate
Calculate 10% of the subtotal = $22.77
Evaluate
Total bill = $227.70 + $22.77
Add the GST to the subtotal = $250.47
Evaluate
Reflect and check
The final amount is reasonable as quarterly electricity bills typically range from $200 to $400.
b Explain why 91 days is a reasonable number of days to use for a quarterly bill.
Create a strategy
Consider the number of days in a year and the definition of a ‘quarter’.
Apply the idea
A year contains 365 days. A “quarter” of a year is one-fourth of the year.
365 ÷ 4 = 91.25 days
As billing periods use whole days, using 91 days is a standard and reasonable approximation for a quarterly bill, since 91 × 4 = 364, which is very close to 365.
Example 2
A bank statement shows an opening balance of $1250. During the month, there were deposits and withdrawals.
• Deposits (Credits): $2400 and $850
• Withdrawals (Debits): $1600 and $725
Calculate the closing balance for the month.
Create a strategy
To find the closing balance, add the total deposits (Credits) to the opening balance, then subtract the total withdrawals (Debits).
Apply the idea
The opening balance is $1250.
Total deposits = $2400 + $850
Calculate total deposits (Credits) = $3250
Total withdrawals = $1600 + $725
Evaluate
Calculate total withdrawals (Debits) = $2325
Closing balance = $1250 + $3250 $2325
Reflect and check
Evaluate
Apply the total changes to the starting balance = $2175
Evaluate
The calculation can be verified by confirming that deposits minus withdrawals equals the net change of $925.
Idea summary
Bank statements record all account transactions, including opening or closing balances, deposits (credits), and withdrawals (debits).
Utility bills typically combine fixed supply charges and variable usage charges based on meter readings and consumption.
GST is calculated as 10% of the pre-tax amount for most goods and services in Australia. Regular review of financial documents helps track spending and manage personal finances.
Savings and loan calculations
Financial calculations involve understanding several key concepts related to savings accounts, loans, and banking services.
Principal
The initial amount of money borrowed (for a loan) or invested (for savings).
Simple interest
Interest calculated only on the initial principal amount of a loan or deposit.
Simple interest is calculated as a percentage of the principal using the formula:
I is the interest earned or paid
P is the principal amount (initial investment or loan)
r is the annual interest rate
t is the time period in years
Ensure that the interest rate (r) and time period (t) are in consistent units (e.g., rate per annum and time in years).
If the time is in months, divide by 12 to get the year (e.g., 18 months = 1.5 years).
Interactive exploration
Discover this concept in action online
The total amount (A) after interest is the principal plus the interest earned: A = P + I
For loans with regular repayments, the repayment amount is calculated by dividing the total amount (principal + interest) by the number of repayments:
where n is the total number of repayments made
Example 3
Calculate the simple interest earned on an investment of $5000 at 4.8% per annum for 2.5 years.
Create a strategy
Identify the values for P, r, and t, then substitute them into the formula.
Apply the idea
Given the values:
• P = $5000 (The initial investment)
• r = 4.8 (The annual interest rate)
• t = 2.5 years (The time period)
Substitute these values into the simple interest formula:
Write the formula
Substitute P = 5000, r = 4.8, and t = 2.5
Evaluate
Therefore, the total simple interest earned over 2.5 years is $600.
Example 4
A loan of $12 000 is taken out with a simple interest rate of 5% p.a. for 3 years. The total amount will be repaid in equal monthly instalments:
a Calculate the total interest charged on the loan.
Create a strategy
Identify the key values from the text and use the simple interest formula,
Apply the idea
• Identify the variables:
• P = $12 000 (The amount borrowed)
• r = 5 (The yearly interest rate)
• t = 3 years (The time in years)
• Solve for the interest (I)
Write the formula
Substitute P = 12 000, r = 5, and t = 3
Evaluate
Therefore, the total interest charged over 3 years is $1800.
b Calculate the monthly repayment amount, rounded to the nearest cent.
Create a strategy
Find the total amount to be repaid (Principal + Interest). Then, determine the total number of months in the loan period and divide the total amount by this number.
Apply the idea
months
Add the principal and the total interest
Evaluate
Calculate the total months over 3 years
Evaluate
Divide the total amount by the number of repayments
Evaluate and round
The monthly repayment amount is approximately $383.33
Reflect and check
To check, multiply the monthly repayment by the number of months: $383.33 × 36 = $13 799.88. There is a $0.12 difference from the actual total of $13 800. In the real world, a bank would usually make the final payment $383.45 to cover those missing cents.
Every time you tap your phone to pay, a mathematical process called “tokenisation” replaces your actual card details with a one-time digital code. This clever system ensures that your private financial information is never shared with the shop, making digital transactions significantly more secure than old-fashioned cash. It is a brilliant example of how invisible encryption logic works in the palm of your hand to protect your savings every single day.
Example 5
Sarah buys a $300 item using a buy-now-pay-later service. She agrees to pay 4 equal fortnightly instalments of $75. If a payment is missed, there is a late fee of $10. Determine the total cost if she makes all payments on time and the total cost if she misses one payment.
Create a strategy
For on-time payments, the total cost is simply the sum of all instalments. For a missed payment, add the late fee to the sum of instalments.
Apply the idea
• Case 1: All payments made on time.
The item price is $300. She pays 4 instalments of $75.
Total cost = 4 × 75
= $300
Multiply the number of instalments by the instalment amount
Evaluate
If all payments are made on time, the total cost is $300, which is the original price of the item.
• Case 2: One payment is missed.
The total of the instalments is still $300. There is an additional late fee of $10.
Total cost = 300 + 10
= $310
Add the total of instalments and the late fee
Evaluate
If one payment is missed, the total cost increases to $310.
Reflect and check
Buy-now-pay-later services may seem interest-free, but understanding all fees for late payments is crucial. Missing even one payment can increase the total cost of the item.
Idea summary
The principal is the initial amount invested or borrowed.
Simple interest is calculated using the formula , where P is principal, r is the annual interest rate, and t is time in years.
Loan repayments are determined by dividing the total amount (principal plus interest) by the number of repayment periods.
Buy-now-pay-later (BNPL) services typically involve instalment payments, with late fees applied for missed payments which can increase the total cost.
Always ensure time periods and interest rates use consistent units in calculations.
3.01 Practice questions
What do you remember?
1 Classify each of these bank account activities as either a credit or a debit:
a A salary payment deposited by an employer.
b An automatic monthly payment for a gym membership.
c Interest earned on savings and added by the bank.
d A fee charged for using an ATM from another bank.
2 Consider these questions regarding GST in Australia:
a What is the standard GST percentage rate applied to most goods and services?
b If an item costs $110 (GST inclusive), what is the amount of GST included?
c To find the GST component of a total price, divide the total by what number?
d True or False: Essential items like fresh fruit, vegetables, and milk are generally GST-free.
3 Consider the simple interest formula, :
a What does the variable P represent?
b If an interest rate is given as 5% per annum, what value is used for r?
c If the time period is 6 months, what value should be used for t?
d How is the total amount ( A) in an account calculated once interest has been added?
Practice
4 A gas bill shows a previous meter reading of 2845 and current reading of 3167. The usage rate is $0.18 per unit and the supply charge is $0.85 per day. Calculate the total bill amount, including GST, for a 90-day quarter.
5 A bank account has an opening balance of $3450. During the month, deposits of $1200, $650, and $890 were made, with withdrawals of $2100 and $980. Calculate the closing balance for the month.
6 Calculate the simple interest earned on a savings account with $8000 invested at 3.6% p.a. for 18 months.
7 A loan of $15 000 is taken out with a simple interest rate of 6% p.a. for 4 years. The total amount (principal plus interest) is to be repaid in equal quarterly instalments:
a Calculate the total interest paid.
b Calculate the amount of each quarterly repayment.
8 A water bill shows usage of 95 kilolitres at $2.45 per kilolitre, plus a fixed service charge of $105. Calculate the total bill amount including GST.
9 A buy-now-pay-later service offers to split a $600 purchase into 4 equal payments over 8 weeks. If a $12 establishment fee is added to the total cost, calculate the amount of each fortnightly payment.
10 A buy-now-pay-later service charges a $4 fee for each payment. An item is purchased for $300 over 6 monthly instalments:
a Calculate the amount of each monthly payment (including the fee).
b Calculate the total cost of the item.
11
An appliance costing $800 is purchased using a buy-now-pay-later service. Five equal monthly payments of $160 are made. There is a $15 late fee for any missed payment:
a Calculate the total cost of the appliance if all payments are made on time.
b Calculate the total cost if one payment is missed.
12 A quarterly electricity bill has GST-inclusive charges of $385.00:
a Calculate the GST component.
b Calculate the GST-exclusive amount.
Extend your thinking
13 Compare two buy-now-pay-later options for a $1200 purchase:
• Option A: 6 monthly payments with an $8 fee per payment
• Option B: 12 fortnightly payments with a $5 fee per payment
Which option costs less overall? By how much?
14 To earn $500 in simple interest over 2 years at a rate of 4% p.a., calculate the principal required.
15 A quarterly bill is $324.50 (including GST). If the supply charge is $0.90 per day and the usage rate is $0.25 per unit, calculate the number of units consumed during a 90-day quarter.
3.02 Income and payslips
After this lesson, you will be able to…
• understand and calculate income from various sources
• perform calculations based on rates of pay, pay scales, and information on payslips
Calculate gross income
Income can be earned through various payment methods:
Wage
Payment received per hour worked, often expressed as an hourly rate.
Salary
A fixed annual amount of money paid to an employee in regular instalments, regardless of the specific number of hours worked.
Overtime
Hours worked beyond an employee’s standard work hours, typically paid at a higher rate.
Pay scale
A structured system that determines an employee’s wage or salary based on factors such as experience, qualifications, and job responsibilities.
Common overtime rates include:
• Time-and-a-half (1.5 times the normal hourly rate)
• Double-time (2 times the normal hourly rate)
Standard time conversions for calculating income:
• Full-time work week: 38 hours
• Fortnight: 2 weeks (26 fortnights in a year)
• Working year: 52 weeks
• Working month: Approximately 4.33 weeks
Interactive exploration
Discover this concept in action online mathspace.co
Example 1
Calculate the gross annual income of an employee who earns $250 per week.
Create a strategy
To find the annual income, multiply the weekly wage by the number of weeks in a year (52).
Apply the idea
Annual income = 250 × 52
Write the equation = $13 000 Evaluate
Reflect and check
The result can be estimated by multiplying the weekly wage by 50. Since $250 × 50 = $12 500, the calculated annual salary of $13 000 is reasonable.
Example 2
Calculate the weekly gross income for an employee who works 35 hours at an hourly rate of $22.50
Create a strategy
To find the weekly wage, multiply the total hours worked by the hourly pay rate.
Gross income = Hours × Hourly rate
Apply the idea
Weekly gross income = 35 × 22.50
Write the equation = $787.50 Evaluate
Reflect and check
This calculation represents a straightforward wage scenario, without any overtime or additional payments.
Example 3
An employee works 44 hours in a week. Their normal rate is $30 per hour for the first 38 hours, and time-and-a-half for overtime. Calculate their weekly gross income.
Create a strategy
Calculate normal hours at standard rate, then overtime hours at time-and-a-half rate, and add the results.
Apply the idea
Standard pay = 38 × 30
= $1140
Overtime hours = 44 38
= 6 hours
Overtime rate = 30 × 1.5
= $45 per hour
Overtime pay = 6 × 45
= $270
Total weekly gross income = 1140 + 270
= $1410
Reflect and check
Multiply standard hours by the hourly rate
Evaluate
Subtract standard hours from total hours worked
Evaluate
Calculate the time-and-a-half rate
Evaluate
Multiply overtime hours by the overtime rate
Evaluate
Add standard pay and overtime pay
Evaluate
The total weekly gross income of $1410 reflects the higher pay for overtime hours, which is a common practice.
Example 4
A new employee starts at a salary of $45 000 per year. Their pay scale includes an annual 5% increment for the first three years. What will their annual salary be in their third year?
Create a strategy
To find the salary for each year, apply a 5% increase to the previous year’s salary:
• Multiply the current salary by 1.05 (representing 100% + 5%).
• Repeat this process until Year 3 is reached.
Apply the idea
Year 1 salary = $45 000
Year 2 salary = 45 000 × (1 + 0.05)
= $47 250
Year 3 salary = 47 250 × 1.05
= $49 612.50
Identify the starting salary
Apply the 5% increase to the Year 1 salary
Evaluate
Apply the 5% increase to the Year 2 salary
Evaluate
The annual salary in the third year will be $49 612.50.
Reflect and check
The salary increases by 5% each year, demonstrating how a pay scale can lead to gradual earnings growth over time.
Idea summary
Gross Income is the total amount of money earned before tax and other deductions are taken out. It can be calculated in several ways:
A wage is earned hourly, calculated by multiplying hours worked by the hourly rate. A salary is a fixed annual amount, often calculated using 52 weeks per year for conversions. Overtime rates (e.g., time-and-a-half, double-time) apply for hours worked beyond the standard 38-hour week.
Pay scales determine wages or salaries based on experience, qualifications, or years of service.
Different payment methods (wage, salary, overtime, pay scales) require specific calculation approaches to determine total gross income.
Payslip interpretation
Payslip
A legal document detailing an employee’s earnings and deductions for a specific pay period.
Understanding the key components of a payslip is essential for managing personal finances. At its core, a payslip shows an employee’s total earnings (gross income), what was taken out (deductions), and what they actually take home (net income).
Gross income
The total amount of money an employee earns before any deductions, taxes, or other withholdings are taken out.
Example:
If an employee earns $1000 in a week and has $200 in deductions, their gross income is $1000.
Deductions
Amounts subtracted from an employee’s gross income, such as taxes, superannuation contributions, health insurance premiums, or other voluntary withholdings.
Example:
This Pay As You Go (PAYG) Income Tax, superannuation contributions, and health insurance premiums.
Net income
Also known as “take-home pay,” it is the final amount of money an employee receives after all deductions have been subtracted from their gross income.
Example:
If an employee’s gross income is $1000 and total deductions are $200, the net income is $800.
Allowance
An additional payment made to an employee to cover specific expenses related to their job, such as travel, tools, or uniforms.
Bonus
An extra payment given to an employee, often as a reward for good performance, meeting targets, or as part of a profit-sharing scheme.
Common payslip elements include:
• Pay period dates and payment frequency (weekly, fortnightly, or monthly)
• Base rate of pay and hours worked
• Additional payments such as overtime, allowances, or bonuses
• Tax withholdings and other mandatory deductions like PAYG tax and superannuation
• Year-to-date (YTD) totals: The running total for the financial year (i.e., starting July 1st)
Address: 123 Main St. Anytown, VIC 3000
Employee details
Name: Jane Doe Employee ID: EMP001
Address: 456 Oak Ave, Suburbia
Period: 15/07/2024 31/07/2024 Paid: 01/08/2024
$3600.00
This example payslip illustrates common sections. Gross income is the total before deductions. Deductions like tax and superannuation are subtracted. Net income is the final amount paid to the employee.
Year-to-date (YTD) totals show cumulative amounts for the financial year.
ACME Corporation
Example 5
An employee’s fortnightly payslip shows gross pay of $2400. Deductions include $620 for tax, $228 for superannuation, and $50 for health insurance.
Calculate the net pay.
Create a strategy
Calculate the total value of all deductions, then subtract the total deductions from the gross pay to find the net pay.
Apply the idea
Total deductions = 620 + 228 + 50
Write the equation = $898
Evaluate
Net pay = 2400 898
Subtract total deductions from gross pay = $1502
Evaluate
The employee’s net (take-home) pay is $1502.
Reflect and check
The calculation can be verified by confirming that deductions plus net pay equal the original gross amount.
Example 6
A payslip shows a current gross pay of $1500 for the fortnight and a Year-to-Date (YTD) gross pay of $18 000. If the employee has been paid for 12 fortnightly periods so far, what was the average fortnightly gross income prior to this payslip?
Create a strategy
Calculate the previous total income and number of pay periods by subtracting the current values from the YTD totals. Then, divide the prior income by the prior number of periods to determine the average.
Apply the idea
Subtract current pay from YTD gross pay
Evaluate
Subtract the current period from the total periods
Evaluate
Divide prior gross pay by the number of prior periods
Evaluate
The average fortnightly gross income for the previous 11 periods was $1500.
Reflect and check
The average prior income matches the current income, suggesting consistent earnings over the periods. YTD figures are essential for tracking cumulative earnings and deductions throughout the financial year.
Idea summary
Payslips are important documents that detail an employee’s earnings and deductions for a specific pay period:
• Gross income is the total earnings before any deductions.
• Net income (take-home pay) is the amount received after all deductions.
• Deductions typically include tax, superannuation, and other withholdings like health insurance.
• Payslips also show details like pay period, base rate, additional payments (overtime, allowances, bonuses), and Year-to-Date (YTD) totals.
3.02 Practice questions
What do you remember?
1 Identify the payment method or term described in each situation:
a A nurse is paid $45 for every hour they work at the hospital.
b A manager receives a fixed annual income of $110 000 paid in monthly instalments.
c A salesperson is given a one-off $500 payment for exceeding a monthly target.
d An employee is paid an extra $20 per day to cover the cost of using a personal vehicle for deliveries.
2 Consider these scenarios:
a If a casual worker earns $30 per hour, how much is earned for a 5-hour shift?
b An employee has a gross income of $1200 and total deductions of $250. What is the net pay?
c A worker’s normal rate is $24 per hour. What is their “time-and-a-half” overtime rate?
d If an employee is paid $1000 every week, what is the total income over 4 weeks?
3 Determine whether these statements are true or false:
a The standard Australian full-time work week is 38 hours.
b Gross income is the amount of money an employee takes home after tax is removed.
c A fortnight refers to a period of two weeks.
d Income tax and superannuation are examples of deductions.
4 Calculate the annual salary for an employee who earns $320 per week.
5 Calculate the weekly gross income for an employee who works 36 hours at an hourly rate of $27.50.
6 An employee works 42 hours in a week. The normal rate is $28 per hour for the first 38 hours, and time-and-a-half for any overtime hours. Calculate the weekly gross income.
7 An employee’s starting annual salary is $65 000. The company’s pay scale includes an annual 4% salary increase. What will the annual salary during the third year (after two increases)?
8 Convert a monthly salary of $5200 to an annual salary.
9 A fortnightly payslip shows gross pay of $3600. Deductions include $890 for tax, $342 for superannuation, and $75 for health insurance. Calculate the net pay.
10 Use this payslip summary to calculate the net pay:
• Gross salary: $2500
• Overtime: $450
• PAYG tax: $680
• Superannuation: $295
• Union fees: $15
11 Calculate the gross weekly pay for a casual employee who works 35 hours at a normal rate of $32.50 per hour, plus 8 hours of overtime at time-and-a-half.
12 An employee’s base salary is $58 500 per year. Calculate the monthly gross income.
13 A part-time employee works 24 hours per week at $26.50 per hour. Calculate the fortnightly gross pay.
14 A payslip, which is the 6th of the financial year, shows a current monthly gross pay of $5500 and a Year-to-Date (YTD) gross pay of $38 500. What was the average monthly gross income for the five months prior to this payslip?
15 An employee works varying hours over a month: Week 1 Week 2 Week 3 Week 4 42 hours 38 hours 45 hours 40 hours
The normal rate is $29.50 per hour with time-and-a-half paid for any overtime (hours worked over 38 per week). Calculate the total monthly gross income.
16 An employee receives a base salary of $72 800 per year. In addition, a quarterly bonus of 8% of the quarterly base salary is paid if targets are met. Calculate the total annual income if targets are met for three out of four quarters.
17 A casual employee’s payslip shows: Normal rate $31.25 per hour for 30 hours, Saturday rate (1.5×) for 6 hours, Sunday rate (2×) for 4 hours, plus a meal allowance of $15.50 per shift for 5 shifts. Calculate the total gross pay.
3.03 Taxation
After this lesson, you will be able to…
• describe and calculate different income-related taxes (PAYG)
• interpret how taxes affect net income
• explain taxation as a community contribution
Calculate income tax
Australian Taxation Office (ATO)
The government agency responsible for managing the Australian tax system and collecting revenue to fund public services like healthcare, education, and infrastructure.
Pay As You Go (PAYG)
A system where tax is withheld from an individual’s income throughout the year, rather than as a single payment at year-end.
Taxable income
The amount of income used to calculate the tax owed. It is found by subtracting allowable work-related deductions from total gross income.
Taxable income = Gross income - Allowable deductions
Tax brackets
Income ranges that determine the rate of tax paid on different portions of an individual’s taxable income.
Tax-free threshold
The portion of annual income that is not subject to income tax. In Australia, this is currently the first $18 200 earned.
Medicare Levy
An additional tax of 2% of taxable income paid by most taxpayers. This is calculated on top of standard income tax to fund Medicare.
In Australia, income tax is a fundamental system of community contribution that funds essential public services, including healthcare, education, infrastructure and welfare programs. The Australian Taxation Office (ATO) manages this system through the Pay As You Go (PAYG) framework.
Income tax is calculated based on an individual’s taxable income using progressive tax brackets. This means that as an income increases, different portions of that money are taxed at different rates. Currently, the first $18 200 of annual income is tax-free (the tax-free threshold).
The tax brackets for resident income, including the tax-free threshold, are as follows:
Taxable income
$0 – $18 200
Tax on this income
Nil
$18 201 – $45 000 16c for each $1 over $18 200
$45 001 – $135 000 $4288 plus 30c for each $1 over $45 000
$135 001 – $190 000 $31 288 plus 37c for each $1 over $135 000
$190 001 and over $51 638 plus 45c for each $1 over $190 000
The Medicare levy of 2% is added to help fund Australia’s public healthcare system.
Medicare levy = Taxable income × 0.02
Exploration
Use the provided tax table to explore how income tax changes with different taxable incomes.
Consider a scenario involving a friend’s tax obligations:
Taxable income
$0 – $18 200
Tax on this income
Nil
$18 201 – $45 000 16c for each $1 over $18 200
$45 001 – $135 000 $4288 plus 30c for each $1 over $45 000
$135 001 – $190 000 $31 288 plus 37c for each $1 over $135 000
$190 001 and over $51 638 plus 45c for each $1 over $190 000
1. If an individual earns $30 000 per year, which tax bracket do they fall into, and what is the marginal tax rate for that bracket?
2. Calculate the basic income tax payable for a taxable income of $60 000. Show the calculation steps.
3. Explain why someone with a taxable income of $20 000 still pays no tax on the first $18 200 of their income.
Example 1
Using the tax rates table, calculate the income tax payable on a taxable income of $85 000:
Taxable income
$0 – $18 200
Tax on this income
Nil
$18 201 – $45 000 16c for each $1 over $18 200
$45 001 – $135 000 $4288 plus 30c for each $1 over $45 000
$135 001 – $190 000 $31 288 plus 37c for each $1 over $135 000
$190 001 and over $51 638 plus 45c for each $1 over $190 000
Create a strategy
Identify the correct tax bracket to determine the base tax and the marginal rate. Calculate the tax on the amount above the threshold and add it to the base tax.
Apply the idea
Income of $85 000 falls in the $45 001 – $135 000 bracket.
Base tax = $4288
Amount over threshold = 85 000 45 000
= $40 000
Additional tax = 40 000 × 0.30
= $12 000
Total income tax = 4288 + 12 000
= $16 288
Therefore, the total income tax payable is $16 288.
Reflect and check
Tax on the first $45 000
Subtract the threshold from taxable income
Evaluate
Calculate 30% of the amount over threshold
Evaluate
Add base tax and additional tax
Evaluate
The calculated tax of $16 288 is roughly 19% of the total income. This is a reasonable result given the tax-free threshold and the 30% marginal rate.
Example 2
Using the tax rates table, calculate the total tax payable, including the Medicare levy, for a taxable income of $85 000:
Taxable income
Tax on this income
$0 – $18 200 Nil
$18 201 – $45 000 16c for each $1 over $18 200
$45 001 – $135 000 $4288 plus 30c for each $1 over $45 000
$135 001 – $190 000 $31 288 plus 37c for each $1 over $135 000
$190 001 and over $51 638 plus 45c for each $1 over $190 000
Create a strategy
Calculate income tax using the bracket table, then find the 2% Medicare levy on the full taxable income. Sum both values to determine the total tax payable.
Apply the idea
• Calculate income tax:
The taxable income of $85 000 falls in the $45 001 – $135 000 bracket.
Base tax = $4288
Amount over threshold = 85 000 45 000
= $40 000
Additional tax = 40 000 × 0.30
= $12 000
Total income tax = 4288 + 12 000
Tax on the first $45 000
Subtract the threshold from taxable income
Evaluate
Calculate 30% of the amount over the threshold
Evaluate
Add the base tax and additional tax = $16 288
Evaluate
• Calculate Medicare levy:
Medicare levy = 85 000 × 0.02
Calculate 2% of the taxable income = $1700
Evaluate
• Calculate total tax payable:
Total tax payable = 16 288 + 1700
Sum income tax and Medicare levy = $17 988
Evaluate
Reflect and check
The total tax payable represents both income tax and Medicare levy contributions to support public services.
Net income and tax
Understanding how various deductions and taxes affect an individual’s earnings is crucial for personal financial literacy. The calculation starts with the total amount earned and progressively subtracts different components to arrive at the final amount received.
This diagram illustrates the journey from gross income to net income.
Deductions (such as work-related expenses or charitable donations) are subtracted from gross income to determine taxable income.
Then, income tax and the Medicare levy are subtracted from taxable income.
Gross income Deductions = Taxable income
Gross income is the total amount earned before any deductions
Deductions are specific expenses that can be subtracted to reduce the tax liability
Taxable income is the amount remaining after deductions, used to calculate income tax
Net income = Taxable income Income tax Medicare levy
Net income is the final amount received after all tax and deductions have been subtracted
Taxable income is the gross income minus allowable deductions
Income tax is the tax payable to the government based on income brackets
Medicare levy is the additional tax used to fund the public health system
Under the Pay As You Go (PAYG) system, employers withhold estimated tax from each pay period and forward it to the Australian Taxation Office (ATO). At the end of the financial year, individuals file a tax return. If PAYG payments exceed the total tax payable, a refund is issued; if payments fall short, additional tax must be paid.
Did you know?
Calculating your taxable income is a critical step in managing your personal finances. In Australia, your taxable income is determined by subtracting allowable deductions—such as work-related expenses, charitable donations, or specific self-education costs—from your total gross income. By maintaining accurate records, you ensure your tax return is calculated correctly. This preparation helps you avoid paying more tax than necessary and can often lead to a higher tax refund at the end of the financial year.
Example 3
An individual has a gross annual income of $90 000 and claims $5000 in allowable deductions. Calculate the taxable income, then determine the total tax payable including income tax and Medicare levy, using this tax rates table:
Taxable income
$0 – $18 200
Tax on this income
Nil
$18 201 – $45 000 16c for each $1 over $18 200
$45 001 – $135 000 $4288 plus 30c for each $1 over $45 000
$135 001 – $190 000 $31 288 plus 37c for each $1 over $135 000
$190 001 and over $51 638 plus 45c for each $1 over $190 000
Create a strategy
First, calculate taxable income by subtracting deductions from gross income. Then, use the tax brackets to calculate income tax on the taxable income and add the 2% Medicare levy.
Apply the idea
• Calculate taxable income:
Taxable income = 90 000 5000
= $85 000
Subtract deductions from gross income
Evaluate
• Calculate income tax (for $85 000 taxable income): $85 000 falls in the $45 001 – $135 000 bracket.
Base tax = $4288
Amount over threshold = 85 000 45 000
= $40 000
Additional tax = 40 000 × 0.30
= $12 000
Total income tax = 4288 + 12 000
= $16 288
• Calculate Medicare levy:
Medicare levy = 85 000 × 0.02
= $1700
• Calculate total tax payable:
Total tax payable = 16 288 + 1700
= $17 988
Reflect and check
Tax on the first $45 000
Subtract the threshold from taxable income
Evaluate
Calculate 30% of the amount over threshold
Evaluate
Add the base tax and additional tax
Evaluate
Calculate 2% of taxable income
Evaluate
Add the income tax and Medicare levy
Evaluate
The taxable income is correctly calculated before applying tax rates. The total tax payable for a $85 000 taxable income (which is $90 000 gross minus $5000 deductions) is consistent with previous calculations, showing the full process from gross income.
Example 4
Calculate the net monthly income for an employee with an annual salary of $72 000 and a monthly PAYG tax of $1275.
Create a strategy
Divide the annual salary by 12 to find the monthly gross income. Subtract the monthly PAYG tax from this result to determine the net monthly income.
Apply the idea
Monthly gross income =
= $6000
Monthly PAYG tax = $1275
Net monthly income = 6000 1275
= $4725
Divide annual income by 12 months
Evaluate
Identify the given tax amount
Subtract tax from gross income
Evaluate
Reflect and check
The net pay represents approximately 79% of the gross monthly income ($4725 ÷ $6000). This is a reasonable result for this income level after tax withholding.
Idea summary
Key points about income and tax:
• Tax consists of income tax (based on brackets) and Medicare levy (2%).
• Net income equals gross income minus all tax and deductions.
• PAYG system helps distribute tax payments throughout the year.
• Tax returns reconcile actual tax liability with PAYG payments.
3.03 Practice questions
What do you remember?
1 Consider the basic terminology of income and tax:
a Identify the term for the total amount of money earned before any tax or deductions are subtracted.
b Complete the formula: Taxable income = Gross income ⬚
c If a worker has $0 in allowable deductions, how does the taxable income compare to the gross income?
d An employee earns $60 000 and has $1500 in work-related deductions. Calculate the taxable income.
2 Determine whether these statements regarding the Medicare levy are true or false:
a The Medicare levy is currently 2% of an individual’s taxable income.
b The Medicare levy is a voluntary payment that Australians can choose to opt out of.
c Funds from the Medicare levy are used to help support Australia’s public healthcare system.
d The Medicare levy is calculated based on gross income before deductions are subtracted.
3 Consider these scenarios regarding the tax-free threshold in Australia:
a What is the current dollar value of the tax-free threshold?
b If a student earns $15 000 in a year, how much income tax is required to be paid?
c Does the tax-free threshold apply to all residents, or only to those earning less than $18 200?
d If an individual earns $20 000, how much of that income is subject to income tax?
4 Consider these questions regarding the Australian tax system:
a Is the Australian Taxation Office (ATO) the government agency responsible for collecting revenue?
b Does the PAYG system require individuals to pay their entire annual tax bill in a single lump sum at the end of the financial year?
c Does income tax revenue help fund essential infrastructure like roads and railways?
d Is it true that the first $18 200 of a resident’s income is generally exempt from income tax?
5 Consider this resident income tax rates table:
$0 $18 200 Nil
$18 201 $45 000 16c for each $1 over $18 200
$45 001 $135 000 $4288 plus 30c for each $1 over $45 000
$135 001 $190 000 $31 288 plus 37c for each $1 over $135 000
$190 001 and over $51 638 plus 45c for each $1 over $190 000
Calculate the total income tax payable for:
a A taxable income of $65 000 b A taxable income of $35 000
6 Calculate the Medicare levy for a taxable income of $110 000.
7 A nurse earns $92 000 annually. Calculate the total tax payable including Medicare levy.
8 Calculate the monthly PAYG tax instalments for an individual earning $95 000, assuming tax is withheld evenly throughout the year.
9 A software developer earns a gross annual income of $100 000 and claims $8000 in allowable work-related deductions:
a Calculate the taxable income.
b Determine the total tax payable, including the Medicare levy.
10 Calculate the net monthly income for a teacher with an annual salary of $78 000 and monthly PAYG tax of $1300.
Extend your thinking
11 Analyse the provided data illustrating total tax paid for different gross annual incomes:
tax paid (approximately)
$30 000
$60 000
$90 000
$120 000
$2488
$9988
$19 588
$29 188 What conclusion can be drawn about the proportion (percentage) of income paid in tax as the gross income increases?
12 An employee receives a pay rise from $82 000 to $95 000. Calculate the percentage increase in the net annual income (Take-home pay) after tax and Medicare levy are subtracted.
13 Calculate and compare the effective tax rates (total tax as a percentage of gross income) for annual incomes of $45 000, $85 000, and $120 000. Explain how these results illustrate the progressive nature of the Australian tax system.
3.04 Superannuation
After this lesson, you will be able to…
• perform calculations related to compulsory superannuation
• interpret information on a superannuation statement
Superannuation calculations
Superannuation
A system of saving for retirement, particularly in Australia, where employers contribute a percentage of an employee’s gross income to a fund for their future.
Gross income
An individual’s total earnings before any deductions (such as taxes or other contributions) are taken out.
For all calculations, use the rate of 12%, as this is the legislated rate for the period relevant to the course. This contribution is paid in addition to the employee’s regular earnings.
Gross income
Employer
12% contribution
Employee’s regular pay Superannuation fund
Employers are legally obligated to contribute a percentage of an employee’s gross income to their superannuation fund, which acts as a retirement savings account.
To calculate the compulsory superannuation contribution, use the formula:
Superannuation contribution = Gross income × Contribution rate
Superannuation contribution is the mandatory amount paid by the employer into the employee’s retirement fund
Gross income is the employee’s total earnings before any deductions
Contribution rate is the percentage of gross income employers are required to contribute (currently 12% or 0.12 as a decimal)
Key aspects of superannuation contributions include:
• The compulsory contribution is calculated as a percentage of the employee’s gross income.
• This contribution is paid by the employer and is additional to the employee’s regular take-home pay.
• Employees have the option to make extra voluntary contributions to their fund.
Interactive exploration
Discover this concept in action online
Example 1
mathspace.co
An employee earns a gross salary of $65 000 per year. Calculate the employer’s compulsory superannuation contribution.
Create a strategy
Multiply the gross annual salary by the superannuation rate (0.12) to determine the total employer contribution.
Apply the idea
Superannuation = 65 000 × 0.12
Write the equation = $7800
Evaluate
Reflect and check
The amount is reasonable as it represents 12% of the gross salary.
Example 2
An employee earns a gross income of $400 per fortnight. Calculate the fortnightly superannuation contribution using a rate of 12%.
Create a strategy
Calculate 12% of the fortnightly gross pay by multiplying the earnings by the decimal rate of 0.12.
Apply the idea
Superannuation = 400 × 0.12
Write the equation = $48
Evaluate
Reflect and check
The calculation represents the correct proportion of the fortnightly earnings.
Idea summary
Employers must contribute 12% of gross income to employee superannuation. Superannuation is calculated by multiplying gross income by 0.12. Superannuation is additional to regular earnings.
Superannuation statements
Superannuation statement
A periodic financial document detailing an individual’s superannuation account activities, including contributions, investment earnings, fees and balance over a specific period.
Superannuation statements are typically issued periodically and contain essential information about the account's performance and status. These statements typically include:
• Account balance and changes over the reporting period
• Employer contributions (currently 12% of gross income), personal voluntary contributions made by the account holder
• Investment earnings or losses from the chosen investment options
• Administration and investment management fees
• Insurance premiums and coverage details
Superannuation statement flow
Opening Balance
Additions
Contributions
Employer guarantee
Personal or salary sacrifice
Investment earnings
Subtractions
Fees & costs:
Administration fees
Investment fees
Insurance premiums
Taxes on contributions
Closing balance
A superannuation statement provides a summary of all financial activities within a superannuation account over a specific period. It helps to track retirement savings growth and understand any charges.
Key sections typically include the opening balance, employer and personal contributions, investment returns, and various fees and insurance premiums, all leading to the closing balance.
Interactive exploration
Discover this concept in action online
Example 3
Sarah’s superannuation statement shows her opening balance was $45 000. During the year, her employer contributed $6000, she made personal contributions of $2000, and her investment earnings were $3200. If fees and insurance premiums totalled $650, calculate her closing balance.
Create a strategy
Add all contributions and earnings to the opening balance, then subtract the fees and premiums to find the closing balance.
Apply the idea
Total additions = 6000 + 2000 + 3200
= $11 200
Total deductions = 650
Closing balance = 45 000 + 11 200 650
= $55 550
Reflect and check
Write the equation
Evaluate
Identify the fees and premiums
Apply additions and deductions to the opening balance
Evaluate
The closing balance of $55 550 represents an increase of $10 550 from the opening balance, which aligns with the net effect of all transactions.
Example 4
A superannuation statement shows this information:
• Balanced growth rate of return: 8.5%
• Management fee: 0.85% p.a.
• Insurance premium: $8.50 per week
What are the annual fees on a balance of $75 000?
Create a strategy
Calculate the annual management fee as a percentage of the balance, then add the total annual insurance premiums.
Apply the idea
Annual management fee = 75 000 ×
= 637.50
Annual insurance premiums = 8.50 × 52
Calculate 0.85% of the account balance
Evaluate
Multiply the weekly premium by 52 weeks = 442
Total annual fees = 637.50 + 442
Reflect and check
Evaluate
Sum the management fee and insurance premiums = 1079.50
Evaluate
The total annual fees of $1079.50 comprise both percentage-based management fees and fixed insurance premiums.
Idea summary
Superannuation statements document retirement savings account activity and performance. Key components include contributions, investment earnings and various fees. Regular monitoring of statements enables effective retirement planning.
3.04 Practice questions
What do you remember?
1 Match each description with its correct term or value:
a The total earnings of an individual before any deductions or taxes
b A long-term savings system designed to provide income for Australians in retirement.
c The mandatory percentage of gross income that employers must contribute to an employee’s fund.
d Costs deducted from a superannuation account to cover administration or insurance.
2 Consider these scenarios:
i Fees or premiums
ii Gross income
iii 12%
iv Superannuation
a If an employee receives a pay rise, will the amount of the employer’s compulsory superannuation contribution increase, decrease, or stay the same?
b If a superannuation balance decreases even though the employer made payments, identify one possible reason for this change.
3 Classify each of these transactions as a contribution, earning/loss, or fee:
a $150 administration charge
b $7700 employer payment
c $300 market adjustment
d $1000 personal voluntary payment
e $10.50 weekly insurance premium
Practice
4 Calculate the annual superannuation contribution for an employee earning a gross salary of $78 500, using the standard 12% rate.
5 An employee’s gross weekly pay is $1250. Calculate the weekly superannuation contribution (at 12%).
6 Calculate the monthly superannuation contribution for an individual earning $6200 gross per month.
7 If an employee’s total superannuation contributions for the year were $11 000, what was their gross annual income? Round your answer to the nearest cent.
8 A superannuation statement shows an opening balance of $82 000. During the year, employer contributions were $7150, personal contributions were $3000, investment earnings were $5900, and fees totalled $720. Calculate the closing balance.
9 Michael’s superannuation fund charges an annual management fee of 0.95% and insurance premiums of $12 per week. Calculate the total annual fees on an account balance of $120 000.
10 Review this superannuation statement extract:
• Investment return: 7.2%
• Administration fee: $78 annually
• Insurance premium: $9.50 weekly
• Account balance: $55 000
a Calculate the total annual fees (including insurance).
b Calculate the expected annual investment return in dollars (before fees).
11 Analyse this quarterly statement:
• Opening balance: $28 500
• Employer contribution: $825
• Investment return: 2.1% (calculated on the opening balance)
• Fees: $95
Calculate the closing balance for the quarter.
12 A superannuation statement shows an opening balance of $75 000, employer contributions of $8250, investment earnings of $4500, and a closing balance of $86 750. What was the total amount of fees charged for the period?
Extend your thinking
13 An employee earns a base salary of $85 000 plus commission. During the financial year, the employee earned $23 500 in commission. Calculate the total employer superannuation contribution for the year (at 12%).
14 A superannuation fund offers three investment options:
• Conservative: 5.5% return, 0.6% fee
• Balanced: 7.8% return, 0.8% fee
• Growth: 9.2% return, 1.1% fee
For an account balance of $200 000, calculate the net return (investment return minus fees) for each option.
15 An employee salary sacrifices $5000 of their $90 000 gross salary into superannuation. Calculate:
a The reduced taxable income
b The employer’s superannuation contribution (based on the reduced salary)
c The total annual amount entering the superannuation fund (employer contribution plus salary sacrifice)
Your superannuation isn’t just sitting there—it’s invested in shares of global companies, technology firms, and local infrastructure projects. By choosing different investment options, you decide the level of growth you want, with younger workers often selecting high-growth portfolios for better long-term returns. Experts monitor these investments, helping you choose a strategy that grows your money while you focus on your studies.
INVESTIGATION
Calculate and compare tax
Investigate how income tax is calculated in Australia and compare the tax paid by workers in different employment scenarios.
Objectives
• To source current tax rates and thresholds from the Australian Taxation Office (ATO).
• To calculate the income tax, Medicare levy and net income for different employment scenarios using a spreadsheet.
• To compare and analyse the financial outcomes for each scenario and communicate findings in a structured report.
Materials
• Access to the internet (ATO website)
• Spreadsheet software
• Calculator
• Pen and paper for planning
Understanding income tax in Australia
What is income tax?
In Australia, individuals pay income tax on the money they earn. The amount of tax a person pays depends on their total taxable income for the financial year. The Australian Taxation Office (ATO) publishes tax rate tables that show the amount of tax owed at each income level. These rates change from time to time, so it is important to refer to the most current information.
Progressive tax system
Australia uses a progressive tax system. This means that as a person earns more income, the rate of tax they pay on the additional income increases. Different portions of a person’s income are taxed at different rates, according to the tax brackets set by the ATO.
Medicare levy
In addition to income tax, most Australian taxpayers also pay a Medicare levy. The Medicare levy helps fund Australia’s public health system. It is calculated as a percentage of a person’s taxable income and is paid on top of the income tax amount.
• Research current tax rates:
Step 1: Visit the ATO website and find the current individual income tax rates for Australian residents. Record the tax brackets and the rate of tax that applies to each bracket in your spreadsheet.
Step 2: Find the current Medicare levy rate. Record this rate in your spreadsheet.
Step 3: Identify the tax-free threshold. This is the amount of income a person can earn before they start paying income tax.
• Set up worker profiles:
Step 1: Compare the tax for three different workers. Use the following annual gross incomes, or choose your own realistic values: Worker A earns $35 000, Worker B earns $72 000, and Worker C earns $130 000.
Step 2: For each worker, set up a row in your spreadsheet with their name and gross annual income.
• Calculate income tax for each worker:
Step 1: Using the tax brackets you recorded, calculate the income tax payable for each worker. Remember that only the income within each bracket is taxed at that bracket’s rate.
Step 2: Show the tax calculated for each bracket separately, then add them together to find the total income tax for each worker.
Step 3: Use spreadsheet formulas to perform the calculations so that you can easily change the income values later.
Does a worker with a higher income always pay more total tax? Verify your calculations make sense before continuing.
• Calculate the Medicare levy and net income:
Step 1: For each worker, calculate the Medicare levy by applying the Medicare levy rate to their gross income.
Step 2: Calculate the total deductions (income tax and Medicare levy) for each worker.
Step 3: Calculate the net annual income for each worker by subtracting total deductions from their gross income. Then calculate their net weekly and net fortnightly income.
Investigate
Use the completed spreadsheet to answer these questions:
1. For each worker, calculate the percentage of their gross income that goes to income tax. Which worker pays the highest percentage of their income in tax? Explain why this is the case.
2. Worker B receives a $10 000 pay rise. How much of that extra $10 000 does Worker B actually take home after tax and the Medicare levy? Use your spreadsheet to find out.
3. Compare the net weekly income of Worker A and Worker C. Worker C earns roughly 3.7 times the gross income of Worker A. Is Worker C’s net weekly income also 3.7 times as much? Explain why or why not.
4. A friend says, “There’s no point earning more money because the government just takes it all in tax.” Use your calculations to explain whether or not this statement is accurate.
Discussion
1. Australia’s progressive tax system means higher earners pay a greater percentage of their income in tax. Do you think this is a fair system? What are some arguments for and against it?
2. Taxes fund public services such as healthcare, education, roads and social support. Choose one public service and explain how it benefits the community. Do you think the amount of tax Australians pay is reasonable for the services they receive?
3. Research one other country’s income tax system (for example, New Zealand or the United Kingdom). How does it compare to Australia’s system? Identify at least two similarities and two differences.
Chapter review
1 A bank account has an opening balance of $4210. During the month, deposits of $1300 and $750 were made, while withdrawals of $2500 and $880 were processed. Calculate the closing balance of the account.
2 Calculate the simple interest earned on a savings account with $9500 invested at 3.8% p.a. for 24 months.
3 A loan of $18 000 is taken out with a simple interest rate of 6.2% p.a. for 3 years. If the total amount (principal plus interest) is to be repaid in equal quarterly instalments, calculate the amount of each repayment.
4 A gas bill shows a previous meter reading of 3510 units and a current reading of 3840 units. The usage rate is $0.22 per unit and the supply charge is $0.90 per day. Calculate the total bill amount for a 92-day quarter, including 10% GST, rounded to the nearest cent.
5 A retail store buys a jacket for a wholesale price of $80. The store marks up the wholesale price by 60%. The final selling price will be the marked-up price plus 10% GST. Calculate the final selling price of the jacket.
6 An item costing $950 is purchased using a buy-now-pay-later service. Four equal monthly payments of $237.50 are made. There is an $18 late fee for any missed payment. Calculate the total cost of the item if one payment is missed.
7 Calculate the annual salary for an employee who earns a gross amount of $850 per week.
8 A builder is employed full-time and earns a gross income of $1950 per week. Assume there are exactly 52 weeks in a financial year, show that the builder’s gross annual income for this financial year is $101 400.
9 Calculate the weekly gross income for an employee who works 35 hours at an hourly rate of $29.50.
10 An employee works 44 hours in a week. The normal rate is $25 per hour for the first 38 hours, and time-and-a-half for overtime. Calculate the total weekly gross income.
11 An employee’s starting annual salary is $72 000. If the pay scale includes an annual 3.5% increase, calculate the annual salary at the start of the second year.
12 A monthly payslip shows a gross pay of $6200. Deductions include $1850 for tax, $620 for superannuation, and $95 for health insurance. Calculate the net pay for the month.
13 A fortnightly payslip shows a current gross pay of $3100 and a Year-to-Date (YTD) gross pay of $21 700. How many fortnights has the employee been paid for in total this year (including this payslip)?
14
A tradesperson earned a gross income of $95 000 in a financial year. Work-related deductions to be claimed are:
• $3200 for tools
• $250 for protective boots
• $1200 for work-related travel
Show that the taxable income after deductions is $90 350.
15 Consider this resident income tax rates table:
Taxable income
$0 – $18 200
16
17
Tax on this income
Nil
$18 201 – $45 000 16c for each $1 over $18 200
$45 001 – $135 000 $4288 plus 30c for each $1 over $45 000
$135 001 – $190 000 $31 288 plus 37c for each $1 over $135 000
$190 001 and over $51 638 plus 45c for each $1 over $190 000
a Calculate the total income tax payable (excluding Medicare levy) on a taxable income of $90 350.
b Calculate the total tax payable for a taxable income of $130 000, including the 2% Medicare levy.
Calculate the net monthly income for an employee with an annual salary of $84 000, and a monthly PAYG tax is $1330.
Calculate the annual compulsory superannuation contribution for an employee earning a gross salary of $92 000, using a superannuation guarantee rate of 12%.
18 An employee’s gross weekly pay is $1450. Calculate their weekly compulsory superannuation contribution, using a rate of 12%.
19 A superannuation statement shows an opening balance of $110 000. During the year, employer contributions were $9800, personal contributions were $4000, investment earnings were $8200, and fees totalled $850. Calculate the closing balance.
20 A superannuation fund charges a management fee of 0.90% p.a. and insurance premiums of $10 per week (assume 52 weeks in a year). Calculate the total annual fees on an account with a balance of $150 000.
21 An employee’s weekly payslip includes:
• Hours worked: 25 hours at the ordinary rate of $24.00 per hour
• Hours worked: 8 hours at the time-and-a-half rate
The employer must contribute 12% of the employee’s earnings into a superannuation account. Assume superannuation is payable on the total gross income:
a Show that the employee’s total gross weekly income is $888.
b Calculate the correct weekly superannuation contribution.
Big ideas
• Measuring physical space involves quantifying its different dimensions: length, area, and volume, using standardised metric units. The application of specific formulas allows for the calculation of perimeter (1D boundary), area, and surface area (2D surfaces), and volume (3D space) for various geometric shapes. Accurate measurement relies on selecting appropriate instruments and correctly interpreting their analogue or digital scales.
• The measurement of time is a critical skill for planning and scheduling, involving the calculation of durations and the conversion between 12-hour and 24-hour formats. These skills are applied to interpret timetables and schedules, enabling the planning of complex, multi-stage journeys by identifying the critical path of travel and connection times.
4 Measurement and space
Chapter outline
Shipping and storage rely on volume: pack a box badly, and you waste space; pack it well, and you can fit more without increasing the container size.
4.01 Metric units and conversions
After this lesson, you will be able to…
• identify and use common metric units for length, area, surface area, volume, capacity, time, mass, and temperature
• convert between standard metric units
Common metric units and conversions
Metric system
A decimal system of measurement based on powers of 10. It uses standard units such as the metre, litre, and gram, combined with prefixes to indicate multiples or submultiples of these units.
The metric system uses standardised units to measure different physical quantities. Each type of measurement has its own standard unit:
Common metric prefixes follow a systematic pattern based on powers of 10:
Prefix Symbol
kilo- k multiply by 1000 or 103 centi- c divide by 100 or multiply by 10 2 milli- m divide by 1000 or multiply by 10 3
The metric system uses a base-10 structure. With the exception of time, converting between metric units involves multiplying or dividing by powers of 10. The conversion factors for common units are summarised:
Another way to think about using the conversion factor is to see that the number in the measurement changes inversely to the unit. So when the unit gets bigger, the number gets smaller, and when the unit gets smaller, the number gets bigger.
Unit gets bigger
25 mm = 2.5 cm
Number gets smaller
Common metric conversion factors:
Unit gets smaller
4 km = 4000 m
Number gets bigger
• Length: 1 kilometre = 1000 metres; 1 metre = 100 centimetres
• Temperature: Water freezes at 0°C and boils at 100°C.
Exploration
Determine the unit of length (mm, cm, m, or km) that would be most appropriate to measure each object. Explain your reasoning:
1. Pencil
2. Football field
3. Paperclip
Example 1
Determine the most appropriate metric unit for each situation:
1. The distance of a standard athletic sprint track
2. The capacity in a small medicine dropper
3. The mass of a standard apple
4. The area of a single square on a chessboard
5. The distance from London to Paris
Create a strategy
Identify the physical quantity being measured in each statement (length, mass, capacity, or area). Then, select the most appropriate metric unit from the provided list, considering the typical scale of the measurement.
Apply the idea
1. Distance of a standard athletic sprint track: The metre is the standard unit for length and is appropriate for measuring distances such as a sprint.
The most appropriate unit is metres (m).
2. Capacity of liquid in a small medicine dropper: A small amount of liquid requires a unit indicating a small fraction of a litre.
The most appropriate unit is millilitres (mL).
3. Mass of a standard apple: An apple is a relatively light object, but not extremely light. Grams are suitable for measuring the mass of common items.
The most appropriate unit is grams (g).
4. Area of a single square on a chessboard: The small size of a chessboard square suggests a smaller unit of area than square metres.
The most appropriate unit is square centimetres (cm2).
5. Length from London to Paris: The distance between two cities is a significant length. Kilometres are used for long distances.
The most appropriate unit is kilometres (km).
Reflect and check
Choosing the correct metric unit depends on both the type of physical quantity (e.g., length, mass) and the scale of the object or distance being measured. Selecting an appropriate unit ensures measurements are practical and easy to understand.
Example 2
A parkrun route is 2.5 kilometres long. Convert this distance to metres.
Create a strategy
To convert from kilometres to metres, use the conversion factor: 1 km = 1000 m
Apply the idea
2.5 km × 1000 = 2500 m
The parkrun route is 2500 metres long.
Reflect and check
Verify using a conversion fraction. Multiply by :
The unit “km” cancels out, leaving the answer in “m”.
Example 3
A recipe for a batch of soup requires 3500 millilitres of vegetable stock. Convert this volume to litres.
Create a strategy
To convert from millilitres to litres, use the conversion factor: 1000 mL = 1 L
Apply the idea 3500 mL ÷ 1000 = 3.5 L
The recipe requires 3.5 litres of vegetable stock.
Reflect and check
Verify using a conversion fraction. Multiply by :
The unit “mL” cancels out, leaving the answer in “L”.
Idea summary
• The metric system uses standard units such as the metre, gram, litre, and degrees Celsius to measure physical quantities.
• Metric prefixes indicate multiplication or division by powers of 10. Common prefixes include kilo- (×1000), centi- (÷100), and milli- (÷1000).
• Converting to larger units requires division, while converting to smaller units requires multiplication.
• Always check if the converted value is reasonable based on the relative size of the units.
4.01 Practice questions
What do you remember?
1 Match each physical quantity to its corresponding metric standard unit:
a Length i Litre (L)
b Mass ii Metre (m)
c Capacity iii Second (s)
d Time iv Gram (g)
2 Determine whether the statements are true or false. If a statement is false, provide a brief correction:
a The metric system is a decimal system based on powers of 12.
b The prefix ‘centi-’ means to divide a standard unit by 100.
c When converting from a larger unit (like km) to a smaller unit (like m), the numerical value becomes smaller.
3 Complete this table:
Prefix Symbol Meaning kilo- k Multiply by 1000
⬚ c Divide by 100 milli- ⬚ Divide by 1000
4 Select the most reasonable estimate for each measurement:
a The length of a new pencil A 18 mm B 18 cm
b The mass of a large dog A 30 kg
30 g
c The capacity of a standard bucket
10 mL
10 L
d The temperature of a warm sunny day
10°C
80°C
18 m
300 kg
10 kL
28°C
5 Which of these is the most appropriate unit to measure the mass of a single pen? A Kilograms (kg) B Litres (L) C Grams (g) D Metres (m)
6 How many millilitres (mL) are there in 2 litres of water?
7 A chef is designing a new recipe and wants to ensure all ingredient measurements are specified using metric units. From the list, identify if the units are metric or not:
a gram b cup c teaspoon d kilogram
e fluid ounce f litre g pound h millilitre
8 For each situation, determine the most appropriate metric unit of measurement:
a The length of a football field
b The volume of water in a swimming pool
c The mass of a school bus
d The thickness of a piece of paper
e The amount of liquid in a small cup of coffee
f The mass of a loaf of bread
9 A cycling trail through a national park is 4.7 km long. Convert this distance to metres.
10 Perform these metric conversions for length:
a Convert 7.5 m to centimetres.
c Convert 3.2 km to metres.
11 Perform these metric conversions for mass:
a Convert 4200 g to kilograms.
c Convert 0.5 tonnes to kilograms.
b Convert 350 cm to metres.
d Convert 45 mm to centimetres.
b Convert 1.8 kg to grams.
d Convert 250 mg to grams.
12 Perform these metric conversions for volume or capacity:
a Convert 2500 mL to litres.
c Convert 4.2 L to millilitres.
b Convert 0.25 kL to litres.
d Convert 1500 L to kilolitres.
13 Perform these metric conversions for time:
a Convert 3 hours and 30 minutes to minutes.
b Convert 120 minutes to hours.
c Convert 180 seconds to minutes.
d Convert 2 days to hours.
14 A smoothie recipe uses 1750 mL of fruit juice. Convert this volume to litres.
15 Water freezes at 0°C and boils at 100°C. Identify the name of this temperature scale.
Extend your thinking
16 A rectangular garden bed has a length of 4 m and a width of 250 cm. Calculate its area in square metres.
17 Convert 2.5 hours to seconds.
18 A box contains 2.5 kg of rice, 750 g of beans, and 1250 g of pasta. What is the total mass in kilograms?
19 A closed cube has a side length of 50 cm. Calculate the total surface area of the cube in square metres.
4.02
Perimeter
After this lesson, you will be able to…
• calculate the perimeter of standard polygons and circles
Perimeter of polygons
Perimeter
The total distance around the boundary of a closed two-dimensional geometric figure.
The most basic method to calculate the perimeter of any polygon is to identify the lengths of all its sides and add them together.
Interactive exploration
Discover this concept in
While adding every side works for irregular shapes, faster, specific formulas can be used for shapes that have equal sides or symmetry.
Length
Width
Side length
Side length
Rectangles: Since opposite sides are equal, double the length and width rather than adding four numbers.
P = 2l + 2w
Or by grouping the sides first: P = 2(l + w)
Squares: Since all four sides are the same length s, multiplication is faster than addition.
P = 4s
Regular polygons: This multiplication rule applies to any regular polygon. For a shape with n sides of length l:
P = n × l
For this hexagon, n = 6, so P = 6 × l.
Example 1
A gardener wants to install a timber border around a rectangular vegetable patch. The patch measures 8.5 metres long and 4.2 metres wide:
a Estimate the total length of timber required by rounding the dimensions to the nearest metre.
Create a strategy
Round the length and width to the nearest whole number, then calculate the perimeter.
Apply the idea
Round the measurements of length and width.
P = 2(l + w)
≈ 2(9 + 4)
≈ 26 m
Write the formula
Substitute the estimated values
Evaluate
The estimated total length of timber required is 26 m.
b Calculate the exact perimeter.
Create a strategy
Use the formula P = 2(l + w).
Apply the idea
P = 2(l + w)
= 2(8.5 + 4.2)
= 2(12.7)
= 25.4 m
Reflect and check
Write the formula
Substitute the exact values
Evaluate the addition inside the brackets
Evaluate
The estimated perimeter (26 m) was very close to the exact perimeter (25.4 m), validating the calculation.
c Timber sleepers are sold in 3-metre lengths. How many sleepers must the gardener buy to ensure they have enough?
Create a strategy
Divide the total perimeter by the sleeper length and round up (ceiling) because sleepers are purchased as whole units.
Apply the idea
Total length needed is 25.4 m. Length of one sleeper is 3 m:
Sleepers needed = 25.4 ÷ 3
Write the equation ≈ 8.46
Evaluate
The gardener cannot buy 0.46 of a sleeper. Therefore, round up. The gardener must buy 9 sleepers.
Reflect and check
Practically, buying 9 sleepers (27 m) provides a small amount of spare timber for cuts and waste.
Example 2
A carpenter is building a hexagonal gazebo (a regular 6-sided polygon). The client wants the total perimeter of the floor to be exactly 18 metres.
Calculate the length of each floor beam (the side length) required.
Create a strategy
This is a regular hexagon where n = 6. Rearrange the perimeter formula P = n × l to find the side length l
Apply the idea
Divide the perimeter by number of sides n
Substitute the values
Evaluate
The carpenter must cut 6 beams, each 3 metres long.
Idea summary
Key points about polygon perimeter:
• Perimeter is the sum of all side lengths.
• Rectangle perimeter: P = 2l + 2w or P = 2(l + w)
• Square perimeter: P = 4s
• Regular polygon perimeter: P = n × l
Circumference of circles
Circle
A set of all points in a plane that have a fixed distance from a central point.
A line segment joining the central point to any point on the circle is called a radius.
A line segment joining two points on the circle, passing through the central point, is called a diameter
The diameter is equal to twice the radius, since any diameter can be split into two radii: d = 2r
The circumference of a circle is the distance around its boundary. The circumference can be thought of as the perimeter of the circle.
It can be calculated using two equivalent formulas:
• Using radius: C = 2πr
• Using diameter: C = πd
Since the diameter is twice the radius (d = 2r), these formulas are equivalent. The value of π is approximately 3.141 59…
Example 3
A landscape gardener needs to install plastic edging around a circular flower bed. The bed is defined by a central sprinkler that sprays water to a radius of 4 metres.
Calculate the total length of edging required. Round the answer to two decimal places.
Create a strategy
Identify the radius (r = 4) and use the circumference formula C = 2πr
Apply the idea
Substitute the radius into the formula:
C = 2πr
= 2π × 4
= 8π
Write the formula
Substitute r = 4
Evaluate the multiplication
= 25.1327… Evaluate by substituting π = 3.1416 …
≈ 25.13 m
Round to two decimal places
The gardener needs approximately 25.13 m of edging.
Reflect and check
Practically, the gardener would likely buy 26 m or a 30 m roll to account for any overlap or waste.
Example 4
A bicycle wheel has a diameter of 70 cm. Calculate how far the bicycle travels in one full revolution of the wheel. Round the answer to the nearest centimetre.
Create a strategy
The distance travelled in one turn is equal to the circumference of the wheel. Since the diameter is given, use the formula C = πd.
Apply the idea
Substitute the diameter into the formula:
C = πd
= π × 70
Write the formula
Substitute d = 70
= 219.911… Evaluate
≈ 220 cm
Round to the nearest centimetre
The bike travels approximately 220 cm (or 2.2 m) for every full revolution of the wheel.
Idea summary
The perimeter of a circle, or the circumference, can be calculated using these formulas:
• Using radius: C = 2πr
• Using diameter: C = πd
4.02 Practice questions
What do you remember?
1 Determine whether each statement is true or false:
a The perimeter of a regular polygon is always equal to the number of sides multiplied by the side length.
b The radius of a circle is calculated by dividing the diameter by 2.
c The term circumference refers to the total area inside a circle.
d A rectangle has four sides, but only the lengths of two adjacent sides are needed to calculate its perimeter.
2 What is the name of a polygon that has 9 sides?
3 Write the relationship between the diameter (d) and the radius (r) of a circle as an equation. Practice
4 Determine the perimeter of:
c A regular hexagon where the length of each side is 9 cm
d A regular pentagon where the length of each side is 12 m
5
6
A handyman is installing a decorative border around a rectangular patio. The patio measures 6.2 metres long and 3.8 metres wide:
a Estimate the total length of border required by rounding the dimensions to the nearest metre.
b Calculate the exact perimeter of the patio.
c Border stones are sold in 0.8-metre lengths. How many stones must the handyman buy to ensure they have enough?
A student is comparing two regular polygons. Shape A is a regular hexagon with a side length of 14 cm. Shape B is a regular octagon with a side length of 11 cm:
a Calculate the perimeter of both Shape A and Shape B.
b Determine which shape has the larger perimeter and by how many centimetres.
7 A carpenter is building an octagonal table top (a regular 8-sided polygon). The client wants the total perimeter of the edge to be exactly 12 metres. Calculate the length of each side required.
8
A square has the same perimeter as an equilateral triangle. If the triangle has sides of length 55 mm each, determine the side length of the square, rounded to two decimal places.
9 Calculate the circumference of a circle with a radius of 12 cm. Round the answer to two decimal places.
10 Find the circumference of a circle with a diameter of 15 m. Round the answer to two decimal places.
11
A circular mirror has a radius of 25 cm:
a Find the exact circumference of the mirror in terms of π.
b Calculate the circumference, rounded to the nearest whole centimetre.
12 A landscape gardener is marking out a circular vegetable patch with a radius of 3.5 m:
a Find the exact length of the boundary in terms of π.
b Calculate the length, rounded to one decimal place.
13 A trundle wheel used to measure distances on a sports field has a diameter of 32 cm:
a Write an expression for the exact distance the wheel travels in one full revolution.
b Calculate this distance, rounded to the nearest centimetre.
14 A round dining table has a diameter of 1.8 m. A strip of protective edging is required to go around the rim:
a Calculate the exact length of edging required in terms of π
b If the edging is sold by the metre, determine how many full metres must be purchased to cover the table.
15 A tyre has a circumference of 188.5 cm. Calculate the radius of the tyre, rounded to the nearest whole centimetre.
Extend your thinking
16 A wire with the length of 80 cm is cut into two equal pieces. One piece is used to form a square, and the other piece is used to form a circle. Calculate the difference between the side length of the square and the diameter of the circle. Round the answer to two decimal places.
17 A rectangular piece of synthetic grass is placed inside a rectangular area of lawn as shown:
a If both the synthetic grass and the grass area are to be fully fenced, calculate the total amount of fencing required.
b If the fencing costs $25.60 per metre, calculate the total cost of the fencing.
18 A circular path is built around a central pond. The inner edge of the path (the pond’s boundary) has a diameter of 10 m. The path is 2 m wide all the way around:
a Calculate the circumference of the inner edge of the path, rounded to two decimal places.
b Calculate the circumference of the outer edge of the path, rounded to two decimal places.
Did you know?
Understanding the perimeter of shapes is vital in everyday problem-solving! For example, landscapers use perimeter calculations to determine the amount of fencing needed for gardens or parks. By measuring the boundary of an area, they can plan materials efficiently and avoid unnecessary costs. Knowing how to calculate perimeter makes it easier to design, budget, and manage spaces in practical, real-world projects!
After this lesson, you will be able to…
• calculate the area of standard shapes including triangles, rectangles, and circles
Area of rectangles and squares
Area
The measure of the space enclosed within the boundaries of a two-dimensional shape, measured in square units.
The area of a rectangle is found by multiplying its length by its width.
A = l × w
A is the area l is the length w is the width side
Interactive exploration
Since a square has four equal sides, its area is found by squaring the side length.
A = s 2
A is the area s is the side length
Discover this concept in action online mathspace.co
Example 1
A painter needs to calculate the area of a rectangular wall that is 5 m long and 2.4 m high to determine how much paint is needed. Calculate the area of the wall.
Create a strategy
Identify the length and width of the rectangle and apply the area formula: A = l × w
Apply the idea
Substitute the given dimensions into the formula:
A = l × w
= 5 × 2.4
= 12 m2
Write the formula
Substitute l = 5 and w = 2.4
Evaluate
The area of the wall is 12 m2.
Reflect and check
The units are in metres, so the area is correctly expressed in square metres. The calculation is a straightforward multiplication.
Idea summary
Key points for calculating the area of rectangle and square:
• Area of a rectangle: A = l × w
• Area of a square: A = s 2
• Ensure measurements are in the same units.
• Area units are always squared (e.g., cm2, m2).
Area of triangles
The area of a triangle is determined by its base (b) and its perpendicular height (h). The height must always be at a right angle (90°) to the base.
A is the area
b is the length of the base
h is the perpendicular height
Internal height: In many triangles, the height is an internal line that drops from the highest vertex to meet the base at 90°.
Right-angled triangle: The height is the side of the triangle perpendicular to the base.
Interactive exploration
External height: In obtuse triangles, the height is measured from the highest vertex to a horizontal extension of the base.
Discover this concept in action online mathspace.co
Example 2
A fabricator is making a triangular warning sign. The sign must have a base of 40 cm and a perpendicular height of 35 cm. What is the area of the sign in square centimetres?
Create a strategy
Apply the triangle area formula:
Apply the idea
Write the formula
Substitute b = 40 and h = 35
Evaluate
The area of the sign is 700 cm2
Reflect and check
The area of a triangle is half the area of the enclosing rectangle. A 40 cm × 35 cm rectangle has an area of 1400 cm2. Half of this is 700 cm2, so the answer is reasonable.
Idea summary
Key points for calculating triangle areas:
• Area of a triangle:
• Use the perpendicular height measured at right angles to the base.
Area of composite shapes
Composite shape
A figure made by combining two or more simple geometric shapes.
To calculate the area of a composite shape, the figure is divided into simpler parts (such as rectangles, squares, or triangles). The area of each individual part is calculated separately, and the results are added together to find the total area.
Example 3
A stonemason is cutting a countertop in the shape of a trapezium. The two parallel sides are 1.2 m and 0.8 m long. The perpendicular distance between them (the height) is 0.6 m.
Calculate the area of the countertop.
Create a strategy
Break the trapezium into a rectangle and a triangle. Calculate the area of each shape separately and then add the areas together to find the total area.
Apply the idea
• Step 1: Decompose the shape and find dimensions.
The shape can be split into a rectangle with dimensions 0.8 m × 0.6 m, and a triangle with a height of 0.6 m.
The base of the triangle is the difference between the parallel sides: 1.2 0.8 = 0.4 m
• Step 2: Calculate the area of the rectangle.
Arectangle = l × w
= 0.8 × 0.6
= 0.48 m2
• Step 3: Calculate the area of the triangle.
• Step 4: Add the areas together.
Atotal = Arectangle + Atriangle
= 0.48 + 0.12
Write the formula
Substitute l = 0.8 and w = 0.6
Evaluate
Write the formula
Substitute b = 0.4 and h = 0.6
Evaluate
Sum the areas of the two parts
Substitute the calculated areas = 0.6 m2
The total area of the countertop is 0.6 m2
Evaluate
Reflect and check
Alternatively, the formula for the area of a trapezium can be used. This formula finds the average of the parallel sides and multiplies it by the height:
where a and b are the parallel sides and h is the height.
Substituting the values from the question:
Substitute a = 1.2, b = 0.8, and h = 0.6 into the formula
Evaluate the expression in the brackets
Simplify
Evaluate the final area
The result is the same, confirming the answer is correct.
Example 4
A carpenter is building the front panel of a dog kennel, as shown in the diagram:
Calculate the total area of wood required for the panel.
Create a strategy
Divide the figure into two simpler shapes: a rectangle and a triangle. Calculate the area of each using their respective formulas, then add them together for the total area.
Apply the idea
• Step 1: Calculate the area of the rectangular section.
Arectangle = l × w
= 12 × 8
Write the formula
Substitute l = 12 and w = 8 = 96 m2
Evaluate
• Step 2: Calculate the area of the triangular section.
Write the formula
Substitute b = 12 and h = 5
Evaluate
• Step 3: Add the areas together.
Total Area = Arectangle + Atriangle Sum the areas of the two parts = 96 + 30
Substitute the calculated areas = 126 m2
Evaluate
The total area of wood required is 126 m2.
Reflect and check
The result is reasonable as it combines a large rectangular base (96 m2) with a smaller triangular roof (30 m2).
Idea summary
To find the area of a composite shape:
1. Identify the simpler shapes within the composite figure.
2. Apply the correct area formula for each individual part.
3. Sum the individual areas to find the total area of the figure.
Area of circles
Radius
The area of a circle is the amount of space enclosed within its circumference. It is calculated using the radius (r).
A = πr 2
A is the area
π is a constant approximately equal to 3.141 59… r is the radius of the circle
The formula demonstrates that the area of a circle grows quadratically with its radius due to the square term. This means doubling the radius will increase the area by a factor of four.
Interactive exploration
Discover this concept in action online
Example 5
A circular café table has a radius of 30 cm. Calculate the area of the tabletop that needs to be polished, rounding the answer to two decimal places.
Create a strategy
Apply the area formula A = πr 2 by substituting the given radius.
Apply the idea
A = πr 2
= π × 302
= 900π
≈ 2827.43 cm2
Write the formula
Substitute r = 30
Evaluate the square
Evaluate and round to two decimal places
The area to be polished is approximately 2827.43 cm2.
Reflect and check
The diameter of the table is 60 cm. The area is less than a 60 cm × 60 cm square (3600 cm2), so the answer is reasonable.
Example 6
A circular garden bed has a diameter of 4 metres. Calculate the area that needs to be covered by mulch, rounding the answer to two decimal places.
Create a strategy
First, find the radius by halving the diameter. Then, apply the area formula: A = πr 2
Apply the idea
• Step 1: Convert the diameter to radius.
Write the formula for the radius
Substitute d = 4
Evaluate the radius
• Step 2: Apply the area formula.
A = πr 2
= π × 22
= 4π
≈ 12.57 m2
Write the formula for the area of a circle
Substitute r = 2
Evaluate the square
Evaluate and round to two decimal places
The area to be covered with mulch is approximately 12.57 m2.
Reflect and check
The radius is 2 m. The calculation π × 22 is correct. An answer of approximately 12.6 m2 is reasonable for a circle of this size.
Idea summary
Key points about circle area:
• Area of a circle: A = πr 2
• The radius must be squared before multiplying by π
• The area grows quadratically (much faster) with the radius.
• When given the diameter, halve it to find the radius first.
4.03 Practice questions
What do you remember?
1 Match the geometric shape with the correct formula for its area:
a Rectangle i A = l × w
b Square ii
c Triangle iii A = πr 2
d Circle iv A = s 2
2 Fill in the blanks to correctly describe the geometric properties:
a To calculate the area of a triangle, the height must be ⬚ to the base.
b The diameter of a circle is ⬚ times the length of its radius.
c The area of any shape is measured in ⬚ units.
3 Which of these statements best describes a trapezium?
A A quadrilateral with opposite sides equal in length
B A quadrilateral with exactly one pair of parallel sides
C A composite shape made of two triangles
D A shape with four equal sides and four right angles
Practice
4 Calculate the area of these rectangles: a b
c A rectangular paddock 100 m long and 45 m wide
d A smartphone screen with a length of 15 cm and a width of 7 cm
5 Calculate the area of these squares: a b
c A square tile with a side length of 30 cm
d A square paddock with a side length of 200 m
6 Calculate the area of these triangles: a b
d
7 A triangular boat sail has a base of 3 m and a perpendicular height of 4.5 m:
Calculate the area of the sail.
8 A garden bed is shaped like a trapezium with parallel sides of 4 m and 6 m. The perpendicular distance between these sides is 3 m. Calculate the area of the garden bed.
9 Calculate the area of the trapezium shown. 10 cm 8 cm 14 cm
10 Calculate the area of these composite shapes: a b
11 Consider this composite shape:
a Calculate the area of the rectangular section.
b Calculate the total area of the shape.
12 A shed wall is shaped like a rectangle with a triangle on top. The rectangular section is 10 m wide and 4 m high. The triangular section has a height of 3 m. Calculate the total area to be painted.
13
An archway is shaped like a rectangle with a semicircle on top:
m
a Calculate the area of the rectangular section.
b Calculate the area of the semicircular section.
c Determine the total area of the archway, rounded to two decimal places.
14 A pizza has a radius of 15 cm. Calculate the area of the pizza, rounded to two decimal places.
15 A circular rug has a diameter of 1.8 m. Calculate the area of the floor it covers, rounded to two decimal places.
Extend your thinking
16
A tiler is repairing a bathroom and needs to replace a small square mosaic tile. The area of the tile is 64 cm2: s = ? Area = 64 cm2
Determine the side length, s, to ensure the new tile fits the pattern.
17 A landscaper is designing a triangular garden bed to fit a specific corner. The design requires a base width of 6 m and a total planting area of 18 m2. Calculate the required perpendicular height of the garden bed.
18 A circular tablecloth needs an area of at least 7 m2. To buy the correct amount of trim for the edge, the maker needs the diameter. Calculate the minimum diameter required, rounded to two decimal places.
19 A kitchen floor is L-shaped. The total length is 6 m and the total width is 4 m. A ‘missing’ rectangular section at the corner measures 2 m by 2.5 m:
m
m
Calculate the area of the floor to be tiled.
m
20 A circular path is being built around a circular fountain. The fountain has a radius of 2 m. The path is 1.5 m wide:
Calculate the area of the path to be paved, rounded to two decimal places.
Path
4.04 Surface area
After this lesson, you will be able to…
• calculate the surface area of simple prisms and cylinders in practical contexts (e.g., packaging, painting)
Surface area of prisms
Surface area
The total area of all the faces (or outer surfaces) of a three-dimensional object.
The surface area of a prism is the sum of the areas of all its individual faces. These are:
• Two parallel bases: The identical shapes at each end (e.g., two triangles or two rectangles)
• Lateral faces: The rectangular faces that connect the bases
The surface area of a rectangular prism with length l, width w, and height h can be found using the formula:
Example 1
A rectangular storage box has a length of 30 cm, a width of 20 cm, and a height of 15 cm. Calculate the surface area to determine the quantity of material needed to construct the box.
Create a strategy
Identify the dimensions (length, width, height). Calculate the area of the three pairs of faces (front and back, top and bottom, sides) and sum these areas together to find the total surface area.
Apply the idea
Area of front and back faces (l × h):
2(30 × 15) = 2(450) = 900 cm2
Area of top and bottom faces (l × w):
2(30 × 20) = 2(600) = 1200 cm2
Area of side faces (w × h):
Total surface area:
2(20 × 15) = 2(300) = 600 cm2
900 + 1200 + 600 = 2700 cm2
Reflect and check
The answer is reasonable as each face is rectangular and the total combines six faces.
Example 2
A triangular prism-shaped tent has a front triangular entrance with a base of 2 m and a height of 1.5 m. The two slanted rectangular sides of the roof are each 1.8 m wide, and the tent is 3 m long. Calculate the total surface area of the fabric used (including the rectangular floor).
Create a strategy
Break the tent down into its individual faces: two triangles and three rectangles. Calculate the area of each face separately, then add them all together for the total surface area.
Apply the idea
Area of the two triangular faces:
Area of the two slanted rectangular sides:
Area of the rectangular floor:
Reflect and check
Checking the calculation confirms that all five faces of the prism have been included. The final units (m2) are correct for an area calculation.
Idea summary
Surface area is the total area of all the faces of a three-dimensional object. To calculate a surface area, find the area of each individual face (e.g., rectangles, triangles) and add them together.
Rectangular prisms consist of six rectangular faces, while triangular prisms consist of two triangular bases and three rectangular connecting faces.
Surface area calculations are used in practical contexts to determine the amount of material required for tasks like painting or packaging.
Surface area of cylinders
The surface area of a cylinder is found by adding the area of its two circular ends to the area of its curved side. When unrolled, this curved side forms a rectangle.
The formula for the total surface area of a cylinder is:
r is the radius of the circular base h is the height of the cylinder
2πr 2 represents the area of both circular faces
2πrh represents the area of the curved surface
Interactive exploration
Discover this concept in action online mathspace.co
Example 3
A cylindrical paint tin has a radius of 10 cm and a height of 25 cm. Calculate the total surface area that needs to be painted. Round the answer to two decimal places.
Create a strategy
Substitute the radius and height into the cylinder surface area formula:
Apply the idea
Write the formula =
(10) (25) Substitute the values
= 200π + 500π Simplify
= 700π
= 2199.11 cm2
Evaluate the addition
Evaluate and round to two decimal places
The surface area that needs to be painted is 2199.11 cm2.
Reflect and check
The area of the two circular ends is 2π(10)2 ≈ 628 cm2. The total area of 2199.11 cm2 is significantly larger, which makes sense as it includes the large curved side. The units are correct.
Example 4
A cylindrical water tank has a diameter of 3 m and a height of 4 m. Calculate the surface area that needs waterproof coating. Round the answer to two decimal places.
Create a strategy
First, halve the diameter to find the radius, then apply the surface area formula.
Apply the idea
Find the radius:
Apply the surface area formula, substituting r = 1.5 and h = 4:
SA = 2πr 2 + 2πrh
= 2π(1.5)2 + 2π(1.5) (4)
= 4.5π + 12π
= 16.5π
= 51.84 m2
Write the formula
Substitute the values
Simplify
Evaluate the addition
Evaluate and round to two decimal places
The surface area that needs waterproof coating is 51.84 m2.
Reflect and check
The most common mistake is forgetting to convert the diameter to a radius. Here, the diameter (3 m) was correctly halved to get the radius (1.5 m) before the calculation. The final answer is rounded and has the correct units for area.
Example 5
An open-top cylindrical water trough is manufactured from galvanised steel. It has a diameter of 1.2 m and a height of 0.8 m. Calculate the area of steel required to make the trough. Round the answer to two decimal places.
Create a strategy
Identify the trough as an open-top cylinder. This means the surface area consists of only one circular base and the curved surface. Find the radius, then use the modified formula:
SA = πr 2 + 2πrh
Apply the idea
Calculate the radius:
= 0.6 m
Substitute r = 0.6 and h = 0.8 into the open-cylinder formula:
SA = πr 2 + 2πrh
= π(0.6)2 + 2π(0.6) (0.8)
= 0.36π + 0.96π
= 1.32π
Write the formula
Substitute the values
Simplify
Evaluate the addition ≈ 4.15 m2
Evaluate and round to two decimal places
The area of steel required is approximately 4.15 m2
Reflect and check
The standard formula 2πr 2 + 2πrh would give the area for a closed tank. Since this is an open trough, subtracting the area of the top circle (πr2) is necessary. The result is reasonable for the given dimensions.
Idea summary
• Total surface area of a cylinder combines two circular faces and one curved surface.
• The formula is SA = 2πr 2 + 2πrh.
• All measurements must be in the same units before calculation.
• The result is always expressed in square units (e.g., m2, cm2).
4.04 Practice questions
What do you remember?
1 Match each three-dimensional object to the description of its faces:
a Rectangular prism
b Cylinder
c Triangular prism
i Two circular faces and one curved surface
ii Six rectangular faces
iii Two triangular faces and three rectangular faces
2 Which of these statements about surface area is false?
A Surface area is the sum of the areas of all faces of a 3D object.
B Surface area is measured in cubic units (e.g., cm3).
C The surface area of a prism includes two bases and the lateral faces connecting them.
D To calculate the surface area, all dimensions must be in the same units.
3 Identify the geometric solid associated with each total surface area formula:
a SA = 6s 2
c SA = 2πr 2 + 2πrh
Practice
4
b SA = 2(lw + lh + wh)
d SA = πr 2 + 2πrh
Calculate the total surface area for each rectangular prism:
a A shipping box with a length of 25 cm, a width of 15 cm, and a height of 10 cm
b A gift box with dimensions 20 cm × 15 cm × 8 cm
5 A cubic storage box has a side length of 7 cm. Calculate the total area of fabric required to cover all its faces.
6 A skateboard ramp is constructed as a triangular prism. The triangular cross-section has a base of 60 cm, a vertical height of 40 cm, and a slant height of 72 cm. The ramp is 100 cm deep:
Calculate the total surface area of the ramp (including the base).
7 A wedge of cheese is a right-angled triangular prism with a length of 12 cm. The triangular base has side lengths of 3 cm, 4 cm, and 5 cm: 3 cm 5 cm
12 cm
4 cm
Calculate the total surface area requiring wrapping.
8 A doorstop is shaped like a right-angled triangular prism. Its triangular face has a base of 10 cm and a height of 4 cm. The slanted side is 10.77 cm. The doorstop has a depth of 5 cm. Calculate its total surface area.
9 Calculate the total surface area of the cylinder, rounding the answers to two decimal places:
a A closed cylinder with a radius of 4 cm and a height of 12 cm
b A cylindrical tank with a diameter of 2.4 m and a height of 3.5 m
10 A can of soup is a cylinder with a radius of 3.5 cm and a height of 11 cm:
a Calculate the area of the label that wraps around the curved surface. Round the answer to two decimal places.
b Calculate the total surface area of the can. Round the answer to two decimal places.
11 A cylindrical grain silo stands on a concrete base. The silo has a diameter of 4 m and a height of 10 m:
a Calculate the total exterior surface area requiring paint (the curved vertical side and the roof), rounded to two decimal places.
b Explain why the base of the silo is excluded from the calculation in this practical context.
Ex
Ex
12 Two identical 10 cm cubic blocks are joined face-to-face to create a single rectangular prism:
Calculate the total surface area of the resulting object.
Extend your thinking
13 A cubic box is to be constructed using exactly 96 cm2 of material. Determine the side length of the box.
14 A rectangular concrete water trough is 2 m long, 0.8 m wide, and 0.5 m deep. The trough is open at the top:
a Calculate the total internal surface area to be sealed (the four side walls and the base).
b If sealant costs $15 per square metre, calculate the total cost to seal the trough.
15 A rectangular garage measures 6 m long, 4 m wide, and 3 m high. The four walls and the ceiling require painting:
If one tin of paint covers 20 m2, calculate the minimum number of tins that must be purchased.
• accurately read and interpolate values on analogue or digital scales (including temperature)
• estimate and record measurements with sensible precision
Instruments of measurement
To measure things accurately in everyday situations, it is important to choose and use the right instrument. Each type of measurement, like length or mass, requires a specific tool:
• Length
8 m
Ruler: Measures short lengths accurately
• Mass
Tape measure: Measures longer lengths and distances
Digital scale: Displays mass as a numerical value
Analogue scale: Shows mass using a pointer on a dial
• Temperature
Digital thermometer: Shows temperature as a numerical reading
• Volume
Analogue thermometer: Shows temperature using a moving indicator
Measuring jug: Measures large volumes, typically for cooking
• Fuel
Measuring cylinder: Measures liquid volume with high precision
Digital fuel gauge: Displays fuel level as numbers or bars
Analogue fuel gauge: Shows fuel level with a moving needle
Exploration
The image shows a magnified section of a car speedometer. Determining the speed requires an understanding of the scale.
1. What is the numerical difference between the two labelled major markings (60 and 80)?
2. Identify the number of small spaces (intervals) that exist between these two labelled markings.
3. Based on the previous answers, what is the value represented by each small tick mark?
4. Determine the exact speed indicated by the needle in km/h.
Scales are the set of markings on a measuring device that show the quantity. Understanding the value of the intervals, or gaps, between these markings is crucial for an accurate reading.
Interpolation
The process of estimating a value that lies between two marked divisions on a measuring scale.
Parallax error
This error occurs when the scale is not viewed from directly in front. Viewing it from an angle can make the reading appear higher or lower than its true value.
When taking measurements, consider these key principles:
• Maintain eye level with measuring instruments to avoid parallax error.
• Align the zero mark precisely with the starting point of measurement.
• Record measurements to a sensible precision based on the instrument’s scale divisions.
• For analogue scales, interpolate between marked divisions when necessary.
Example 1
A baker is weighing flour for a cake recipe using an analogue kitchen scale:
Estimate the weight of the flour.
Create a strategy
To read an analogue scale accurately:
1. Identify the major values (numbers) on the scale.
2. Count the number of spaces between two major values to find the value of each small tick mark (the division).
3. Add the value of the tick marks to the nearest major number.
Apply the idea
Step 1: The needle is past the 300 g mark.
Step 2: Find the scale division. The difference between major marks is 400 300 = 100 g.
There are 4 spaces between these marks.
Value of one division = 100 ÷ 4 = 25 g
Step 3: Calculate the total. The needle is 1 tick mark past 300.
Weight = 300 + 1 × 25 = 325 g
Therefore, the weight of the flour is 325 g.
Reflect and check
The reading is 325 g. When reading analogue scales, viewing the dial directly from the front prevents parallax error, which could make the needle look like it is on a different line.
Example 2
A student is feeling unwell and takes their temperature using a digital thermometer: 38.4˚ C
Record the temperature with sensible precision and determine if the student has a fever (defined as a temperature over 37.5°C).
Create a strategy
Read the temperature from the digital display. Then, compare this reading to the fever temperature of 37.5°C to see if it is higher.
Apply the idea
The digital display shows 38.4. Digital tools usually give a specific precision. Here, it is to one decimal place.
Recorded temperature: 38.4°C
Comparison: 38.4 > 37.5
Since the recorded temperature is higher than the threshold, the student has a fever.
Example 3
A driver checks their fuel gauge before a long trip. The fuel tank capacity is 60 L:
a Estimate the fraction of fuel currently in the tank.
Create a strategy
Identify the marked intervals (quarters) and interpolate (estimate) the position of the needle between them.
Apply the idea
The gauge is marked in quarters: 0, , , , 1.
The needle is halfway between which is and which is .
The midpoint is
b Calculate the estimated number of litres remaining in the tank.
Create a strategy
Multiply the total capacity of the tank by the estimated fraction.
Apply the idea
Write the equation
Substitute the values
Simplify
Evaluate
There are approximately 37.5 L of fuel remaining.
Reflect and check
Since the needle is past the halfway mark (30 L) but not yet at the three-quarter mark (45 L), an answer of 37.5 L is sensible.
Idea summary
Measuring instruments are selected based on the physical quantity and the degree of precision required for the task.
A digital scale provides a specific numerical value, whereas an analogue scale requires interpolation to estimate values that fall between the marked divisions. Accurate readings depend on aligning the zero mark correctly and viewing the scale at eye level to prevent parallax error
4.05 Practice questions
What do you remember?
1 Match each measurement task to the most appropriate instrument:
a Measuring the length of a room i Kitchen scales
b Measuring flour for baking ii Ruler
c Measuring a small amount of liquid for iii Measuring cylinder a science experiment iv Tape measure
d Measuring the length of a pencil
2 Is this statement true or false: Parallax error is caused by the measuring instrument being faulty or not calibrated correctly.
3 Complete the statement: To read an analogue scale, first identify the value between two ⬚ marks, then count the number of ⬚ to find the value of each increment.
Practice
4 A piece of timber is being measured with a ruler. What is the length shown on the ruler?
5 A chef is weighing sugar on an analogue scale. What is the mass of the sugar?
6 A person checks the room temperature on an analogue thermometer. What is the temperature?
7 A car has a 50 L fuel tank. Based on the fuel gauge, estimate how many litres of fuel are in the tank.
8 A butcher weighs a piece of steak on a digital scale:
a What is the measured mass of the steak?
b Given the scale’s precision of ±0.5 g, what is the possible range of the true mass of the steak?
9 Ravi is a site manager who needs to drive from Melbourne to Portland and back. The total distance for a one-way trip is approximately 360 km:
a His car has a 60 L petrol tank. If the petrol tank is full before he leaves, how many litres are in the tank?
b Ravi’s car is fuel-efficient and can travel roughly 500 km on a full 60 L tank. How many tanks of petrol will Ravi need for the entire round trip?
10 A student is measuring the volume of a liquid in a measuring cylinder:
a Explain why the eye is positioned level with the surface of the liquid rather than looking down from above. What specific type of error does this prevent?
b Determine the scale (the value of each small division) on this measuring cylinder.
c What is the correct volume of the liquid in mL, reading from the bottom of the meniscus?
d The student needs a total of 85 mL for an experiment. How much more liquid must be added to the cylinder?
11 A nurse takes three temperature readings from a patient using different thermometers: 37.8 °C, 38.1 °C, and 37.9 °C. Each thermometer has a precision of ±0.1 °C. Determine the best estimate of the patient’s true temperature from these readings. Justify your method.
12 A fuel gauge in a car shows the tank is full. The tank capacity is 50 L, and the gauge has an error margin of ±5% of the capacity of the tank. The car consumes fuel at a rate of 8 L per 100 km. Calculate the minimum and maximum distance the car can travel before running out of fuel.
4.06 Volume and capacity
After this lesson, you will be able to…
• calculate the volume and capacity of objects using standard formulas
Volume of prisms
Volume
A measure of the extent of an object in three dimensions, or the amount of space it encloses.
The volume of a three-dimensional object is the amount of space it occupies, measured in cubic units (m3, cm3, etc.).
A prism is a solid with a uniform cross-section. To find the volume of any prism, calculate the area of the cross-section (A) and multiply it by the perpendicular height (h).
V = A × h
For a rectangular prism, the base is a rectangle.
V = l × w ×
A cube is a special prism where all sides are equal length (s).
V = s 3
s
For a triangular prism, the base is a triangle. It is important to distinguish between the two different “heights” used in the calculation:
• The height of the triangle (htri): used to calculate the area of the base
• The height of the prism (H ): the length connecting the two triangular bases
b is the base of the triangle h is the height of the triangle H is the height of the prism
Example 1
A precision engineering firm produces bulk orders of 1500 stainless steel shims used for levelling machinery. Each shim is a triangular prism with the dimensions shown:
4 mm
4 mm 11 mm
To manufacture the batch, the firm melts down a block of steel. Calculate the total volume of steel required for the 1500 shims in cubic centimetres (cm3).
Create a strategy
Calculate the volume of a single shim in cubic millimetres. Then, determine the total volume for the batch of 1500 pieces. Convert the total volume from mm3 to cm3 by dividing by 1000.
Apply the idea
Calculate the volume of one shim (VOne) in cubic millimetres.
Write the triangular prism volume formula
Substitute b = 4, h = 4, and H = 11
Simplify
Evaluate
Calculate the total volume for 1500 shims.
VTotal = 88 × 1500
Write the equation = 132 000 mm3
Convert the total volume to cubic centimetres.
Evaluate
Volume = 132 000 ÷ 1000
Since 10 mm = 1 cm, then 103 mm3 = 1 cm3 = 132 cm3
The total volume required is 132 cm3
Evaluate
Example 2
A small plastic container is used to store craft supplies. The container is a rectangular prism with a length of 12 cm, a width of 7 cm, and a height of 5 cm.
Calculate the volume of the container in millilitres.
Create a strategy
To find the volume of a rectangular storage container, identify the length, width, and height, then substitute these values into the formula: V = l × w × h
Apply the idea
The dimensions are l = 12 cm, w = 7 cm, and h = 5 cm.
V = l × w × h Write the volume formula = 12 × 7 × 5 Substitute the values = 420 cm3 Evaluate
The volume is 420 cm3. Since 1 cm3 = 1 mL, this container can hold 420 mL of liquid.
Idea summary
Volume is the amount of space occupied by a 3D object, measured in cubic units (e.g., m3, cm3).
The volume of a prism is found using the formula V = A × h, where A is the area of the base and h is the height (or length) of the prism. Specific formulas depend on the base shape, such as:
• Rectangular prism: V = l × w × h
• Cube: V = s 3
• Triangular prism:
Volume of cylinders
Calculating the volume of a cylinder is essential in practical trades and industry for determining the storage capacity of items like water tanks, fuel drums, and piping systems, which allows for accurate planning of resource management and logistics. The volume of a cylinder is given by:
V = πr 2 h
r is the radius of the circular base h is the height of the cylinder
Example 3
A café manager has prepared a large 5 litre dispenser of iced coffee. They serve the drink in cylindrical jars with a radius of 3 cm and a total height of 10 cm.
To leave room for ice and a lid, each jar is only filled to a height of 9 cm. Calculate how many full jars can be served from the 5 litre batch.
Create a strategy
Calculate the volume of coffee in one jar using the fill-height of 9 cm. Then, convert the 5 litre batch into millilitres (where 1 mL = 1 cm3). Finally, divide the total volume by the volume per jar to find the number of servings.
Apply the idea
Calculate the volume of coffee per jar (V ).
V = πr 2 h
= π × 32 × 9
≈ 254.47 cm3
Convert the batch size to millilitres.
5 L = 5 × 1000 mL
Write the volume formula
Substitute r = 3 and h = 9
Evaluate
Write the equation = 5000 mL
Determine the number of jars.
Number of jars = 5000 ÷ 254.47
≈ 19.65
The café can fill 19 full jars.
Reflect and check
Evaluate
Write the equation
Evaluate
The result of 19 jars is reasonable. Each jar holds roughly 250 mL (one metric cup). Since there are 4 cups in a litre, it is reasonable to expect 4 × 5 = 20 jars. Because it was filled slightly over 250 mL (at ≈ 254.47 cm3), getting 19 jars makes sense.
Idea summary
The volume of a cylinder is calculated using the formula V = πr 2h, where r is the radius of the circular base and h is the height of the cylinder. Ensure the radius and height are in the same units before calculating.
Volume of spheres
A sphere is a perfectly round three-dimensional object, like a ball. Its volume is the amount of space it occupies.
r is the radius of the sphere
Calculating the volume of a sphere involves cubing the radius, which makes a calculator very useful for these problems.
Example 4
A standard competition basketball has a diameter of approximately 24 cm. Calculate its volume to determine the amount of air it can hold. Round your answer to the nearest cubic centimetre.
Create a strategy
Find the radius by halving the diameter. Then, substitute the radius into the volume formula for a sphere and use a calculator to find the result.
Apply the idea
Write the formula for the radius
Substitute d = 24
Evaluate the radius
Write the formula for the volume of a sphere
Substitute r = 12
Evaluate the power
Evaluate and round
Reflect and check
The volume of the basketball is approximately 7238 cm3. This is a large value, but expected since the radius is cubed.
Idea summary
The volume of a sphere is found using the formula:
If given the diameter, it must be halved to find the radius before using the formula.
Capacity
Capacity
Describes how much a container will hold. It is often used in relation to the volume of fluids.
Units of capacity (volume of fluids or gases) include litres (L) and millilitres (mL).
Example: The boot capacity of a typical hatchback car would be around 390 litres.
The relationship between volume and capacity is fundamental in measurement. Volume measures the amount of three-dimensional space an object occupies, while capacity measures how much a container can hold.
Key conversion relationships:
• 1 cm3 = 1 mL
• 1000 cm3 = 1 L
• 1000 mL = 1 L
• 1 m3 = 1000 L = 1 kL
Example 5
A cylindrical water tank has a radius of 0.8 metres and a height of 2 metres. Calculate its capacity in litres.
Create a strategy
Calculate the volume in cubic metres, then convert to litres using the relationship 1 m3 = 1000 L.
Apply the idea
Calculate the volume in cubic metres:
V = πr 2 h
= π × (0.8)2 × 2
= 1.28π
≈ 4.0212 m3
Convert the volume to litres:
Capacity = 4.0212 × 1000
≈ 4021.2 L
Write the formula for the volume of a cylinder
Substitute the values
Simplify
Evaluate
Write the equation
Evaluate
Reflect and check
The answer of approximately 4021 litres is reasonable for a water tank of these dimensions.
Example 6
A beverage company is designing a new juice box to hold exactly 250 millilitres of juice. To fit standard packing crates, the base of the box must have a length of 10 cm and a width of 5 cm. Calculate the height required for the juice box.
Create a strategy
First, convert the capacity in millilitres to volume in cubic centimetres using the relationship 1 mL = 1 cm3. Then, use the volume formula for a rectangular prism to solve for the missing height.
Apply the idea
Convert the capacity to volume:
Solve for the height (h):
V = l × w × h
250 = 10 × 5 × h
250 = 50h
250 mL = 250 cm3
Write the volume formula
Substitute V = 250, l = 10, and w = 5
Simplify the right-hand side h = 5 cm
Divide both sides by 50
Reflect and check
A height of 5 cm is reasonable. In this design, the box would be twice as long as it is high, creating a stable shape that is unlikely to tip over.
Idea summary
Capacity describes the amount a container can hold, usually measured in litres (L) or millilitres (mL).
Capacity is directly related to volume through the conversions: 1 cm3 = 1 mL and 1 m3 = 1000 L
To find the capacity of a container, calculate the volume using standard formulas and convert the result to liquid units.
4.06 Practice questions
What do you remember?
1 Match each shape to its correct volume formula:
a Any prism i V = l × w × h
b Cylinder ii V = s 3
c Rectangular prism iii V = A × h
d Cube iv V = πr 2h
2 Complete these key capacity conversions:
a 1 cm3 = ⬚ mL b 1 m3 = ⬚ L
3 Which of these statements about volume is true?
A Volume is measured in square units (e.g., m2).
B The volume of a prism is found by adding the area of the base to the height.
C Capacity is the amount of fluid a container can hold, often measured in litres.
D A sphere’s volume is calculated by squaring the radius.
Practice
4 Calculate the volume of these prisms:
5 A camping tent is shaped like a triangular prism. The front entrance is a triangle with a base of 1.8 m and a height of 1.2 m. The tent extends back with a length of 2.5 m:
a Calculate the area of the triangular front entrance.
b Using the answer from part (a), calculate the total volume of space inside the tent.
6 A juice carton is shaped like a rectangular prism with a length of 6 cm, a width of 4 cm, and a height of 10 cm. Calculate the total volume of the carton.
7
8
9
A wooden doorstop is in the shape of a triangular prism. The triangular face has a base of 5 cm and a height of 8 cm. If the doorstop is 15 cm long, calculate its volume.
A cylindrical tin of paint has a radius of 5 cm and a height of 12 cm. Calculate the volume of paint it can hold in cubic centimetres and its capacity in mL. Round your answers to two decimal places.
A spherical stone ornament in a garden has a diameter of 40 cm. Calculate the volume of the ornament, rounding your answer to the nearest cubic centimetre.
10 A cylindrical rainwater tank installed in a garden has a radius of 1.5 m and a height of 2 m. Calculate the maximum capacity of water the tank can hold in litres, rounded to the nearest litre.
11 A rectangular aquarium is designed to hold exactly 6 L of water. If the base of the aquarium measures 20 cm by 15 cm, determine the required height of the tank.
12 A regular box of cereal is in the shape of a rectangular prism and measures 20 cm by 8 cm by 30 cm:
a Calculate the volume of the box of cereal.
b The company that makes these cereal boxes also makes a jumbo size box, which is one and a half times as long, wide, and tall as the regular size boxes:
i Calculate the volume of the jumbo box of cereal.
ii Is the volume of the jumbo box one and a half times the volume of the regular box?
13 A cylindrical vase has a radius of 6 cm and a height of 25 cm. Calculate the capacity of the vase in millilitres, rounded to two decimal places.
Extend your thinking
14
A science student performs an experiment to determine the volume of a steel sphere using water displacement. She fills a rectangular tub with a base of 15 cm × 12 cm to a depth of 8 cm. After fully submerging the sphere, the water level rises to 10 cm. Calculate the volume of the sphere based on the displaced water.
15 An architect needs to calculate the total internal air volume of a garage to design a ventilation system. The garage has a rectangular base section with length 6 m, width 4 m, and height 3 m. A triangular prism roof sits exactly on top, adding a further 2 m in height. Calculate the total volume of air in the garage.
16 An aquarium owner is setting up a new tank with dimensions 50 cm (length), 30 cm (width), and 40 cm (height). To allow space for lighting and pumps, the water level must be kept 10 cm below the top rim. Calculate the actual volume of water required in litres.
4.07 Time and timetables
After this lesson, you will be able to…
• read and interpret time and date specifications and conventions
• calculate duration and solve problems using schedules and timetables
Time
calculations
Understanding how to calculate and represent time is a fundamental skill for managing daily life, from scheduling appointments to catching a bus.
Time can be represented in two main formats:
• 12-hour time uses a.m. (ante meridiem) and p.m. (post meridiem) to distinguish between before and after midday.
• 24-hour time uses a single block of hours from 00:00 to 23:59.
12-hour time
A time convention in which the 24 hours of the day are divided into two periods: a.m. (ante meridiem) and p.m. (post meridiem).
24-hour time
A time convention where the day runs from midnight to midnight and is divided into 24 hours, represented from 00:00 to 23:59. 00:00
Note: The final 00:00 represents the start of the next day.
Key time conversion principles:
• For a.m. times: Keep the same hours and minutes, adding a leading zero if needed— except for 12:00 a.m. (midnight), which becomes 00:00.
• For p.m. times: Add 12 to the hours — except for 12:00 p.m. (noon), which stays as 12:00.
Interactive exploration
Discover this concept in action online mathspace.co
Example 1
Calculate the 12-hour equivalent of 14:54.
Create a strategy
To convert a p.m. time from 24-hour format, subtract 12 from the hours and add the p.m. designator. Note: 12:00 in 24-hour time is 12:00 p.m. (noon); do not subtract 12 in this case.
Apply the idea
The hour value (14) is greater than 12, so it is an afternoon time (p.m.). Subtract 12 from the hours: 14 12 = 2
The minutes remain the same. The time is 2:54 p.m.
Reflect and check
Verify that adding 12 to the hours of 2:54 p.m. returns the original time of 14:54.
Example 2
Calculate the elapsed time from 9:30 a.m. to 1:15 p.m.
Create a strategy
Calculate the elapsed time by bridging through midday (12:00 p.m.).
Apply the idea
Calculate the time from 9:30 a.m. to midday (12:00 p.m.): 2 hours 30 minutes
Calculate the time from midday to 1:15 p.m.: 1 hour 15 minutes
Add the two time intervals together: 2 h 30 min + 1 h 15 min = 3 h 45 min
Reflect and check
Adding 3 h 45 min to 9:30 a.m. gives 9:30 + 3 h = 12:30 p.m., then 12:30 p.m. + 45 min = 1:15 p.m.
Idea summary
Key points for time calculations:
• Convert between 12-hour time and 24-hour time by subtracting 12 from the hours to go from 24-hour to 12-hour time (for hours ≥ 13), or adding 12 to go from 12-hour to 24-hour time (for p.m. times, excluding 12:00 p.m.).
• Calculate elapsed time by breaking intervals into hours and minutes.
• Remember standard time conversions: 60 minutes per hour; 60 seconds per minute
Did you know?
The concept of “o’clock” is actually an abbreviation for the phrase “of the clock,” which dates back to the 14th century. Before mechanical clocks became common, people used different methods to tell the time, such as sundials or water clocks.
These early devices relied on the movement of the sun or the flow of liquid to track the passing hours. This historical organisation of time shows how humans have always looked for ways to measure the day accurately.
Transport timetables
Timetable
A schedule that displays the times of specific events or services, such as transport departures and arrivals.
Timetables are tables used to organise and display public transport schedules. Reading them effectively requires an understanding of the structure:
• Rows usually list the locations (stations or stops).
• Columns usually represent a specific vehicle (e.g., “The 08:15 Train”). Reading down a column shows the journey of that single vehicle.
• 24-hour time: Most transport schedules use 24-hour time (e.g., 17:30 instead of 5:30 p.m.) to prevent confusion between morning and evening.
A dash (–) or shaded box indicates that the vehicle does not stop at that location, which is known as an express service.
Example 3
Consider this bus timetable: Bus stop Time (24-hour)
Highlands Dr 4:51 5:48 6:51 7:48 8:51 9:48 West St 6:17 7:12 8:18 9:13 10:18
a Isabelle catches the bus from Merry Oaks at 07:42. What time does she arrive at West Street?
Create a strategy
1. Find the “Merry Oaks” row.
2. Scan across to find “07:42”.
3. Read down that specific column to the “West St” row.
Apply the idea
Locating the 07:42 departure from Merry Oaks and following the column down, the arrival time at West Street is 08:18.
b Calculate the duration of the journey for the bus departing Carlton Road at 05:42 and arriving at West St at 06:17.
Create a strategy
Calculate the difference between the arrival time and departure time.
Apply the idea
The departure is 05:42. The arrival is 06:17.
Count up from 05:42 to 06:00: 60 42 = 18 minutes
Then, add the minutes past 06:00: 18 + 17 = 35 minutes
The journey takes 35 minutes.
Idea summary
When reading transport timetables:
• Read down a column to follow a single vehicle’s route through each stop.
• Read across a row to see all services that stop at a particular location and when they arrive.
• Pay attention to whether times are presented in 12-hour or 24-hour format.
Multimodal travel plans
Multimodal travel
A journey that involves using more than one type of transport (e.g., walking, bus, train).
Critical path
In this context, the critical path refers to the sequence of connections and transfer times that determines the total travel duration. It involves identifying necessary connections and wait times between different transport modes.
Real-world journeys often involve multiple modes of transport (e.g., walking - bus - train).
When planning these multimodal trips, the critical path must be calculated:
1. Calculate arrival of the first leg.
2. Add transfer/walking time.
Transfer time: The time needed to move between transport services, including walking or waiting at an interchange.
3. Find the next available departure for the second leg that can be reached given the arrival time and transfer time.
Example 4
Nick travels from Newmarket to Ferny Grove. His journey has three stages:
1. Bus: Newmarket to Brookside
2. Walk: 5 minutes from Brookside to Mitchelton Station
3. Train: Mitchelton to Ferny Grove
Use the timetables provided to plan his trip.
Monday to Friday (continued)
H City, Queen St app Creek St stop 74 16:45 17:00 17:10 17:20 17:35 17:50 18:05 18:20 19:10 20:10
G City, Adelaide St at Albert St stop 42 16:48 17:03 17:13 17:23 17:38 17:53 18:08 18:23 19:12 20:12
F Roma St Busway station PL1 16:54 17:10 17:20 17:30 17:45 18:00 18:13 18:28 19:16 20:16
E Normanby station 16:56 17:12 17:22 17:32 17:47 18:02 18:15 18:30 19:18 20:18
D Kelvin Grove 17:01 17:18 17:28 17:38 17:53 18:07 18:20 18:35 19:21 20:21
He must walk 5 minutes. Arrive Mitchelton Station: 7:41 p.m. + 5 mins = 7:46 p.m.
• Step 3: The train
He is at the station at 7:46 p.m. He looks for the next train departing Mitchelton. The timetable shows a departure at 7:47 p.m. This is a tight 1-minute connection, but possible according to the schedule.
The train arrives at Ferny Grove at 7:57 p.m.
b Nick needs to arrive at Ferny Grove by 9:30 p.m. What is the latest bus he can catch from Newmarket?
Create a strategy
Start at the destination time and work backwards, subtracting travel and walking times to find the start time.
Apply the idea
• Step 1: The train phase
Latest arrival: 9:30 p.m. Looking at the train timetable, the train arriving before 9:30 p.m. is the one arriving at 9:27 p.m. This train departs Mitchelton at 9:17 p.m.
• Step 2: The transfer phase
He needs to be at Mitchelton by 9:17 p.m. Subtract 5 minutes walking time. He must arrive at Brookside Bus Stop by 9:12 p.m.
• Step 3: The bus phase
Look for a bus that arrives at Brookside before 9:12 p.m. The timetable shows a bus arriving at 8:38 p.m. (the next one arrives too late). This bus departs Newmarket at 8:25 p.m.
The latest bus Nick can catch is 8:25 p.m.
Example 5
Hudson is at Roma St at 18:25. He needs to get to Brookside:
• Option A (Train): Roma St Station → Mitchelton → Brookside (5-minute walk)
• Option B (Bus): Roma St Busway → Brookside
Using the previous timetables, determine which option arrives first.
Create a strategy
Find the next available departure after 18:25 for both options and calculate the final arrival time.
Apply the idea
• Option A: Train
At 18:25, the next available train departs Roma St at 18:37, arriving at Mitchelton at 19:02. Adding the 5-minute walk to Brookside gives an arrival time of 19:07.
• Option B: Bus
At 18:25, the next available bus departs Roma St Busway at 18:28, arriving at Brookside at 18:56
Option B (Bus) gets Hudson to Brookside 11 minutes sooner than Option A (Train).
Complex schedules and tides
Tide chart
A table indicating the times and heights of high and low tides for a specific location.
Some timetables, like tide charts, do not follow a fixed repeating pattern like trains. They are based on nature (the moon and sun).
Planning activities around tides often involves dealing with constraints (e.g., “Must be 2 hours before high tide”).
Example 6
A fishing boat needs to return to the harbour. The channel is only deep enough within 2 hours of a high tide.
Refer to the tide chart for Thursday.
Tue October 25 Wed October 26 Thu October 27 Fri October 28 4:34
Note: Only two tide entries are shown for Wednesday October 26 as the remaining tides fall outside the displayed time range.
The boat leaves the harbour at 2:12 a.m. on Thursday. When is the earliest time it can return to the harbour?
Create a strategy
1. Identify the high tides on Thursday.
2. Find the high tide that occurs after the boat leaves.
3. Calculate the time 2 hours before that high tide.
Apply the idea
Step 1: Identify departure. The boat leaves at 2:12 a.m.
Step 2: Scanning the Thursday column, the next high tide is at 12:40 p.m.
Step 3: Calculate safe window. The boat can enter 2 hours before 12:40 p.m. 12:40 p.m. – 2 hours = 10:40 a.m.
The earliest the boat can return is 10:40 a.m.
The boat can therefore return any time between 10:40 a.m. and 2:40 p.m. (within 2 hours either side of the 12:40 p.m. high tide).
Reflect and check
Calculate the fishing time: From 2:12 a.m. to 10:40 a.m. is 8 hours and 28 minutes. This is a realistic duration for a fishing trip.
Idea summary
Key strategies for complex schedules:
• A tide chart shows the times and heights of high and low tides and does not follow a fixed repeating pattern — always check the specific day’s data.
• Identify which tides are relevant by checking whether they occur after the departure time.
• Constraints define a time window, not a single moment — calculate both the start and end of the window (e.g., 2 hours before and after high tide).
• Always identify the limiting factor (e.g., tide height, connection time) before calculating.
• Recognise that some schedules, like tide charts, are governed by natural cycles (the moon and sun) and must be read directly rather than predicted.
Did you know?
French revolutionaries once tried to introduce “decimal time,” where every day was divided into ten hours consisting of 100 minutes each. While this made calculations much simpler, people found it too difficult to change their lifelong habits, and the system was abandoned after just a few years. We instead stuck with the older system of 60, which was originally developed by ancient civilisations.
4.07 Practice questions
What do you remember?
1 Match each 24-hour time to its 12-hour equivalent:
a 09:00 i 4:30 p.m.
b 12:00 ii 12:00 a.m.
c 16:30 iii 9:00 a.m.
d 00:00 iv 12:00 p.m.
2 Determine whether each statement is true or false:
a In a 24-hour time format, the day starts at 00:00 and ends at 23:59.
b To convert 2:00 p.m. to 24-hour time, subtract 12 from the hours.
c In a standard transport timetable, reading down a column usually shows the schedule for a single vehicle’s journey.
d A dash (–) in a timetable cell indicates that the train stops at that station for a long break.
3 Complete the statement: When reading a transport timetable, a ⬚ usually shows a complete journey for a single service, while a ⬚ shows all the service times for a specific location.
Practice
4 Convert these times between 12-hour and 24-hour formats:
a 3:45 p.m. to 24-hour time b 11:20 a.m. to 24-hour time
c 14:15 to 12-hour time d 20:30 to 12-hour time
5 A train departs at 16:45 and arrives at 18:20. Calculate the duration of the journey.
6 Calculate the duration between 23:45 on Monday 3 July and 00:30 on Tuesday 4 July.
7 Consider Thilini’s school timetable: Start
8:45 a.m. 9:55 a.m. Maths English History English Geography 9:55 a.m. 10:05 a.m. RECESS RECESS RECESS RECESS RECESS 10:05 a.m. 11:20 a.m. Science History Science Geography P.E. 11:20 a.m. 12:40 p.m. History Maths Maths P.E. English 12:40 p.m. 1:20 p.m. LUNCH LUNCH LUNCH LUNCH LUNCH
1:20 p.m. 2:30 p.m. P.E. Geography Sport English Maths
2:30 p.m. 3:15 p.m. Geography Science Sport Maths Science
a What lesson would Thilini have at 9:00 a.m. on Monday?
b How long was the science lesson on Tuesday?
c How long is the school day at this school?
d Thilini arrives late on Thursday due to a doctor’s appointment. If she arrives halfway through lunch, what time did she arrive?
8 Use this bus timetable:
Calculate the duration of the journey from City centre to Business park.
9 Consider this train timetable: Penshurst to Bondi Junction
a How many minutes does it take to get from Tempe to Martin Place if someone took the 09:47 train to Bondi Junction?
b If Michael arrives at Hurstville Station at 09:28, how long does he need to wait for the next train that stops at Wolli Creek?
c Which train arrives at Wolli Creek the earliest, the 09:35 train or the 09:30 train from Hurstville?
10 A flight arrives at 21:15. The connecting flight departs at 22:45. The connecting flight requires passengers to check in at least 45 minutes before departure. Is this connection possible?
11 A bus departs the terminal at 09:15 and arrives at the station at 09:55. A connecting train departs 15 minutes after the bus arrives. How long is it from when the bus departs until the connecting train departs?
12 A student needs to arrive at school by 8:45 a.m. The bus journey takes 40 minutes, and it is a 12-minute walk from the bus stop. What is the latest time the student can leave home to arrive at school on time?
13 Caitlin wants to travel from Manly Wharf to Campbelltown via ferry and train. Use the timetables to answer the questions.
a What time is the latest train that Caitlin can catch from Circular Quay to get to Campbelltown by 8:00 p.m.?
b How long does this train trip take?
c What is the latest ferry that Caitlin can catch from Manly Wharf so that she arrives at Circular Quay before the time from part (a)?
d It takes Caitlin 4 minutes to walk between the Circular Quay ferry wharf and the Circular Quay train station. How long is her total journey from Manly Wharf to Campbelltown Station, including all travel and waiting time?
14 Liam arrives at City Central at 5:30 p.m. and needs to get to Oakwood Station. He can either take a train from City Central Station to Oakwood Station or catch a bus from the City Central Bus Terminal to Oakwood Station:
Train timetable Station
City Central Station 5:28 p.m. 5:35 p.m. 5:42 p.m. 5:49 p.m.
Maple Station 5:38 p.m. 5:45 p.m. 5:52 p.m. 5:59 p.m.
Oakwood Station 5:48 p.m. 5:55 p.m. 6:02 p.m. 6:09 p.m.
Bus timetable Stop
City Central Bus Terminal 5:28 p.m. 5:34 p.m. 5:40 p.m. 5:46 p.m.
Maple Street 5:33 p.m. 5:39 p.m. 5:45 p.m. 5:51 p.m.
High tide (night) 11:50 p.m. - 12:55 a.m. 1:40 a.m.
a How long is there between the first high tide on Wednesday and the next high tide?
b A boat can only enter the harbour within 2 hours before or after a high tide. If a fishing boat leaves the harbour at 3:00 a.m. on Wednesday, when is the earliest it can return to the harbour?
c What is the minimum amount of time the boat from part (b) could spend fishing?
Extend your thinking
16 Elizabeth is on holiday in Hong Kong. She wants to go by train from Kowloon Station to Disneyland Resort Station: Morning journeys from Kowloon to Disneyland Station
Cheong
Evening journeys from Disneyland to Kowloon Station
b To meet her requirements, what is the latest train Elizabeth can take from Kowloon in the morning? Elizabeth needs to arrive at Disneyland Resort by 8:00 a.m.
c If she went from Kowloon to Disneyland Resort by taxi instead, the journey would only take 15 minutes. How much time would Elizabeth save by taking a taxi to Disneyland Resort instead?
17 Ivan and Sharon are planning a date. Use the timetables to help them. Here are the details:
• See Hidden Figures at the Central Cinema.
• Have a one-hour dinner at La Trattoria (bookings are at 7:30 p.m. or 9:00 p.m.).
• The walk from the cinema to the restaurant is 12 minutes.
• They need 15 minutes at the cinema before the movie starts.
Film screening times
Film
Good Will Hunting 8:45 p.m. 9:30 p.m. 10:15 p.m.
Hidden Figures 7:15 p.m. 9:30 p.m. 11:15 p.m.
The Matrix 8:30 p.m. 9:30 p.m. 10:45 p.m.
A Beautiful Mind 7:00 p.m. 8:15 p.m. 9:45 p.m.
Mean Girls 7:00 p.m. 9:30 p.m. 11:30 p.m.
Train journeys to Central Station Station
New Street 6:35 p.m. 7:36 p.m. 8:32 p.m. 9:31 p.m.
Town Hall 6:43 p.m. 7:44 p.m. 8:40 p.m. 9:39 p.m.
Downtown 6:48 p.m. 7:49 p.m. 8:45 p.m. 9:44 p.m.
Central 6:55 p.m. 7:56 p.m. 8:52 p.m. 9:51 p.m.
a If they decide to have dinner first, what is the earliest time they can watch Hidden Figures?
b Hidden Figures runs for 90 minutes. If they decide to watch the movie first, what is the latest screening time they can watch?
c Sharon and Ivan decide to have dinner first. They travel from New Street Station to Central Station by train. If the station is a 4-minute walk from La Trattoria, what is the latest train they can catch to get to their dinner reservation on time, and still have time to watch a screening of Hidden Figures?
18 A train service runs every 40 minutes starting at 06:00. List all departure times before 09:00, and explain why this creates an irregular pattern when looking at the clock.
19 A bus route has services every 12 minutes during peak hours and every 20 minutes during off-peak. If peak hours are 07:00-09:30 and 16:00-18:30, how many services run between 06:30 and 19:00? Assume the first bus departs exactly at 06:30 and the schedule resets at the start of each peak/off-peak period.
INVESTIGATION
Design a micro-structure
Apply advanced measurement techniques and financial modelling to develop a comprehensive design proposal and budget for a custom-built tiny house or specialised mobile food truck.
Objectives
• To formulate a problem by taking measurements and identifying requirements
• To apply area, surface area, and other calculations to determine material needs and costs
• To communicate the results in the form of a detailed quotation or plan
Materials
• Graph paper or design software
• Calculator
• Computer with internet access for material research
• Optional: Spreadsheet software
The vision - Design and initial specifications
The client brief
Design a compact, functional, and aesthetically pleasing micro-structure. Your client wants a custom-built, compact structure. This could be a tiny house on wheels, a backyard studio/office, or a mobile food cart. The first step is to translate their vision into concrete measurements and a preliminary design.
Step 1: Select your project and conceptualise your design. Sketch a detailed floor plan and at least one exterior elevation view.
Step 2: Annotate your drawings with all critical dimensions (length, width, height, window/door sizes, roof pitch if applicable). Include dimensions for internal features relevant to your chosen project (e.g., kitchen counter length, loft dimensions).
Step 3: Identify key materials. Research typical materials for your project (e.g., timber framing, plywood sheeting, insulation, exterior cladding, roofing material, specific appliances for food truck). Note down realistic unit costs (per linear metre, square metre, or item) and common sizes these materials are sold in.
Investigate
Present your design and initial research.
1. Determine your chosen micro-structure project and its purpose. Include your annotated floor plan and exterior elevation drawing(s) with all key measurements.
2. List all the primary materials you intend to use for your structure’s shell (framing, exterior walls, roofing, flooring) and any significant internal components. For each, note down its typical unit of sale (e.g., per sheet, per linear metre, per bag) and an approximate unit cost.
3. Why is it vital to consider both internal layout and external dimensions simultaneously when designing a compact structure? How does one influence the other?
The blueprint - Calculations and costing
Precision engineering
Translate your design into exact material quantities and a comprehensive budget. This is where your mathematical skills shine. You will use area, surface area, and volume calculations, along with an understanding of material wastage and purchasing logic, to build a precise material list and a detailed financial quotation.
1. Calculate structural framing. Determine the total linear metres of timber or metal framing required for your walls, floor, and roof. Factor in studs, top/bottom plates, rafters, and blocking.
2. Calculate surface materials. Determine the total area (m2) for exterior cladding, roofing, interior wall linings, and flooring. Remember to subtract areas for windows and doors where appropriate.
3. Calculate insulation and window/door costs. Determine the total area for insulation. Factor in the cost of each window and door unit.
4. Apply wastage and purchasing logic. Add a realistic percentage for material wastage (e.g., 5% for timber, 10% for sheeting). Adjust calculated quantities to reflect how materials are actually sold (e.g., buying full sheets of plywood, specific timber lengths).
5. Compile a comprehensive budget. Calculate the total cost for each material and a grand total for the entire shell of your micro-structure.
Investigate
Demonstrate your calculations and resulting budget.
1. Present your detailed calculations for all primary materials (framing, exterior, interior surfaces, insulation, windows/doors). Clearly show the formulas used, input values, and final calculated quantities.
2. Create a multi-itemised budget table. Include: Material item, Calculated quantity, Wastage allowance, Quantity to purchase (with units), Unit cost, and Total cost. Provide a grand total for the entire project.
3. Explain your rationale for the wastage percentages and purchasing adjustments made. How significantly did these factors impact your final cost?
4. Imagine a client asks for a 10% cost reduction. Without altering the dimensions, what specific material changes or optimisations could you propose to achieve this? Justify your choices with estimated cost savings.
The Pitch - Professional communication
Client presentation
Convey your design and cost plan in a professional and persuasive manner. The ultimate test of your design and mathematical modelling is your ability to communicate it effectively. You will now compile your work into a professional ‘Design and Cost Proposal’ for your client.
Develop a ‘Design and Cost Proposal’ document. This document should be clear, concise, and persuasive, aiming to secure the client’s approval for your project. Your proposal must include:
• A professional cover page with project title and your ‘company’ name
• An executive summary: Briefly introduce the project, your design approach, and the total estimated cost.
• Design overview: Include your refined floor plan and exterior elevation drawings, clearly labelled with dimensions and key features.
• Material specifications: A summary list of primary materials to be used
• Detailed cost quotation: Your comprehensive budget from Part 2
• Justification and recommendations: Explain key design and material choices, highlighting benefits to the client (e.g., energy efficiency, durability).
Investigate
Submit your proposal and reflect on the communication process.
1. Submit your complete ‘Design and Cost Proposal’ document.
2. How did organising your complex mathematical data (measurements, calculations, costs) into a professional proposal improve its clarity and impact for the client?
3. Beyond the numbers, what non-mathematical elements (e.g., visuals, language, structure) contribute to an effective design proposal, and why are they important?
Discussion
1. Reflect on the iterative nature of design and costing. How did the need for precise calculations in Part 2 potentially lead you to refine or re-evaluate your initial design choices from Part 1?
2. Discuss the broader implications of applying measurement formulas and costing skills in real-world professional contexts beyond construction (e.g., manufacturing, event planning, resource management).
3. What challenges did you face in this investigation (e.g., finding realistic material costs, managing wastage calculations)? How did you overcome them, and what did you learn about the complexities of practical application?
Did you know?
Understanding measurement and space is essential in architecture and interior design! For example, designers use precise measurements to create floor plans that ensure furniture fits comfortably and rooms are functional. By analysing dimensions, angles, and spatial relationships, they can optimise layouts for safety, accessibility, and aesthetics. Mastering measurement and space allows us to turn abstract plans into practical, beautifully organised environments!
Chapter review
1 A builder is ordering materials for a house renovation. Select the most appropriate metric unit for measuring each item:
a The length of a timber floorboard
b The capacity of a hot water system tank
c The mass of a bag of cement
2 For each situation, determine the most appropriate metric unit of measurement:
a The distance between two regional towns
b The volume of water in a backyard swimming pool
c The mass of a heavy commercial truck
3 A charity fun run course is 12.5 km long. Organisers need to mark the course every 100 m. Convert the total distance into metres.
4 A landscaper is installing a timber edge around a rectangular vegetable patch that measures 4.2 m long and 1.5 m wide: 4.2 m 1.5 m
Calculate the total length of timber edging required.
5 A carpenter is building a hexagonal outdoor table (a regular 6-sided polygon):
If the total perimeter of the table edge is 5.4 m, calculate the length of one side.
6 A town planner designs a circular paved area in a park with a radius of 6.2 m: 6.2 m
Calculate the circumference of the paved area. Round your answer to one decimal place.
7 A surveyor uses a trundle wheel with a diameter of 80 cm to measure a property boundary:
Calculate the distance the wheel travels in one full revolution. Give the answer in metres, rounded to two decimal places.
8 The playing area of a standard netball court is a rectangle 30.50 m long and 15.25 m wide. Around the perimeter of the playing area is a safety clearance zone that is 3.05 m wide on all sides. The playing area includes a centre circle with a diameter of 900 mm:
a Calculate the radius of the centre circle in metres.
b Calculate the area, in square metres, of the safety clearance zone (the area between the outer edge of the safety zone and the playing area). Round your answer to the nearest whole number.
9
A shade sail over a playground is triangular. It has a base of 6 m and a perpendicular height of 4.5 m:
Calculate the area of shade it provides.
10 A backyard lawn is shaped like a trapezium with parallel sides of 10 m and 16 m. The perpendicular distance between them is 6 m:
Calculate the area of the lawn.
11 The side wall of a shed is a composite shape with a rectangle 5 m wide and 2.8 m high, and topped by a triangular gable with a height of 1.2 m:
Calculate the total area of the wall.
12 An interior designer chooses a circular rug with a radius of 1.5 m for a room. Calculate the floor area covered by the rug. Round your answer to two decimal places.
13 A doorstop is shaped like a triangular prism. The triangular face has a base of 5 cm and a height of 12 cm (with a hypotenuse of 13 cm). The doorstop is 10 cm long. Calculate its total surface area. 12 5 10 13
14 A cylindrical water tank has a diameter of 2 m and a height of 1.8 m: 2 m 1.8 m
Calculate the total external surface area (including the top and bottom). Round your answer to one decimal place.
15 An open fish tank in the shape of a rectangular prism has a length of 50 cm, width of 20 cm and height of 24 cm:
cm
The total external surface area of the tank is:
A 2400 cm2 B 3660 cm2 C 4200 cm2 D 4360 cm2
E 5360 cm2
16 A baker weighs flour on a kitchen scale. The pointer is exactly halfway between the 400 g and 500 g marks:
What is the reading?
17 A safety inspector checks a digital luggage scale which shows a reading of 22.5 kg. The scale’s precision is ±0.1 kg:
Determine the range of values in which the true mass of the luggage lies.
18 A nurse reads a patient’s temperature from an analogue thermometer. The liquid level is exactly on the second small mark past 38 °C. If there are 10 small marks between 38 °C and 39 °C, what is the temperature?
19 A driver notices the fuel gauge shows the tank is full:
Fuel
If the fuel tank capacity is 60 L, estimate the number of litres of fuel remaining.
20 Sandbags are used during emergencies to stop flooding. A sandbag filled with sand has a mass of 20 kg. The density of the sand is 1600 kg/m3:
Note that:
a Calculate the volume of the sand in the bag in cubic metres.
b Convert this volume to litres. (Note: 1 m3 = 1000 L).
21 A builder pours a rectangular concrete slab for a shed floor. The slab is 10 m long, 8 m wide, and 0.15 m deep:
Calculate the volume of concrete required.
22 A triangular prism tent has a front entrance area of 1.5 m2 and a length of 2.4 m:
Area = 1.5 m2
Calculate the volume of air inside the tent.
2.4 m
23 A scheduled flight departs at 4:15 p.m. Write this time in 24-hour format.
24 Use this bus schedule: Departs Stop A at 08:10, arrives Stop B at 08:45. If a passenger misses this bus and has to wait 20 minutes for the next one (which has the same travel duration), what time will they arrive at Stop B?
25 A tide chart indicates high tide is at 5:20 a.m. and low tide is at 11:45 a.m. How much time passes between these two tides?
26 A commuter needs to travel from City A to City B:
• Option 1: Take a direct train that departs at 08:00 and arrives at 09:15.
• Option 2: Drive, which takes 65 minutes. Which option is faster, and by how many minutes?
27 A student has a part-time job and needs to travel from home to work. The shift starts at 5:00 p.m. The bus trip takes 35 minutes, and it is a 10 minute walk from the bus stop to work. What is the latest time the student can leave home to arrive exactly on time? A 4:15 p.m. B 4:25 p.m. C 4:05 p.m. D 4:35 p.m.
Big ideas
• Algebraic notation serves as a symbolic language for representing numerical generalisations and patterns. The consistent application of mathematical conventions allows for the clear and concise communication of relationships using variables and terms.
• Mathematical modelling involves the construction and manipulation of formulas and equations to represent real-world problems, where symbolic substitution and algebraic solving provide a framework for predicting outcomes and evaluating practical consumer choices.
5 Algebra and modelling
Chapter outline
If you can follow a recipe, you can follow a formula. Both are step-by-step rules for turning inputs into results.
5.01 Introduction to algebra
After this lesson, you will be able to…
• understand the concepts of constant, pronumeral, variable, and formula
• recognise basic conventions of mathematical terminology and notation
Algebraic terminology
Algebra is a way of using letters, symbols, and numbers to represent real-life problems. It replaces unknown numbers with letters (variables). It is used to:
• Describe patterns and relationships
• Simplify calculations
• Solve problems involving unknown values
• Make general rules that work in many situations
Exploration
In mathematics, letters and numbers are used to represent real-world situations where some values might change.
Consider a mobile phone plan with a fixed fee of $20 per month, plus $2 for every gigabyte (1 GB) of data used.
Answer these questions to build a general rule for the total monthly cost:
1. What is the total cost for a month if 1 GB of data is used?
2. What is the total cost for a month if 5 GB of data is used?
Monthly plan
$20 fixed fee +$2 per GB data
3. Using the letter g to represent the number of gigabytes of data used, write a rule (an algebraic expression) for the total monthly cost.
4. In the expression written, which part represents a value that changes each month? Which part represents a value that stays the same?
The resulting rule, likely 2g + 20, is an algebraic expression containing a variable ( g), a coefficient (2), and a constant (20). Each of these parts has a formal mathematical name.
Coe cient Expression
Variable
Equation
Term
In the equation 3x + 8 = 11:
3 is the coefficient.
x is the variable (pronumeral).
8 and 11 are constants.
3x is a term.
3x + 8 is an expression.
The whole statement 3x + 8 = 11 is an equation.
Variable
A letter or symbol that represents a number whose value can change. Also called a pronumeral.
Example: In x + 5 = 9, the variable is x. It stands for a number not known yet (in this case, x = 4).
Coefficient
The number multiplied by a variable. It represents the factor by which the variable is multiplied.
Example: In 3x, the coefficient is 3 (it means 3 × x).
In 7y, the coefficient is 7.
Constant
A fixed number — its value does not change.
Term
A single mathematical part of an expression. It can include a number, a variable, or both multiplied together.
Expression
A mathematical phrase consisting of one or more terms joined by addition or subtraction. It does not have an equals sign.
Example: 3x + 2 is an expression.
Equation
A mathematical statement showing that two expressions are equal. It always includes an equals sign (=).
Formula
A mathematical rule or relationship expressed as an equation, usually showing how to calculate one variable from others.
Example 1
Identify the variables, constants, and terms in the expression 3x 2 + 2x 5.
Create a strategy
Examine each part of the expression to identify its components.
Apply the idea
Variables: x appears in two terms.
Coefficients: 3 and 2 are coefficients of x 2 and x, respectively.
Constant: 5
Terms: 3x2, 2x, and 5
Reflect and check
Each term has been correctly identified as either containing a variable or being a constant term.
Example 2
Classify 2a + b = 10 as an expression or equation, and identify its components.
Create a strategy
First, determine whether it contains an equals sign, and then analyse its components.
Apply the idea
This is an equation as it contains an equals sign.
Left-hand side: expression 2a + b
Right-hand side: constant 10
Variables: a and b
Coefficients: 2 and 1
Constant: 10
Reflect and check
The statement contains an equals sign and two expressions, confirming it is an equation.
Idea summary
• Variables (Pronumerals) represent numbers whose values can change in algebraic expressions.
• Coefficients are the numbers multiplied by a pronumeral in a term.
• Constants are fixed values that do not change.
• Terms are single mathematical parts of an expression — a number, a pronumeral, or both multiplied together.
• Expressions are groups of one or more terms joined by addition or subtraction, with no equals sign.
• Equations are mathematical statements showing that two expressions are equal, always containing an equals sign (=).
• Formulas are mathematical rules or relationships expressed as equations, showing how to calculate one variable from others.
Algebraic conventions
To make algebra easy to read and understand, mathematicians follow certain rules and conventions. These conventions help everyone write and interpret algebraic expressions the same way:
1. Multiplication is usually not written with a symbol. Instead of writing 3 × x, simply write 3x. A number written next to a letter means multiplication.
2. Letters are written in alphabetical order. When more than one variable is multiplied, write them alphabetically. This ensures systematic notation and consistency (e.g., write xy, not yx).
3. A coefficient of 1 is not written. If a variable stands alone, it means the coefficient is 1.
4. Repeated multiplication is written using powers. When a variable is multiplied by itself, use indices (powers). The superscript digit (called an index or exponent) shows how many times the variable is multiplied by itself.
5. Division is written using a fraction. Instead of using the division symbol ÷, algebra usually uses a fraction bar. The fraction line means division in algebra.
6. Brackets are used to show grouping. Brackets ( ) indicate which part of an expression to calculate first.
7. Terms are written in order of powers. When writing an expression with powers, start with the highest power first.
8. Like terms can be combined. Terms that have the same variables (with the same powers) can be added or subtracted.
Example 3
Express “twice a number plus five” using algebraic notation.
Create a strategy
Identify the variable, coefficient, and constant, then combine them using standard algebraic notation.
Apply the idea
“A number” represents a variable: x
“Twice” means multiply by 2: 2x
“Plus five” adds the constant 5: 2x + 5
Example 4
Reflect and check
The expression follows standard conventions: coefficient first, no multiplication sign, and constant term last.
Write an algebraic expression for “the product of three variables x, y, and z, divided by two.”
Create a strategy
Order the variables alphabetically and apply the division using standard notation.
Apply the idea
Order variables alphabetically: xyz
Show division by 2:
Reflect and check
The expression uses correct variable ordering and standard fraction notation.
Idea summary
• Multiplication signs are omitted between numbers and variables (e.g., 3x).
• Division is written using fraction notation
• Variables in a product are written in alphabetical order.
• A coefficient of 1 is not written.
• Indices are used to show repeated multiplication (e.g., x2).
• Like terms — terms with the same pronumerals (with the same powers) — can be added or subtracted.
• Brackets ( ) indicate which part of an expression to calculate first.
• When writing an expression with powers, start with the highest power first.
5.01 Practice questions
What do you remember?
1 Complete each sentence to describe the algebraic expression: 5x 2 y + 8
a The constant term in the expression is ⬚
b The coefficient of the variable y is ⬚
c The variable(s) used in this expression are ⬚ and ⬚
2 Determine whether each statement is true or false and if false, explain:
a 3x + 2 is an example of an equation.
b If a variable stands alone (like a), its coefficient is 0.
c Variables in a term are usually written in alphabetical order (e.g., ab instead of ba).
3 Each student made a mistake in writing algebraic conventions. Identify the error and write the correct algebraic form:
a Student A wrote x × 5 as x5
c Student C wrote y × y × y as 3y
Practice
b Student B wrote m ÷ 4 as 4m
d Student D wrote 1 × k as 1k
4 Analyse the components of each of these algebraic expressions:
a Identify the terms in the expression 3a 2b + 8.
b Identify the coefficient of x in the expression y x + 5.
c Identify the constant term in the expression 4x 2 + 3x 12.
d List the variables used in the expression 2πr(h + r).
5 Consider the equation E = mc 2 :
a Is c a base or an index?
c Identify the subject of the formula.
b Is 2 a coefficient or an index?
6 Classify each item as an expression or an equation: a 5a +
7 Simplify or rewrite using correct algebraic conventions (index notation, ordering, and omission of signs):
a m × m × m × n × n b y × 3 × x
c 5 × a × a × b d k ÷ 2
8 Translate these phrases into algebraic expressions:
a “Three times a number x, decreased by seven.”
b “The sum of numbers x and y, divided by the difference of x and y.”
c “Twice the product of three pronumerals a, b, and c.”
d “The square of p added to the cube of q.”
9 Construct an algebraic expression that meets all these criteria:
• It has exactly three terms.
• The variable x has a coefficient of 4.
• The variable y has a coefficient of 1.
• The constant term is 10.
10 Determine the coefficient of x in each expression:
11 Reverse the algebraic conventions. Write the simplified expressions in their expanded form by showing all multiplication symbols and separating the pronumerals:
a 4a 2 b b 3(x + y)
12 Count the number of terms in each algebraic expression:
a 3x + 4y b 5a 2b + c 7
c 2xy d
Extend your thinking
13 Translate these geometric situations into algebraic expressions:
a The perimeter of a rectangle with length L and width W
b The area of a triangle with base b and height h
c The total length of the edges of a cube with side length s
14 Write a formula for the total cost C of a taxi ride with a fixed starting fee f, a per-kilometre rate r, and the distance travelled d. Identify the components of the formula.
15 Express “the square of the sum of two numbers” as an algebraic expression and explain how it differs from “the sum of the squares of two numbers”.
16 Write three different algebraic expressions to represent “a number increased by 50%”.
5.02 Develop and substitute formulas
After this lesson, you will be able to…
• develop simple formulas describing patterns
• substitute values into formulas to solve practical problems
• use estimation to check reasonableness of results
Patterns and relationships
Formula
A rule or relationship between variables written as a mathematical equation.
Example: A = πr 2 is the formula for the area of a circle.
Direct proportion
A relationship where two quantities increase or decrease together at a constant rate. (If one doubles, the other doubles). The formula takes the form y = kx (where k is a constant).
Inverse proportion
A relationship where an increase in one quantity results in a proportional decrease in the other. (If one doubles, the other is halved). The formula takes the form (where k is a constant).
In practical contexts, three specific patterns commonly appear: direct proportion, inverse proportion, and linear relationships involving fixed and variable components.
• Type 1: Direct proportion
This occurs when one quantity is a constant multiple of another. If one value is zero, the other is also zero.
• Structure: Variable A = Rate × Variable B
• Common examples:
• Circumference = π × Diameter (C = πd)
• Total earnings = Hourly rate × Hours (E = rh)
• Type 2: Inverse proportion
This occurs when a total amount is shared or divided by a changing variable. As the divisor increases, the result decreases.
• Structure:
• Common examples:
• •
• Type 3: Fixed and Variable (Linear)
This occurs when there is a starting value (fixed fee) that must be paid regardless of usage, plus a rate for usage.
• Structure: Total = Fixed fee + (Rate × Quantity)
• Common example:
• Taxi fare = Flagfall + (Rate × km)
Comparison of relationships:
Direct y = kx
Inverse
Linear y = a + bx
Example 1
Linear, starts at 0
Curved, decreases as x increases
Linear, starts at a when x = 0
A graphic designer charges a standard setup fee of $150 plus $60 per hour of work:
a Write a formula for the total cost, C, in terms of hours worked, h
Create a strategy
Identify the fixed cost (constant) and the variable cost (rate). The total cost is the sum of the fixed fee and the hourly rate multiplied by the hours worked.
Apply the idea
The fixed setup fee is $150.
The variable component is $60 per hour, which is written as 60h.
Combine these to form the equation:
C = 150 + 60h
Reflect and check
Check this by substituting h = 1. The cost should be $150 + $60 = $210. Using the formula:
C = 150 + 60(1) = 210
The formula works.
b Identify the type of relationship described.
Apply the idea
This relationship has a starting value that is not zero (150) and increases at a constant rate (60). Therefore, it is a linear relationship with fixed and variable components.
Example 2
A group of friends is planning a road trip. The cost of fuel per person (C ) is directly proportional to the distance travelled (d) and inversely proportional to the number of people in the car (n):
a Using k to represent the price of fuel per kilometre, formulate an equation for C in terms of d and n
Create a strategy
Identify the type of proportion for each variable. Direct proportion means the variable goes in the numerator, and inverse proportion means the variable goes in the denominator. Combine these into a single equation using the constant k
Apply the idea
Cost varies directly with distance, so d goes in the numerator. Cost varies inversely with the number of people, so n goes in the denominator.
Express the relationship as an equation with constant k
Simplify
b Describe what happens to the cost per person (C ) if the number of people (n) is doubled while the distance remains the same.
Create a strategy
Use the equation from part (a) and substitute 2n in place of n. Compare the new expression to the original.
Apply the idea
From part (a), . Replace n with 2n:
Substitute 2n for n
Factorise
Substitute C for
Since n is in the denominator (inverse proportion), doubling the number of people will halve the cost per person.
Idea summary
To develop a formula from a context:
• Direct proportion is a relationship where one quantity is a constant multiple of another. Check: Does it start at zero? Does it double when the input doubles? Formula: y = kx
• Inverse proportion is a relationship where an increase in one quantity results in a proportional decrease in the other. Check: Is a fixed total being shared or divided? Does increasing the input reduce the result? Formula:
• Linear relationships (fixed and variable) occur when there is a starting value plus a variable rate. Check: Is there a starting fee or initial value before the variable rate applies? Formula: y = a + bx
Did you know?
You can estimate how far away lightning is with a quick calculation. Because light travels faster than sound, count the seconds between the flash and the thunder, then divide by three. That number gives you the distance to the storm in kilometres!
Substitution into formulas
Substitution
A process that involves replacing the variables (letters) in a formula with specific known values to calculate an unknown quantity.
Common formulas in real-world contexts:
Context
Formula
Variables
Geometry (Circle) C = 2πr C = Circumference, r = Radius
Finance (Simple interest) I = Prn I = Interest, P = Principal, r = Rate (decimal), n = (time in years)
Physics (Ohm’s Law) V = IR V = Voltage, I = Current, R = Resistance
Conversions F = 1.8 × C + 32 F = Fahrenheit temperature, C = Celsius temperature
After substitution and calculation, estimation strategies are used to verify the result. This involves rounding the input numbers to simple integers to perform a mental check.
Example 3
The formula for cooking a roast turkey is given by T = 20w + 15, where T is the time in minutes and w is the weight in kilograms.
Calculate the cooking time required for a turkey weighing 4.2 kg.
Create a strategy
Substitute w = 4.2 into the formula and evaluate using the order of operations (multiplication before addition).
Apply the idea
T = 20w + 15
= 20(4.2) + 15
= 84 + 15
Write the equation
Substitute w = 4.2
Evaluate the multiplication = 99 minutes
Evaluate the addition
Reflect and check
Estimation check: Round 4.2 down to 4 : 20 × 4 = 80. Adding 15 gives 95 minutes. The calculated answer (99) is close to the estimate (95), confirming the reasonableness of the answer.
Example 4
The simple interest earned on an investment is calculated using I = Prn, where:
• P is the principal amount
• r is the interest rate as a decimal
• n is the time in years
Calculate the interest earned on $5000 invested at 4% p.a. for 3 years.
Create a strategy
Convert the percentage rate to a decimal, then substitute all values into the simple interest formula.
Apply the idea
Step 1: Convert the rate to a decimal: 4% = 0.04
Step 2: Substitute the values: P = 5000, r = 0.04, n = 3
I = Prn
= 5000 × 0.04 × 3
= $600
Idea summary
When working with formulas:
Write the formula
Substitute values for P, r, and n
Evaluate
• Substitution: The process of replacing variables in a formula with specific numerical values to calculate a result.
• Identify the variables and ensure values are in the correct units (e.g., converting percentages to decimals).
• Substitute values carefully into the expression.
• Use estimation to check if the result is logically consistent with the real-world context.
5.02 Practice questions
What do you remember?
1 Determine whether each statement is true or false:
a The graph of a direct proportion relationship, given by the formula y = kx, is always a straight line that passes through the origin (0, 0).
b A formula like C = 50 + 20h represents a direct proportion relationship.
c In an inverse proportion relationship, such as , increasing the value of s will cause the value of t to decrease.
d In the formula for the area of a rectangle, A = lw, the letters A, l, and w are called variables.
2 For the car rental formula C = 60 + 45d, where C is the total cost and d is the number of days, identify:
a The fixed fee
3
b The daily rate
Calculate the value of y in the formula y = 5x 3 when x = 4.
Practice
4
A taxi service charges an $8 flagfall fee plus $2.50 per kilometre.
Determine a formula for the total cost C in terms of distance d travelled in kilometres.
5 The time (t) taken to paint a building is directly proportional to the total surface area (A) to be covered and inversely proportional to the number of painters (n) working on the job:
a Using k as the constant of proportionality, formulate an equation for t in terms of A and n
b Describe what happens to the time (t) if the number of painters (n) is doubled while the area remains the same.
6 Using the formula M = 10k + 5, calculate the value of M for these values of k: a k = 2
7 A courier service charges a flat fee of $12 plus $1.50 per kilometre. Use the formula, C = 12 + 1.5d, to calculate the total cost for a 15.5 km delivery.
8 The formula for the perimeter, P, of a rectangle is P = 2l + 2w. Calculate P when l = 12.5, and w = 8.3.
9 Consider the pattern of values in the table:
Determine the formula for y in terms of x
10 A sales assistant earns a base weekly salary of $450 plus a commission of $15 for every television sold:
a Determine a formula for the total weekly wage, W, in terms of the number of televisions sold, n.
b Calculate the total wage for a week where 12 televisions are sold.
11 A car travels at a constant speed. It covers 120 km in 2 hours and 300 km in 5 hours:
a Determine a formula for the distance, D, travelled in terms of time t in hours.
b Use the formula to calculate the distance travelled in 3.5 hours.
12 A currency exchange shows 1 EUR = 1.85 AUD. How many AUD can be bought with 320 EUR?
13 A house painter charges $75 for materials plus $48 per hour:
a Estimate the total cost for a job that takes 6.5 hours.
b Calculate the exact amount and compare it to the estimate.
Extend your thinking
14 The time (t, in hours) it takes to complete a stocktake is inversely proportional to the number of staff members (n) assigned to the task. If it takes 4 staff members 6 hours to complete the job:
a Determine the formula for t in terms of n.
b How long would it take if 8 staff members were working?
15 A mobile phone plan has a monthly fee of $30 plus $0.15 per minute for calls and $0.08 per text message. Determine a formula for the monthly cost, C, in terms of minutes m and texts t, then calculate the cost for 250 minutes and 400 texts.
16 The formula to convert Celsius (C ) to Fahrenheit (F ) is F = 1.8 × C + 32.
First, estimate the temperature in Fahrenheit for 21°C by rounding the conversion rate. Then, calculate the exact value and comment on the reasonableness of the estimate.
5.03 Solve and rearrange equations
After this lesson, you will be able to…
• manipulate simple symbolic expressions
• solve linear equations in one variable
• rearrange simple formulas for a stated subject
Simplify algebraic expressions
Like terms
Terms that have the same variables raised to the same powers. Only like terms can be added or subtracted.
Example: 2x, 5x, 3x
Unlike terms
Terms that have different variables or the same variable raised to different powers.
Example: 2x, 3y, x 2
To simplify an algebraic expression means to make it shorter or easier to read by combining like terms and expanding brackets. This does not change the value; it just makes the expression more concise.
Note that only like terms can be added or subtracted. To combine like terms:
1. Add or subtract their coefficients.
2. Keep the variable part the same.
Step-by-step strategy (with brackets)
1. Expand any brackets.
2. Distribute multiplier (including any negative signs) across all terms within the brackets.
3. Group like terms together.
4. Add or subtract coefficients.
5. Write the simplified expression neatly.
Example 1
Simplify 4x + 2y x 3y + 5x.
Create a strategy
Identify and group like terms, then combine their coefficients.
Apply the idea 4x + 2
Reflect and check
Group like terms together = 8
Combine the coefficients of like terms
Each variable appears only once in the final expression with its combined coefficient.
Example 2
Simplify the expression 5(a 2b) 3(a 4b) + c
Create a strategy
First, expand the brackets by distributing the terms outside to each term inside. Then, group the like terms and combine their coefficients to simplify the expression.
Apply the idea
Expand the brackets
Group like terms together = 2a + 2b + c
Combine the coefficients of the like terms
Reflect and check
The final expression is fully simplified because there are no more like terms to combine. Each variable appears only once.
Idea summary
Key points for simplifying algebraic expressions:
• Like terms have identical variables raised to the same powers.
• Only like terms can be combined through addition and subtraction.
• The coefficients of like terms are combined while keeping the variable(s) unchanged.
• Unlike terms remain separate in the final expression.
Solve linear equations
Interactive exploration
Discover this concept in action online mathspace.co
Linear equation
An equation that contains only numbers, pronumerals (variables), and operations like addition, subtraction, multiplication, or division, but no powers or roots of the variable.
The goal is to find the value of the variable that makes the equation true.
The fundamental principles for solving linear equations are:
• The equality principle: performing the same operation on both sides maintains the equation’s balance.
• Using inverse operations to isolate the variable.
• Simplifying expressions by combining like terms.
Steps to solve linear equations:
1. Simplify both sides.
Expand brackets and combine like terms if needed.
2. Move variables to one side.
Keep all pronumerals (like x) on one side of the equation and constants (numbers) on the other.
3. Apply inverse operations to both sides of the equation.
Perform the same operation on both sides to undo the addition, subtraction, multiplication, or division.
4. Simplify the equation.
Perform the arithmetic to simplify the expression on each side.
5. Isolate the variable.
Divide or multiply both sides to find the value of the variable.
When rearranging formulas, the same principles apply. The goal is to express one variable in terms of others.
The process involves treating all other variables as constants and using inverse operations systematically.
Example 3
Solve the equation: 3(2x 4) = 5x 1
Create a strategy
First expand the brackets, then collect like terms on each side, and finally isolate the variable.
Apply the idea
3(2x 4) = 5x 1
Write the equation 6x 12 = 5x 1
Expand the brackets
Reflect and check
6x 5x 12 = 5x 5x 1
Subtract 5x from both sides x 12 = 1
Evaluate the subtraction x 12 + 12 = 1 + 12
Add 12 to both sides x = 11
Evaluate the addition
To verify, substitute x = 11 back into the original equation.
Since the left side equals the right-hand side: the solution is correct.
Example 4
Solve the equation:
Create a strategy
To eliminate the fractions, multiply both sides of the equation by the least common multiple (LCM) of the denominators. Then, solve the resulting linear equation.
Apply the idea
The denominators are 2 and 3. The least common multiple (LCM) of 2 and 3 is 6.
Write the equation
Multiply both sides by the LCM, 6, to eliminate the fractions
Simplify the fractions
Expand both sides using the distributive law
Subtract 2x from both sides
Evaluate the subtraction
Subtract 3 from both sides
Evaluate the subtraction
Reflect and check
To verify the solution, substitute x = 7 back into the original equation.
• Left-hand side:
• Right-hand side:
Since both sides are equal, x = 7 is the correct solution.
Idea summary
When solving linear equations:
1. Apply the same operation to both sides of the equation to maintain equality.
2. Use inverse operations to isolate variables.
3. Expand brackets before combining like terms.
4. When rearranging formulas, treat other variables as constants.
5. Always verify solutions by substituting back into the original equation.
Rearrange formulas
Subject of the formula
The variable that is isolated on one side of a formula or equation. It is the variable for which the formula is solved.
Example: In the formula A = lw, A is the subject.
The process of rearranging formulas follows these key principles:
• Apply inverse operations in the reverse order of BIMDAS (Brackets, Indices, Multiplication or Division, Addition or Subtraction).
• Perform the same operation to both sides of the equation to maintain equality.
• Isolate the desired subject variable on one side of the equation.
Example 5
Consider the formula for the area of a triangle, . Rearrange this formula to make the height, h, the subject:
a Identify the operations being performed on the variable h in the original formula.
Create a strategy
Look at the right-hand side of the equation to see how h is attached to the other parts.
Apply the idea
In the term , the variable h is:
1. Multiplied by b
2. Divided by 2
b List the inverse operations, in the correct order, needed to isolate h.
Create a strategy
To isolate a variable, reverse the operations identified in part (a) in the reverse order (working backwards).
Apply the idea
To undo the operations on h:
1. The inverse of dividing by 2 is multiplying by 2.
2. The inverse of multiplying by b is dividing by b
c Perform these operations to write the new equation with h as the subject.
Create a strategy
Apply the steps from part (b) to both sides of the equation
Apply the idea
Write the formula
Multiply both sides by 2
Evaluate the multiplication
Divide both sides by b
Simplify the fraction
Rewrite with subject on the left side of the equation
Reflect and check
Check this by substituting the formula back. If , then
The rearrangement is correct.
Example 6
An event venue charges a fixed room hire fee of $500 plus $25 per person for catering. The total cost, C, is given by the formula:
C = 25n + 500
where n is the number of guests.
Rearrange the formula to make the number of guests, n, the subject.
Create a strategy
Identify the operations performed on n: it is multiplied by 25, and then 500 is added. To isolate n, perform the inverse operations in reverse order: first subtract 500, then divide by 25.
Apply the idea
Write the formula
Subtract 500 from both sides
Divide both sides by 25
Rewrite with the subject on the left
Reflect and check
This rearranged formula is useful for budgeting. If the organiser knows their maximum budget (C ), they can easily calculate exactly how many guests (n) they can afford to invite.
Idea summary
When rearranging formulas:
• Subject of the formula: The variable isolated on one side of a formula, representing the quantity being calculated.
• The same operation must be applied to both sides of the equation.
• Operations are performed in the reverse order of BIMDAS
• The final expression should have the desired subject isolated on one side.
• The mathematical relationship between variables remains unchanged.
5.03 Practice questions
What do you remember?
1 Determine whether these pairs of terms are like terms or unlike terms:
a 3x 2 and 3x
b 5ab and 2ba
c 4y and y d 7x 2 y and 7xy 2
2 Identify and correct the error in this calculation using BIMDAS:
3 Determine the term to complete the statements:
a The equality principle states that whatever operation is performed on one side of an equation must also be performed on the other side to maintain ⬚
b Isolating a variable when solving an equation requires performing the ⬚ operation on both sides.
c Expanding an expression such as 3(x + 2) involves applying the ⬚ law.
d In the algebraic term 5x, the number 5 is called the ⬚
Practice
4 Simplify the expressions by collecting like terms:
5 Expand and simplify the expressions: a 4(x 5)
3(x + 2) + 2(x 4) c 2x(x + 3) x 2
5(a 2b) 2(
6 Solve for the variable in each equation:
7 Solve the equations involving brackets:
4(2x 1) = 3(x + 7)
5( y + 2) = 25 c 3( p 4) = 2( p + 1)
2(3x 1) 4(x + 2) = 3(x 5)
8 Solve these equations: a 5x + 3 = 2x + 18
7m 5 = 3m + 15 c 4k + 9 = 9k 1
2 y = 5y 10
9 Solve for x in each equation:
10 Consider the formula for kinetic energy, . Rearrange this formula to make the mass, m, the subject:
a Identify the operations being performed on the variable m in the original formula.
b List the inverse operations, in the correct order, needed to isolate m.
c Perform these operations to determine the new equation with m as the subject.
11
12
The formula for converting temperature from Celsius (C ) to Fahrenheit (F) is . Rearrange this formula to make the Celsius temperature, C the subject.
A carpenter uses the formula P = 2l + 2b to calculate the total length of timber P needed for a rectangular frame.
If the carpenter knows the total available timber and the required length l, rearrange the formula to determine the breadth b of the rectangular frame.
Extend your thinking
13 The volume V of a cylindrical tank is given by the formula V = πr 2 h, where r is the radius and h is the height. An engineer needs to design a tank with a specific volume V and height h. Rearrange the formula to find the required radius r
14 A rectangle has a length of (2x + 5) cm and a width of (x 2) cm:
a Determine and simplify an expression for the perimeter, P, in terms of x.
b Rearrange the formula from part (a) to make x the subject.
c If the perimeter is 42 cm, calculate the value of x.
15 The formula for the sum of an arithmetic series is . Rearrange the formula to make the first term, a, the subject.
INVESTIGATION
Model phone plans
Use mathematical modelling to navigate confusing marketing language, allowing for the comparison of various phone plans to determine the best value based on data usage.
Objectives
• To extract mathematical information from consumer product descriptions
• To use spreadsheets or formulas to model and compare different options
• To interpret the model to make and justify a decision Materials
• A computer with spreadsheet software
• Calculator
Plan analysis
Scenario
Imagine you are helping a friend choose a new phone plan. You have narrowed down the options to three contenders. Your goal is to analyse them mathematically to provide a clear recommendation.
The options
• Plan A: DataDash Basic
Price is $25 per month. Includes 10 GB of data. Excess data is charged at $10 per GB.
• Plan B: Connect More Standard
Price is $40 per month. Includes 50 GB of data. Excess data is charged at $5 per GB.
• Plan C: UltraLink Premium
Price is $65 per month. Includes Unlimited GB of data. No excess data charges.
Investigate
Before building a full model, analyse the plans at a high level.
1. Identify the key mathematical variables for Plan A and Plan B. What is the fixed monthly cost, the data inclusion, and the variable cost for excess data?
2. Without doing any detailed calculations, which plan seems best for someone who uses very little data (e.g., less than 5 GB per month)? Why?
3. Which plan is automatically the best choice for someone who knows they will use a very large amount of data (e.g., more than 100 GB per month)? Why?
4. The real challenge is deciding between plans for users in the “middle range”. What data usage range do you predict will be the most difficult to choose a plan for?
Model construction
Step 1: Set up your spreadsheet.
Open a new spreadsheet. In column A, create a heading “Data used (GB)”. In cells B1, C1, and D1, create headings for the cost of each plan: “Cost Plan A ($)”, “Cost Plan B ($)”, and “Cost Plan C ($)”.
Step 2: Input the independent variable.
In the “Data used (GB)” column (A), enter values from 0 to 80, in increments of 5. (i.e., 0, 5, 10, 15 …).
Step 3: Create the cost formulas.
You will need to use a conditional formula, like an IF statement, to model the excess data charges. The structure is:
IF(logical-test, value-if-true, value-if-false)
In cell B2, enter the formula for Plan A’s cost. This is the base cost ($25) plus any extra charges. The extra charges only apply IF the data used (in cell A2) is greater than 10 GB.
Hint:
= 25 + IF(A2 > 10, (A2 10) ∗ 10, 0)
• In cell C2, enter the formula for Plan B’s cost. Remember, Plan B has a different base cost and a different data limit (50 GB) before excess charges apply.
• In cell D2, enter the formula for Plan C’s cost. Since this is a flat rate with no variables, this will be a single constant number.
Step 4: Populate the data.
Click on cell B2 and drag the fill handle (the small square in the bottom-right corner) down to populate the formula for all your data usage values. Repeat for columns C and D.
Step 5: Visualise the model.
Select all your data (from cell A1 to the bottom of column D). Insert a Line Chart to create a visual comparison of the three plans. Make sure your chart has a title and that the axes are clearly labelled.
Investigate
1. Analyse the generated chart. Describe what is happening to the line for Plan A at the 10 GB mark. What does this represent in the real world?
2. Identify the point on the graph where the cost of Plan A and Plan B are the same (the intersection point). At what approximate data usage does this occur?
3. Use the spreadsheet data to identify the range of data usage where Plan B becomes more cost-effective than Plan A, estimating the exact crossover point.
4. A person’s data usage over the last four months was: 12 GB, 25 GB, 8 GB, and 14 GB. Use your model to calculate the total cost they would have paid over the four months on each plan. Based on this, which plan would you recommend? Justify your answer.
5. For what range of monthly data usage is Plan A the most economical choice? What about Plan B? And Plan C? Use your model to define these ranges.
Discussion
1. How did creating a mathematical model in a spreadsheet help you compare the plans more effectively than just reading the descriptions?
2. This model is based on one variable: data usage. What other non-mathematical factors might influence a person’s choice of phone plan?
3. How could a phone company use a similar mathematical model to design a new, competitive phone plan? What would they be trying to achieve?
4. Describe an alternative real-world scenario where spreadsheet modelling could be applied to facilitate a financial decision, such as comparing vehicle rentals or banking services.
Chapter review
1 In the expression 8x 2 5xy + 3y 1, identify the: a Variables b Coefficients c Terms d Constant term
2 Is 9p + q = 21 an expression or an equation? Explain why.
3 Write an algebraic expression for the statement: ‘Ten is reduced by four times a number n’.
4 Write an algebraic expression for the statement: ‘Five times the product of the three variables p, q, and r’.
5 A mobile phone plan costs $25 per month, which includes 10 gigabytes of data. Any extra data used is charged at a rate of $8 per gigabyte. Write a formula for the total monthly cost, C, for a person who uses d gigabytes of extra data.
6 Using the formula C = 25 + 8d, calculate the total cost for a month when 4.5 gigabytes of extra data were used.
7 The formula for the cooking time of a roast in minutes is T = 25w + 20, where w is the weight in kilograms. What is the cooking time for a roast that weighs 2.4 kg?
A 75 minutes B 80 minutes C 85 minutes D 100 minutes
8 A streaming service’s subscriber numbers are growing at a constant rate. After 3 months, it has 45 000 subscribers, and after 8 months, it has 120 000 subscribers. Write a formula for the number of subscribers, S, in terms of the number of months, m
9 The time (t in hours) to print an order is inversely proportional to the number of printers ( p). If 5 printers take 18 hours to complete an order, how long would it take if 9 printers were used?
10 The exchange rate between Australian Dollars (AUD) and Japanese Yen (JPY) is 1 AUD = 98 JPY. How many JPY would be received in exchange for $350 AUD?
11 A company purchases six identical laptops that each cost $885. The total cost is estimated by first rounding the cost of a single laptop to the nearest hundred dollars. The percentage error for this approximation, rounded to two decimal places, is:
12 Expand and simplify the expression: 5(2x 1) + 3(x + 4)
13 Simplify the expression 9a 4b + 2a + 7b.
14 Solve the equation 5x 12 = 38.
15 Solve the equation 3(4x + 5) = 5x 6.
16 Solve the equation
17 Make m the subject of the linear equation: W = mt + b
18 The total length of cable, L, required for a rectangular boundary is L = 2x + 2y. Rearrange the formula to make the length, x, the subject.
19 Rearrange the formula for the area of a trapezium, , to make h the subject.
20 A company manufactures and sells smartwatches. The total cost, C, to produce the watches is given by the formula C = 120 000 + 450n, where n is the number of watches. The revenue, R, from selling the watches is given by R = 600n
Calculate the minimum number of watches that must be sold to make a profit.
21 A company manufactures e-bikes. The total cost (C ) to produce the bikes is given by the formula C = 250 000 + 500n, where n is the number of e-bikes.
The company wants to set a sale price so that it breaks even after selling exactly 500 e-bikes. Calculate the required sale price for each e-bike.
22 The time, T, in seconds, for a pendulum to complete one full swing is given by the formula where L is the length of the pendulum in metres.
If a pendulum takes 4 seconds to complete a swing, its length, L, rounded to the nearest metre, is closest to:
“Great innovation only happens when people aren’t afraid to do things differently.”
Georg Cantor
Big ideas
• Comparing data sets involves both visual and numerical analysis. Visual tools like comparative graphs reveal the shape and distribution of data, while numerical summary statistics quantify key features like the centre and spread, allowing for precise, evidence-based conclusions.
• Statistical comparison also involves probability. This is where expected results are compared with experimental results. Analysing the difference between expected and observed frequencies helps determine fairness, identify bias, and understand the role of random variation in probabilistic situations.
“Expected value” is the long-run average result. It is why carnival games look fun... and still make money for the carnival.
6.01 Compare data displays
After this lesson, you will be able to…
• create and interpret comparative displays for categorical and numerical data (e.g., side-by-side bar charts, back-to-back stem plots, parallel boxplots)
• accurately read scales, keys and conventions, and comment on similarities or differences in centre, spread, shape and outliers
Construct comparative displays
Comparative displays allow direct visual comparison between two or more data sets. Three key types of comparative displays are commonly used in statistical analysis.
Side-by-side bar chart
A display for categorical or discrete numerical data with separate bars for each group, enabling direct comparison of frequencies or values between groups.
Back-to-back stem plot
A display that arranges two related numerical data sets on opposite sides of a central stem, sharing common stem values to compare distributions.
Parallel boxplot
A display that presents multiple boxplots aligned on a common scale, facilitating comparison of centre, spread, shape, and outliers across groups.
Parallel boxplots are particularly useful for comparing the five-number summary (minimum, first quartile Q1, median, third quartile Q3, and maximum) across different groups and for visually identifying potential outliers. These are data points that lie a significant distance from other values in a random sample from a population.
When constructing comparative displays, several key principles ensure effective communication:
• Consistent scales and units across all components of the display
• Clear labels and titles that identify the groups being compared
• A key or legend to explain what different colours or patterns represent
• Distinct colours or patterns to differentiate between groups
Example 1
The number of students who chose different sports in Year 9 and Year 10 is shown in the table:
Construct a side-by-side bar chart to compare the choices.
Create a strategy
To create a side-by-side bar chart, draw a pair of bars for each category (Sport). The height of each bar will correspond to the frequency (Number of students) on the vertical axis. Use a key to distinguish between Year 9 and Year 10.
Apply the idea
1. Draw and label the axes. The horizontal axis will show the sports (Soccer, Basketball, Tennis), and the vertical axis will show the number of students. Choose a suitable scale for the vertical axis (e.g., from 0 to 50, with intervals of 10).
2. For each sport, draw two bars side-by-side: one for Year 9 and one for Year 10. The height of each bar should match the data in the table.
3. Create a key (or legend) to indicate which colour represents Year 9 and which represents Year 10.
Reflect and check
The chart clearly shows that basketball is the most popular sport in Year 9, while soccer is the most popular in Year 10. Reading the scale on the vertical axis allows for a precise comparison of the number of students for each sport and year level.
Example 2
The data shows test scores for two classes:
• Class A: 65, 72, 68, 75, 70, 82, 69, 71
• Class B: 70, 73, 71, 69, 74, 72, 68, 75
Construct a back-to-back stem plot to compare these distributions.
Create a strategy
A systematic approach involves first organising each data set, then creating stems for the tens digits and leaves for the ones digits on opposite sides of a central stem line.
Apply the idea
1. Data arranged in ascending order:
• Class A: 65, 68, 69, 70, 71, 72, 75, 82
• Class B: 68, 69, 70, 71, 72, 73, 74, 75
2. Back-to-back stem plot arrangement:
Reflect and check
The back-to-back stem plot reveals that Class B has a more concentrated distribution, while Class A has a wider spread with an outlier at 82.
Example 3
Create a parallel boxplot to compare the two sets of exam scores:
• Group X: 65, 70, 72, 75, 78, 80, 82, 85
• Group Y: 68, 70, 71, 72, 73, 75, 76, 78
Create a strategy
To construct the boxplot, calculate the five-number summary for each data set, then plot these values on a common scale.
Apply the idea
1. Calculate five-number summaries:
2. Plot these values on a common scale, with boxes representing Q1 to Q3, whiskers extending to minimum and maximum values, and a line indicating the median:
Reflect and check
The parallel boxplot indicates that Group X has a greater spread and higher median, while Group Y shows a more compact distribution with lower variability.
Idea summary
Key types of comparative displays:
• A side-by-side bar chart is best for comparing frequencies of categorical data between groups.
• A back-to-back stem plot allows for a detailed comparison of the shape and spread of two numerical distributions.
• Parallel boxplot are ideal for comparing five-number summaries, spread, and outliers across multiple groups on a common scale.
Regardless of the type, always ensure consistent scales, clear labels, and distinct keys for effective communication.
Interpret comparative displays
Comparative data displays allow for direct visual comparison between two or more data sets.
Common types include:
• Side-by-side bar charts: Display categorical data with separate bars for each group, allowing direct comparison of frequencies or values.
• Back-to-back stem plots: Present two numerical data sets using a common stem, allowing direct comparison of their distributions.
• Parallel boxplots: Show five-number summaries side by side to compare centre, spread, and the overall distribution shape.
When analysing comparative displays, three key aspects require consideration:
• Centre: Compare typical values or central tendencies between data sets (e.g., median; or mean where appropriate to the display type).
• Spread: Examine and contrast the variability or dispersion of values (e.g., interquartile range, range).
• Shape: Analyse the overall distribution pattern, including whether the data is symmetric or skewed.
Example 4
The back-to-back stem plot displays the pulse rates (in beats per minute) of two groups of students after exercise:
Compare the distributions of Group A and Group B in terms of centre and spread.
Create a strategy
To compare the centre, identify the median for each group. Remember that the leaves for Group A (on the left) are read from right to left (outwards from the stem). To compare spread, calculate the range (maximum value minus minimum value) for each group.
Apply the idea
Step 1: Compare the centres (medians)
• Group A data (ordered): 68, 72, 74, 76, 79, 81, 85. There are 7 values. The median is the 4th value: 76 bpm
• Group B data (ordered): 75, 82, 84, 86, 88, 90, 92. There are 7 values. The median is the 4th value: 86 bpm
Group B has a higher centre (86) compared to Group A (76), indicating that Group B typically had higher pulse rates.
Step 2: Compare the spread (range)
• Group A range: 85 68 = 17
• Group B range: 92 75 = 17
Both groups have an identical range of 17, meaning the variability or spread of the pulse rates is the same for both groups.
Reflect and check
Even though the spread is the same, the entire distribution for Group B is shifted to the higher end of the scale compared to Group A. This is easily seen in the stem plot where the “bulk” of the Group B distribution is shifted towards the higher values compared to Group A.
Example 5
The side-by-side bar chart compares the primary commute methods for residents in City A and City B:
Compare the commute distributions for City A and City B in terms of centre (most common method) and spread (variation in frequency).
Create a strategy
Identify the mode (centre) for each city by looking for the highest bar. Then, calculate the range (spread) of frequencies for each city to see how varied the participation is across categories.
Apply the idea
Step 1: Compare the centres (modes)
• City A: The tallest bar is train with 150 residents.
• City B: The tallest bar is bus with 90 residents.
The typical commute method is train in City A, while bus is the most common in City B.
Step 2: Compare the spread (variation in frequency)
• City A frequency range: 150 20 = 130
• City B frequency range: 90 70 = 20
City A has a significantly larger spread (130) compared to City B (20).
Reflect and check
In City A, commuting is highly concentrated in one method (train), leading to a high range. In City B, residents are more evenly split between the three methods, resulting in a much lower range of frequencies.
Example 6
A parallel boxplot shows test scores for Class A and Class B:
Identify the five-number summary for each class and compare the distributions.
Create a strategy
Analyse and compare the centre (median), spread (IQR and range), and shape characteristics of both distributions.
Apply the idea
Step 1: Centre comparison
• Class A median: 75
• Class B median: 70
The median score for Class A is 5 points higher than for Class B, suggesting Class A performed better on average.
Step 2: Spread comparison
• Class A IQR: 85 65 = 20
• Class B IQR: 80 60 = 20
• Class A range: 95 50 = 45
• Class B range: 90 45 = 45
Both classes have an identical IQR (20) and range (45), indicating that the variability of scores is the same for both the middle 50% of students and the entire class.
Reflect and check
Both classes show similar spread patterns, but Class A’s entire distribution is shifted higher on the score scale. This indicates consistently higher performance across all quartiles compared to Class B.
Idea summary
Key points for interpreting comparative displays:
• Compare central tendencies (e.g., median) between data sets to identify typical values.
• For numerical data, analyse spread (e.g., IQR, range) to understand variability within and between distributions.
• Examine shape characteristics to identify symmetry and skewness; note any outliers as unusual features of the distribution.
• Consider scale, units, and keys when making direct comparisons.
6.01 Practice questions
What do you remember?
1 Determine whether these statements about data displays are true or false:
a A side-by-side bar chart is used to compare frequencies of categorical data.
b In a back-to-back stem plot, the leaves on the left side are read from left to right.
c Parallel boxplots must be drawn using the same (common) scale on the horizontal axis.
d An outlier is a data point that is significantly different from the rest of the data set.
2 Complete these sentences regarding data analysis:
a The three key aspects used to compare data sets are centre, ⬚ and shape.
b The ⬚ is the central value of a data set often identified in a boxplot.
c A distribution that has a long tail trailing off to the right is said to be ⬚ skewed.
d The range of the middle 50% of the data is called the ⬚ range.
3 Match the comparative display or component with its correct description:
a Side-by-side bar chart
b Back-to-back stem plot
c Parallel boxplots
d Key or legend
i Aligns multiple five-number summaries on a common scale
ii Explains the units, colours, or symbols used in the display
iii Compares frequencies of categories between groups using pairs of bars
iv Arranges two numerical data sets on opposite sides of a central line
4 The number of students participating in different sports is recorded:
a Construct a side-by-side bar chart to compare the participation data.
b Which sport is most popular overall, and in which sport is the difference in participation between boys and girls the greatest?
5 The test scores for two groups are:
• Group A: 62, 65, 68, 70, 73, 75, 78
• Group B: 61, 63, 67, 70, 72, 74, 76
a Construct a back-to-back stem plot to compare the scores.
b Comment on the similarities and differences in the test scores for the two groups, referring to centre and spread.
6 The scores for two teams in a competition are listed:
• Team X: 15, 18, 20, 22, 25, 28, 50
• Team Y: 12, 16, 19, 21, 23, 24, 26
a Construct a parallel boxplot for these data sets.
b Comment on the key differences between the two teams’ scores, referring to the median and interquartile range.
c Identify any potential outliers in the data. How does the outlier for Team X affect the shape of its distribution?
7 This side-by-side bar chart shows the number of fictional book genres sold by two different bookstores, Corner shelf and Big chain, in a week: Bookstore sales comparison
a Which bookstore sold more mystery novels, and by how much?
b Comment on the overall sales pattern, noting which genre shows the greatest difference in sales between the stores and which store generally focuses on specific genres.
Ex
Ex
8 This parallel boxplot shows the battery life (in thousands of hours) of products from two manufacturers:
of hours
a Determine the median and interquartile range (IQR) for each manufacturer.
b Write a sentence comparing the centre and spread of battery life for the two manufacturers.
9 A side-by-side bar chart shows monthly sales (in thousands) for two stores. Store A’s scale reads from 0 to 100 in increments of 20. If Store A’s bar reaches the 60 mark and Store B’s bar is 75% of Store A’s height, what are the sales figures for both stores?
10 A back-to-back stem plot shows temperatures, in degrees Celsius, for two cities. If each leaf represents the ones digit and the highest stem is 3, what is the maximum possible temperature shown?
11 In a parallel boxplot with scale increments of 2 units, the upper whisker extends to a line halfway between 24 and 26. What is the maximum value?
Extend your thinking
12 A back-to-back stem plot shows the ages of members at two different fitness clubs:
a Determine the median age and interquartile range (IQR) for each club.
b Comment on the shape of each distribution.
13 The salary distributions for two companies, TechCorp and Innovate Pty, are compared using parallel boxplot (in thousands of dollars):
14
a Based on the data, compare the centre and spread for the middle 50% of employees at both companies.
b Discuss how the outlier in TechCorp affects the overall comparison of ranges and shapes between the two companies.
c Determine which company has a more consistent salary distribution, and justify the answer using appropriate statistical measures.
A researcher collected data on plant growth under two different conditions:
Construct the most appropriate comparative display for this data, and explain why it is a better choice than the other two options.
6.02 Compare summary statistics
After this lesson, you will be able to…
• calculate and compare measures of central tendency and spread for related data sets
• describe, compare and analyse data sets and their summary statistics, reporting on trends, implications and limitations
Measures of centre
Summary statistics describe data sets numerically. One approach is to calculate measures of central tendency. These measures indicate the centre or “typical” value of the data.
Mean
The average of a data set. Calculate it by adding all values together and dividing by the total number of values.
Median
The middle value when data is ordered from least to greatest.
Mode
The most frequently occurring value. A data set may have more than one mode.
Exploration
Consider these test scores for a group of 7 students: 85, 92, 77, 85, 96, 68, 88
Before the formal methods are introduced, consider how a typical or central score for this group can be described.
1. Determine the score that occurs most often. What might this indicate about the data?
2. If the scores are arranged in order from lowest to highest, determine the middle value.
3. How can a single value that represents the average of all the scores be calculated?
4. Which of these methods best represents a typical score for this data set? Justify your choice by referring to the data.
Scientific calculators calculate summary statistics automatically using “Stat” mode. While every model is slightly different, the general steps are:
1. Enter Stat mode: Press the Mode or Menu button and select ‘STAT’ or ‘Statistics’. Choose ‘1-VAR’ (one variable) statistics.
2. Input data: Enter each value into the list. If a frequency table is used, ensure the ‘Frequency’ column is enabled in the calculator settings.
3. Calculate: Press the calculation or results button (often ‘AC’ followed by ‘Shift’ + ‘1’ or ‘Stat Res’). Look for these symbols:
• for the mean
Example 1
• Med for the median
• Q1 and Q3 for quartiles
The number of hours spent exercising per week was recorded for 20 students: 2, 3, 1, 4, 2, 5, 2, 3, 4, 2, 3, 1, 4, 2, 5, 3, 2, 4, 3, 2
Determine the mean, median, and mode for this data set.
Create a strategy
Organise the data into an ordered list or frequency table to simplify calculation. Then, apply the formulas for mean, median, and mode.
Apply the idea
Step 1: Order the data or create a frequency table.
Step 2: Calculate the mean.
Multiply each value by its frequency, sum the products, then divide by the total number of values.
Add the products of hours and frequencies
Simplify
Evaluate
Step 3: Determine the median.
With 20 values, the median is the average of the 10th and 11th values. From the frequency table, the first 2 values are 1, and the next 7 values are 2 (cumulative 9 values). The next 5 values are 3 (cumulative 14 values). Therefore, both the 10th and 11th values are 3. The median is 3.
Step 4: Identify the mode.
The value with the highest frequency is 2 hours (frequency of 7).
Reflect and check
The mean (2.85), median (3), and mode (2) are all similar in value, which is consistent with a roughly symmetric distribution. Since the median is 3, the middle value of the distribution is 3 hours, suggesting that a typical student in this group exercised for 3 hours per week.
Idea summary
Measures of central tendency describe the centre of a data set:
• Mean: The sum of all values divided by the number of values.
• Median: The middle value of an ordered data set, or the average of the two middle values when there is an even number of data points.
• Mode: The most frequently occurring value (there may be more than one).
Measures of spread
While measures of centre show the typical value, measures of spread describe how variable or dispersed the data values are. A smaller spread indicates that data values are clustered together, while a larger spread indicates greater variability.
Range
The difference between the maximum and minimum values in a data set.
Interquartile range (IQR)
The range of the middle 50% of the data. It is the difference between the third quartile (Q3) and the first quartile (Q1).
Outliers
Data points that are significantly different from the rest of the data. They can affect the range and mean significantly.
Interactive exploration
Discover this concept in action online mathspace.co
Example 2
Daily temperatures (in °C) were recorded over two weeks: 22, 25, 23, 24, 22, 35, 23, 24, 22, 25, 23, 24, 23, 24
Calculate the range and determine if there are any outliers.
Create a strategy
Order the data from least to greatest to identify the minimum and maximum values for the range. Look for values that do not fit the pattern of the data to identify outliers.
Range = Maximum Minimum Write the formula for range = 35 22
Substitute the maximum and minimum values = 13°C
Evaluate
Step 3: Identify outliers, if any. 13 out of 14 values lie between 22°C and 25°C. The value 35°C is significantly higher than the others.
Reflect and check
The range is 13, but if the outlier (35) were removed, the range would be 3. This shows how outliers significantly increase the range.
Idea summary
Measures of spread describe the variation or consistency of data:
• Range = Maximum Minimum
• Interquartile range (IQR) = Q3 Q1
• Outliers are values that are very different from the data set.
Comparisons
Use summary statistics to write conclusions when comparing two related data sets. A complete comparison includes:
1. A statement about the centre: Compare the means or medians to determine which group has a higher “typical” value.
2. A statement about spread: Compare the range, IQR, or standard deviation to determine which group is more “consistent.” A smaller spread means the data are more consistent.
3. A statement about shape: Compare the symmetry or skewness of the data sets to see if the data is bunched at one end or spread evenly.
Always consider the context of the data. For example, in a race, a lower mean time is better, but on a test, a higher mean score is better.
Limitations: Be careful when interpreting statistics. Outliers can distort the mean, range, and standard deviation, making them less reliable. In those cases, the median and IQR might be better for comparison as they are not affected by outliers.
Example 3
Two classes took the same mathematics test:
• Class A scores: 65, 70, 70, 75, 80, 85, 85
• Class B scores: 60, 65, 75, 75, 75, 80, 90
Determine summary statistics and write a comparison of the two classes.
Create a strategy
Calculate the mean and median for the centre. Calculate range and IQR for spread. Then, write sentences comparing them.
Apply the idea
Summary statistics:
On average, Class A performed slightly better than Class B, because it has a higher mean (75.7 vs 74.3), though the median score for both classes was the same (75).
The middle 50% of scores in both classes had the same consistency, as shown by the equal IQRs (15). However, the total spread of scores in Class B was wider (range of 30) than that of Class A (range of 20).
Example 4
The daily rainfall (in mm) was recorded for two locations over a week:
• Location A: 2, 3, 3, 4, 12, 3, 3
• Location B: 4, 4, 5, 5, 5, 4, 3
Determine which location had more consistent rainfall.
Create a strategy “Consistency” refers to measures of spread. Calculate the range and IQR for both. The location with lower spread values indicates higher consistency.
Apply the idea
Location B has more consistent rainfall. Although both locations have an IQR of 1, Location B has a much smaller range (2) compared to Location A (10). Location A is less consistent because of the outlier (12).
Idea summary
When comparing data sets:
• Use mean or median to compare performance or typical values.
• Use range, IQR, or standard deviation to compare consistency (spread).
• A lower spread implies greater consistency.
• Check for outliers, as they can make the mean, range, and standard deviation misleading.
6.02 Practice questions
What do you remember?
1 Determine whether these statements about data displays are true or false:
a The mean is calculated by adding all values together and dividing by the total number of values.
b The median is always exactly one of the values found in the original data set.
c An outlier has a much larger impact on the mean than it does on the median.
d The range is considered a measure of centre.
2 Identify the most appropriate measure of centre (mean, median, or mode) to use in each situation:
a A shoe store wants to know which size is sold most frequently to manage their stock.
b A researcher wants to determine the typical household income in a suburb where a few residents are multi-millionaires.
c A teacher wants to determine the average score for a class on a test where all students performed similarly.
d A car park attendant wants to describe the most common colour of car entering the car park.
3 Answer these questions about data sets and statistics with Yes or No:
a Can two different data sets have the exact same mean and range?
b Does the Interquartile Range (IQR) include the effect of extreme outliers?
c Is the mode the only measure of centre that can be used for non-numerical (categorical) data?
d If a data set has a range of 0, are all the values in the set identical?
Practice
4 The data show student scores:
65, 65, 70, 70, 70, 75, 75, 80, 95
Calculate the mean, median, and mode. Then, explain why the mean might be misleading in this case.
5 The heights of 10 sunflowers (in cm) are:
145, 148, 150, 152, 120, 155, 149, 150, 195, 151
Calculate the range and identify any outliers.
6
Two groups took a science test:
• Group X scores: 72, 75, 75, 78, 80, 82, 88
• Group Y scores: 70, 74, 78, 78, 78, 80, 82
Calculate the mean, median, range, and IQR for both groups, then write a comparison addressing centre, spread, and shape.
7 Two data sets have the same mean of 50 and range of 20. Can they have different distributions? Explain with an example.
8
Given the test scores: 82, 85, 85, 86, 87, 88, 88, 90
Calculate Q1 and Q3, then use these to determine the IQR. Show the process of splitting the data.
9 A small data set shows: 10, 12, 12, 13, 25
Explain why the median might be more appropriate than the mean for describing measures of centre.
10 Compare these two data sets:
• Data set A: 60, 70, 80, 90
• Data set B: 75, 75, 75, 75
Which measures of centre are most useful for comparison?
11 Daily rainfall (in mm) was recorded at two stations:
• Station 1: 5, 5, 6, 6, 15, 6, 5
• Station 2: 7, 7, 8, 8, 8, 7, 7
Which station had more consistent rainfall?
Extend your thinking
12 Three classes took the same test:
• Class X: 65, 70, 75, 75, 80, 85, 90
• Class Y: 70, 72, 75, 78, 78, 80, 82
• Class Z: 60, 75, 75, 75, 75, 75, 90
Which class performed most consistently? Justify the answer using appropriate statistics.
13 A set of five positive integers has a mean of 6, a median of 7, and a mode of 8. The range is 7. Determine the five numbers.
14 The data sets represent daily sales (in dollars) for two stores over two school weeks (10 days):
Which store shows more reliable sales patterns? Justify using appropriate statistics and discuss any limitations of this analysis.
6.03 Probability and frequencies
After this lesson, you will be able to…
• calculate expected frequencies from simple probabilities
• compare observed frequencies with expected frequencies from experiments
• comment on variability and fairness in everyday contexts
Calculate expected frequencies
When running an experiment, the number of times a certain outcome is expected to occur can be predicted. This prediction is called the expected frequency.
Expected frequency
The number of times an outcome is predicted to occur in a set number of trials. It is calculated based on theoretical probability.
Observed frequency
The actual number of times an outcome occurs when an experiment is conducted.
Relative frequency
The proportion of times an outcome occurs in an experiment. It is calculated by dividing the observed frequency by the total number of trials.
Random variation
The natural differences in outcomes that occur between repeated experiments or samples. It explains why observed frequencies are rarely exactly equal to expected frequencies.
Example: Flipping a coin 10 times and getting 6 heads instead of the expected 5.
The expected frequency is calculated by multiplying the probability of an outcome by the total number of trials:
Expected frequency
= p × n p is the theoretical probability of an outcome n is the total number of trials
Note: Expected frequencies do not have to be whole numbers. For example, if a coin is flipped 5 times, the expected frequency of heads is 0.5 × 5 = 2.5. Although an outcome of “half a head” is impossible in a single experiment, 2.5 represents the long-run average.
The relationship between theoretical probability and observed frequency:
• Theoretical probability predicts long-term behaviour.
• Observed frequencies may vary from expected due to random variation.
• Larger sample sizes tend to produce results closer to expected frequencies.
In real-world contexts, significant deviations between observed and expected frequencies may indicate:
• Unfair conditions or bias in a system
• Faulty equipment or procedures
• Natural random variation within acceptable limits
Interactive exploration
Discover this concept in action online
Example 1
A fair six-sided die is rolled 300 times. Calculate the expected frequency of rolling a six.
Create a strategy
Identify the theoretical probability of rolling a six, P(six), and multiply by the total number of trials, n
Apply the idea
The probability of rolling a six is , and the number of trials is 300.
Write the formula for expected frequency
Substitute and n = 300
Evaluate
Therefore, the expected frequency of rolling a six is 50.
Reflect and check
The answer is reasonable as approximately one-sixth of 300 rolls is expected to result in a six.
Example 2
A factory machine produces light bulbs where 2% are expected to be defective. If the machine produces 500 bulbs in a day, calculate the expected number of defective bulbs.
Create a strategy
Convert the percentage to a decimal probability and multiply by the total number of trials, n (the bulbs produced).
Apply the idea
The probability of a defective bulb is 2% P(defective) = 0.02, and the total number of trials is 500.
Expected frequency = p × n
= 0.02 × 500
= 10
Reflect and check
Write the formula for expected frequency
Substitute p = 0.02 and n = 500
Evaluate
The factory is expected to have 10 defective bulbs out of every 500 produced. Due to random variation, the actual number of defective bulbs may be slightly more or less than 10.
Idea summary
• Expected frequency ( E ) is the number of times an outcome is predicted to occur. It is calculated by:
Expected frequency = p × n
where p is the theoretical probability of an outcome and n is the total number of trials.
• Observed frequencies may differ from expected frequencies due to random variation
• Relative frequency is the experimental probability of an outcome, calculated as
Larger sample sizes produce results that are closer to the expected frequency in the long-run.
Significant deviations from expected frequencies may indicate bias, faulty equipment, or an incorrect theoretical probability.
Compare expected versus observed frequencies
When conducting probability experiments, there is often a difference between the expected frequencies (predicted counts) and the observed frequencies (actual counts). Understanding these variations is crucial for statistical analysis.
1. Expected frequency is calculated by multiplying the theoretical probability by the total number of trials.
2. Observed frequency is the actual count of outcomes from an experiment. The relative frequency (observed frequency divided by the number of trials) is used to compare actual results directly to the theoretical probability.
3. Variations between expected and observed frequencies can occur due to:
• Random variation
• Sample size limitations
• Experimental bias or procedural errors
• Equipment or measurement issues
4. When writing a comparison, the difference should be described and a reason suggested. For example: The observed frequency of 55 was higher than the expected frequency of 50. This difference is likely due to random variation, as the sample size was relatively small (100 trials).
Example 3
A spinner for a board game has 4 equal sections (red, blue, green, yellow). During a tournament, the spinner is spun 200 times. The observed frequency for red is 48. Calculate the percentage difference between the expected and observed frequencies.
Create a strategy
Calculate the expected frequency for red. Then, calculate the percentage difference by calculating the difference between observed and expected, dividing by the expected frequency, and converting to a percentage.
Apply the idea
Calculate the expected frequency. The probability of red is or 0.25.
Expected frequency(E) = p × n Write the formula for expected frequency
= 0.25 × 200
Substitute p = 0.25 and n = 200
= 50 Evaluate
Calculate the difference between observed (48) and expected (50) frequencies.
Difference(O E) = 48 50 Subtract the expected value from the observed value
= 2 Evaluate
Calculate the percentage difference.
Divide the difference by the expected value, then multiply by 100
Simplify
Evaluate
Reflect and check
The observed frequency is 4% lower than expected. Because the sample size is large (200 spins), a small percentage difference suggests the spinner is likely fair and the difference is due to random variation.
Example 4
A quality control inspector tests a sample of 50 computer chips. Based on historical data, 10% are expected to be defective. In this sample, 10 chips are found to be defective. Compare the observed results to the expectation.
Create a strategy
Calculate the expected frequency of defective chips and compare with the observed frequency to determine if the difference is likely due to random variation.
Apply the idea
Calculate the expected frequency.
Expected frequency (E) = p × n
= 0.10 × 50
= 5 defective chips
The expected frequency is 5 defective chips.
Write the formula for expected frequency
Substitute p = 0.10 and n = 50
Evaluate
Calculate the percentage difference between the expected and observed frequencies. The observed frequency is 10 defective chips.
Write the formula
Substitute the values
Simplify
Evaluate
Reflect and check
The observed frequency is 100% higher than expected (double the expectation). Even with a small sample size, such a large significant difference suggests there may be a problem with the manufacturing machine requiring further investigation. The relative frequency of defects was 20% , which is double the expected rate of 10%.
Idea summary
Comparing theoretical expectations with actual results reveals important statistical insights:
• Expected frequency (E) is calculated using the formula: Expected frequency = p × n
• Observed frequency (O) is the actual count recorded during an experiment.
• Relative frequency allows for direct comparison with probability.
• Percentage difference identifies the scale of the difference between O and E
• Differences often arise from random variation, small sample sizes, or experimental error.
6.03 Practice questions
What do you remember?
1 Mia is conducting an experiment where she flips a fair coin 100 times. Complete the sentences to describe her experiment:
a The number of times Mia flips the coin (100) is known as the total number of ⬚.
b Mia predicts that she will get heads 50 times. This predicted value is called the ⬚ frequency.
c After finishing, Mia counts that she actually got heads 47 times. This actual result is called the ⬚ frequency.
2 Identify whether these statements are true or false:
a The observed frequency will always be exactly equal to the expected frequency in a fair experiment.
b Random variation explains why small differences between observed and expected results occur by chance.
c As the number of trials increases, the observed frequency usually gets closer to the expected frequency.
3 For an experiment with a total of n = 100 trials, calculate the expected frequency (E ) for each probability ( p):
Practice
4 A fair coin is flipped 400 times. Calculate the expected frequency of heads.
5 A meteorologist forecasts a 20% chance of rain every day for the next 30 days. Calculate the expected frequency of rainy days over this period.
6 A spinner has 5 equal sections. If spun 150 times, what is the expected frequency for landing on any particular section?
7 In 240 rolls of a fair six-sided die, 50 sixes were observed. Calculate the expected frequency of rolling a six, and then calculate the percentage difference between the observed and expected frequencies.
8 A bag contains 30% red marbles. In 300 draws with replacement, 100 red marbles were drawn. Calculate the percentage difference between the observed and expected frequencies.
9 A spinner with four equal sections (red, green, blue, yellow) is spun 200 times. The results are shown in the table:
a Complete the given table.
b Based on the results, comment on whether the spinner seems fair. Justify the answer.
10 In a game of chance, players are expected to win 25% of the time. In 1000 plays, only 200 wins were recorded. Discuss whether this suggests the game might be unfair.
11 A restaurant claims their deliveries arrive within 30 minutes 80% of the time. In 150 deliveries, only 100 arrived within 30 minutes. Calculate the expected frequency and use it to justify whether this supports their claim.
12 A school cafeteria tracks the fruit choices of 200 students. They expect that 50% choose apples, 30% choose bananas, and 20% choose oranges. The column chart shows the observed results:
a Calculate the expected frequency for bananas and compare it to the observed frequency shown in the chart.
b Calculate the percentage difference for apples based on the data in the chart.
Extend your thinking
13
A casino game uses two dice. The house pays out when the sum is 7 or 11. In 3600 plays, there were 800 payouts. Determine if this suggests the game is fair, showing all calculations. (Hint: There are 36 possible outcomes when rolling two dice.)
14 In a quality control process, 5% of items are expected to be defective. Over three months, 500 items were checked each month with defect counts of 32, 28, and 35. Calculate the percentage difference for each month and discuss implications, including a comparison of the relative frequencies to the expected 5% rate.
15
A school’s grading system is designed to award A grades to the top 10% of students. In three classes of 40 students each, the A grades awarded were 6, 5, and 3. Analyse whether this distribution appears fair.
INVESTIGATION
Compare densities
Analyse population densities across two selected regions using real-world data and statistical tools to inform professional urban planning and infrastructure decisions.
Objectives
• To formulate a question for comparison of two populations based on a numerical variable
• To source, organise, and analyse real-world data using technology
• To communicate a comparative analysis using appropriate statistical language, graphs, and summary statistics
Materials
• A computer with internet access
• Spreadsheet software
Ask a question and collect data
Population density
Population density is a measure of population per unit of area. It is calculated using the formula:
Area is measured in square kilometres (km2). Therefore, the units for population density will be people/km2
The statistical investigation process
The statistical investigation follows these steps:
1. Pose a question: What are we trying to find out?
2. Collect data: How can we gather the necessary information?
3. Analyse data: What do the numbers and graphs tell us?
4. Interpret and communicate results: What is the answer to our question?
The task
Working in a small group, you will apply this process to compare the population densities of two different areas. Your first step is to decide what you want to compare and formulate a clear statistical question:
• “Is the median population density of inner-city suburbs different from outer suburbs?” (This would require collecting data for several suburbs in each category).
• “How does the population density of Melbourne compare to the population density of regional Victoria?”
• “Which capital city in Australia, Sydney or Brisbane, is more densely populated?”
“Classroom suburb” simulation
Step 1: Before looking at real-world data, model density in your classroom:
1. Mark out two different rectangular “suburbs” on the floor using masking tape (e.g., Suburb A is 3 m × 2 m; Suburb B is 4 m × 1 m).
2. Populate the suburbs by having different numbers of students stand inside the boundaries.
3. For each scenario, calculate:
4. Discuss: Which suburb felt more crowded? How did changing the area or the number of people affect the density?
Step 2: Formulate your question.
With your group, choose two areas to compare (e.g., two suburbs, a city vs. a state, two different countries) and write down a specific, comparative question about their population densities.
Step 3: Set up your data table.
Open a new spreadsheet. If you are comparing single areas (like two cities), create a table with columns: ‘Area name’, ‘Total population’, and ‘Land area (km2)’. If you are comparing groups of areas (like multiple inner vs. outer suburbs), add a column for ‘Category’.
Step 4: Source your data.
Find reliable online sources for your data. The Australian Bureau of Statistics (ABS) website is the best source for Australian population data. For international data, sources like the World Bank or national statistics agencies are reliable. Record the population and land area for each of your chosen locations in your spreadsheet. Aim to collect data for at least 10 15 areas if you are comparing groups.
Investigate
1. Which two regions or categories have you selected for your comparison?
2. Why is population density a more useful measure than total population when you are comparing areas of different sizes?
3. Before you begin your research, what difference in density do you expect to find between your two chosen areas?
4. How will you ensure that the population and land area data you collect are from the same time period (e.g., the same census year)?
5. What reliable online sources will you use to find your population and area figures?
Analyse and communicate findings
Calculate density
Create a new column in your spreadsheet titled ‘Population density (people/km2)’. In the first cell of this column, enter a formula to divide the Total population by the Land area for that row (e.g., = B2/C2). Apply this formula to the entire column to calculate the density for every area.
Summary statistics and graphs
Key tools for comparison:
For the ‘Population density’ column of each group, you will calculate key statistics and create a visual comparison.
• Summary statistics: Calculate the mean, median, range, interquartile range (IQR), and fivenumber summary (minimum, Q1, median, Q3, maximum). These describe the centre and spread of your data.
• Parallel boxplots: A boxplot is a powerful way to visualise the five-number summary. Placing two boxplots on the same scale allows for a direct visual comparison of the two distributions.
Investigate
Use your data, calculations, and graphs to answer these questions:
1. What was the specific statistical question your group investigated?
2. Looking at your table of summary statistics, which area has a higher typical population density (mean or median)?
3. How do your parallel boxplots visually demonstrate the differences between your two data sets?
4. Which of your two regions shows a greater spread in its data, and what does this suggest about the consistency of density in that area?
5. If your data contains any outliers, how did they affect your calculated mean compared to your median?
Discussion
1. What were some potential challenges in sourcing your data? For example, were population and area figures from the same year? How could inconsistencies in data sources impact your results?
2. Your analysis was based on a specific set of suburbs/areas. Why is it important not to generalise your findings too broadly? (e.g., claiming all inner-city suburbs in Australia are denser based on a sample from one city).
3. Population density is a critical measure for governments and city planners. Discuss one real-world decision that would be influenced by population density data (e.g., where to build a new school, hospital, or public transport line).
4. Based on the classroom simulation, what did you learn about the relationship between area, population, and population density?
Chapter review
1 The number of students participating in different school clubs is shown in the table:
a Construct a side-by-side bar chart to compare the participation data.
b Which club is most popular overall? Which club has the smallest difference in participation between boys and girls?
2 The heights (in cm) for two basketball teams are:
• Team A: 181, 184, 188, 190, 192, 195, 199
• Team B: 182, 183, 186, 190, 191, 194, 197
a Construct a back-to-back stem plot to compare the heights.
b Comment on the similarities and differences in the heights for the two teams. Refer to shape, centre, and spread.
3 The number of daily customers for two new cafés is:
• Café A: 45, 48, 50, 55, 58, 62, 85
• Café B: 42, 49, 51, 53, 56, 57, 60
a Construct a parallel boxplot for these data sets.
b Comment on the key differences between the two cafes’ customer numbers. Refer to the median and interquartile range.
c Identify any potential outliers. How does the outlier for Café A affect the shape of its distribution?
4 This side-by-side bar chart shows the number of movie tickets sold for four genres at two different cinemas:
a Which cinema sold more Action movie tickets? By how much?
b Comment on the overall sales pattern, noting which genre shows the greatest difference in sales between the cinemas.
5 This parallel boxplot shows the battery life (in hours) for two brands of smartphones:
Battery life (hours)
a Determine the median and interquartile range (IQR) for each brand.
b Write a sentence comparing the centre, spread, and the presence of outliers in the battery life for the two brands.
6 Data show the daily tips (in dollars) for a waiter: 40, 40, 50, 50, 50, 55, 55, 60, 110
Determine the mean, median, and mode. Explain why the mean might be misleading in this case.
7 The weights of 10 newborn puppies (in grams) are: 250, 255, 260, 262, 210, 265, 258, 260, 310, 259
Calculate the range and identify any potential outliers in the data set.
8 Two classes took a quiz out of 25:
• Class A scores: 12, 15, 15, 16, 18, 20, 22
• Class B scores: 11, 14, 17, 17, 17, 19, 21
Calculate the mean, median, range, and IQR for both groups, then describe the differences.
9 Daily temperatures (°C) were recorded in two cities:
• City A: 15, 16, 16, 17, 28, 17, 15
• City B: 19, 20, 20, 21, 21, 20, 19
Which city has more consistent temperatures? Justify your answer with reference to a measure of spread.
10 Data for commute times (in minutes) for employees in two different departments are:
a Determine the interquartile range (IQR) for each department.
b Compare the centre and spread of the two departments.
11 A fair eight-sided die is rolled 240 times. Determine the expected frequency of rolling a 5.
12
13
A factory estimates that 5% of its products will have a minor defect. If 1200 products are made in a day, what is the expected frequency of products with a minor defect?
A fair coin is tossed 300 times, and 165 heads were observed. Determine the expected frequency of heads. Then, calculate the percentage difference between the observed and expected frequencies.
14 A bag contains candies where 20% are blue. In 200 draws with replacement, 50 blue candies were drawn. Calculate the percentage difference from the expected frequency.
15
16
A web hosting service claims 95% server uptime. Over a period of 365 days, significant downtime was observed on 20 days. Calculate the expected frequency and compare it to the observed data to determine if the claim is supported.
A restaurant owner observes that 60% of customers order coffee. Over a week, 450 customers visit the restaurant:
a What is the expected number of customers who will order coffee?
b That week, 300 customers actually ordered coffee. Does this suggest the owner’s observation is reliable? Justify your answer by calculating the percentage difference.
17 A data set of house prices (in thousands of dollars) is: 450, 475, 480, 480, 510, 520, 530, 950:
a Calculate the mean and median house price.
b Which measure of centre is more appropriate for describing the typical house price? Explain why.
18 The scores for two archers are recorded:
• Archer A: 7, 8, 8, 9, 9, 9, 10
• Archer B: 5, 7, 8, 9, 9, 10, 10
Which archer is more consistent? Justify your answer using both range and IQR.
19
Two brands of batteries are tested for longevity. The results (in hours) are displayed in the parallel boxplots:
Write a statement comparing the two brands, making reference to shape, centre (median), and spread (range).
20 The graph shows the proportion of the maximum daily recommended salt intake for several food items. A person consumes one ham sandwich and one serving of chicken two-minute noodles:
Beef ravioli
Bacon & egg roll
Meat pie & sauce
Chicken noodles
Ham sandwich
S&V chips
Vegemite toast
By what percentage does this person’s salt intake for these two items exceed 75% of the recommended daily maximum?
Did you know?
When comparing two athletes, their average scores might be exactly the same, but one might be much more reliable than the other. This is where “spread” comes in, showing us how much the data varies from that central average point. A consistent player has a small spread, meaning you can almost always predict how well they will perform in the next game.
In contrast, a “high-variance” athlete might have incredible peak performances but also some very low scores, making their overall spread much wider. By comparing these spreads, a coach can decide whether they want a “safe bet” player or a “high-risk, high-reward” star for the grand final.
“There is no branch of mathematics, however abstract, which may not some day be applied to phenomena of the real world.”
Nikolai Lobachevsky
• Consumer decisions are influenced by a complex interplay of personal needs, marketing strategies, and macro-economic indicators; an informed choice requires the mathematical analysis of total costs and the critical evaluation of financial risks and life-stage requirements.
• Managing debt effectively involves understanding the distinct cost structures of various credit products and using mathematical modelling, such as simple interest formulas and spreadsheets, to predict the long-term financial consequences of borrowing.
A “cheap” item is not cheap if you replace it twice. Comparing cost per use can change purchasing decisions –especially for clothes, technology, and sports gear.
7.01 Informed spending
After this lesson, you will be able to…
• compare products/services (plans, insurance) against criteria (cost, features, limits)
Choosing what to buy or which service to sign up for is a common task. Making a smart choice is not just about finding the lowest price; it involves comparing features, understanding contracts, and spotting potential risks.
An informed choice is a decision made after understanding all the important details. This means:
• Understanding all relevant information
• Comparing available options
• Considering costs, benefits, and risks
• Thinking about personal needs and budget
An informed consumer does not choose the cheapest option automatically, but the option that provides the best value.
Fixed charges
Regular payments that remain constant regardless of usage.
Example: A flat monthly subscription fee of $15 for a streaming service
Variable charges
Costs that go up or down depending on the use of a product or service.
Example: Paying extra fees for exceeding a data limit on a phone plan
Upfront costs
The amount of money to be paid immediately at the start, before a product or service can be used. It is a one-off payment, not spread over time.
Example: Buying a phone or a joining fee for the gym
Terms and conditions
The official rules, limits, and legal details agreed to when a product or service is purchased or used. It is often called “the fine print”.
Example: A phone plan agreement stating that the price will increase after 12 months
When evaluating products and services, several key factors require careful consideration:
• Initial costs and ongoing fees
• Features and limitations of the service
• Age-specific considerations and restrictions
• Hidden charges and potential risks
Marketing influences can significantly impact decision-making. Advertising techniques often include:
• Time-limited offers creating artificial urgency
• Promotional rates that increase after an initial period
• Complex terms disguising additional costs
Risk factors to consider include:
• Age restrictions and legal requirements
• Potential for gambling-related products masked as services
• Scam indicators such as unrealistic promises
• Contract lock-in periods and cancellation fees
Exploration
Consider two different advertisements for a new gaming subscription service. Use the table to compare the offers.
Feature
Monthly cost
Offer A: Basic Offer B: Pro
$5 per month
$12 per month
Contract length 24-month lock-in contract No contract (cancel anytime)
1. Offer A looks cheaper per month. However, what is the risk associated with the contract length?
2. Offer B is more expensive monthly. Why might a student choose this option despite the higher cost?
3. If a subscriber signs up for Offer A but chooses to quit after 2 months, how much must be paid in total?
When comparing products, a lower monthly price often comes with stricter limits or hidden fees. Always read the terms regarding cancellations and contracts.
Example 1
A family of four wants to subscribe to a music streaming service. They need to listen on multiple devices at the same time. Compare the two options from the table:
Feature Plan A Plan B
Monthly cost
$10
$16
Number of devices 1 device at a time Up to 6 devices at a time
Ads Yes, between songs No ads
Which plan is the best choice for their needs, and what is the total annual cost?
Create a strategy
Check the “Number of devices” feature to see which plan fits a family of four. Then, calculate the total annual cost for that plan.
Apply the idea
Compare features. Plan A only allows 1 device at a time, which does not meet the family’s need to listen on multiple devices simultaneously. Plan B allows up to 6 devices. Therefore, Plan B is the correct choice based on their needs.
Calculate annual cost for Plan B:
$16 × 12 months = $192
Example 2
Reflect and check
Even though Plan A is cheaper ($120 per year), it does not meet the family’s requirement for multiple devices. The cheapest option is not always the right product. An informed choice considers all features, not just cost.
Plan 1 has a monthly fee of $65 with 20 GB data. Plan 2 offers 30 GB for $75 monthly. Calculate the cost per GB for each plan.
Create a strategy
Divide the monthly cost by the data allowance to calculate the cost per GB for each plan.
Apply the idea Plan 1: Plan 2:
Therefore, Plan 1 costs $3.25 per GB and Plan 2 costs $2.50 per GB.
Reflect and check
The second plan offers better value because the unit price ($2.50 per GB) is lower than the first plan ($3.25 per GB). In this case, better value refers to the lower cost per unit of data, even though the total monthly cost of the second plan is higher.
Example 3
An insurance policy has an annual premium of $1200 or monthly payments of $110. Calculate the difference in total cost over one year.
Create a strategy
Calculate the total annual cost for monthly payments and compare with the annual premium.
Apply the idea
Monthly payment total:
Difference in annual cost:
$110 × 12 = $1320
$1320 $1200 = $120
Therefore, the monthly payment option costs $120 more per year than the annual premium.
Reflect and check
The annual premium saves $120 compared to monthly payments.
Idea summary
When comparing products and services:
• Calculate and compare all costs including upfront costs, fixed charges, and variable charges
• Consider age restrictions and legal requirements.
• Evaluate the influence of advertising on decision-making.
• Identify potential risks including scams and gambling-related products.
• Review all terms and conditions before commitment.
Considering all of the above helps in making an informed choice — one based on a full understanding of costs, risks, and conditions.
Spending influences
Decisions on how to spend money are influenced by a mix of financial, marketing, social, and risk factors. Understanding these is key to making smart choices. Some important financial and marketing terms include:
Cost price
The base amount paid for goods or services.
Goods and services tax (GST)
A 10% tax added to the selling price of most goods and services in Australia.
Mark-up
A percentage increase added to the cost price to determine the selling price.
Discount
A percentage reduction from the original selling price.
Key factors that influence spending choices include:
• Income: How much money a person earns affects how much they can spend. For example, a student with a part-time job earning $250 a week will spend differently to someone earning $1000 a week.
• Needs versus wants: People spend money on essentials (needs) first, then non-essential items (wants). Needs include rent, food, and transport, while wants include eating out, new clothes, and subscriptions. For example, someone may cancel a streaming service to pay electricity bills.
• Price and affordability: The price of an item strongly affects whether someone buys it. For example, a $3 coffee is affordable daily, but a $300 jacket may require saving.
• Personal values and lifestyle: People spend based on what they value most. For example, someone who values fitness may spend more on a gym membership than entertainment.
• Financial commitments: Regular payments reduce how much money is available to spend. For example, a phone plan and transport costs limit how much money is left for leisure.
• Social pressures: Peer influence, age-related spending patterns, and brand preferences can affect purchasing decisions.
• Awareness of risks: It is important to be aware of potential scams, hidden costs in contracts, and other fraudulent offers.
Example 4
A retailer purchases phones at a cost price of $400 each. They apply a 45% mark-up and then advertise a 20% discount. Calculate the final sale price.
Create a strategy
Calculate the marked-up price first, then apply the discount to determine the final price.
Apply the idea
Calculate the mark-up amount by multiplying the cost price by the mark-up rate: 45% of $400 = $400 × 0.45 = $180
Add mark-up amount to the cost price to calculate the marked-up price:
$400 + $180 = $580
Calculate the discount amount by multiplying the marked-up price by the discount rate: 20% of $580 = $580 × 0.20 = $116
Subtract the discount amount from the marked price to calculate the final price:
$580 $116 = $464
Therefore, the final sale price of the phone is $464.
Reflect and check
The final price of $464 is reasonable as it is higher than the cost price ($400), meaning the retailer still makes a profit of $64 per phone, even after the discount is applied. This shows that a discount does not always mean the seller is losing money.
Example 5
A video game offers two ways to unlock a character item:
• Buy the item directly for $20.
• Buy a “Mystery Box” for $5. The box has a 1 in 10 (10%) chance of containing the item.
Explain the financial risk of choosing the Mystery Box over the direct purchase.
Create a strategy
Calculate the expected cost to obtain the item and compare this to the direct price. Discuss the nature of gambling.
Apply the idea
With a 10% chance, statistically 10 boxes must be purchased to obtain the item.
10 boxes × $5 = $50
While the box looks cheaper ($5 versus $20), the risk is that $50 (or more) might be spent without obtaining the item.
Reflect and check
This is an example of a randomised purchase. Choosing a direct purchase is the informed financial choice because the total cost is known and fixed.
Example 6
A tradesperson provides a quote of $275 for a repair job, stating that this price is “GST inclusive”.
Calculate the original price of the labour before tax, and the specific amount calculated as GST.
Create a strategy
Use the GST formula to work backwards. Dividing the total by 1.1 removes the tax to calculate the original base price.
Apply the idea
Calculate the original price before GST:
Calculate the GST amount:
Check:
Reflect and check
10% of $250 = $25
Mathematically, the GST is 10% of the original price.
Consumer awareness: It is important to check if a price includes GST. A competitor might quote “$250 + GST”, which looks cheaper at first glance but costs exactly the same amount ($275).
Always compare the final price to avoid hidden costs.
Example 7
Consider this text message: “CONGRATS! You won a $500 gift card. Click this link and pay $4.99 shipping to claim it now! Offer expires in 10 minutes.”
Identify two indicators that suggest this is a scam.
Create a strategy
Look for risk factors listed in the idea theory, such as unrealistic promises, requests for money, or pressure tactics.
Apply the idea
Indicator 1: The request for money. Legitimate prizes usually do not require a person to pay shipping fees to receive them.
Indicator 2: Artificial urgency. The message claims the offer “expires in 10 minutes” to pressure the recipient into acting without thinking.
Reflect and check
This is a common phishing scam designed to steal credit card information.
Idea summary
• The cost price is the base amount paid for goods or services.
• The cost price of a product or service may have additional charges applied, such as Goods and services tax (GST)
• Sellers apply mark-ups to set the selling price, and offer discounts to reduce it.
• Social factors such as peer influence, personal values, and income all affect spending decisions.
• Consumer awareness helps identify and avoid potential financial risks.
• Considering all costs, risks, and conditions before purchasing helps in making an informed choice.
7.01 Practice questions
What do you remember?
1 Classify each cost as either a fixed charge or a variable charge:
a Monthly subscription fee for a music streaming service ($12/month)
b Charges on a mobile phone bill for exceeding the data limit
c Annual car registration fee
d Electricity bill based on the number of kilowatts used
2 Which of these is NOT typically considered a factor that influences spending decisions?
A Personal income and budget B The colour of the currency notes
C Social pressure and peer influence D Marketing and advertising techniques
3 Classify these expenses as either a need (essential) or a want (non-essential):
a Rent or mortgage payments
b Latest designer sneakers
c Basic groceries
d Music streaming subscription
Practice
4 A photographer needs to back up 2000 GB of photos to the cloud. Consider these two storage plans:
a Identify which plan provides enough storage for the photographer’s needs.
b Calculate the total cost of this plan for one full year.
c Explain why the cheaper plan is not a suitable option.
5 A streaming service offers three subscription tiers:
Three students share a house and want to watch different shows simultaneously:
a Identify which plan is the most suitable for their needs.
b Calculate the total annual cost of this plan.
c If they split the annual cost equally, how much does each student pay per year?
6 Compare the value of two internet plans:
• Plan A: $89 monthly for 100 GB
• Plan B: $120 monthly for 150 GB
a Calculate the cost per GB for Plan A.
b Calculate the cost per GB for Plan B.
c Determine which plan offers better value for money.
7 A gym membership offers two payment options: an upfront annual fee of $780 or a monthly fee of $75:
a Calculate the total cost for one year if paying monthly.
b Calculate the amount saved by choosing the upfront annual payment.
8 The table shows comprehensive car insurance quotes for the same vehicle for two different drivers:
A 19 $2450 B 42 $890
a Calculate the difference in price between the two premiums.
b Explain how age influences the cost of car insurance in this example.
9 Compare two options for getting a new phone:
• Option A: A contract with a “Free phone” costing $65 monthly for 24 months.
• Option B: Buy the phone outright for $900 and pay $30 per month for a SIM-only plan.
a Calculate the total cost of Option A (contract) over 24 months.
b Calculate the total cost of Option B (outright + SIM) over 24 months.
c Determine how much is saved by choosing the cheaper option.
10 A student is comparing the total cost of two mobile phone plans over time:
• Plan A: $40 per month, no setup fee.
• Plan B: $30 per month, plus a $50 one-off setup fee.
a Complete this table to show the total cost for each plan.
b After how many months does Plan B become cheaper than Plan A?
11 A retailer buys products at $50 each:
a Calculate the selling price after applying a 60% mark-up.
b During a sale, a 25% discount is applied to the marked-up price. Calculate the final selling price.
c Calculate the profit made on the final sale.
12 A trading card collector wants a specific ultra rare card. They have two options to obtain it:
• Option A: Buy the card directly from a shop for $80.
• Option B: Buy booster packs for $5 each. The specific card appears in 1 out of every 20 packs on average.
a Calculate the expected total cost of buying enough packs to find the card, based on the average probability.
b Which option is the financially safer choice? Explain why one of the options might end up costing much more than the amount calculated in part (a).
13
A service is advertised at a price of $440, which includes GST:
a Calculate the original price before GST was added.
b Calculate the GST amount included in the price.
14
Consider an email received with the subject line “URGENT: Account Suspended”. The email reads: “Dear Customer, we noticed an error in your billing information. Click the link below within 24 hours to update your credit card details or your account will be permanently closed.”
Identify three specific indicators in the text that suggest this email is a scam and explain why each is suspicious.
15 Identify the warning signs in this online marketplace advertisement: “Brand new gaming console for sale! Only $150 (usually $750). Unwanted gift. Must sell tonight! Payment via cryptocurrency or gift cards only. I will ship it once you send the code.”
List two reasons why this is likely a scam.
Extend your thinking
16 A retailer advertises “Buy 2 Get 1 Free” on items normally priced at $40 each. They previously had a straight 30% discount:
a Calculate the cost of buying 3 items under the “Buy 2 Get 1 Free” offer.
b Calculate the cost of buying 3 items with the 30% discount.
c Calculate the effective percentage discount of the “Buy 2 Get 1 Free” offer and determine which offer is better.
17 A common retail trick involves raising prices before a “sale” to make the discount look bigger.
An item originally costs $100:
a The store increases the price by 20%. What is the new price?
b A week later, the store offers a 20% discount on the new price. What is the final sale price?
c Did the price return to the original $100? Explain mathematically why increasing by x% and then decreasing by x% results in a lower price.
18 Ben wants to buy a laptop worth $2000. He has two payment options:
• Option A (Savings): Save $200 a month for 10 months. While saving, he earns 2% interest (compounded monthly) on his bank balance.
• Option B (Credit): Buy it immediately using a credit card with an annual interest rate of 18% and pay it off over 10 months.
Without doing complex compound interest calculations, describe the financial benefit of Option A and the cost of Option B.
19
A mobile game advertises: “Get 1000 coins for $4.99, 2200 coins for $9.99, or 5000 coins for $19.99. Plus 20% bonus coins on your first purchase!”:
a Calculate the cost per coin for the $19.99 pack (including the bonus).
b Explain why mobile games use virtual currencies instead of real money prices for items.
c Discuss one potential gambling risk associated with these types of in-game purchases.
7.02 Manage credit and loans
After this lesson, you will be able to…
• identify credit options (credit cards, personal loans)
Credit is money that is borrowed and must be paid back later, usually with interest. Common examples include:
• Credit cards
• Personal loans
Credit cards
• Buy Now Pay Later (BNPL)
• Store cards
• Phone and internet plans
Allows a person to borrow money as needed up to a set limit. The balance can be paid back over time, and as it is paid off, that money can be borrowed again.
Personal loans
A one-off loan for a specific amount of money, which is repaid in regular instalments over a set period.
HECS-HELP
A government loan for higher education fees, which is repaid through the tax system once a person starts earning above a certain amount.
Why people use credit:
• To afford expensive items
• To spread payments over time
Risks of credit and loans:
• For emergencies
• Paying more than the original price due to interest
• Debt building up quickly
• High interest rates
• Late payment fees
• Stress and financial pressure
1. Managing credit cards:
• Credit cards are best for short-term purchases and often come with an interest-free period (e.g., 55 days).
• If the full amount owing is paid by the due date, no interest is charged. However, if the balance is not paid in full, the interest rates are typically high (e.g., 15% – 20% p.a.).
2. Structuring personal loans:
• Personal loans are predictable. A borrower receives a lump sum of money and makes regular, fixed repayments over a set term (e.g., 1 to 7 years).
• This structure makes it easier to budget compared to a credit card. Interest rates are generally lower, though the specific rate depends on a person’s financial history (or credit score).
3. Repaying HECS-HELP:
• Unlike commercial loans, HECS-HELP does not charge interest. Instead, the total amount owed is adjusted each year for inflation, called indexation, so it keeps up with the cost of living.
• Compulsory repayments only begin once a person’s income goes above a certain amount (the repayment threshold). However, voluntary repayments can be made at any time, regardless of income level.
Sarah wants to purchase a laptop for $2000. She is deciding between using a credit card with an interest-free period of 55 days (interest rate 20% p.a. thereafter) or a personal loan with a fixed interest rate of 12% p.a. over 1 year. Identify one advantage and one disadvantage of using the credit card for this purchase.
Create a strategy
Consider the features of a credit card, specifically how the interest-free period works and the cost of interest if the balance is not paid on time.
Apply the idea
Advantage: If Sarah can pay off the full $2000 within the 55-day interest-free period, she will pay $0 in interest. This makes the credit card the cheapest option.
Disadvantage: If she cannot pay the full amount within 55 days, the credit card has a significantly higher interest rate (20%) compared to the personal loan (12%), which will result in higher costs over time.
Example 1
Reflect and check
Credit cards offer flexibility and short-term savings, but they carry higher financial risk due to high interest rates if the debt is not settled quickly.
Idea summary
• Credit cards provide flexible borrowing with interest-free periods but higher interest rates.
• Personal loans offer fixed terms and structured repayments with simple interest calculations.
• HECS-HELP provides income-contingent education loans with inflation indexing.
Repayment obligations vary by credit type and individual circumstances.
Service financial commitments
Managing financial commitments, like loans or HECS-HELP debt, means keeping up with repayments. Understanding how these repayments work is a key part of financial planning.
Income-based repayments include:
• HECS-HELP debt repayments based on income thresholds
• Regular fixed repayments from salary or wages
Key factors affecting repayment calculations:
• Principal — the original amount of money borrowed, before any interest is added
• Interest rate (as a percentage)
• Repayment frequency (weekly, fortnightly, monthly)
• Income thresholds and repayment rates
Exploration
Consider a scenario where an amount of $1000 is borrowed using a personal loan at a simple interest rate of 10% per annum (year). Explore how the total cost of this debt grows over time if no repayments are made to the principal.
Calculate the interest charged and the total value of the debt (Principal + Interest) at the end of each of the first 3 years.
1. How much interest is charged each year? Does this amount change from year to year?
2. Describe the pattern of the total value of the debt over the three years. Is the growth linear?
3. How can the interest charged in year 1 be used to calculate the total interest charged over 3 years without calculating the interest for each year individually?
Simple interest
A fixed percentage calculated on the original amount of a loan (the principal) for the entire time period. It is not charged on any interest that has already been added.
Servicing a personal loan often requires calculating the interest payable. For loans with simple interest, the total interest (I ) is calculated using the formula:
I = P × r × t
I is the total interest
P is the principal amount
r is the annual interest rate expressed as a decimal
t is the time in years
For repayments like HECS-HELP, the percentage paid back depends on how much is earned. The higher the income, the higher the repayment rate. The formula for annual repayments is:
Annual repayment = Income × Repayment rate
Example 2
A personal loan of $8000 has a simple interest rate of 12.5% p.a. Calculate the total amount to be repaid after 2 years.
Create a strategy
Calculate the interest using the simple interest formula, then add this to the principal amount.
Apply the idea
Convert the interest rate to a decimal.
Calculate the interest.
I = P × r × t
= 8000 × 0.125 × 2
= $2000
Calculate the total repayment amount.
Total = P + I
= 8000 + 2000
= $10 000
12.5% = 0.125
Write the formula
Substitute the values
Evaluate
Write the equation
Substitute the values
Evaluate
Therefore, the total amount to be repaid after 2 years is $10 000.
Reflect and check
The interest amount ($2000) represents 25% of the principal, which is reasonable for a 12.5% rate over 2 years.
Example 3
An individual earns $75 000 annually. If the HECS-HELP repayment rate is 4% of income, calculate the annual repayment amount.
Create a strategy
Calculate the required repayment by applying the percentage rate to the annual income.
Apply the idea
Convert the repayment rate to a decimal.
Calculate the annual repayment.
Repayment = Income × Rate
= 75 000 × 0.04
= $3000
4% = 0.04
Write the formula
Substitute the values
Evaluate
Therefore, the annual HECS-HELP repayment is $3000.
Reflect and check
The annual repayment of $3000 represents 4% of the income. In practical terms, this equates to approximately $115 per fortnight (3000 ÷ 26), which is usually deducted automatically from a person’s pay.
Idea summary
• Financial commitments require regular repayments based on income levels and loan terms.
• Interest calculations depend on principal amount, rate, and time period.
• Simple interest is calculated using I = P × r × t.
• HECS-HELP repayments are calculated as a percentage of taxable income using the formula: Annual repayment = Income × Repayment rate
• Regular monitoring of income thresholds and repayment obligations is essential.
7.02 Practice questions
What do you remember?
1 Determine whether these statements about simple interest are true or false:
a Simple interest is calculated on the principal amount plus any accumulated interest.
b In the formula I = P × r × t, the time (t) must always be expressed in years.
c The principal (P) refers to the total amount to be repaid, including interest.
2 Match each feature to the correct credit option:
a Credit card i Repayments depend on earning above a certain income level
b Personal loan ii Provides a lump sum of cash with fixed regular repayments
c HECS-HELP iii Often offers an interest-free period (e.g., 55 days) on purchases iv The debt increases with inflation rather than a standard interest rate
3 What happens if a credit card balance is not paid in full by the due date?
A The interest-free period is extended for another month.
B Interest is charged only on the new purchases made in the next month.
C Interest is charged on the unpaid balance, often at a high rate (e.g., 20%).
D The credit card is immediately cancelled.
Practice
4 Liam wants to buy a television for $1800. He is comparing two payment options:
• Option A: A credit card with a 55-day interest-free period, then 21% p.a. interest.
• Option B: A personal loan with a fixed simple interest rate of 11% p.a. for 1 year.
a Determine one financial advantage of choosing Option A.
b Determine one financial disadvantage of choosing Option A if Liam cannot pay within 55 days.
5 Mia wants to buy a designer jacket that costs $180. She is choosing between paying the full amount upfront or using a Buy Now Pay Later (BNPL) service. The BNPL service requires 4 fortnightly payments of $50:
a Calculate the total cost of the jacket if Mia uses the BNPL service and makes all payments on time.
b How much more does the jacket cost using BNPL compared to paying the upfront price?
c The BNPL service charges a $15 late fee for any missed payments. If Mia misses one payment, calculate the total amount she will have paid for the jacket by the end of the term.
d Based on your answers, suggest one reason why someone might choose BNPL despite it being more expensive than the upfront price.
6
A personal loan of $12 000 has a simple interest rate of 8.5% p.a. over 3 years:
a Calculate the total interest charged over the 3 years.
b Calculate the total amount to be repaid (Principal + Interest).
c Calculate the monthly repayment amount required to pay off the loan in this time.
7
An individual earns $82 000 annually. Based on their income bracket, the HECS-HELP repayment rate is 4.5%:
a Calculate their total annual HECS-HELP repayment.
b How much will be deducted from their pay each fortnight? (Assume 26 fortnights in a year).
8 A credit card has a balance of $5000 with an annual interest rate of 18%:
a Determine the monthly interest rate as a percentage.
b Calculate the interest charge for one month using this monthly rate.
9 A small business borrows $5000 to upgrade equipment. The loan has a simple interest rate of 6% per annum:
a Calculate the annual interest charge.
b Complete the table to show the Total amount owed (Principal + Accumulated interest) at the end of each year:
10
Using the simple interest formula I = P × r × t:
a Determine the time (t) in years if I = $450, P = $3000, and r = 5% p.a.
b Determine the annual interest rate (r) if I = $1200, P = $8000, and t = 3 years. Express the answer as a percentage.
11 After 5 years of paying simple interest on a loan with a rate of 8% p.a., the total interest paid was $2400. Calculate the initial principal amount borrowed.
12 Jack is buying a used car for $8000. He has two finance options that both charge simple interest:
• Option A: 12% p.a. for 2 years
• Option B: 9% p.a. for 3 years
a Calculate the total cost of Option A.
b Calculate the total cost of Option B.
c Which option is cheaper and by how much?
13 An individual’s income increases from $70 000 to $85 000:
• At $70 000, the HECS-HELP rate is 3.5%.
• At $85 000, the HECS-HELP rate is 4%.
Calculate the annual increase in the HECS-HELP repayment amount.
14 A salary of $95 000 has two mandatory deductions:
• HECS-HELP: 5% of annual income
• Personal Loan: $450 per month
Calculate:
a The annual HECS-HELP repayment amount
b The total annual cost of the personal loan repayments
c The remaining monthly income after these deductions are made
Extend your thinking
15 A graduate has a HECS-HELP debt of $45 000 and starts a job with a salary of $65 000:
• The salary increases by 5% each year.
• The repayment rate is 3% for income between $60 000 – $70 000.
• The repayment rate is 3.5% for income between $70 000 – $80 000.
Calculate the total repayments made over the first three years. Round your answer to the nearest cent.
16 An individual has three debts:
• HECS-HELP: $30 000
• Personal loan: $15 000 at 12.5% p.a.
• Credit card: $8000 at 18% p.a.
The individual has $2000 available each month to pay off these debts. Suggest the best strategy to minimise interest and pay off the debts quickly.
17 The graph shown represents the growth of a debt over time calculated using simple interest:
interest) $3000
a What is the principal amount borrowed?
b Calculate the total interest charged over the 4 years.
c Determine the annual interest rate (r), expressed as a percentage.
• describe the effect of life-stage factors on income and spending
Interpret economic indicators
Economic indicators are key statistics used to measure and monitor the performance of a country’s economy. They act like a health check — showing whether the economy is growing, stable, or struggling. They help governments, businesses, and individuals make financial decisions.
Here are some key economic indicators:
1. Employment and unemployment rates
The unemployment rate shows the percentage of people who are looking for work but cannot find a job. High unemployment means fewer people are earning income, while low unemployment means more people are earning income.
Impact on consumers: Job security affects spending and saving.
2. Inflation
Inflation is the increase in prices over time. When inflation rises, money buys less, and everyday items become more expensive.
For example, a loaf of bread that cost $3.00 last year might cost $3.09 this year — a 3% increase. That is inflation in action.
3. Interest rates
Interest rates affect the cost of borrowing and the return on savings. Higher interest rates mean loans cost more, while lower interest rates mean borrowing is cheaper.
Impact on consumers: Affects home loans, personal loans, and savings accounts.
4. Cost of living
The cost of living refers to how much money is needed to pay for basic needs. This includes:
• Housing
• Food
• Transport
• Utilities
Consumer price index (CPI)
The main way inflation is measured. It tracks the price changes of a typical ‘shopping basket’ of common household goods and services, like food, fuel, and rent.
Interest rates
The cost of borrowing money, or the money one earns for saving. It is expressed as a percentage of the original loan amount or savings deposit.
Wages
A fixed regular payment, typically paid on a daily or weekly basis, made by an employer to an employee.
1. The Consumer Price Index (CPI) is a primary indicator of inflation. It is used to:
• Track inflation rates
• Adjust wages and government payments
• Compare purchasing power over time
2. Interest rates determine the cost of credit in an economy and affect:
• Mortgage repayments
• Savings account returns
3. Wage indicators include:
• Minimum wage rates
• Average weekly earnings
Example 1
• Business investment decisions
• Wage price index
The consumer price index (CPI) increases from 116.5 to 120.0 over a year:
a Calculate the annual inflation rate, rounded to one decimal place.
Create a strategy
To calculate the percentage increase, first determine the change in the CPI value. Then, express that change as a percentage of the original CPI value.
Apply the idea
Therefore, the annual inflation rate is approximately 3.0%.
Reflect and check
An annual inflation rate of 3.0% means that on average, the things consumers buy are 3% more expensive than they were a year ago.
b Interpret this result: If the Reserve Bank’s target inflation range is 2%–3%, what does this indicator suggest about future interest rate changes?
Apply the idea
Because inflation is at the very top of the target range (3.0%), the economy is “heating up.” To prevent prices from rising even faster, the Reserve Bank is likely to increase interest rates, making borrowing more expensive and encouraging people to spend less and save more.
Example 2
Liam works as a retail manager. Last year, his salary was $60 000. This year, his salary increased to $61 800.
During the same period, the national inflation rate (CPI increase) was reported as 5.2%:
a Calculate the percentage increase in Liam’s salary.
Create a strategy
First, calculate the dollar amount of the increase. Then, divide this increase by the original (last year’s) salary and multiply by 100 to determine the percentage.
Apply the idea
Difference in pay
Evaluate
Divide by original amount
Evaluate
Therefore, Liam’s salary increased by 3.0%.
b Explain whether Liam’s “real” purchasing power has increased or decreased compared to last year.
Create a strategy
Compare the salary percentage increase calculated in part (a) with the inflation rate provided.
Apply the idea
Comparison:
• Salary increase: 3.0%
• Cost of living (Inflation) increase: 5.2%
Conclusion:
Liam’s purchasing power has decreased. Even though he receives more dollars, the cost of goods and services rose faster than his pay (5.2% > 3.0%). Consequently, his new salary buys fewer goods than his old salary did a year ago.
Reflect and check
This situation is often referred to as a “real wage cut.” To maintain his previous standard of living, the salary needed to increase by at least 5.2% (to $63 120).
Idea summary
Economic indicators help measure economic performance and guide financial decisions.
• The Consumer price index (CPI) tracks changes in consumer prices and measures inflation.
• Interest rates determine the cost of borrowing and the return on savings.
• Wages and other income sources vary across different career stages.
Life-stage financial factors
Financial needs and spending patterns vary significantly across different life stages. Understanding these variations is crucial for effective financial planning.
A life stage refers to a period of a person’s life where they have similar responsibilities, income levels, and financial needs. As people move through life stages, their spending, saving, and borrowing habits change.
Life stages:
• Student or teenager
• Income: Pocket money, part-time or casual work
• Financial factors: Limited income, low financial responsibilities (like rent or bills), mostly spending on wants
• Common expenses: Transport, entertainment, phone plans
• Young adult
• Income: Full-time or part-time work
• Financial factors: Increasing independence, beginning to budget, possible use of credit
• Common expenses: Rent, food, utilities, transport
• Working adult or family stage
• Income: Full-time employment; household may have one or two incomes depending on family circumstances
• Financial factors: High financial responsibilities (like a mortgage, car loan, or childcare), long-term planning, saving for future goals
• Common expenses: Mortgage or rent, childcare, insurance
• Older adult or retirement
• Income: Superannuation (a retirement savings fund built up through work), pension, savings
• Common expenses: Healthcare, living costs, utilities
Income
Money received, especially on a regular basis, for work or through investments.
Budget
A plan for managing income and expenses over a set period of time, used to track spending and reach financial goals.
Fixed expenses
Expenses that cost the same amount each month, such as rent, mortgage payments, or insurance premiums.
Variable expenses
Expenses that change in amount from month to month, such as groceries, entertainment, or fuel.
Superannuation
A retirement savings fund that employers contribute to on behalf of employees throughout their working life, accessed after reaching retirement age.
Each life stage requires different approaches to financial planning. A budget is essential for balancing fixed expenses and variable expenses, while adapting to changing income levels and financial obligations.
Example 3
The Reserve Bank announces an increase in the official cash rate (the interest rate set by the Reserve Bank that influences all other interest rates in the economy), causing bank interest rates to rise by 1.5%.
Consider two individuals with different financial situations:
• Sofia (working adult or family stage) has a home loan (mortgage) of $500 000.
(Assume this is a variable-rate mortgage and the full $500 000 is still outstanding.)
• Mr. Chen (retirement stage) has $100 000 in a savings account.
Calculate the annual financial impact of this rate rise for both individuals and describe how their life stage determines their financial “vulnerability” to this change.
Create a strategy
Calculate the extra interest amount for both people using Amount × 1.5%. Determine whether this is an extra cost (negative impact) or extra income (positive impact).
Apply the idea
• Impact on Sofia (working adult or family stage):
Interest rates on loans have increased, so her repayments will go up.
Extra cost = $500 000 × 0.015
Write the equation = $7500 per year
Evaluate
Sofia (family stage) loses $7500 per year. She is highly vulnerable because her life stage involves high debt (mortgage) and fixed family costs.
• Impact on Mr. Chen (retirement stage):
Interest rates on savings have increased, so the bank pays him more.
Extra income = $100 000 × 0.015
Write the equation = $1500 per year
Evaluate
Mr. Chen (retirement stage) gains $1500 per year. He is less vulnerable because he has moved past the borrowing phase and now relies on interest as a primary income source.
Reflect and check
Rising interest rates act as a “brake” on the economy by taking money away from borrowers (like homeowners and businesses), but they provide a benefit to people who rely on savings (like retirees). Notice that Sofia’s extra cost ($7500) is five times larger than Mr. Chen’s extra income ($1 500) — this reflects the fact that borrowers typically carry much larger amounts than savers, making them significantly more exposed to interest rate changes.
Example 4
Jordan is a young adult renting their first apartment. Their monthly income is $6500:
a Calculate the maximum allowable housing cost if it should not exceed 35% of income, and determine the remaining amount for other expenses.
Create a strategy
Calculate the maximum housing allocation using the percentage, then subtract from total income to determine the remaining funds.
Apply the idea
Maximum housing allocation = $6500 × 0.35
Write the equation = $2275
Evaluate
Remaining funds = $6500 $2275
Write the equation = $4225
Evaluate
Therefore, the maximum housing cost is $2275 per month, leaving $4225 for all other expenses.
Reflect and check
Sticking to a housing budget of $2275 helps follow a common financial guideline of keeping housing costs under 35% of income. This leaves a healthy $4225 for all other expenses and savings.
b If this budget belongs to a working adult with a family compared to a young adult, explain why the working adult might find it harder to stay under this 35% limit despite having a higher salary.
Apply the idea
The working adult has higher fixed responsibilities, such as childcare and insurance, which are common in the family life stage. Even with a higher salary, their essential expenses take up a larger portion of their budget compared to a young adult who may only have rent and transport.
Reflect and check
This shows that a higher income does not always mean more financial freedom — a working adult with a family faces significantly higher fixed obligations than a young adult, meaning a larger portion of their income is committed before discretionary spending begins.
Idea summary
Different life stages require distinct financial planning approaches as income levels and spending habits change.
• A budget is essential for managing money and planning for future goals.
• Superannuation is a long-term savings fund built up through work, designed to provide income during the Retirement life stage.
• Financial planning should account for both current needs and future life transitions.
7.03 Practice questions
What do you remember?
1 Classify these expenses as either fixed or variable:
a Monthly rent payment
b Weekly grocery bill
c Car insurance premium (paid monthly)
d Cost of petrol for the car
e Monthly gym membership fee
2 Match each economic indicator with its correct description:
a CPI i The cost of borrowing money or the return on savings
b Interest rates ii Shows income trends and minimum pay levels
c Wages iii Tracks changes in the price of consumer goods to measure inflation
3 When interest rates rise, what generally happens to the cost of borrowing money (e.g., mortgage repayments)?
A It decreases.
C It stays exactly the same.
Practice
B It increases.
D It becomes zero.
4 The Consumer Price Index (CPI) is used to measure inflation:
a The CPI increased from 112.8 to 117.9 over a year. Calculate the annual inflation rate, rounded to two decimal places.
b Interpret this result: If the Reserve Bank’s target inflation range is 2%–3%, explain what this specific inflation rate suggests about the likelihood of an interest rate increase.
5 Match each individual to their likely life stage based on their financial profile:
• Young adult
• Older adult / Retirement
• Student / Teenager
• Working adult / Family stage
a Person A works part-time at a fast-food chain, lives with parents, spends money on games and phone credit.
b Person B has a full-time job, pays a mortgage, pays for childcare, and is saving for a family holiday.
c Person C no longer works, relies on the age pension and superannuation, owns their home outright.
d Person D recently started a full-time career, renting an apartment with friends, saving for a first car.
6 A Young adult earns a monthly net income of $4200. They are creating a budget to move into a rental property:
a Financial experts recommend spending no more than 30% of net income on rent. Calculate the maximum monthly rent this person can afford based on this guideline.
b They find an apartment for $350 per week. Assuming there are exactly 4 weeks in this particular month, is this apartment within their budget?
c Identify two variable expenses this person will likely incur after moving out of home.
7 Wage calculations are essential for personal finance:
a A tradesperson earns $35 per hour. Calculate their gross weekly income for a standard 38-hour week.
b Five years ago, their hourly rate was $28. Calculate the average annual percentage increase in their hourly rate over the 5 years, rounded to two decimal places.
8 Sarah earns an annual salary of $85 000. Due to performance, her salary is increased to $87 550 the following year.
During the same period, the annual inflation rate is reported as 4.5%:
a Calculate the percentage increase in Sarah’s salary.
b Determine whether Sarah’s “real” purchasing power has increased or decreased. Justify your answer.
9 Interest rates affect individuals differently depending on their life stage:
a Sarah (teenager/ student stage) has $5000 in a savings account. The bank increases the interest rate from 2.5% to 3.2%. Calculate the extra interest she will earn in one year.
b Ben (young adult stage) has a personal loan for a car of $20 000. His interest rate also increases by 0.7%. Calculate his extra annual interest cost.
c Interpret these results: Explain why Ben is more “financially vulnerable” than Sarah in this scenario, considering their likely income and responsibilities at these life stages.
10 A household’s monthly expenses include $2200 for rent, $600 for utilities, and $1100 for groceries. Calculate the minimum annual income needed if these essential expenses should not exceed 65% of total income.
11 Alex is a young professional renting an apartment in the city. Their monthly income is $7500:
a With a monthly income of $7500, calculate the maximum allowable housing cost at 30% of income and determine the remaining amount for other expenses.
b Interpret these results: Explain why a working adult would likely have less money available for “wants” than a student, despite the remaining funds calculated in part (a).
12 James and Maria are in the “family formation” stage. Their combined monthly net income is $8400. They have budgeted these monthly costs:
• Mortgage: $3200
• Childcare: $1800
• Groceries and utilities: $1500
Determine:
a The total amount spent on fixed expenses (mortgage and childcare)
b The percentage of their income consumed by these fixed expenses, rounded to one decimal place
c How much disposable income is left for additional savings or extra variable spending
Extend your thinking
13 A region experiences 4.2% inflation while average wages increase by 3.1%. The unemployment rate drops from 5.2% to 4.1%. Analyse these indicators and explain their combined economic implications.
14 A worker earns an annual salary of $60 000. In a year of high inflation, the CPI rises by 5.5%, but the worker only receives a wage increase of 2.5%:
a Calculate the worker’s new salary.
b Calculate what the salary should have been to keep up with the 5.5% inflation rate.
c Calculate the “gap” or loss in purchasing power in dollar terms.
15 Consider how high inflation (rising cost of living) impacts people at different life stages.
• Scenario 1 (working adult): Earns a salary that increases by 3% each year
• Scenario 2 (retiree): Relies on a fixed-income annuity that pays exactly $2000 per month, regardless of the economy
If inflation is running at 5% per year:
a Explain why the retiree is more vulnerable to inflation than the working adult in this specific situation.
b Suggest one financial strategy the retiree might use to cope with this situation.
Compare car options
Compare different car options by formulating a financial problem, modelling loan repayments and total costs using online tools and spreadsheets, and making a recommendation.
Objectives
• To formulate financial problem with multiple variables
• To use online tools and spreadsheets to model loan repayments and total costs
• To analyse and communicate a recommendation based on the financial models
Materials
• Access to a computer or tablet with internet
• Spreadsheet software
Formulate the car purchase problem
Financial decisions
Car purchases often involve loans, which include variables such as principal amount (car price minus deposit), interest rate, loan term (in years or months), and additional costs like insurance or maintenance.
Multiple variables affect the total cost
Changes such as adjustments to the deposit, interest rate, or loan length can significantly impact monthly repayments and overall expense.
Real-world connection
In real life, people compare car options by researching prices, loan offers from banks or dealers, and using calculators to model scenarios.
Key questions
Consider these questions when formulating the problems:
• What cars are you comparing (e.g., new vs. used, different models)?
• What variables will you include (e.g., price, deposit, interest rate, loan term)?
• How might fuel efficiency or resale value add to the model?
Choose two or three car options to compare. Use online websites (e.g., car dealership sites or marketplaces like carsales.com.au) to find realistic prices and details.
What assumptions are you making about the buyer’s budget or preferences? Explain why.
Research loan options. Note down variables like interest rates (assume 5%–10% based on current rates) and possible loan terms (e.g., 3–7 years).
How do different interest rates or loan terms change the problem? Provide an example.
Investigate
Work individually or in pairs to answer these questions based on your formulated problem:
1. Why did you choose these specific cars and variables? How do they represent a realistic financial decision?
2. What additional variables could you include to make the model more comprehensive, and why?
3. If interest rates change in the future, how might that affect your problem formulation?
Model loan repayments and total costs
Simple interest formula
Calculate the interest charged using the simple interest formula: I = P × r × t
where P is the principal, r is the annual interest rate (as a decimal), and t is the time in years.
Total cost and repayments
Calculate total cost and monthly payments:
1. Calculate the total amount payable: A = P + I
2. Divide total amount payable by the number of months (n) to determine the monthly repayment:
Spreadsheets simplify the task
Use basic arithmetic formulas in a spreadsheet to automate these calculations for different scenarios.
Spreadsheet setup
Steps for spreadsheet setup:
Step 1: Create columns for variables (e.g., Principal, Interest rate, Time in years) of each car option.
Step 2: Input the data (Principal, Rate, Time in years) of each car option.
Step 3: Create a column for the interest, total cost, and monthly payment of each car option.
Step 4: Apply these formulas, replacing the corresponding column letters and row numbers, to calculate each value of the cells:
• Interest cell: = Principal ∗ Rate ∗ Time
• Total cost: = Principal + Interest
• Monthly payment cell: = Total cost/(Time∗12)
Example spreadsheet layout:
Step 5: Double-check your formulas manually to ensure accuracy.
How does increasing the deposit affect the monthly payment and total interest? Show your calculations.
Step 6: Model at least two scenarios per car (e.g., different loan terms or rates).
What surprises did you find when changing variables?
Investigate
Discuss with a partner and answer based on your models.
1. How accurate do you think your simple interest model is compared to real-world loans (which often use compound interest)? What limitations exist?
2. If you added a variable like annual maintenance cost, how would you incorporate it into the spreadsheet?
3. What creative ways could you visualise the data (e.g., charts) to better understand the comparisons?
Analyse and recommend
Analysis
Look at total costs, affordability, and long-term implications. Consider pros and cons beyond numbers, like car features.
Communication
Present your recommendation clearly, using data from your models to support it.
Recommendation tips
• Summarise key findings in a table or chart.
• Explain trade-offs (e.g., lower monthly payments but higher total cost).
• Suggest alternatives if assumptions change.
• Analyse your spreadsheet data to compare options.
Which option has the lowest total cost? Is it the best choice? Why or why not?
• Prepare a short presentation or written recommendation.
How would you communicate this to someone with no maths background?
Investigate
Reflect on your analysis and share with the class.
1. What factors besides cost influenced your recommendation?
2. How might this process apply to other financial decisions, like buying a house?
3. If you could improve your model with more data, what would you add and why?
Discussion
1. How does modelling help in making informed financial decisions?
2. Share how your group’s recommendation differed from others. What caused the differences?
3. In what real-world careers might these skills be useful (e.g., financial adviser, consumer advocate)?
Chapter review
1 A graphic designer needs to back up 4 TB of data. Consider the two storage plans: Plan Monthly cost Storage limit
Basic $6 1 TB
Professional $15 5 TB
a Identify which plan is required for the designer’s needs.
b Calculate the cost of that plan for one full year.
2 Compare the value of two internet plans to determine which offers the lowest cost per Gigabyte (GB):
• Plan A: $95 monthly for 200 GB
• Plan B: $110 monthly for 250 GB
3 A golf club membership offers two payment options: an upfront annual fee of $850 or a monthly fee of $80. Calculate the amount saved by choosing the upfront annual payment instead of paying monthly for a year.
4 A retailer purchases headphones for a cost price of $60. They apply an 80% mark-up to set the selling price. During a sale, they offer a 15% discount on that price:
a Calculate the initial selling price after the mark-up.
b Calculate the final sale price after the discount.
c Calculate the final profit made on the sale.
5 A mobile game advertises special “loot boxes” for $5 each, which contain a random in-game item of varying rarity. Discuss one potential gambling risk associated with this type of in-game purchase.
6 A contractor provides a quote of $660 for a job, which includes the 10% Goods and Services Tax (GST):
a Calculate the original price before GST was added.
b Calculate the dollar amount of GST included in the price.
7 An email has the subject “URGENT ACTION: Your account is overdue”. It asks the recipient to click a link to verify your payment details immediately to avoid a late fee. Identify two specific indicators that suggest this email is a scam.
8 A tax invoice for a birthday party is shown. The unit prices do not include GST:
Amount owing ⬚
Complete the invoice by filling in the ‘Amount’ column, the ‘Total’, the ‘GST’ (10% of the Total), and the final ‘Amount owing’.
9 Mia wants to buy a laptop for $2500. She can use a credit card with a 55-day interest-free period and an interest rate of 22% p.a. thereafter, or she can get a personal loan at 12% p.a.:
a If Mia can pay the full balance within 40 days, state a financial advantage of using the credit card.
b If Mia cannot pay within the interest-free period, state a financial disadvantage of using the credit card compared to the loan.
10 A business takes out a simple interest loan of $15 000 at a rate of 9% p.a. for 4 years. Calculate the monthly repayment amount required to clear the debt.
11 An investment of $15 000 grows to $18 375 over a period of 3 years. Assuming a simple interest model, what was the annual interest rate?
12 An engineer earns $88 000 annually. The HECS-HELP repayment rate for this income is 5.0%. Calculate how much will be deducted from the engineer’s pay each week, rounded to the nearest cent.
13 The table shows some of the 2023-2024 HELP repayment thresholds:
14
A graduate earns an annual income of $70 000. What is the amount they must repay for that financial year?
A real estate agent earns commission based on a tiered structure: 2.0% on the first $500 000 of a sale price, and 1.5% on the remainder. If a house is sold for $820 000, what is the total commission earned?
15 The Consumer Price Index (CPI) increased from 120.0 to 126.6 over one year. If a person’s salary was $70 000 at the start of the year, what would their salary need to be at the end of the year to maintain the same purchasing power?
16 An employee’s annual salary is increased from $72 000 to $74 520. During the same year, the inflation rate was 4.0%. Determine if the employee’s real purchasing power has increased or decreased, and justify the answer.
17 A person has $10 000 in a savings account. The interest rate increases from 3.0% to 3.5% p.a. At the same time, they have a $25 000 loan where the interest rate increases from 7.0% to 7.5% p.a. Calculate the net effect of these changes on their finances for one year.
18 A graduate has a monthly net income of $6200 and follows the budgeting rule that housing costs should not exceed 30% of income. Calculate their maximum allowable monthly housing budget and the amount remaining for other expenses.
19 A household has monthly essential expenses of $2500 for rent, $500 for utilities, and $1200 for food. Calculate the minimum annual income required if these expenses should represent no more than 70% of their total income.
20 Classify each of these personal expenses as either fixed or variable:
a Monthly Netflix subscription
b Weekly grocery bill
c Fortnightly public transport pass
Big ideas
• Standardised geometric language and conventions provide a rigorous framework for describing, classifying, and analysing the properties of two-dimensional shapes and three-dimensional objects in both theoretical and practical contexts.
• Scale drawings, nets, and maps represent physical space and objects using proportional reduction and universal symbols, enabling the accurate planning, navigation, and evaluation of real-world designs.
8 Shape, location, and travel
Chapter outline
Crystals grow in fixed geometric patterns. Salt forms tiny cubes, while quartz grows hexagonal prisms – 3D shape comes from atomic structure.
8.01 Geometric language and conventions
After this lesson, you will be able to…
• identify fundamental geometric elements including points, lines, segments, rays, and angles, and use appropriate mathematical notation
Points, segments, rays, and lines Exploration
1. How does reversing the order of points affect the naming and meaning of a segment, ray, or line? For example, is ray the same as ray ? What about line compared to line , or segment compared to segment ? Discuss with a partner.
2. Explore whether two rays can combine to make a line and what has to be true about their directions and starting points.
3. What do the endpoints or arrows in a diagram indicate about whether it represents a line, a ray, or a line segment?
A point is a single and precise location in space. It has no dimension–no length, width, or height.
Points are typically represented by a dot and labelled with a capital letter, such as A, B, and C
A segment is a section of a line between two endpoints The segment between A and B can be written as or A B
A ray starts at one point, called the endpoint, and extends infinitely in one direction.
For example, a ray that starts at point A and extends in the direction of point B can be represented as .
Note: Unlike segments and lines, the order of the letters matters for a ray. The first letter always represents the endpoint and the second letter indicates the direction.
A line passes through two points and extends infinitely in both directions. A line passing through points A and B can be represented as or .
Example 1
Determine whether the descriptions match a segment, ray, or line: a A path between a fence post at point P and a gate at point Q
Create a strategy
The path connects two specific locations and does not extend beyond them. Consider which geometric term describes a path with two fixed endpoints.
Apply the idea
A segment is a part of a line that joins two fixed endpoints. The path is a segment from point P to point Q, written as
b A laser starts at S and shines through T.
T
Create a strategy
The description mentions a starting point and a direction in which the object continues infinitely. Consider which geometric term matches this description.
Apply the idea
A ray starts at an endpoint and extends infinitely in one direction. The laser is a ray that starts at S and extends through T
Reflect and check
In reality, no physical object (including a laser beam) can extend infinitely, so this is just a mathematical model of a ray. If it somehow extended infinitely in both directions — which is not possible in practice — it would be modelled as a line. And if the laser beam hit a wall at a point (say, point T ) and stopped, then it would be modelled as a line segment between the starting point S and point T.
Idea summary
A point is a single and precise location in space, e.g., A.
A segment connects two endpoints and has a fixed length, e.g.,
A ray starts at an endpoint and extends infinitely in one direction, e.g., .
A line extends infinitely in both directions, e.g., .
Angles
Angle
Formed when two rays share a common endpoint called the vertex. It measures the amount of turn between the rays.
Exploration
Think about the hands of a clock. What time would the hands show an acute angle?
A right angle? An obtuse angle? A straight angle? Discuss with a partner.
1. Determine the type of angle that the hands make at 3:00.
2. Determine the type of angle that the hands make at 1:00.
3. Determine the type of angle that the hands make at 5:00.
An angle is formed when two rays share a common endpoint called the vertex. An angle measures the amount of turn between the two rays.
The angle (∠) can be named by three points with the vertex in the middle. For example, in the angle ∠ ABC or ∠CBA, B is the vertex. This angle can also be named simply as ∠B
Acute angle
An acute angle measures between 0° and 90°.
A right angle measures exactly 90°. It is often marked with a small square in the corner.
Obtuse angle
An obtuse angle measures greater than 90° but less than 180°.
Right angle
Interior angle (or Non-reflex angle)
Reflex angle
180°
A reflex angle is the larger angle formed by two rays, and it measures more than 180° but less than 360°. Arcs are used to mark which angle is being measured.
A straight angle is an angle that measures exactly 180°. It forms a straight line.
A revolution (or full angle) is an angle that measures exactly 360°. It represents a full circle.
Example 2
An angle is formed by rays and meeting at vertex P Name the angle.
Create a strategy
To name an angle formed by two rays meeting at a point, identify the common point (this will be the vertex) and one point on each ray. The vertex must be the middle letter in the angle’s name.
Apply the idea
P is the common point, which will be the vertex of the angle and the middle letter in the angle’s name. The angle is ∠QPR or ∠RPQ.
Example 3
Classify each of these angles as acute, right, obtuse, or reflex: a 45°
Create a strategy
Compare the angle measure to the definitions of angle types. An acute angle measures between 0° and 90°.
Apply the idea
Since 45° measures more than 0° and less than 90°, it is an acute angle.
b 150°
Create a strategy
An obtuse angle measures between 90° and 180°.
Apply the idea
Since 150° measures more than 90° and less than 180°, it is classified as an obtuse angle.
c 210°
Create a strategy
A reflex angle measures between 180° and 360°.
Apply the idea
Since 210° measures more than 180° and less than 360°, it is a reflex angle.
Idea summary
An angle is formed at a vertex and is named with the vertex as the middle letter, e.g., ∠ ABC
• Acute angles measure between 0° and 90°.
• Right angles measure exactly 90°.
• Obtuse angles measure between 90° and 180°.
• Reflex angles measure between 180° and 360°.
• Straight angles measure exactly 180°.
• A revolution measures exactly 360°.
Did you know?
In the world of geometry, the word “plane” refers to a perfectly flat surface that extends infinitely in every direction. While a tablet screen is a physical example, the mathematical plane has no thickness at all. Every time you use a stylus on a screen, you are interacting with a flat plane that translates your movements into digital actions.
Pairs of lines
Parallel lines
Lines that never meet and are always the same distance apart. Denoted by ∥ and matching chevrons in diagrams.
Perpendicular lines
Lines that intersect to form a right angle (90°). Denoted by ⊥ and a square at the intersection.
Two pairs of parallel lines
To show that lines are parallel, diagrams use matching symbols like chevrons (>). The mathematical notation for this relationship is ∥ , which means line is parallel to line
The Leaning Tower of Pisa is not perpendicular to the ground. Instead of forming a 90° angle, it leans at 3.99° from vertical, creating an angle of approximately 86.01°.
Example 4
The lines and intersect at a 90° angle as shown:
Use mathematical notation to determine the relationship between these two lines.
Create a strategy
Look for the right angle symbol (90° square).
Apply the idea
The small square indicates a right angle. Therefore, the lines are perpendicular, which is written as
Idea summary
Parallel lines (∥) stay the same distance apart. Perpendicular lines (⊥) meet at 90°.
8.01 Practice questions
What do you remember?
1 Match the geometric notation with its correct description:
a i Line passing through A and B
b ii Line segment connecting A and B
c iii Ray starting at A and passing through B
d ∠ ABC iv Angle with vertex B
2 Complete these sentences regarding pairs of lines:
a Lines that never meet and stay the same distance apart are called ⬚ lines.
b When two lines intersect to form a 90° angle, they are ⬚ to each other.
3 Identify the correct ways to mark diagrams:
a Parallel lines
b Perpendicular lines
4 Classify each image as a line, ray, or segment: a b c d
Practice
5 For each description, identify whether it is a point, segment, ray, or line, and provide notation:
a A destination marked on a map at location D
b A curtain rod with ends at M and N.
c A laser starting at A shining through B
d A flat road extending infinitely through X and Y.
6 Determine the type and notation for each figure:
7 Consider the figure:
a Identify three points shown on the line.
b Identify two rays with endpoint Y
c Identify a ray equivalent to if Y is between X and Z.
8 Consider the angle shown in the diagram:
a Name the vertex of the angle.
b Write the mathematical notation for this angle.
9 Name the angle marked in each of these figures: a b
10
Classify each angle as acute, right, obtuse, or reflex:
11
Classify these angles based on their degree measures:
12 Identify parallel segments (indicated by arrows):
13 For the figure, identify:
a All parallel segments
b All perpendicular segments
Ex
14 Identify the pairs of segments that are parallel:
15 Consider this diagram:
Determine whether these streets are parallel or perpendicular to each other:
a Temple Street and Market Street
b Millers Road and Sub Way
c Market Street and Church Street
d Avenue Road and Temple Street
16 Draw a labelled diagram to represent each figure described:
a Ray from P through Q
b Perpendicular lines intersecting at point M
c Two parallel lines
17 A fence is built with two parallel horizontal rails, segment and segment . Sketch the diagram.
Extend your thinking
18 A ray is drawn from a point P on a straight line. The ray forms an angle of 60° with one part of the line and 120° with the other. Sketch the diagram and label the reflex angle corresponding to the 60° angle.
19 A bridge support has two perpendicular beams meeting at X and a brace segment from X to Y. Sketch the diagram and mark the perpendicularity.
8.02 Properties of 2D shapes
After this lesson, you will be able to…
• identify names and properties of common geometric shapes
• define and identify the key features of 2D shapes, including diagonals
Classify 2D shapes
Two-dimensional (2D) shapes
Shapes that have length and width but no depth.
Polygon
A closed 2D shape formed by three or more straight sides.
Rotational symmetry
The property where a shape can be rotated around a central point (called the centre of rotation) by an angle of less than 360° and occupies the same space (maps onto itself) as it did before the rotation.
Two-dimensional (2D) shapes are flat figures that can be drawn on a plane and are defined by lines, curves, and angles. They can be drawn on a plane and are defined by lines, curves, and angles. Two-dimensional shapes are classified based on their specific properties, such as the number of sides, angles, and other defining characteristics. Understanding how to classify these shapes allows for clearer identification and application in various contexts.
Two-dimensional shapes can be classified into categories based on the following:
• Number of sides: Shapes can be categorised by how many straight sides they have.
• Angles: The types of angles the shape contains (e.g., acute, obtuse, right angles).
• Symmetry: Shapes can have lines of symmetry or rotational symmetry, which are useful for classification.
Shapes can also exhibit symmetry, which can be classified into two main types:
1. Reflectional symmetry: A shape can be divided into two congruent halves that are mirror images of each other by a line of symmetry.
2. Rotational symmetry: A shape can be rotated around its centre point by an angle of less than 360° and still match its original position.
The number of times a shape maps onto itself during a full 360° rotation determines its order of rotational symmetry.
Equilateral triangle Order: 3
Square Order: 4
Rectangle Order: 2
Rhombus Order: 2
Parallelogram Order: 2
Isosceles trapezium Order: 1
Kite Order: 1
Regular pentagon Order: 5
Regular hexagon Order: 6
Consider a tile used in flooring that has four equal sides and four right angles, which can be rotated into four orientations and still match its original position. Identify its classification and symmetry.
Create a strategy
Start by analysing the properties of the tile based on the number of sides, angles, and symmetry. Then, classify the shape and explain how its geometric properties help in its practical use in real-life applications, such as in floor tiling.
Apply the idea
Property analysis:
• The tile has four equal sides.
• The tile has four right angles (90°).
• The tile exhibits symmetry: 4 lines of reflectional symmetry and rotational symmetry of order 4. Geometric terminology:
• The shape is a square.
• It has rotational symmetry of order 4, meaning it can be rotated in increments of 90° and still match its original position.
Reflect and check
The shape of the tile is a square, which is not only important for its aesthetic appeal but also for its functionality in real-world applications like tiling floors. The square’s interior angles of 90° ensure that the tiles can tessellate (fit together without gaps), while its symmetry allows them to be laid in any of four orientations, and its equal sides help in achieving a seamless and uniform look across the floor.
Example 1
Idea summary
Two-dimensional (2D) shapes are classified based on their geometric properties. For any polygon, the number of sides determines its specific category, while the types of angles and rotational symmetry (along with reflectional symmetry) help identify how shapes are used in real-world applications such as tiling.
Triangles
Triangle
A polygon with three sides and three angles.
Triangles are fundamental two-dimensional shapes with three sides and three angles. They are classified based on their side lengths and angle measurements. This classification helps in understanding the properties and characteristics of different triangles in geometry.
Triangles can be classified by their angle measures, leading to the following categories:
An acute-angled triangle with all angles less than 90°.
A right-angled triangle with one 90° angle.
An obtuse-angled triangle with one angle greater than 90°.
Triangles are also classified by their side lengths:
An equilateral triangle with three equal sides and three equal angles (each 60°).
An isosceles triangle with two equal sides and two equal angles.
A scalene triangle with no equal sides and no equal angles.
Regardless of its classification, the sum of the interior angles of any triangle is always 180°. This rule is fundamental for finding unknown angles in designs and structures.
Example 2
A graphic designer creates a logo using a triangle with side lengths of 8 cm, 8 cm, and 10 cm. Classify this triangle.
Create a strategy
Analyse the given side lengths. Compare them to determine if they are all equal, two are equal, or none are equal.
Apply the idea
The side lengths are 8 cm, 8 cm, and 10 cm. Two of the sides are equal in length (8 cm).
A triangle with two equal sides is classified as an isosceles triangle.
Example 3
A triangular garden bed has angles measuring 110°, 40°, and 30°. Classify the triangle based on its angles.
Create a strategy
Examine each angle and compare them to 90°. The classification is determined by the largest angle in the triangle.
Apply the idea
The angles are 110°, 40°, and 30°.
One angle (110°) is greater than 90°.
A triangle containing an angle greater than 90° is an obtuse-angled triangle.
Reflect and check
The sum of the angles is 110° + 40° + 30° = 180°, which confirms it is a valid triangle.
Idea summary
Key points about triangles:
• Triangles can be classified by their angles (acute, right, obtuse) and sides (equilateral, isosceles, scalene).
• Triangle properties, such as the angle sum, are fundamental to geometry.
• Precise geometric language is essential for clear triangle classification.
Quadrilaterals
Quadrilateral
A polygon with four sides and four angles.
Diagonal
A segment in a polygon that connects two vertices but is not a side.
Quadrilaterals can be classified by their sides and angles. Here is a flowchart showing how they relate to each other:
Quadrilateral
Kite (two pairs of adjacent sides of equal length)
Parallelogram (two pairs of parallel sides)
Rectangle (four right angles)
Trapezium (one pair of parallel sides)
Rhombus (four sides of equal length)
Square (four right angles and four sides of equal length)
Each quadrilateral has its own diagonal properties.
The diagonals of a parallelogram:
• Bisect each other (cut each other equally in half)
• Each diagonal divides the figure into two congruent triangles The diagonals of a rectangle:
• Are congruent (equal in length)
• Bisect each other
The diagonals of a rhombus bisect each other at right angles.
The diagonals of a square:
• Are congruent (equal in length)
• Bisect each other at right angles
The diagonals of an isosceles trapezium:
• Are congruent (equal in length)
• Create segments that are equal in pairs when they intersect (each diagonal is split into a longer and shorter segment, with the two longer segments equal and the two shorter segments equal)
Example 4
A carpenter is building a window frame. The frame has two pairs of opposite sides that are parallel and equal in length, and four right angles. Use geometric terminology to describe the shape of the window frame.
Apply the idea
Property analysis:
• Two pairs of opposite sides are of equal length and parallel.
• Four right angles (90°).
Geometric terminology:
• The window frame is a rectangle.
• It is also a special type of parallelogram.
Reflect and check
The window frame is a rectangle, which combines the properties of both a parallelogram (opposite sides are parallel and equal) and a shape with right angles (all 90°). This is why carpenters check that corners are ‘square’ (meaning they are at right angles) when building frames.
Idea summary
Key points about quadrilaterals:
• Quadrilaterals are polygons with four sides, four angles, and four vertices.
• Quadrilaterals are classified by their side properties (parallel, of equal length), angle properties, and diagonal properties.
• Special quadrilaterals include squares, rectangles, rhombuses, kites, and trapeziums.
• Precise geometric language is essential for clear classification of quadrilaterals.
Properties of regular polygons
Regular polygon
A regular polygon has all sides equal in length and all interior angles equal in size. Examples include the equilateral triangle, the square, and the regular pentagon.
The number of sides determines the name of the shape. For example, a pentagon has five sides, five vertices, and five angles.
In a regular polygon:
• All sides are straight and of equal length.
• All interior angles are equal.
Interior angle sum
n represents the number of sides (or vertices) of the polygon
To find the size of one interior angle in a regular polygon, divide the sum by the number of sides:
Example 5
A baker is sorting through a box of cookie cutters. They want to find the ones that are regular polygons, so that each cookie will have sides that are all the same length:
Identify all the shapes that are regular polygons:
Create a strategy
To identify regular polygons, check whether all sides are equal in length and all interior angles are equal in size.
Apply the idea
Option A: All six sides and angles are equal. This is a regular hexagon, so it is a regular polygon cookie cutter.
Option B: The sides and angles are not all equal. This is a concave quadrilateral (arrowhead shape), so it is not a regular polygon.
Option C: All three sides and angles are equal. This is an equilateral triangle (which is a regular triangle), so it is a regular polygon cookie cutter.
Option D: The sides and angles are not all equal. This is a trapezium (an irregular quadrilateral), so it is not a regular polygon.
Therefore, the baker should use the cookie cutters in Options A and C.
Example 6
A stop sign is in the shape of a regular octagon, which has eight sides: a Calculate the interior angle sum of the stop sign.
Create a strategy
Use the formula: Interior angle sum = (n 2) × 180°
Apply the idea
Interior angle sum = (n 2) × 180° Write the formula
= (8 2) × 180°
= 6 × 180°
= 1080°
The interior angle sum of the stop sign is 1080°.
Substitute n = 8 for the octagon
Simplify
Evaluate
Reflect and check
A regular octagon has six triangles inside it, and 6 × 180° = 1080°, which confirms the answer is correct.
b Find the measure of one interior angle of the stop sign.
Create a strategy
Since the stop sign is a regular polygon, all interior angles are equal. Divide the interior angle sum by the number of sides.
Apply the idea
Write the formula
Substitute the values
Evaluate
One interior angle of the stop sign is 135°.
Reflect and check
Since the stop sign has eight equal angles, then 135° × 8 = 1080°, which matches the interior angle sum from part (a).
Idea summary
A polygon is a closed two-dimensional (2D) shape formed by three or more straight line segments.
A regular polygon is a polygon that has all sides of equal length and all interior angles of equal size.
The sum of the angles of a polygon with n sides (where n is the number of sides) is calculated using the formula:
Interior angle sum = (n 2) × 180°
8.02 Practice questions
What do you remember?
1 Name the polygons that have these number of sides: a 3 sides b 4 sides c 5 sides d 6 sides
2 Match each angle measure to its correct name: i Obtuse angle ii Acute angle iii Right angle a 90° b Less than 90° c Between 90° and 180°
3 In geometric diagrams, identify what is indicated by each of these symbols:
a Matching dash marks (ticks) on two or more sides of a shape
b Matching arrowheads on two or more sides of a shape
c A small square symbol placed inside the vertex (corner) of a shape
Practice
4 Identify each quadrilateral based on its description:
a A quadrilateral with four sides of equal length and four right angles.
b A quadrilateral with one pair of parallel sides and diagonals of equal length.
c A quadrilateral with opposite sides parallel and of equal length, but not necessarily with right angles.
d A quadrilateral with four sides of equal length, but does not contain right angles.
5 A designer creates a logo using a regular hexagon:
a How many lines of reflectional symmetry does a regular hexagon have?
b Identify the order of rotational symmetry for a regular hexagon.
6 A scaffolder is inspecting the triangular support braces on a building site. Classify each brace as either scalene, isosceles, or equilateral: a
7 A builder cuts a square tile along a diagonal to create a triangular piece for a corner fitting. The resulting triangle has angles measuring 45°, 45°, and 90°. Classify this triangle by both its angles and sides.
8 Classify these triangles as either acute-angled, obtuse-angled, or right-angled: a
9 A quadrilateral has exactly one pair of parallel sides. Identify this shape and explain why it cannot be a parallelogram.
10 A town planner designs a garden bed where all four boundary fences are equal in length, but the corners are not right angles. Using precise geometric language, identify this shape and determine two of its properties.
11 A landscape designer is selecting paving stones for a garden path. They need stones that are regular polygons so that each stone has sides of equal length for a uniform fit. Identify all the shapes that are regular polygons:
12 Calculate the sum of the interior angles for each regular polygon:
a A decagon (n = 10) b A triangle (n = 3)
13 A decorative wall tile is in the shape of a regular hexagon, which has 6 sides:
a Calculate the interior angle sum of the tile.
b Find the measure of one interior angle of the tile.
14 Consider a rectangle and a rhombus:
a How many vertices does each shape have?
b Describe one difference between the diagonals of a rectangle and the diagonals of a rhombus.
a Identify a pair of vertices that are next to each other.
b Is a side or a diagonal?
c How many diagonals can be drawn from vertex A in total?
d List all five interior angles using three-letter notation.
Extend your thinking
16 A ‘vertex’ in a tiling pattern is a point where the corners of shapes meet. For there to be no gaps, the interior angles around the vertex must sum exactly to 360°.
Use calculations to explain why regular pentagons cannot tile a flat surface on their own.
17 A metalworker welds together straight steel bars to make decorative window grilles.
Each grille is a single polygon, and the customer has specific requirements for each one.
a Grille 1 must be a quadrilateral where all four sides are of equal length, but the angles must not be right angles. Identify the shape using precise geometric language and state two of its properties.
b Grille 2 must be a triangle with no equal sides. The customer provides angle measurements of 35° and 65° for two of the interior angles. Calculate the third angle and classify the triangle by both its angles and its sides.
c Grille 3 must be a regular polygon. The customer wants each interior angle to be greater than 100° but less than 125°. By calculating the interior angle for regular polygons with 5, 6, 7, and 8 sides, determine which regular polygon(s) the metalworker could use.
8.03 Properties of 3D objects
After this lesson, you will be able to…
• identify names and properties of common 3D objects (prisms, pyramids, cylinders)
• define and identify the key features of 3D objects using appropriate geometric language (vertex, edge, face, curve, surface, boundary, solid)
• recognise nets of simple 3D objects
Properties of 3D objects
Three-dimensional (3D) object
A solid shape that has three dimensions, which are length, width, and height.
Face
A flat surface of a 3D object.
Edge
A boundary where two faces of a 3D object meet.
Vertex
A point where three or more edges of a 3D object meet.
The key properties of 3D objects are faces, edges, and vertices.
Edge Vertex
Face
Three-dimensional objects can be classified based on their properties, such as:
• The shape of their bases (for example, square-based or triangular-based)
• Whether their surfaces are flat or curved
Common 3D objects include:
Prisms have two identical, parallel bases. Their other faces are rectangles.
Pyramids have a base and triangular faces that meet at an apex.
Cylinders have two identical, parallel circular bases and one curved surface.
Exploration
Cones have one circular base and one curved surface that comes to a point (the apex).
This exploration investigates the physical properties of 3D solids by analysing their vertices, faces, and edges.
A triangular prism
A square pyramid
1. For the triangular prism, identify and count the total number of vertices, edges, and faces.
2. Look at the square pyramid. Identify the shape the base and the side faces.
3. Compare the two objects. How does the number of vertices in the triangular prism compare to the number of vertices in the square pyramid?
Example 1
A company is designing a cardboard shipping box in the shape of a rectangular prism. To plan the manufacturing process, they need to know the number of flat panels (faces), fold lines (edges), and corner points (vertices) required.
Identify the number of faces, edges, and vertices in the rectangular prism.
Create a strategy
Count each feature systematically, starting with faces, then edges, and finally vertices.
Apply the idea
Faces:
• Front and back faces: 2
• Top and bottom faces: 2
Edges:
• Length edges: 4
• Width edges: 4
Vertices:
• Left and right faces: 2
• Total faces: 6
• Height edges: 4
• Total edges: 12
• Total vertices: 8 (four on the top face, four on the bottom face)
The box requires 6 flat panels, 12 fold lines, and 8 corner points for manufacturing.
Reflect and check
The numbers align with the properties of a rectangular prism: 6 faces, 12 edges, and 8 vertices. These properties hold for any rectangular prism, regardless of its dimensions.
Idea summary
Key points about 3D objects:
• Three-dimensional objects have faces, edges, and vertices.
• Common 3D shapes include prisms, pyramids, cylinders, and cones.
Nets of 3D objects
Net
A two-dimensional pattern that can be folded to create a three-dimensional object.
A 3D object can have several different nets. Here are some examples of 3D objects and one of the possible nets:
Cube and its net
Triangular prism and its net
Square pyramid and its net
Key properties of a valid net:
Cylinder and its net
• The net must have the correct number and shape of faces for the object.
• All faces must be connected in a way that allows them to be folded up.
• The faces must not overlap when folded (except at the edges).
Understanding nets allows all the faces of a 3D object to be seen at once and is useful for calculating surface area.
Example 2
A gift shop creates custom gift boxes from flat sheets of cardboard. A customer has ordered a box with length 6 cm, width 4 cm, and height 3 cm.
Draw a net that can be cut from cardboard and folded to form the box.
Create a strategy
Identify the required faces and determine a connected arrangement that forms the box when folded.
Apply the idea
A rectangular prism has 6 rectangular faces: a top and bottom, a front and back, and two sides. A net must include all six of these faces, arranged so they can be folded into a prism.
Here is one possible net for the gift box:
Base & top (6 × 4 cm)
Front & back (6 × 3 cm)
Sides (4 × 3 cm)
Reflect and check
Verify that all faces are present and connected, and that the net will fold to form a complete box without overlapping faces. This check ensures no cardboard is wasted during production.
Example 3
A toy company prints flat cardboard nets that customers fold into dice-shaped puzzle cubes with edge length 5 cm. A new employee has submitted the design shown for approval. 5 cm
Determine whether this net can be folded to form a cube.
Create a strategy
Check if the net satisfies all requirements for forming a cube.
Apply the idea
1. Check the faces: There are 6 squares. This is the correct number of faces for a cube.
2. Check the folding: Imagine folding the strip. The first four squares would fold to make the four sides of a box. However, the remaining two squares would just wrap around and overlap the existing sides. They would not form a top or bottom. 5 2
Open top (no face)
Faces 1-4 form the sides of the tube
Faces 5 and 6 overlap the existing sides
Result: No top or bottom covers the tube 6 1
Open bottom (no face)
Conclusion:
Because the faces overlap and do not close the shape, this net cannot form a cube. The design must be returned for revision.
Reflect and check
A straight line of squares will never fold into a cube. To be a valid net for a cube, there must typically be squares branching off the main strip to form the top and bottom faces (for example, in a cross shape). Checking a net before printing avoids wasting materials and production time.
Idea summary
• A net is a two-dimensional (2D) pattern that folds to create a three-dimensional (3D) object.
• Essential properties of valid nets:
• Correct number and shape of faces
• Connected faces
• No face overlapping when folded
• Different 3D objects have different characteristic nets.
8.03 Practice questions
What do you remember?
1 Identify which net folds into a cube:
2 Determine the solid formed by these 2D shapes:
3 Match each net to its solid:
• Hexagonal pyramid
• Square pyramid
• Octagonal prism
• Triangular prism
Practice
4 A museum displays a glass trophy in the shape of a rectangular pyramid:
Determine the number of faces, edges, and vertices in the trophy.
5 A three-dimensional (3D) object is a polyhedron with 5 faces, 9 edges, and 6 vertices. Using precise geometric language, identify the object and describe the shapes of its faces.
6 Draw a net for each of the objects described:
a A chocolate box in the shape of a triangular prism. The base is an equilateral triangle with a side length of 3 cm, and the prism has a height of 5 cm.
b A storage container in the shape of a cube with edge length of 4 cm
7 Sketch a net for these solids:
8 A packaging company needs to select the correct cardboard template to build the box, as shown:
Identify the net that matches this rectangular prism:
9 A camping tent is in the shape of a triangular prism, as shown.
Determine:
a The number of faces
b The number of vertices
c The number of edges
10 A rectangular prism has a length of 8 cm, a width of 4 cm, and a height of 3 cm. Calculate the number of edges of each length.
11 A standard can of soup is in the shape of a cylinder. How many faces, edges, and vertices does it have? Describe the shape of its face.
12 Draw a possible net for a cylinder with a height of 10 cm and a radius of 4 cm. Label the dimensions.
Extend your thinking
13 Design a net for a composite 3D object made by joining a cube (edge length of 4 cm) and a square pyramid (base edge of 4 cm and a height of 3 cm) on one face.
14 Imagine a prism where the base is a polygon with 10 sides (a decagonal prism). Without drawing the object, determine the total number of faces, vertices, and edges. Explain the patterns or rules used to find the answer.
15 Determine the number of different nets possible for a cube. Sketch at least three different valid nets.
8.04 Plans, diagrams, and scale
After this lesson, you will be able to…
• understand and use language, symbols, and conventions for diagrams, plans, and models, including keys and scale
• create and modify plans or diagrams using drawing tools or digital software, and evaluate their accuracy against specifications
Symbols and abbreviations in scale drawings
Plan diagram
A bird’s-eye view of an object, building, or area, as if looking straight down from above. Also known as a plan view.
A plan diagram uses a universal language of symbols and scale to communicate layout and size effectively in fields like architecture, design, and construction.
Symbols represent elements like doors, windows, and furniture, while abbreviations provide quick labels for features.
Common abbreviations used on floor plans include:
Tick marks are also used to show that different sides have the same length without needing to label each one.
Because real objects are too large to draw at full size, a scale is used. A scale shows how much the drawing has been reduced compared to the actual object.
Scale ratio
The ratio that compares the measurement on a diagram to the actual measurement. It is typically written in the form 1 : n, where n is the scale factor.
A scale ratio of 1 : n means that actual distances are n times larger than they appear on the plan. To find the real-world size, use the formula:
Actual distance = Plan distance × Scale factor
Example 1
Consider this floor plan:
a Identify the total number of windows shown on the plan.
Create a strategy
Locate the symbol for a window in the external walls of the floor plan. Count how many times this symbol appears.
Apply the idea
Locating the symbol for a window in the external walls reveals that it appears three times. Therefore, there are 3 windows in the unit.
b Describe the types of doors used in the unit.
Create a strategy
Examine the entire floor plan to identify all the different symbols used for doors and match them to the known symbols for door types.
Apply the idea
The main entrance door is shown with a straight line and an arc, which is the symbol for a single swing door. Another door on the plan is a double door, which is shown with two straight lines and two arcs.
c What feature is indicated by the abbreviation ‘CNTP’ in the kitchen?
Create a strategy
Refer to the list of common abbreviations to determine the meaning of ‘CNTP’.
d How many bedrooms are in the house plan?
Create a strategy
Look for symbols that may represent common items found in a bedroom.
Apply the idea
The abbreviation ‘CNTP’ stands for countertop.
Apply the idea
Two of the rooms have symbols representing beds, which indicates there are two bedrooms.
e The width of the bedroom on the plan is measured to be 3.5 cm on a plan with a scale of 1 : 100. Calculate the actual width of the bedroom in metres.
Create a strategy
Use the formula Actual distance = Plan distance × Scale factor. Then, convert the result from centimetres to metres by dividing by 100.
Apply the idea
Step 1: Calculate the actual width in centimetres.
Actual width = 3.5 × 100
Apply the formula = 350 cm
Evaluate
Step 2: Convert centimetres to metres.
Width in metres = 350 ÷ 100
Divide actual width by the conversion factor = 3.5 m
Evaluate
Reflect and check
An actual bedroom width of 3.5 m is a very reasonable size, confirming the calculation is likely correct.
Idea summary
A plan diagram uses symbols (such as those for doors and windows) and abbreviations (e.g. WR for wardrobe) to show features.
The scale ratio (e.g., 1 : 100) shows the relationship between the plan and reality. To find the real-world size from a plan measurement, use the formula: Actual distance = Plan distance × Scale factor
Apply scale for design and evaluation
Exploration
To create a scale drawing, convert every actual measurement to a plan measurement using the scale.
Use the grid paper to create a scale drawing of a rectangular bedroom. The actual dimensions of the room are 4 m by 5 m. Use a scale of 1 : 100, where each square on the grid represents 1 cm by 1 cm.
1. Determine the dimensions of the room on the plan using the 1 : 100 scale.
2. If a bed that is 2 metres long in reality is added to the room, how long would it be on the scale drawing?
3. Why is it important to use the same scale for all objects drawn on the plan?
Beyond simply reading plans, scale is a critical tool for creating new drawings and for verifying that a design meets specific project requirements, known as specifications.
Specifications
A set of detailed requirements that a project, design, or product must meet. This could include minimum dimensions, safety standards, or client requests.
To create a scale drawing, every real-world measurement must be converted to its corresponding plan measurement. This is done by dividing the actual distance by the scale factor.
A common task in trades and design is to check if a plan meets a client’s needs. This involves a three-step process:
1. Calculate: Use the scale to convert a plan measurement back to its actual size.
2. Compare: Check if the calculated actual size meets the required specification (e.g., is it greater than a minimum length?).
3. Conclude: Determine whether the plan meets the specification.
Example 2
A landscaper is planning a new rectangular garden bed with actual dimensions of 6 metres by 2 metres.
Calculate the dimensions needed to draw this garden bed on a plan with a scale of 1 : 100.
Create a strategy
First, convert the actual dimensions from metres to centimetres. Then, use the formula Plan measurement = Actual measurement ÷ Scale factor to find the length and width for the drawing.
Apply the idea
Step 1: Convert actual dimensions to centimetres.
• Length: 6 m = 600 cm
• Width: 2 m = 200 cm
Step 2: Calculate the plan dimensions using the scale factor of 100.
Plan length = 600 ÷ 100
Divide actual length by the scale factor = 6 cm
Evaluate
Plan width = 200 ÷ 100
Divide actual width by the scale factor = 2 cm
Evaluate
The landscaper must draw a rectangle measuring 6 cm by 2 cm on the plan.
Reflect and check
This process ensures that every part of a plan is proportionally accurate, allowing for correct placement of features like paths or plants.
Example 3
An architect has drawn a plan for a rectangular deck with a scale of 1 : 50. The plan shows the deck’s longest side as 18 cm.
The client’s specification requires the actual deck to be at least 8 metres long. Does the current plan meet this requirement?
Create a strategy
Follow the “Calculate, Compare, Conclude” process.
1. Calculate the actual length by multiplying the plan measurement by the scale factor.
2. Compare the result to the 8-metre specification.
3. Conclude with a ‘yes’ or ‘no’ answer based on the comparison.
Apply the idea
Step 1: Calculate the actual length.
Actual length = 18 × 50
Multiply plan length by the scale factor = 900 cm
Evaluate = 9 m
Convert to metres
Step 2: Compare with the specification.
The plan’s actual length is 9 metres. The required length is at least 8 metres.
9 m > 8 m
Step 3: Conclude.
Yes, the planned deck is long enough and meets the client’s specification.
Reflect and check
Verifying plan measurements against specifications is a critical skill in all trades to prevent costly construction errors.
Idea summary
To create a scale drawing, convert actual measurements to plan size using the formula:
To check if a plan meets a client’s specifications (requirements), convert the plan measurement to its actual size and compare. The evaluation process is:
1. Calculate the actual size.
2. Compare it to the requirement.
3. Conclude if it is acceptable.
8.04 Practice questions
What do you remember?
1 Match each plan diagram symbol to its correct name:
a Sliding window
c Bathtub
e Single swing door
b Toilet
d Stairs
i ii iii
2 Write the full meaning of each architectural abbreviation:
a BTH b SHR
c LIN d PAN
e REF f STOR g WC h WR
3 Determine whether each statement is true or false:
a A scale of 1 : 100 means the real object is 100 times larger than the drawing.
b To find the plan distance, multiply the actual distance by the scale factor.
c A plan drawn at a scale of 1 : 50 will be larger than a plan of the same house drawn at 1 : 200.
d In a scale ratio of 1 : n, the two numbers can represent different units of measurement (e.g., cm and m).
4 Consider this floor plan for a two-bedroom apartment:
a How many toilets are shown in the apartment?
b What type of door provides access to the second bedroom?
c Identify the feature represented by the abbreviation ‘STOR’ in the bedroom.
d Does the main bathroom contain a bathtub?
5 Consider the provided floor plan:
a Identify a piece of furniture shown in the living room.
b What appliance is indicated by the symbol in the laundry?
c What type of door connects the dining area to the patio?
d How many beds are shown on the plan?
Bed 2
Bed 1
Bath
Dining
Patio Living
6 A garden path has an actual length of 35 metres. Calculate its length on a plan with a scale of 1 : 250.
7 A designer is creating a plan for a rectangular kitchen using a scale of 1 : 50. The plan shows the kitchen is 7 cm wide. The client’s specifications require the kitchen to be at least 3.2 m wide to fit the appliances. According to the plan, does the kitchen meet the client’s specification? Show your calculations.
8 A developer is analysing a site plan for a new landscaping project. The plan has a scale of 1 : 300. On the plan, a rectangular block of land measures 10 cm by 15 cm:
a Determine the actual length and width of the block of land in metres.
b Calculate the actual area of the block of land in square metres.
c If the turf costs $22 per square metre, what is the total cost to turf the entire block?
9 A floor plan is to be created using CAD software with these specifications:
• Scale 1 : 100
• Actual room dimensions: 6 m × 8 m
• Door width: 90 cm
Calculate the dimensions to use in the drawing.
10 An existing plan with a scale of 1 : 200 is being modified using digital software. A room is to be extended by 3 metres. By how many centimetres should the room be extended on the digital plan?
11 A client brief requires a new house design to have four bedrooms, two toilets, a double garage for two cars, and a wardrobe in each room.
Identify two features of the plan that do not meet the client’s brief.
12 A rectangular patio area on a landscape plan measures 10 cm by 15 cm. The plan uses a scale of 1 : 50.
a Calculate the actual area of the patio in square metres.
b If paving costs $65 per square metre (including labour and materials), calculate the total cost to pave the patio.
Extend your thinking
13
14
A school playground is being designed using CAD software. The actual measurements are 40 m × 60 m. Various play areas need to be included, each taking up a certain percentage of the total space:
• Sports court: 40%
• Play equipment: 25%
• Seating area: 15%
• Green space: 20%
Using a scale of 1 : 200, calculate the area in square centimetres that each section should occupy on the digital plan.
A digital plan created at a 1 : 250 scale shows a rectangular building measuring 24 cm × 16 cm. The client requests to see the same plan at a 1 : 500 scale:
a Calculate the new dimensions.
b By what percentage has the plan area been reduced?
c If a 2 m wide pathway is to be added around the building, how wide should it be on both plans?
15 An architect’s plan for a residential property includes these symbols in its key:
Plan symbol key
Hidden feature (e.g., overhead)
Load-bearing wall
Door (showing swing)
a Explain the purpose of the symbols used for the door and the load-bearing wall.
b If the scale is 1 : 100, and a dashed line representing an overhead beam measures 5 cm on the plan, what does it represent in reality?
8.05 Maps and location
After this lesson, you will be able to…
• interpret information on maps, including keys, scale, direction, distance, coordinates and grid references
• use navigational software to plan routes
Maps and location
A map is a scaled-down representation of an area showing features like roads, rivers, mountains, and buildings. To accurately interpret a map, it is essential to understand its key elements.
The main features found on most maps include scale, direction, grid references, and a key.
Grid references
A system of numbered horizontal and vertical lines on a map that creates a grid, allowing for the precise location of any point using coordinates. Coordinates are expressed as pairs of numbers, with the horizontal value (easting) given before the vertical value (northing).
0 1 2 3 4 5
km A scale bar is a line segment that allows comparison of a measured map distance directly against a visual representation of real-world distance.
Cardinal directions (North, South, East, West) and intercardinal directions (Northeast, Southeast, Southwest, Northwest) are shown on a compass rose to provide orientation.
Map legend
Hospital School Park/Recreational area
Main road/Highway
A map key or legend explains the symbols, colours, and patterns used on the map. This enables the identification of features such as hospitals, parks, or types of roads.
Exploration
Apply map-reading skills to the provided map. This map includes a grid, a compass rose, a key, and a scale bar:
Answer these questions based on the map:
1. What feature is located at the grid reference B4?
2. What is the grid reference for the park?
3. Identify the direction of travel from the school to the library.
4. Using the scale bar, estimate the straight-line distance between the hospital and the park.
5. Describe a simple route using roads to travel from the school to the hospital.
A street directory index is an alphabetical list found at the back of a map book. It provides the specific map number and grid reference (e.g., 45 G10) for streets, suburbs, and points of interest.
Street name Suburb Map Grid
High St Epping 182 B4 Main Rd Ballarat 522 E11
Modern digital mapping and navigational software, like Google Maps or Apple Maps, extends these traditional features with interactive tools:
• Interactive scaling by zooming in or out.
• Automated route planning for different modes of transport.
• Real-time location tracking using GPS coordinates.
• Information layers that can be turned on or off, showing traffic, public transport lines, or satellite imagery.
Example 1
On a map with a scale ratio of 1 : 25 000, two points are 6 centimetres apart. Calculate the actual distance between these points in metres.
Create a strategy
To find the actual distance from a map measurement, multiply the map distance by the scale factor. Then, convert the result to the required unit.
Apply the idea
Calculate the actual distance in centimetres:
6 × 25 000 = 150 000 cm
Convert centimetres to metres by dividing by 100:
The actual distance between the points is 1500 metres.
Reflect and check
The answer is reasonable, as the actual distance should be significantly larger than the map distance. The conversion from centimetres to metres is also correct.
Example 2
A map’s scale bar shows that 2 centimetres represents 5 kilometres. Determine the scale ratio of the map.
Create a strategy
To find the scale ratio, first convert both measurements to the same unit. Then, write the ratio of the map distance to the actual distance and simplify it to the form 1 : n
Apply the idea
Convert 5 kilometres to centimetres (since 1 km = 100 000 cm):
5 × 100 000 = 500 000 cm
Write the ratio of map distance to actual distance: 2 cm : 500 000 cm
Simplify the ratio by dividing both sides by 2 to get the form 1 : n: 1 : 250 000
The scale ratio of the map is 1 : 250 000.
Reflect and check
This scale ratio means that one unit of distance on the map represents 250 000 of the same units in reality, which is consistent with the information from the scale bar.
Example 3
The image shows a route planned using navigational software:
min (4.2 km)
Describe the route from the start point to the destination and state the estimated travel time.
Create a strategy
Follow the highlighted path on the map from the start point to the destination. Use the compass rose to determine the directions of travel. Read the summary information provided by the software to find the estimated travel time.
Apply the idea
The route can be described with these steps:
• Start at the house and travel east along Oak Avenue.
• Turn left and travel north on Maple Drive.
• Turn right and travel east on Main Street to arrive at the library.
According to the information on the map, the estimated travel time is 9 minutes.
Reflect and check
Digital mapping tools provide clear, turn-by-turn directions. The estimated travel time often accounts for factors like traffic and speed limits, but actual travel time can vary.
Idea summary
Key ideas for interpreting maps and using navigational tools:
• A scale bar is a line segment that allows the comparison of a map measurement directly against a visual representation of the actual measurement.
• A map key or legend explains the symbols used on the map.
• A compass rose provides orientation with cardinal directions (North, South, East, West) and intercardinal directions (North-East, South-East, South-West, and North-West).
• Grid references and coordinates enable precise location identification.
• Digital navigation software combines these features for interactive route planning.
• In a physical street directory, an index is used to find a location. The index links a name to a map number and a grid square.
8.05 Practice questions
What do you remember?
1 Determine whether each statement is true or false:
a A scale of 1 : 50 000 is considered a larger scale than 1 : 100 000.
b A map with a scale of 1 : 25 000 will show a smaller land area than a map of the same physical size with a scale of 1 : 100 000.
c On a map with a scale of 1 : 10 000, objects (such as buildings) will appear larger than on a map with a scale of 1 : 50 000.
d A scale ratio of 5 : 1 indicates that the drawing is an enlargement of the actual object.
2 Complete each statement:
a On a map with a scale of 1 : 500 000, a distance of 1 cm represents an actual distance of ⬚ km.
b If a scale drawing of an insect is 10 : 1, the drawing is ⬚ times the size of the actual insect.
c To convert a distance from kilometres to centimetres, multiply the value in kilometres by ⬚
3 Use the map legend (key) provided to identify:
a The feature represented by a green flag symbol
b The symbol used to represent a hospital
Map legend
Hospital School Park/Recreational area
Main road/Highway
4 Calculate the actual measurements:
a Using a map scale of 1 : 15 000, the distance between two points on the map is found to be 20 cm.
b On a 1 : 50 000 scale map, two towns are 4 centimetres apart.
c A map uses a scale of 1 : 10 000. A distance of 12.5 cm is measured on the map.
d On a map with a scale ratio of 1 : 5000, a park boundary measures 9.5 centimetres.
e Two bus stops are separated by 15 cm on a map that has a scale ratio of 1 : 2000.
5 Express a scale ratio in the form 1 : n for each description:
a 3 cm represents an actual distance of 9 m
b 20 cm represents an actual distance of 16 km
c 8 mm represents an actual distance of 40 m
d 5 cm represents an actual distance of 30 km
6 On a map with a 1 : 2000 scale:
a Calculate the actual distance (in centimetres) between two points measured 19 cm apart on the map.
b Convert this distance into metres.
7 A landscape design uses a scale of 1 : 2000. If the actual distance between two features is 200 m, how far apart should they be drawn on the plan (in centimetres)?
8 Consider the town map:
a The scale bar shows 7 mm represents 100 m. Express this as a simplified scale ratio (1 : n), rounding n to the nearest whole number.
b In what compass direction is the park located from House B?
c Estimate the total driving distance (in metres) from House A to House C, following the roads shown on the map.
9 The grid map shows a suburb where each side of a small grid square represents 100 m:
a Adam is at the corner of Top Lane and Major Street. What is his grid reference?
b Carl’s house is located at grid reference B2. What is the compass direction from Adam’s house to Carl’s?
c Calculate the straight-line distance (“as the crow flies”) in metres between Adam’s house (E5) and Carl’s house (B2). Round the answer to the nearest metre.
10 The image shows a planned route from the Post Office to the Supermarket using a navigation application:
a Describe the route from the Post Office to the Supermarket using the street names and directions.
b Determine the total distance for this trip.
c Identify the estimated travel time.
11 A house floor plan has a scale of 1 : 200. A dining table is to be positioned at the point marked with an ×:
If the actual table is 175 cm long, what should its length be when drawn on the floor plan in millimetres?
12 An architect is designing a house that is 21 m long and 15 m wide:
a The plans must fit on an A1 sheet of paper (841 × 594 mm). Select a suitable, simple scale ratio (e.g., 1 : 20, 1 : 50, 1 : 100) and justify the choice.
b Using a scale of 1 : 50, if a hallway measures 12 cm on the plan, what is its actual length in metres?
Extend your thinking
13 A building plan with a scale of 1 : 90 is enlarged on a photocopier so that both its length and width are doubled:
a Calculate the new scale ratio for the enlarged plan.
b The scale bar on the original plan represents 5 m. When the plan is doubled, the printed scale bar also doubles in length. What actual distance does this new, longer scale bar represent?
14 Vincent is comparing the sizes of three different parks:
Scale: 1 : 2000
Scale: 1 : 5000
Scale: 1 : 7000
Justify which park has the largest area by calculating or estimating the actual area of each.
15 Consider the relationship between map scales and actual area:
a Mike has two maps with 8 mm squares drawn on them. The scales are 1 : 50 and 1 : 150. What is the ratio of the actual land areas represented by these squares?
b Explain how this ratio can be calculated using only the scale denominators a and b
Lesse Park Millenial Park
Tibsen Park
INVESTIGATION
Plan a day trip
Plan a day trip by interpreting maps and timetables, performing calculations involving time, distance, and cost, and communicating the plan in the form of a detailed itinerary.
Objectives
• To formulate a multi-stage plan by interpreting maps and timetables
• To use calculations involving time, distance, and costs
• To communicate the plan in the form of a detailed itinerary
Materials
• Calculator
• Ruler
• Downloadable assets
Sample Bus Timetable
Sample City Map
Maps and timetables
Map
A map is a visual representation of an area. It shows routes, distances, and locations. It often includes a scale to convert map distances to real-world distances.
Timetable
A timetable lists the times at which transport services arrive and depart. It helps in planning when to catch a bus, train, or other transport to reach destinations on time.
Calculations
Key calculations in trip planning include:
• Time differences
• Distances using speed x time
• Total costs including fares and other expenses
Examples of calculations:
• Distance = Speed × Time (e.g., if a bus travels at 50 km/h for 0.5 hours, distance = 25 km).
• Time duration: Subtract departure time from arrival time, considering hours and minutes.
• Cost: Add up fares, entrance fees, etc., and divide by the number of people if sharing.
Examine the downloadable sample bus timetable and city map.
Step 1 : Identify two locations on the map and estimate the distance between them using the scale.
Step 2 : Find a bus route that connects them and calculate the travel time based on the timetable.
Investigate
1. How do you convert map distances to real distances using the scale?
2. What factors might affect the actual travel time compared to the timetable?
Plan a simulated day trip
Day trip
A day trip involves leaving and returning on the same day. It requires careful planning to fit activities within the available time, considering transport, distances, and costs.
Multi-stage plan
Break the trip into stages: departure, travel to destination, activities, return.
Itinerary
An itinerary is a detailed schedule outlining times, locations, and activities. Use the sample map and timetable to plan a trip from a starting point to two attractions.
Step 1 : Choose a starting location and two destinations on the map.
Step 2 : Use the timetable to find transport options and calculate times and distances.
1. What is the total distance for the round trip?
2. How much time is needed for travel, assuming average speeds?
Step 3 : Estimate costs for transport and activities.
What is the total cost per person?
Investigate
1. How can you optimise the route to minimise time or cost?
2. What creative activities can you include at the destinations?
3. If the budget is limited, how would you adjust the plan?
Create the itinerary
Communication
Present the plan clearly in an itinerary format, including times, locations, durations, and costs.
An effective itinerary is detailed, realistic, and allows for flexibility.
Draft the itinerary.
• List stages with start/end times.
• Include calculations for each part.
• Add notes on potential issues.
Investigate
1. How does your itinerary connect to real-world applications?
2. What mathematical ideas did you use creatively?
Discussion
1. Why is planning important for a successful day trip?
2. How did collaborating with others improve your plan?
3. Can you think of other situations where these skills are useful?
INVESTIGATION
Design a package
Investigate the principles of packaging design by creating a prototype package for a new product, balancing practical needs with material efficiency.
Objectives
• To formulate design specifications for a practical purpose
• To create a 2D plan or net for a 3D object using an appropriate scale
• To calculate relevant measurements like surface area and volume for the design and use them to justify choices
Materials
• Grid paper
• Scissors
• Tape or glue
• Calculator
• A small cylindrical object to represent the product (e.g., a glue stick, a small candle, a lip balm tube).
The design challenge
The scenario
A local company, ‘Natural glow cosmetics’, needs assistance. They have created a new, premium lip balm. It is a perfect cylinder with a diameter of 2 cm and a height of 5 cm. They need a unique, eye-catching package to sell it in. The challenge is to design and build a prototype for this package.
The Design brief
The design must meet these specifications:
• Protection: The package must fully enclose the cylindrical lip balm. The product should fit snugly so it does not move around too much.
• Efficiency: Natural glow cosmetics wants to be environmentally friendly and save money on materials. The design should use as little cardboard as possible.
• Appeal: The package should look interesting on a shelf. A standard rectangular box is functional but boring. Be creative!
Key concepts
Successful completion requires the knowledge of:
• Nets: The 2D patterns that can be folded to create the 3D package. Don’t forget to include tabs for gluing!
• Surface area: The total area of the net. Minimising this value is key to meeting the ‘efficiency’ specification.
• Volume: The amount of space inside the package. This will tell how well the product fits and how much ‘wasted’ space there is.
Step 1 : Brainstorm and sketch
With a partner, brainstorm at least two different 3D shapes that could hold the cylindrical lip balm (diameter 2 cm, height 5 cm). Think beyond a simple rectangular prism. Consider a triangular prism, a different cylinder, or even a hexagonal prism. Sketch the ideas.
Step 2 : Select and plan
Choose the most promising design from brainstorming. On a piece of paper, determine the minimum dimensions the package needs to enclose the cylinder. For example, a rectangular prism would need to be at least 2 cm × 2 cm × 5 cm.
Step 3 : Draw the net
On grid paper, use a ruler to carefully draw the net for the chosen design using the dimensions decided on. Use a scale if needed (e.g., 2 grid squares = 1 cm).
Remember to add small tabs to the edges for taping or gluing.
Step 4 : Calculate and analyse
Before cutting anything out, calculate the total surface area (in cm2) and the volume (in cm3) of the proposed package. Record these values.
Step 5 : Build the prototype
Carefully cut out the net, fold along the lines, and use tape or glue to construct the 3D package. Check if the product (or model object) fits inside as planned.
Investigate
1. Which 3D shape did you choose for your package? Explain how your choice addresses the three points in the design brief (protection, efficiency, and appeal).
2. What is the total surface area of your package? Compare this with a simple 2 cm × 2 cm × 5 cm rectangular prism. Is your design more or less material-efficient? (The surface area of this prism is 2 × (2 × 2 + 2 × 5 + 2 × 5) = 48 cm2)
3. The volume of the cylindrical lip balm is about 15.71 cm3. What is the volume of your package? How much “empty” air space is there? Why might a company want to minimise empty space?
4. What was the most challenging part of designing your package? (e.g., visualising the net, getting the dimensions right, calculating the surface area of a complex shape).
5. If you could redesign your package, what would you change to make it even better or more efficient?
Discussion
1. What is the connection between the 2D net and the 3D object’s surface area? Why is this measurement so important in manufacturing and design?
2. Compare your final prototype with those from other groups. What different shapes were successful? Was there one shape that seemed to be the most material-efficient overall?
3. Packaging is all around us. Think about a product you use regularly. What shape is its package, and why do you think the designers chose that shape? Consider factors like stacking on shelves, shipping, and branding.
Chapter review
1 Complete the table with the correct notation for each geometric description using points P and Q:
Description
Notation
A line passing through P and Q ⬚
A ray starting at P and passing through Q ⬚
The line segment connecting P and Q ⬚
The distance between P and Q ⬚
2 Consider a regular hexagon labelled with vertices A through F in clockwise order:
a Identify a pair of adjacent vertices.
b Is the line segment connecting vertex A to vertex C a side or a diagonal?
c How many diagonals can be drawn from a single vertex of the hexagon?
3 For a hexagonal pyramid, determine the number of:
a Faces b Edges c Vertices
4 Describe the geometric features of a standard cone:
a How many flat faces does it have?
b How many vertices does it have?
c How many curved surfaces does it have?
5 A triangle has angle measurements of 90°, 45°, and 45°. Classify this triangle by both its angles and its sides.
6 Identify the type of triangle with angles measuring 110°, 40°, and 30°. Use precise geometric language.
7 Determine the quadrilateral that has two pairs of adjacent equal-length sides but no parallel sides. Identify one property regarding its diagonals.
8 Identify the properties of a rectangle regarding its diagonals and rotational symmetry.
9 Compare a square and a rhombus. Identify one similarity regarding their sides and one difference regarding their angles.
10 Calculate the number of faces, edges, and vertices in an octagonal prism.
11 A 3D object has 5 faces, 9 edges, and 6 vertices. Its two bases are triangles. Identify this object.
12 Identify which nets can fold to form a cube:
13 Describe the number and shapes of the 2D faces required to draw a net for a triangular prism.
14 On a site plan with a scale of 1 : 500, a fence line measures 12 cm. Calculate the actual length of the fence in metres.
15 A driveway is 15 m long in reality. How long should it be drawn on a plan with a scale of 1 : 100?
16 An object has an actual length of 20 m. Calculate its length on a plan for each scale: a 1 : 50 b 1 : 200
17 A plan uses a scale of 1 : 50. On the plan, a hallway is drawn 2.5 cm wide. Building regulations require the hallway to be at least 1.1 m wide. Does this hallway meet the regulations? Show your calculation.
18 A model diagram of a storage box has a scale of 1 : 25. The dimensions of the model are shown in the diagram.
Calculate the actual length, width, and height of the storage box in metres.
19 A floor plan for a rectangular shed shows dimensions of 6 m by 4 m. A concrete slab 150 mm deep is required for the foundation: 4 m 6 m
a Calculate the volume of concrete required for the slab in cubic metres.
b Concrete costs $240 per cubic metre. Calculate the total cost for the concrete.
20 A map’s scale bar indicates that 2 cm represents 10 km. Determine the scale ratio of the map in the form 1 : n
21 A winding river on a map measures 12 cm in length. The map scale is 1 : 50 000. Calculate the actual length of the river in kilometres.
22 A navigation application shows a route from Home to the Library:
a Determine the total distance of the trip based on the map description.
b If the estimated time is 8 minutes and you leave at 10:00 a.m., what is the arrival time?
1.01 Integers
Answers
What do you remember?
1 a False b True c True d False
2 60 ÷ (8 5) + 3 × 42 = 60 ÷ 3 + 3 × 42
Evaluate (8 5)
= 60 ÷ 3 + 3 × 16
Evaluate 42
= 20 + 3 × 16
Evaluate the division
= 20 + 48
Evaluate the multiplication = 68
Evaluate the addition
3 a 100 b 300 c 400
4 a False b False c True
Practice
5 a 9 b 4 c 26 d 41
6 a 3 b 7 c 15 d 15
e 0 f 3
7 a 36 b 56 c 30 d 60
e 25 f 8
8 a 4 b 7 c 9 d 10
9 a 6 b 6 c 14 d
15 a i 90 + 50 ii 140
b i 80 30 ii 50
c i 40 × 20 ii 800
d i 350 × 30 ii 10 500
16 a i 800 200 ii 600
b i 600 + 300 ii 900
c i 400 × 7 ii 2800
d i 900 ÷ 3 ii 300
17 a i 9000 + 6000 ii 15 000
b i 8000 3000 ii 5000
18 a Yes b Yes c No d No
19 a 4710 + 3288 ≈ 5000 + 3000
≈ 8000
b 7950 1890 ≈ 8000 2000
≈ 6000
c 585 × 41 ≈ 600 × 40
≈ 24 000
d 5610 ÷ 78 ≈ 6000 ÷ 80
≈ 75
20 a This is not a reasonable solution. Fuel was used during the journey; therefore, the amount of fuel remaining in the tank must be less than the starting amount of 60 litres. 85 litres is more than the tank can hold.
b This is not a reasonable solution. It is impossible for a fuel tank to contain a negative amount of fuel.
c This is a reasonable solution. The amount of fuel remaining, 35 litres, is less than the starting amount of 60 litres, which makes sense as fuel was used. The calculation correctly subtracts the used fuel from the starting amount.
Extend your thinking
21 a 670 + 350 + 60 = 1080
b 700 + 300 + 100 = 1100
c 1075
d Rounding to the nearest ten gives an estimate of 1080, which is 5 away from the exact answer. Rounding to the nearest hundred gives an estimate of 1100, which is 25 away. Therefore, the estimate found by rounding to the nearest ten is more accurate.
22 a 11 b 9
c Answers may vary. One possible answer is CARL: 5 + 4 + ( 7) + ( 2) = 10
d 25
23 a 30 4 × 5 ÷ (5 3) = 20
b (23 10) × 3 + 8 × 9 2 = 109
24 a Overestimate. Both numbers are rounded up (58 becomes 60, and 89 becomes 90). Since both parts of the sum are increased, the estimated total will be larger than the exact total.
b Underestimate. Both numbers are rounded down (417 becomes 400, and 235 becomes 200). Since both parts of the sum are decreased, the estimated total will be smaller than the exact total.
c Overestimate. The first number is rounded up (781 becomes 800), and the number being subtracted is rounded down (124 becomes 100). Increasing the starting value and decreasing the amount subtracted will both result in a larger final answer.
d Underestimate. 645 is rounded down to 600 (a decrease of 45), while 280 is rounded up to 300 (an increase of 20). Since the amount of the decrease ( 45) is greater than the amount of the increase (+20), the net effect is a decrease, resulting in an underestimate.
1.02 Fractions and decimals
Extend your thinking 21 cups or 2.625 cups
22 There are 40 students and 37.5% are boys.
23
1.03 Ratios and proportions
What do you remember? 1 a 8 : 11 b 25 : 31 c 9 : 14 d 18 : 25
a b 3 a 7 parts b c
7 a i 45 minutes to 120 minutes
ii 3 : 8
b i 40 seconds to 240 seconds
ii 1 : 6
c i 500 metres to 1500 metres
ii 1 : 3
d i 8 hours to 72 hours
ii 1 : 9
8 a 3 : 1 = 9 : 3 b 3 : 5 = 9 : 15
c 4 : 12 = 1 : 3 d 10 : 5 = 6 : 3
e 5 : 4 = 10 : 8 f 7 : 5 = 21 : 15
g 12 : 18 = 2 : 3 h 6 : 12 = 4 : 8
9 The actual distance is 2 km.
10 8 eggs
11 a 9 b 17 c 21 d 90
e 12 f 16 g 17 h 350
12 a The two parts are 15 and 35.
b The two parts are 6 kg and 30 kg.
c The two parts are $70 and $50.
13 a The three parts are 10, 20, and 30.
b The three parts are 10 L, 4 L, and 14 L.
14 a b 250 mL c 150 mL
15 $20
16 900 students
17 a 20 kg b 40 kg c 80 kg
18 a $150 b $90 c $60
19 a 500 mL b 250 mL c 50 mL
20
• First piece: 2 × 4 = 8 metres
• Second piece: 3 × 4 = 12 metres
• Third piece: 1 × 4 = 4 metres
21
• First colour: 3 × 3 = 9 litres
• Second colour: 2 × 3 = 6 litres
• Third colour: 1 × 3 = 3 litres
22
• Furniture: 20 hours
• Repairs: 12 hours
• Custom work: 8 hours
23 45 cookies
24 The weight of the apples in the fruit salad is 200 grams.
Extend your thinking
25 The gardener will need 20 kg of nitrogen.
26 30
27 5 : 12 : 15
1.04 Rates
What do you remember?
1 a No b Yes c No d Yes
e No
2 The compound unit for the rate is degrees Celsius per hour, which can be written as °C/h.
3 a True b False c True d False
4 a Distance (in kilometres) and fuel volume (in litres)
b 540 : 45
c 12 km/L
6 a cupcakes per hour b 40 cupcakes/hour
7 a 90 calories/serving b $15/ticket
c 80 beats/minute d 15 km/L
8 a $30/hour b $38/hour
9 90 km/h
10 720 pages
11 $6.00/kg
12 $0.003/mL
13 2.4 L/min
14 $0.70 per 100 g
15 Store A: $2.70 per 100 g
Store B: $2.50 per 100 g
Store B is the better buy.
16 2.5 hours
17 15 hours
18 $395 AUD
19 420 minutes or 7 hours
Extend your thinking
20 11.25 km
21 a Estimated time = = 3.1 hours
b Exact time = = 3.26 hours
c The estimate of 3.1 hours is close to the exact value of 3.26 hours; therefore, it is reasonable.
22 $129 per hour
23 Noah earns $32 more than Liam each week.
1.05 Percentages
What do you remember?
1 a 40, 4 b 25, 1 c 60, 3 d 90, 9
2 C
3 a
b 0.4 × 120 = 48
c Add, because the original value is being increased.
d 120 + 48 = 168
4 a 0.15
b 0.15 × 80 = 12
c Subtract, because the original value is being decreased.
d 80 12 = 68
Practice
5 a 40 b 30 c 70 d 48 e 20 f 60 g 35 h 190
6 $9.00
7 The current value is $120.
8 There were 12 000 visitors this year.
9 a 1.05 b 1.45 c 1.082 d 2.25
10 a 0.97 b 0.75 c 0.5 d 0.12
11 a 125%
b 1.25 × 80 = 100 litres
12 a 115%
b 1.15 × $60 = $69
13 a 132 b 60 c 104 d 200
$265 f $55 000 g 210 kg h 450 L 14 a 81 b 120 c 48 d 300 e $245 f $68 000 g 171 m h 350 g
15 The new value of the gold coin is $540.
16 $300
$60 18 20%
19 The original price of the jacket was $150.
20 The original salary was $52 000.
Extend your thinking
24.5 km
Decimal: 0.375, Percentage: 37.5%
16 metres 15 The shares are $240, $180, and $120.
18 90 km/h
19 The 1 kg bag is the better buy at $3.00 per 100 g, compared to the 400 g bag at $3.20 per 100 g.
20 3.5 hours
2.01 Data types
What do you remember?
1 a iii b iv c i d ii
2 a False b True c True d False
3 B Practice
4 a Categorical blood types are labels (A, B, AB, O).
b Numerical distance is a measurable quantity.
c Categorical student ID numbers are labels, not quantities.
d Numerical number of pets is a countable quantity.
5 a Numerical can take any value within a range.
b Categorical serves as an identifier.
c Numerical counted in whole numbers.
d Categorical describes an attribute without order.
6 a Ordinal star ratings have a clear order.
b Nominal colours have no natural order.
c Ordinal agreement levels have a progression.
d Nominal transportation types have no inherent order.
7 a Ordinal military ranks have a clear hierarchy.
b Nominal hair colours have no natural order.
c Ordinal education levels have a progression.
d Nominal brand names have no inherent order.
8 a Categorical (Nominal) jersey numbers are identifiers.
b Numerical (Continuous) time can be measured to any precision.
c Categorical (Ordinal) medals have a clear ranking.
d Numerical (Discrete) fouls are counted in whole numbers.
9 a Continuous time can be measured to any precision.
b Discrete books are counted in whole numbers.
c Continuous weight can take any value within a range.
d Discrete siblings are counted in whole numbers.
10 a Continuous plant height can be any value.
b Discrete emails are counted in whole numbers.
c Continuous volume can take any value.
d Discrete pages are counted in whole numbers.
Extend your thinking
11
• Daily rainfall amounts: Numerical (Continuous) can take any value.
• Weather conditions: Categorical (Nominal) descriptive labels without order.
• Number of storms: Numerical (Discrete) counted in whole numbers.
• Storm intensity: Categorical (Ordinal) has a natural progression.
• Time between storms: Numerical (Continuous) can be any time value.
The explanation should note that while both rainfall and storm intensity describe similar phenomena, rainfall is measured precisely (continuous numerical) while intensity uses ordered categories (ordinal categorical).
12 Numerical Data:
• Continuous: Body temperature, Blood pressure
• Discrete: Number of medications
Categorical Data:
• Nominal: Patient ID numbers, Room numbers
• Ordinal: Pain level (1-10)
Debatable cases:
• Room numbers could be considered ordinal if they reflect floor levels or wing organisation
• Blood pressure involves two numbers but is treated as continuous
• Pain scale could be argued as continuous if allowing decimal values
13 Initial classification:
• Steps per day: Numerical (Discrete)
• GPS coordinates: Numerical (Continuous)
• Heart rate: Numerical (Discrete when counted in beats, Continuous when measured instantly)
• Workout intensity: Categorical (Ordinal)
• Exercise types: Categorical (Nominal)
• Achievement badges: Categorical (Ordinal if representing progression, Nominal if independent)
Alternative uses:
• Heart rate could be categorical if grouped into zones (Low/Normal/High)
• Steps could be categorical if grouped into activity levels
• GPS could be categorical if converted to location names
The classification depends on how the data is used in analysis
2.02 Data collection
1
Practice
4 a Observation b Existing records
c Survey d Experiment
e Observation f Observation
g Survey h Existing records
5 1600 students
6 22 400 votes
7 1800 residents
8 a 200 bulbs
b Testing light bulbs for faults often involves using them until they fail (destructive testing). If a census were performed, every single bulb would be destroyed or used, leaving none to sell. Even if non-destructive, testing 10 000 bulbs would be extremely time-consuming and expensive.
9 School assembly: Census
• Complete accuracy is required.
• The population is contained and accessible.
• There may be a legal requirement for student safety.
Movie preferences: Sample
• The population is very large and spread across multiple locations.
• Perfect accuracy is not required.
• Time and cost constraints make a census impractical.
Extend your thinking
10 A good method would be a survey. The committee could create a questionnaire for students, teachers, and parents asking them to rank their preference between library books and sports equipment. This is appropriate because it directly gathers opinions from all the key stakeholders (the people who will use the resources). It allows the P&C to make a decision based on what the school community actually wants, rather than just guessing.
11 Two potential issues are:
• Location Bias: By surveying students from only one school in one city, the sample may not be representative of all Australian high school students. Students in rural areas, other cities, or from different socioeconomic backgrounds might have different preferences.
• Self-Selection Bias: Not every student leaving the school will agree to participate. It’s possible that only students with strong opinions (either positive or negative) or those with extra time will respond, which would not reflect the views of the average student.
12 Method B (Observation) would provide more accurate data. In a survey (Method A), people are likely to lie and say they wash their hands because it is the socially acceptable thing to do (this is called social desirability bias).
Observation captures the actual behaviour as it happens, rather than what people claim they do.
2.03 Display categorical data
Vanilla is the most popular flavour with 4 sales.
6 a A bar chart would be better for shareholders as it provides a quick visual comparison of trends and patterns in monthly sales.
b A frequency table is more suitable for inventory as it provides precise numerical counts and is easier to reference for exact values.
c A bar chart is ideal for comparing population sizes as it gives an immediate visual understanding of the relative differences between cities. 7
9 a Sport is the most popular activity, as it has the tallest bar with a frequency of 18.
b Reading the height of the ‘Gaming’ bar, 15 students chose it as their favourite activity.
c Sport was chosen by 18 students and Reading by 7 students. The difference is 18 7 = 11 students.
d The total number of students is the sum of the frequencies for each category: 18 + 11 + 7 + 15 = 51 students.
Extend your thinking
8
12
15
7
3
45 16 14 12 10 8 6 4 2 0 A B C D F Grade Number of students Student grade distribution 25 20 15 10 5 0 Bus Car Walk Bicycle Method Number of students Student transportation methods
Total students: 15 + 22 + 8 + 5 = 50
Percentages:
Bus: × 100 = 30%
Car: × 100 = 44%
Walk: × 100 = 16%
Bicycle: × 100 = 10% Grade Frequency
Sports participation by skill level
12 A good solution is to use a stacked bar chart. Each sport would be represented by a single bar. This bar would be divided into three coloured sections, with each colour representing a skill level (e.g., blue for Beginner, light green for Intermediate, purple for Advanced). A legend would explain the colours. This allows for easy visual comparison of both the total number of participants in each sport (the total height of the bar) and the proportion of students at each skill level within that sport. 13
Favourite fruits survey results Number of responses
Relative Frequencies:
Apples: = 0.30
Bananas: = 0.20
Oranges: ≈ 0.17
Grapes: ≈ 0.13
Other: = 0.20 30 25 20 15 10 5 0 Soccer Basketball Sports Tennis Advanced Beginner Intermediate Number of students
Fruit
14 The mathematical inaccuracy is that the sum of the individual frequencies does not match the stated total.
Calculation: 35 + 28 + 42 + 15 = 120
The ‘Total’ row in the table should be corrected to 120, not 125. To ensure accuracy, the original data should be re-counted.
2.04 Display numerical data
What do you remember?
Package weights
b The highest frequency is 8, which corresponds to the class interval 26 ≤ x < 29 kg.
8 a The modal class is the interval with the highest frequency. The bar for the 5 ≤ x < 10 minute interval is the tallest, so the modal class is 5 ≤ x < 10 minutes.
b To determine the total number of students, add the frequencies of all the bars: 4 + 8 + 5 + 2 = 19 students.
c The students who completed the puzzle in less than 10 minutes are in the 0 5 minute interval and the 5 10 minute interval. Add the frequencies for these two intervals: 4 + 8 = 12 students.
9 a The distribution is skewed right.
b This shape indicates that the majority of people at the fair were younger, with a large number of children and teenagers (the high bars on the left). There were progressively fewer people in the older age groups (the ‘tail’ of the graph extends to the right).
10 The choice depends on the size of the dataset. For a typical class size (e.g., 25 students), a stem plot is most appropriate as it shows the shape of the distribution while preserving all individual scores. For a very large dataset (e.g., all Year 12 students in a state), a histogram would be better as it summarises the overall pattern without being cluttered by individual data points.
22 23 24
Running times (in minutes) 25 26
Test scores
8 5 8 7 6 9 9 2 5 1 3 0
Key 8∣5 = 85 points
Extend your thinking
13 For Class A (15 students), a dot plot is appropriate as it clearly shows the frequency of each individual score in a small dataset. For Class B (25 students), a histogram is better because the dataset is larger, and grouping data into intervals will show the distribution shape more effectively than a cluttered dot plot. To compare them, both displays should be drawn one above the other using the exact same horizontal scale (from 65 to 95) for a direct visual comparison of their shapes, centres, and spreads.
14 The best choice for comparing two related, small-to-medium datasets is a back-to-back stem plot. It allows for a direct, side-by-side comparison of the distributions for both years while preserving the individual monthly data values. It is also suitable for the total number of data points (24).
Monthly rainfall (mm) Year 1 Year 2 8 5 4 2 8 5
0 5 9 8 2 5 0 5 2 3
15 The best approach is to use a histogram. Grouping the data into class intervals handles the inconsistent precision. For example, an interval of 2000 ≤ x < 3000 steps will capture all values in that range, regardless of how they were rounded.
A histogram is the most robust choice as it effectively summarises the distribution of a larger dataset and is not sensitive to the varying levels of precision in the recorded data.
2.05 Measures of centre
What do you remember?
1 a average b middle c frequent
2 a True b True c False d False
4 a 10 mm b 77.2 c $22.20
5 a i 20 ii 18 and 22 b i 49 ii 50
6 a i 94.6 ii 94 iii 94
b i 18.4 ii 19 iii No mode
c i 28 ii 28 iii 24 and 28
7 Ordered data: 31, 33, 35, 35, 36, 38. The median is the average of the two middle values: = 35.
8 The mode is Apple, as it appears 3 times.
9 The outlier is 98, as it is significantly larger than the other values.
10 Mean: $97 800. Median: $61 000. The median is a better representation. The mean is skewed higher by the outlier salary of $250 000. The median is not affected by this extreme value and gives a more accurate picture of a typical salary.
Extend your thinking
11 Sum = Mean × Number of values = 12 × 8 = 96.
12 Let the fifth number be x. The sum of the numbers is 5 × 20 = 100. The sum of the four known numbers is 15 + 18 + 22 + 24 = 79. Therefore, x = 100 79 = 21.
13 Since the Mean > Median > Mode, the distribution is positively skewed (or skewed to the right). This indicates that there are some higher values pulling the mean up, creating a tail on the right side of the distribution.
14 Original total score = 30 × 82 = 2460. New total score = 32 × 83 = 2656. The sum of the two new scores is the difference: 2656 2460 = 196.
2.06 Measures of spread
What do you remember?
1 a spread b maximum, minimum c quartiles
2 a True b False c False d True
3 The range is 15.
Practice
4 a 2.5°C b $67 000 c 2.0 mm
5 a i Range: 27 ii IQR: 15.5
b i Range: 13 ii IQR: 6
c i Range: 28 ii IQR: 12
d i Range: 23 ii IQR: 12.5
6 a Q1 = 20, Q3 = 25. IQR = 5
b Q1 = 7.5, Q3 = 13.5. IQR = 6
7 a i Range: 19 kg ii IQR: 12 kg
b i Range: 28 minutes ii IQR: 18 minutes
8 Maximum = Minimum + Range = 14 + 32 = 46
9 Class A: IQR = 85 70 = 15
Class B: IQR = 85 65 = 20 Class B has a larger IQR, so it shows more spread.
Extend your thinking
10 a Range: 23, IQR: 4
b The range (23) is much larger than the IQR (4) because the range is heavily influenced by the outlier value of 35. The IQR, which measures the spread of the middle 50% of the data, shows that the central values are actually very closely clustered. This demonstrates why IQR is often a more reliable measure of spread for datasets with outliers.
11 The IQR better represents the difference. Group 1 has an IQR of 10 cm, while Group 2 has an IQR of 20 cm. This shows that the middle 50% of Group 2 is twice as spread out as Group 1. The range (18 cm vs 24 cm) does not capture this significant difference in consistency as clearly.
2.07 Introduction to probability
What do you remember?
1 a Impossible b Even chance c Certain
5 a The probability is 0.6. Since this is greater than 0.5, the event is ‘likely’.
b The probability is 1 0.6 = 0.4. Since this is less than 0.5, the event is ‘unlikely’.
6 All 6 outcomes are less than 7. The probability is = 1. The event is ‘certain’.
7 Fraction: . Decimal: 0.25. Percentage: 25%.
8 a 1 0.3 = 0.7
b Unlikely (since 0.3 is less than 0.5).
9 Probability = = 0.25. Since the probability is less than 0.5, it is ‘unlikely’.
b No. If the sections were equal, the theoretical probability for each would be approx 33.3%. The experimental probabilities of 40%, 30%, and 30% suggest the red section is larger than the other two.
17 a The missing bottom row is: 7, 8, 9, 10, 11, 12.
b There are 6 ways to get a sum of 7 out of 36 total outcomes. P (Sum of 7) = .
c The sums greater than 10 are 11 (2 times) and 12 (1 time). P (Sum > 10) =
18 a There are 18 even sums out of 36 possible outcomes. P (even) = = 0.5.
4 A sample is more appropriate because the population is too large and widespread to survey every individual, which would be too costly and time-consuming. A well-selected sample can provide a reliable estimate.
5 a
Frequency
b The modal colour is Blue.
6 A bar chart would be more effective as it allows for a quick visual comparison of the popularity of each coffee type.
Art Club Coding
8 a Comedy b There are 12 more students who chose Comedy than Drama.
12 A histogram is most appropriate. For a large dataset, a dot plot or stem plot would be too cluttered. A histogram effectively summarises the distribution of the data by grouping prices into intervals.
13 a Mean: $89 600
Median: $59 000
Mode: No mode
b The median is a better representation. The mean is significantly inflated by the outlier income of $220 000, making it not typical. The median is not affected by the outlier and better reflects the central income value.
14 5.6
15 The new value is an outlier, so it will increase the mean. The original median is 90. The new median of 11 values is 90. So, the mean will increase, but the median will not change.
16 $150
17 Range: 15 IQR: 9
18 8
19 Range: 24 IQR: 15.5
20 Dataset B has a greater spread in its middle 50% because its IQR is larger.
21 A 75% chance of rain is ‘likely’ to occur.
22 All six outcomes are positive integers. The probability is 1. The event is ‘certain’.
23 a i ii 0.5 iii 50%
b P (Red or Green) =
24 a Experimental probability 0.2
b The theoretical probability is approximately ≈ 0.167. The experimental probability of 0.2 is slightly higher than the theoretical probability.
1
(on time) = $800 b Total cost (missed one payment) = $815 12 a GST component = $35.00
GST-exclusive amount = $350.00
3.03
Taxation
remember? 1 a Gross income
Deductions (or allowable deductions)
The taxable income and gross income are the same (equal).
Extend your thinking
11
• For $30 000: Tax paid is approximately 8.29% of gross income.
• For $60 000: Tax paid is approximately 16.65% of gross income.
• For $90 000: Tax paid is approximately 21.76% of gross income.
• For $120 000: Tax paid is approximately 24.32% of gross income.
As gross income increases, the proportion of income paid in tax (the effective tax rate) also increases. This demonstrates the progressive nature of the Australian tax system, where higher earners contribute a larger percentage of their income to tax. 12 13.61%
13 For $45 000:
• Income tax = $4288
• Medicare levy = $900
• Total tax = $5188
• Effective tax rate ≈ 11.53% For $85 000:
• Income tax = $16 288
• Medicare levy = $1700
• Total tax = $17 988
• Effective tax rate ≈ 21.16% For $120 000:
• Income tax = $26 788
• Medicare levy = $2400
• Total tax = $29 188
• Effective tax rate ≈ 24.32%
3.04 Superannuation
What do you remember?
1 a ii b iv c iii d i
2 a Increase (because the 12% is calculated on a higher gross income).
b Possible reasons include investment losses (negative earnings) or the deduction of fees or insurance premiums.
14 $90 350
15 a $17 893 b $32 388
16 $5670
17 $11 040
18 $174
19 $131 150
20 $1870
21 a Ordinary pay: $600
Overtime rate: $36.00
Overtime pay: $288
Total pay: $888
b $106.56
4.01 Metric units and conversions
What do you remember?
1 a ii b iv c i d iii
2 a False. The metric system is based on powers of 10.
b True
c False. When the unit gets smaller, the number gets larger (e.g., 1 km = 1000 m).
3 Missing prefix: centiMissing symbol: m Practice
4 a B b A c B d C 5 C 6 2000 mL
7 a Metric b Not metric
c Not metric d Metric
e Not metric f Metric
g Not metric h Metric
8 a metres b kilolitres
c tonnes
d millimetres
e millilitres
f grams or kilograms
9 4700 m
10 a 750 cm b 3.5 m c 3200 m d 4.5 cm 11 a 4.2 kg b 1800 g c 500 kg d 0.25 g
12 a 2.5 L b 250 L c 4200 mL d 1.5 kL
13 a 210 minutes b 2 hours c 3 minutes d 48 hours
1.75 L
Extend your thinking
10 m2
9000 seconds
4.5 kg
1.5 m2 4.02 Perimeter
What do you remember?
1 a True b True c False d True 2 Nonagon 3 d = 2r Practice
4 a 50 mm b 160 mm c 54 cm d 60 m
5 a 20 m b 20 m c 25 stones
6 a Shape A: 84 cm, Shape B: 88 cm b Shape B is larger by 4 cm.
1.5 m
Extend your thinking
16 2.73 cm
17 a 184 m b $4710.40
18 a 31.42 m b 43.98 m
4.03 Area
What do you remember?
1 a i b iv c ii d iii
2 a perpendicular (or at right angles)
b 2 (two)
c square (e.g., m2)
3 B
Practice
4 a 40 cm2 b 150 m2
c 4500 m2 d 105 cm2
5 a 36 m2 b 144 cm2
c 900 cm2 d 40 000 m2
6 a 15 cm2 b 24 cm2
c 18 cm2 d 1125 cm2
7 6.75 m2
8 15 m2
9 96 cm2
10 a 104 m2 b 64 cm2
11 a 135 mm2 b 165 mm2
12 55 m2
13 a 48 m2 b 14.14 m2 c 62.14 m2
14 706.86 cm2
15 2.54 m2
Extend your thinking
16 s = 8 cm
17 h = 6 m
18 d = 2.99 m 19 19 m2
20 25.92 m2
4.04 Surface area
What do you remember?
1 a ii b i c iii
2 B
3 a Cube
b Rectangular prism
c Cylinder
d Open-top cylinder
Practice
4 a 1550 cm2 b 1160 cm2
5 294 cm2
6 19 600 cm2
7 156 cm2
8 163.85 cm2
9 a 402.12 cm2 b 35.44 m2
10 a 241.90 cm2 b 318.87 cm2
11 a 138.23 m2
b The base is in direct contact with the concrete pad or ground and is not an exposed exterior surface that requires painting.
12 1000 cm2
Extend your thinking
13 s = 4 cm
14 a 4.4 m2 b $66
15 5 tins
4.05 Scales and instruments
What do you remember? 1 a iv b i c iii d ii 2 False
3 major, divisions
Practice
4 Approximately 7.65 cm or 76.5 mm.
5 275 g
6 22 °C
7 12.5 L
8 a 283.5 g
b The true mass is between 283.0 g and 284.0 g.
9 a 45 L b 1.44 tanks
10 a Reading at eye level prevents parallax error. If the student looks from above, the reading will appear higher than the true value; if from below, it will appear lower. Reading at the bottom of the meniscus at eye level ensures accuracy.
b 2 mL c 66 mL d 19 mL
Extend your thinking
11 The best estimate is the average of the readings: (37.8 + 38.1 + 37.9) ÷ 3 ≈ 37.93 °C. Rounding to one decimal place, consistent with the thermometers, gives 37.9 °C. Averaging multiple readings is a useful method because it helps to minimise the effect of random errors, providing a more reliable estimate of the true value.
12 The car can travel between 125 km and 187.5 km.
4.06 Volume and capacity
What do you remember?
1 a iii b iv c i d ii
2 a 1 b 1000
3 C Practice
4 a 720 mm3 b 2250 cm3 c 276 cm3 d 32 cm3
5 a A = 1.08 m2 b V = 2.7 m3
6 V = 240 cm3
7 V = 300 cm3
8 Volume: 942.48 cm3
Capacity: 942.48 mL
9 33 510 cm3
10 The capacity is 14 137 L.
11 h = 20 cm
12 a 4800 cm3
b i 16 200 cm3 ii No
13 V = 2827.43 mL
Extend your thinking
14 360 cm3
15 96 m3
16 45 L
4.07 Time and timetables
What do you remember?
1 a iii b iv c i d ii
2 a True b False c True d False
3 column, row
Practice
4 a 15:45 b 11:20 c 2:15 p.m. d 8:30 p.m.
5 1 hour 35 minutes
6 45 minutes
7 a Maths b 45 minutes c 6 hours and 30 minutes d 1:00 p.m.
8 40 minutes
9 a 17 minutes b 2 minutes c 09:35 a.m.
10 Yes, the connection is possible. There is an extra 45 minutes available for transit.
11 55 minutes
12 7:53 a.m.
13 a 6:25 p.m.
b 1 hour and 22 minutes
c 5:48 p.m.
d 1 hour and 59 minutes or 119 minutes
14 The bus arrives at Oakwood Station first.
15 a 12 hours and 5 minutes
b 10:50 a.m.
c 7 hours and 50 minutes
Extend your thinking
16 a 28 minutes b 7:29 a.m. c 13 minutes
17 a 9:30 p.m. b 7:15 p.m. c 8:32 p.m.
18 • First departure: 06:00
• Second departure: 06:40
• Third departure: 07:20
• Fourth departure: 08:00
• Fifth departure: 08:40
The pattern is irregular on the clock because 40 minutes does not divide evenly into 60 minutes. This means the departure minute changes each time (00, 40, 20, 00, 40).
19 50 services
Chapter 4 review
1 a Metres (m) or Millimetres (mm)
b Litres (L)
c Kilograms (kg)
2 a Kilometres (km)
b Kilolitres (kL) or Litres (L)
c Tonnes (t)
3 12 500 m
4 11.4 m
5 0.9 m
6 39.0 m
7 2.51 m
8 a 0.45 m b 316 m2
9 13.5 m2
10 78 m2
11 17 m2
12 7.07 m2
13 360 cm2
14 17.6 m2
15 D
16 450 g
17 Between 22.4 kg and 22.6 kg
18 38.2 °C
19 45 L
20 a V = 0.0125 m3 b 12.5 L
21 12 m3
22 3.6 m3
23 16:15
24 09:05
25 6 hours and 25 minutes
26 The car is faster by 10 minutes.
27 A
5.01 Introduction to algebra
What do you remember?
1 a 8 b 1 c x and y
2 a False. 3x + 2 is an expression (it has no equals sign).
b False. The coefficient is 1.
c True
3 a 5x (Number comes before variable)
b
c y 3
d k (Do not write the 1)
Practice
4 a Terms: 3a, 2b, and 8
b Coefficient: 1 (Remember the invisible 1 and the negative sign)
c Constant: 12
d Variables: r and h (Note: π is a specific number, not a variable.)
5 a Base
b Index (or exponent)
c E
6 a Equation b Expression c Equation d Expression
7 a m 3 n 2 b 3xy c 5a 2 b d
8 a 3x 7 b c 2abc d p 2 + q 3
9 4x y 10 (The order of terms can vary, e.g., y + 4x 10, but standard convention usually puts alphabetical variables first.)
10 a 7 b 1 c d 1
11 a 4 × a × a × b b 3 × (x + y)
12 a 2 terms b 4 terms c 1 term d 1 term
Extend your thinking
13 a 2L + 2W or 2(L + W) b or c 12s
14 Formula: C = rd + f
Components:
• Variables: d (the distance, which changes each trip) and C (the total cost, which depends on the distance).
• Constants/Parameters: r (the rate per kilometre) and f (the fixed fee). These are constant for a specific taxi service.
This is a real-world application of linear relationships.
15 Let x and y be the two numbers.
Square of the sum: (x + y)2
Sum of squares: x 2 + y 2
The first expression expands to x 2 + 2xy + y 2
The second expression is just x 2 + y 2
The difference is the middle term, 2xy
16 Let n represent the number.
Three equivalent expressions:
• n + 0.5n
• 1.5n
• All these expressions show the same relationship but use different algebraic conventions.
5.02 Develop and substitute formulas
What do you remember?
1 a True b False c True d True
2 a 60 b 45
3 y = 17
Practice
4 C = 8 + 2.50d
5 a t =
b Since n is in the denominator (an inverse relationship), doubling the number of painters will halve the time taken to complete the job.
6 a 25 b 5 c 20
7 $46.75
8 41.6 units
9 y = 3x + 2
10 a W = 450 + 15n b $630
11 a D = 60t b 210 km
12 592 AUD
13 a Estimate: 75 + (50 × 7) = $425 (Answers may vary)
b Exact: 75 + (48 × 6.5) = $387. The estimate was a bit high but is a reasonable approximation.
Extend your thinking
14 a The constant of proportionality is k = t × n = 6 × 4 = 24. The formula is t =
b If n = 8, then t = = 3 hours.
15 C = 30 + 0.15m + 0.08t For 250 minutes and 400 texts: C = 30 + 0.15(250) + 0.08(400) = 30 + 37.50 + 32 = $99.50
16 Estimation: Round 1.8 to 2 and 21°C down to 20°C.
F ≈ (2 × 20) + 32 = 72°F.
Exact calculation:
F = (1.8 × 21) + 32 = 37.8 + 32 = 69.8°F.
Conclusion: The estimate 72°F is close to the calculated value 69.8°F, therefore the result is reasonable.
5.03 Solve and rearrange equations
What do you remember?
1 a Unlike terms b Like terms
c Like terms d Unlike terms
2 The error is performing addition before subtraction simply because it comes first in the acronym BIMDAS. Addition and Subtraction are equal in rank and must be performed from left to right. Correct calculation: 10 4 + 2 = 6 + 2 = 8
3 a balance (or equality) b inverse c distributive d coefficient
Practice
4 a 4a + 6b b 7x 2 + 4x c 13p + q d 3a 2 + 2ab 4b2
5 a 4x 20 b 5x 2
c x 2 + 6x d 3a 4b
6 a x = 7 b y = 4
c a = 20 d p = 6
7 a x = 5 b y = 3
c p = 14 d x = 5
8 a x = 5 b m = 5
c k = 2 d y = 2
9 a x = 6 b x = 20
c d x = 7
10 a In the term , the pronumeral m is multiplied by the square of v and divided by 2
b 1. Multiply by 2. 2. Divide by v 2 .
c m =
Multiply both sides by 2
Divide both sides by n
Subtract l from both sides
Write with the subject on the left-hand side
Chapter 5 review
1 a x, y b 8, 5, 3 c 8x 2 , 5xy, 3y, 1 d 1
2 It is an equation because it contains an equals sign (=). An expression does not contain an equals sign.
1
3
4 a
b Soccer is the most popular sport overall. The greatest difference in participation is in Basketball.
5 a
b Group A: Median = 70, Range = 16
Group B: Median = 70, Range = 15
Both groups have the same median score of 70, indicating a similar central performance. Their spreads are also very similar, with ranges of 16 and 15, respectively. Group A has slightly more scores in the high 70s.
b Team X: Median = 22, IQR = 10
Team Y: Median = 21, IQR = 8
Team X has a slightly higher median score and a slightly larger interquartile range, indicating that the middle 50% of its scores are higher and more spread out than Team Y’s.
c Team X has a potential outlier at 50. This outlier makes the distribution for Team X positively skewed (skewed to the right) and significantly increases its overall range compared to Team Y.
7 a The Big Chain sold 20 more mystery novels.
b The greatest difference in sales is in fantasy novels (Big Chain 90, Corner Shelf 20, difference of 70). Big Chain generally outsells Corner Shelf, especially in mystery and fantasy. However, Corner Shelf shows a relatively even distribution across genres (except fantasy), while Big Chain shows a much greater preference for mystery and fantasy.
8 a Manufacturer A: Median = 4, IQR = 2
Manufacturer B: Median = 5, IQR = 2
b Manufacturer B has a higher median battery life (5000 hours vs 4000 hours), indicating a typically longer-lasting product. Both manufacturers have an identical IQR of 2000 hours, suggesting the same level of variability in the middle 50% of products, though Manufacturer B’s distribution extends further at the upper end.
9 Store A sales: $60 000 Store B sales: $45 000
39 °C
25
Extend your thinking
12 a Club A (n = 10):
Median = 30.5 years, Range = 33 years
Club B (n = 12): Median = 39 years, Range = 42 years
b The distribution for Club A is roughly symmetric with most members in their 20s and 30s. The distribution for Club B is slightly positively skewed (skewed to the right), due to the member aged 60.
13 a Centre: Innovate Pty has a slightly higher median salary ($78 000) than TechCorp ($75 000).
Spread (IQR): TechCorp’s IQR is 30. Innovate Pty’s IQR is 15.
The middle 50% of employees at Innovate Pty earn slightly more on average (higher median) but their salaries are much less spread out (smaller IQR) than the middle 50% of employees at TechCorp.
b The outlier at 150 for TechCorp significantly inflates its overall range to 100 (from 150 50), which is much larger than Innovate Pty’s range of 40 (from 95 55). This makes TechCorp’s salary distribution appear far more varied overall. The outlier also causes TechCorp’s distribution to be highly positively skewed.
c Innovate Pty offers a more equitable salary distribution. This is because its interquartile range ($15 000) and overall range ($40 000) are both significantly smaller than TechCorp’s. This indicates that the salaries at Innovate Pty are more tightly clustered around the median, suggesting less disparity between lower and higher earners.
In contrast, TechCorp’s larger IQR and the presence of a high outlier indicate much greater salary variation.
14 Since the data is continuous numerical and requires comparison of centre, spread, and shape, the most appropriate display is the parallel boxplot.
Condition A
Condition B
The parallel boxplot best illustrates the differences because they clearly summarise and compare the five-number summary for each group on the same scale, making it easy to compare the centre (medians are similar) and spread (Condition A has a greater spread or IQR). The back-to-back stem plot is also suitable but provides less concise visual summary. The side-by-side bar chart is inappropriate as it requires grouping continuous data, losing information.
6.02 Compare summary statistics
What do you remember?
1 a True b False c True d False
2 a Mode b Median c Mean d Mode
3 a Yes b No c Yes d Yes
Practice
4
The mean is misleading because:
• It is pulled higher by the outlier score of 95
• The median of 70 better represents the centre of the main cluster of scores.
• Most scores (7 out of 9) fall between 65–75.
5 • Range = 75 cm
• The values 120 and 195 are significantly different from the main cluster of data (which is between 145 and 155).
Group Mean Median Mode Range Q1, Q3 IQR
Group X 78.6 78 75 16 75, 82 7
Group Y 77.1 78 78 12 74, 80 6
Group X has a slightly higher mean and a larger spread (both range and IQR), while Group Y shows more consistency with a single mode and smaller spread measures.
7 Yes, data sets can have identical summary statistics but very different distributions.
• Example 2: 40, 40, 50, 60, 60 (Clustered at extremes and middle)
Mean = 50, Range = 20
This demonstrates a limitation of summary statistics — they do not fully describe the shape or pattern of data distribution.
8 Step 1: Find the median. The median of 8 values is the average of the 4th and 5th values: = 86.5
Step 2: Split the data into two halves based on the median position.
• Lower half: 82, 85, 85, 86. The median of this half (Q1) is 85.
• Upper half: 87, 88, 88, 90. The median of this half (Q3) is 88.
Step 3: IQR = Q3 Q1 = 88 85 = 3
9 Mean = (10 + 12 + 12 + 13 + 25) ÷ 5 = 14.4
Median = 12
The median is more appropriate because:
• The data set contains an outlier (25).
• The mean is pulled higher by this outlier.
• The median of 12 better represents the cluster of values (10—13).
This demonstrates a key limitation of the mean with small data sets containing outliers.
10
Data set Mean Median Range Q1, Q3 IQR
Data set A 75 75 30 65, 85 20
Data set B 75 75 0 75, 75 0
Range and IQR are most useful here because:
• Mean and median are identical for both sets.
• Spread measures reveal that A is widely distributed while B has no variation.
• This shows why multiple statistics should be considered together.
11 Station 2 had more consistent rainfall with smaller range and more uniform values. Station 1 shows an outlier of 15 mm affecting its mean.
Extend your thinking
12
Class Mean Median Mode Range Q1, Q3 IQR
Class Y performed most consistently because:
• It has the smallest range excluding extreme values.
• Its IQR shows moderate but controlled spread.
• Class Z has the lowest IQR but extreme outliers.
• Class X shows the widest consistent spread.
13 The five numbers are 1, 6, 7, 8, 8.
Store B shows more reliable sales because:
• Mean and median are equal, indicating symmetric distribution
• Much smaller range indicates consistent performance
• Store A has an extreme outlier (800) affecting the mean
• IQR values are similar but Store A’s is compressed by the outlier
Limitations of analysis:
• Small sample size (10 days)
• No context for Store A’s outlier
• Seasonal factors are not considered
• A need for longer-term data to confirm patterns
6.03 Probability and frequencies
What do you remember?
1
b The spinner seems fair. The observed frequencies are all reasonably close to the expected frequency of 50. The variations (between 8 and +9) are small and likely due to random chance, which is normal in probability experiments.
10 This significant deviation ( 20%, or 20% below expectation) with a very large sample size (1000 trials) suggests the game might be unfair or biased against the player.
11 The shortfall of 20 deliveries (a 16.7% difference) suggests the restaurant’s claim of 80% is likely an overstatement.
12 a The expected frequency for bananas is 60. The observed frequency (75) was 15 students higher than expected.
b Art is the most popular club overall with 67 members. The smallest difference in participation is in the Art club, with a difference of 3 students.
2 a
Since the observed payouts (800) exactly match the expected payouts, the game appears perfectly fair based on this sample.
14 Expected defects = 500 × 0.05 = 25
• Month 1: × 100% = 28% above expected
• Month 2: × 100% = 12% above expected
• Month 3: × 100% = 40% above expected
The results are consistently higher than the 5% threshold. This suggests a systemic issue in production that requires investigation, as it is unlikely all three months would be significantly above expectation by pure chance.
15 Expected A grades = 40 × 0.10 = 4 per class.
• Class 1: 6 (50% above expected)
• Class 2: 5 (25% above expected)
• Class 3: 3 (25% below expected)
The wide variation (3 to 6) across classes of the same size suggests that grading standards might not be consistent between different teachers or classes.
Chapter 6 review
b Team A: Median = 190 cm, Range = 18 cm Team B: Median = 190 cm, Range = 15 cm Both teams have the same median height of 190 cm. Team A has a slightly larger spread in heights (range of 18 cm) compared to Team B (range of 15 cm), suggesting Team B’s players have more consistent heights.
3 a
b Café A has a higher median number of customers and a larger interquartile range, indicating its daily customer counts are typically higher and more spread out than Café B’s.
c Café A has a potential outlier at 85. This outlier makes the distribution for Café A positively skewed (skewed to the right).
4 a Cinema A sold 30 more tickets.
b The greatest difference is in Horror movies. Cinema A sells more Action and Comedy, while Cinema B has very strong sales in Horror and consistent sales elsewhere.
5 a Brand A: Median = 15 hours, IQR = 6 hours. Brand B: Median = 16 hours, IQR = 5 hours.
b Brand B has a higher median battery life, suggesting it typically lasts longer, and it also shows slightly less variability in its middle 50% of results with a smaller IQR.
6 Mean = $56.67, Median = $50, Mode = $50
The mean is misleading because the outlier of $110 significantly increases the average. The median and mode of $50 better represent a typical day’s tips.
7 Range: 100 g
The values 210 and 310 are potential outliers as they are noticeably different from the main cluster of weights between 250 g and 265 g.
8
Both classes have very similar performance and identical spread (Range = 10, IQR = 5). Class A has a slightly higher mean, while Class B has a slightly higher median and mode.
9 City A Range = 13
City B Range = 2
City B had more consistent temperatures because its range is much smaller, indicating less variation in daily temperature. City A’s data includes an outlier of 28, which makes its temperatures appear less consistent.
10 a Department 1: IQR = 20 minutes
Department 2: IQR = 20 minutes
b Department 2 has a higher median commute time (40 vs 35), but both departments show the same variability in the middle 50% of their commute times, with an IQR of 20 minutes.
11 30
12 60 products
13 The expected frequency is 150 heads. The observed frequency was 10% higher than the expected frequency.
14 25%
15 The expected number of downtime days is 18.25. The observed 20 days is approximately 9.6% higher than expected. This small difference could be due to random variation, so the claim is reasonably supported.
16 a 270 customers
b The percentage difference is × 100% ≈ 11.1%. An 11.1% difference suggests the 60% estimate is reasonably reliable, but perhaps slightly low.
17 a Mean = $549 375, Median = $495 000
b The median is more appropriate because the data contains a significant outlier ($950 000) that inflates the mean, making it less representative of a typical price in the set.
18 Archer A: Range = 3, IQR = 1 Archer B: Range = 5, IQR = 3 Archer A is more consistent because both their range and IQR are smaller, indicating less spread in their scores.
19 The EverLast batteries have a higher median longevity (75 hours vs 70 hours), suggesting they typically last longer than PowerUp batteries. Both brands have the same range (45 hours) and interquartile range (20 hours), indicating they have identical consistency in performance.
20 The intake exceeds 75% of the recommended daily maximum by 7%.
7.01 Informed spending
What do you remember?
1 a Fixed charge b Variable charge c Fixed charge d Variable charge
2 B
3
4 a The Pro plan (3000 GB) is needed because 500 GB is less than 2000 GB.
b $144
c The Starter plan limit (500 GB) is insufficient for 2000 GB of photos.
5 a Premium plan (allows 4 screens, covering the 3 students).
b $300
c $100 per student
6 a $0.89 per GB
b $0.80 per GB
c Plan B offers better value ($0.80 vs $0.89 per GB)
7 a $900 b $120
8 a $1560
b Age is a risk factor. Younger drivers are statistically more likely to be involved in accidents, leading to higher insurance premiums.
9 a $1560
b $1620
c Option A saves $60.
10 a
Months 1 3 5 10
b From the 6th month onwards (they are equal at 5 months).
11 a $80
b $60
c $10
12 a $100
b Option A is safer. The statistical cost of Option B ($100) is higher than the direct price ($80). Additionally, probability is not a guarantee. A person could buy 30 or 40 packs and still not find the card, resulting in a much higher financial loss.
13 a $400
b $40
14
• Indicator: “URGENT”, “within 24 hours”.
Explanation: Scammers use artificial urgency to stop the recipient from thinking clearly.
• Indicator: “update your credit card details”. Explanation: Legitimate companies rarely ask for financial details via a direct email link.
• Indicator: “Dear Customer”. Explanation: Generic greetings often indicate a mass-sent phishing email.
15 1. The price of $150 is unrealistically low for an item usually worth $750, indicating the offer is too good to be true.
2. Untraceable payment methods like cryptocurrency or gift cards offer no buyer protection, especially when combined with artificial urgency to rush the transaction.
Extend your thinking
16 a $80
b $84
c Discount is 33.3%. “Buy 2 Get 1 Free” is better.
17 a $120
b $96
c No, the price dropped to $96.
Reasoning: The 20% increase was calculated on the smaller base amount ($100), adding $20. The 20% discount was calculated on the larger amount ($120), subtracting $24. Because the subtraction is larger than the addition, the final price is lower than the start.
18 Option A Benefit: Ben will actually spend less than $2000 of his own wage because the bank interest will contribute a small amount towards the goal. He earns money while he waits.
Option B Cost: Ben will pay significantly more than $2000. The high interest rate (18%) means he is paying a fee for the convenience of having the laptop now.
19 a $0.0033 per coin
b Virtual currency disconnects the user from the real monetary value, making spending feel less significant.
c Mechanics like “loot boxes” or random rewards for coins can mimic gambling, leading to addictive behaviours.
7.02 Manage credit and loans
What do you remember?
1 a False
b True
c False
2 a iii b ii c i and iv
3 C
Practice
4 a Advantage: If paid within 55 days, the interest is $0, making it cheaper than the loan.
b Disadvantage: If not paid in time, the 21% interest rate is much higher than the personal loan rate, increasing the cost.
5 a $200
b $20
c $215
d Answers may vary. Possible answer include: Convenience; not having the full $180 available immediately; helping to manage cash flow by spreading the cost over 8 weeks.
6 a I = $3060 b A = $15 060
c $418.33
7 a $3690 b $141.92
8 a 1.5% b $75
9 a $300 b
10 a t = 3 years b r = 5%
11 P = $6000
12 a $9920
b $10 160
c Option A is cheaper by $240.
13 $950 14 a $4750 b $5400 c $7070.83
Extend your thinking
15 Year 1: $1950
Year 2: $2047.50
Year 3: $2508.19
Total repayments: $6505.69
16 Strategy highlights: Pay minimums on HECS-HELP and loan. Direct all excess funds to credit card (highest interest). Once the credit card is cleared, direct excess to personal loan.
17 a P = $2000 ( y-intercept)
b I = $800
c r = 10%
7.03 Understand economic factors
What do you remember?
1 a Fixed b Variable c Fixed d Variable e Fixed 2 a iii b i c ii 3 B
Practice
4 a The annual inflation rate is approximately 4.52%.
b Since the inflation rate of 4.52% is significantly higher than the target range, the economy is growing too quickly. To bring inflation back down toward the 2%–3% goal, the Reserve Bank is very likely to increase interest rates to reduce consumer spending.
5 a Student/Teenager
b Working adult/Family stage
c Older Adult/Retirement
d Young adult
6 a $1260
b Monthly rent: 350 × 4 = $1400. No, it is not within the budget (exceeds the $1260 limit).
c Groceries, electricity/utilities usage, transport/fuel, entertainment
7 a $1330
b The average annual increase was 5.00%.
8 a 3%
b Sarah’s purchasing power has decreased. Her salary increased by only 3%, which is lower than the inflation rate of 4.5%. This means the cost of goods and services has risen faster than her income.
9 a She will earn an extra $35 in interest.
b He will pay an extra $140 in interest per year.
c Ben is more vulnerable because the rate rise creates a new “fixed expense” that reduces his disposable income. As a young adult, he likely has more financial responsibilities (rent, bills) than a student. While Sarah gains money, the amount is small ($35), whereas Ben’s cost is much higher ($140), potentially leading to more financial stress.
10 The minimum annual income needed is $72 000.
11 a The maximum housing budget is $2250 with $5250 remaining for other expenses.
b The “remaining funds” must cover all other costs. A person in the family stage has high fixed expenses (such as childcare, insurance, and household groceries) that a student typically does not have. Consequently, most of the remaining money for the working adult is already committed to essential needs, whereas the student’s remainder is mostly discretionary (available for wants).
2. Falling unemployment (5.2% to 4.1%) indicates strong labour demand.
3. Economic implications:
• The labour market is tightening (lower unemployment).
• The cost of living is outpacing wage growth.
• Workers are losing purchasing power despite good employment conditions.
• The economy may be experiencing wage pressure that could lead to higher inflation.
This suggests an economy with strong demand but potential sustainability concerns.
14 a $61 500 b $63 300 c $1800
15 a The retiree has a fixed income. As prices rise by 5%, their purchasing power drops significantly because their income does not increase at all. The working adult also suffers because inflation (5%) is higher than their wage rise (3%), but their income is at least partially catching up, providing some buffer that the retiree does not have.
b Reduce discretionary (variable) spending, downsize housing to reduce costs, or shift some savings into an account with a higher interest rate (if available) to generate more passive income.
Chapter 7 review
1 a The professional plan is required.
b $180
2 Plan A costs $0.475 per GB while Plan B costs $0.44 per GB. Therefore, Plan B offers better value.
3 The monthly total is $960. The saving is $110.
4 a $108 b $91.80 c $31.80
5 The element of chance in loot boxes can mimic gambling. This can lead to addictive behaviour where a person spends more money than intended trying to get a rare item.
6 a $600 b $60
7 1. The use of urgency or threats (for example, “URGENT”, “avoid a late fee”) is a common tactic to make people act without thinking.
2. Legitimate companies rarely ask for sensitive payment details directly via an email link.
9 a If paid within the interest-free period, no interest is charged, making it cheaper than the loan.
b The credit card’s interest rate (22%) is much higher than the loan’s rate (12%), resulting in significantly more interest being paid.
a small square at the intersection, indicating a right angle
The salary increase is 3.5%. Since the wage increase (3.5%) is less than the inflation rate (4.0%), their purchasing power has decreased. 17 Extra interest earned: $50
Extra interest paid: $125
The net effect is a loss of $75 for the year. 18 Maximum housing budget: $1860 Remaining funds: $4340
1 a Triangle b Quadrilateral c
2 a iii b ii c i
3 a The sides are equal in length.
b The sides are parallel to each other.
c The angle is a right angle (90°).
Practice
4 a Square b Isosceles trapezium
c Parallelogram d Rhombus
5 a 6 b Order 6
6 a Isosceles b Scalene
c Equilateral d Scalene
e Equilateral f Isosceles
7 1. Angle classification:
• Has one 90° angle, so it is a right triangle.
• The other angles are both 45°.
2. Side classification:
• Two angles are equal (45°), so two sides must be equal. Therefore, it is an isosceles triangle.
Complete classification: Isosceles right triangle
8 a Right b Acute c Acute d Obtuse
9 1. This shape is a trapezium.
2. It cannot be a parallelogram because:
• A parallelogram must have two pairs of parallel sides.
• This shape only has one pair of parallel sides.
• By definition, a trapezium has exactly one pair of parallel sides. Therefore, it fails to meet the defining property of a parallelogram.
10 This shape is a rhombus.
Properties:
• All four sides are equal in length.
• Opposite angles are equal.
• Diagonals bisect each other at right angles.
• Has two lines of symmetry through its diagonals.
• Has rotational symmetry of order 2.
12 a 1440° b 180°
13 a The interior angle sum of the tile is 720°.
b One interior angle of the tile is 120°.
14 a Both shapes have 4 vertices.
b The diagonals of a rectangle are of equal length, while the diagonals of a rhombus intersect at right angles.
15 a Answers may vary. Possible answer: A and B
b Diagonal
c 2
d ∠ABC, ∠BCD, ∠CDE, ∠DEA, ∠EAB
Extend your thinking
16 Calculate the interior angle of a regular pentagon.
Check for vertex completion.
• If 3 pentagons meet: 3 × 10⁸° = 324° (gap of 36°).
• If 4 pentagons meet: 4 × 10⁸° = 432° (overlap of 72°).
Conclusion:
Because 360 is not exactly divisible by 108, there is no way to arrange regular pentagons around a point without gaps or overlaps.
17 a The shape is a rhombus.
Properties (any two):
• All four sides are equal in length.
• Opposite angles are equal.
• Diagonals bisect each other at right angles.
• Has rotational symmetry of order 2.
b Third angle = 180° 35° 65°
= 80°
Angle classification: All three angles (35°, 65°, 80°) are less than 90°, so it is an acute triangle.
Side classification: No sides are equal, so it is a scalene triangle.
Complete classification: Acute scalene triangle.
The regular pentagon (108°) and regular hexagon (120°) both have interior angles between 100° and 125°. The heptagon (≈ 128.6°) and octagon (135°) exceed the upper limit. The metalworker could use either a regular pentagon or a regular hexagon.
8.03 Properties of 3D objects
What do you remember?
1 B
2 a Triangular prism
b Cube c Pentagonal pyramid
3 a Square pyramid
b Hexagonal pyramid
c Octagonal prism
Practice
4 • Faces: 5
• Edges: 8
• Vertices: 5
5 The object is a triangular prism. Its faces consist of two triangles (the bases) and three rectangles (the lateral faces).
6 a 3 cm 5 cm
b Answers may vary. Possible answer:
9 a 5 b 6 c 9
10
• 8 cm edges (length): 4 edges
• 4 cm edges (width): 4 edges
• 3 cm edges (height): 4 edges
11 A cylinder has:
• 3 faces (2 flat circles and 1 curved surface)
• 2 edges (where the curved surface meets the circular bases)
• 0 vertices
The faces are two identical circles and one rectangle (when unrolled). 4 cm
Extend your thinking
13 Answers may vary. Possible answer:
14 • Faces: 12. A prism always has two bases plus one lateral face for every side of the base (10 + 2 = 12).
• Vertices: 20. There is one vertex for every corner of the top base and the bottom base (10 × 2 = 20).
• Edges: 30. There are 10 edges on the top base, 10 on the bottom base, and 10 vertical edges connecting them (10 × 3 = 30).
15 There are 11 different possible nets for a cube. Here are three examples: 4 cm 10 cm 8 cm π 4 cm
8.04 Plans, diagrams, and scale
What do you remember?
1 a ii b iv c v d iii
e i
2 a Bathtub b Shower
c Linen closet d Pantry
e Refrigerator f Storage space
g Toilet or water closet h Wardrobe
3 a True b False c True d False
Practice
4 a 2 b Single swing door
c Storage space d Yes
5 a A sofa or couch b A washing machine
c A sliding door d Two beds
6 14 cm
7 Calculate the actual width of the kitchen from the plan:
Actual width = Plan width × Scale factor
= 7 cm × 50 = 350 cm
Convert the actual width to metres: 350 cm ÷ 100 = 3.5 m
Compare with the specification:
3.5 m > 3.2 m
Yes, the kitchen meets the client’s specification because its actual width of 3.5 m is greater than the required minimum of 3.2 m.
8 a 30 m by 45 m b 1350 m2
c $29 700
9
• Room length: 800 cm ÷ 100 = 8 cm
• Room width: 600 cm ÷ 100 = 6 cm
• Door width: 90 cm ÷ 100 = 0.9 cm
10 by 1.5 cm
11 Four bedrooms and two toilets
12 a 37.5 m2 b $2437.50
Extend your thinking
13 • Sports court: 240 cm2
• Play equipment: 150 cm2
• Seating area: 90 cm2
• Green space: 120 cm2
14 a New length = 12 cm
New width = 8 cm
b 75%
c At 1 : 250 : 0.8 cm
At 1 : 500 : 0.4 cm
15 a The door symbol (arc) indicates the direction and space required for the door to swing open. The thick dark line (load-bearing wall) indicates a wall that structurally supports the building above it.
b Actual distance = 5 cm × 100 = 500 cm = 5 m. The overhead beam is 5 m long in reality.
8.05 Maps and location
What do you remember?
1 a True b True c True d True
2 a 5 b 10 c 100 000
3 a School b Red cross
Practice
4 a 3000 m b 2000 m
c 1250 m d 475 m
e 300 m
5 a 1 : 300 b 1 : 80 000
c 1 : 5000 d 1 : 600 000
6 a 38 000 cm b 380 m
7 10 cm
8 a 1 : 14 286
b Southeast (SE)
c Approximately 1714 m. (Answers between 1700 m and 1750 m are acceptable based on measurements).
Mathspace
9 a E5 b North-west (NW)
c 424 m
10 a The route is as follows:
• Start at the Post Office and travel south on River Rd.
• Turn right to travel west on Park St.
• Turn left to travel south on High St to arrive at the Supermarket.
b 5.8 km c 12 minutes
11 8.75 mm
12 a 1 : 50 is a suitable choice as it results in a plan size of 42 cm by 30 cm, fitting comfortably within the margins of an A1 sheet.
b 6 metres
Extend your thinking
13 a 1 : 45
b It still represents 5 metres.
14 Tibsen Park has the largest area. Even though its plan size is similar to Millenial Park, its scale factor is much larger (7000 vs 5000).
Estimated areas: Lesse Park ≈ 4000 m2, Millenial Park ≈ 37 500 m2, and Tibsen Park ≈ 73 500 m2
15 a 1 : 9
b The ratio of the actual areas is the square of the ratio of the scale denominators. If the scales are 1 : a and 1 : b, the ratio of the areas is a 2 : b2 .
Chapter 8 review 1
Description
A line passing through P and Q
A ray starting at P and passing through Q
The line segment connecting P and Q
Notation
The distance between P and Q PQ
2 a Answers may vary. Possible answer: A and B
b Diagonal (connects non-adjacent vertices)
c 3
3 a 7 b 12 c 7
4 a 1 (the circular base)
b 1 (the apex)
c 1
5 It is a right-angled isosceles triangle.
6 Obtuse scalene triangle (One angle > 90°, all angles different implies all sides different).
7 Quadrilateral: Kite
Property: The diagonals intersect at right angles (90°).
8 • Diagonals are equal in length.
• Diagonals bisect each other.
• Rotational symmetry of order 2.
9 • Similarity: Both have four sides of equal length.
• Difference: A square must have all internal angles of 90°, whereas a rhombus does not necessarily have right angles.
10 Faces: 10
Edges: 24
Vertices: 16
11 Triangular prism
12 A and C
13 The net requires 2 identical triangles (for the bases) and 3 rectangles (for the lateral faces).
14 60 m
15 15 cm
16 a 40 cm b 10 cm
17 Calculate actual width: 2.5 cm × 50 = 125 cm = 1.25 m. Since 1.25 m > 1.1 m, yes, it meets the regulations.