Zip 34202, Zip 34211 Published: September 2022* Property Types: All Res. Proptype - All Properties - All Properties - All Property Statuses Price Range: $0 - No Limit SQFT Range: 0 - No Limit Bedrooms: 0 - No Limit Full Baths: 0 - No Limit Half Baths: 0 - No Limit Year Built: 0 - No Limit
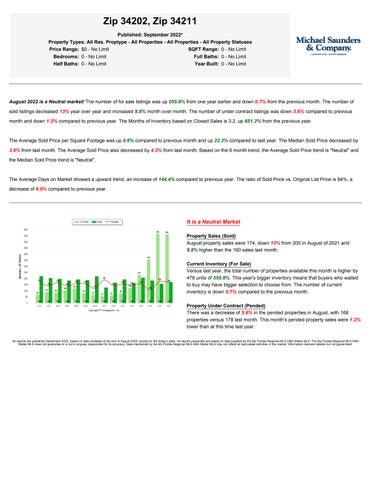
August 2022 is a Neutral market! The number of for sale listings was up 555.8% from one year earlier and down 0.7% from the previous month. The number of sold listings decreased 13% year over year and increased 8.8% month over month. The number of under contract listings was down 5.6% compared to previous month and down 1.2% compared to previous year. The Months of Inventory based on Closed Sales is 3.2, up 651.2% from the previous year.
The Average Sold Price per Square Footage was up 0.6% compared to previous month and up 22.3% compared to last year. The Median Sold Price decreased by 3.8% from last month. The Average Sold Price also decreased by 4.3% from last month. Based on the 6 month trend, the Average Sold Price trend is "Neutral" and the Median Sold Price trend is "Neutral".
The Average Days on Market showed a upward trend, an increase of 144.4% compared to previous year. The ratio of Sold Price vs. Original List Price is 94%, a decrease of 6.9% compared to previous year.
It is a Neutral Market Property Sales (Sold) August property sales were 174, down 13% from 200 in August of 2021 and 8.8% higher than the 160 sales last month. Current Inventory (For Sale) Versus last year, the total number of properties available this month is higher by 478 units of 555.8%. This year's bigger inventory means that buyers who waited to buy may have bigger selection to choose from. The number of current inventory is down 0.7% compared to the previous month. Property Under Contract (Pended) There was a decrease of 5.6% in the pended properties in August, with 168 properties versus 178 last month. This month's pended property sales were 1.2% lower than at this time last year. All reports are published September 2022, based on data available at the end of August 2022, except for the today’s stats. All reports presented are based on data supplied by the My Florida Regional MLS DBA Stellar MLS. The My Florida Regional MLS DBA Stellar MLS does not guarantee or is not in anyway responsible for its accuracy. Data maintained by the My Florida Regional MLS DBA Stellar MLS may not reflect all real estate activities in the market. Information deemed reliable but not guaranteed.
Zip 34202, Zip 34211 Published: September 2022* Property Types: All Res. Proptype - All Properties - All Properties - All Property Statuses Price Range: $0 - No Limit SQFT Range: 0 - No Limit Bedrooms: 0 - No Limit Full Baths: 0 - No Limit Half Baths: 0 - No Limit Year Built: 0 - No Limit
The Average Sold Price per Square Footage is Neutral* The Average Sold Price per Square Footage is a great indicator for the direction of property values. Since Median Sold Price and Average Sold Price can be impacted by the 'mix' of high or low end properties in the market, the Average Sold Price per Square Footage is a more normalized indicator on the direction of property values. The August 2022 Average Sold Price per Square Footage of $334 was up 0.6% from $332 last month and up 22.3% from $273 in August of last year. * Based on 6 month trend – Appreciating/Depreciating/Neutral
The Days on Market Shows Upward Trend* The average Days on Market (DOM) shows how many days the average property is on the market before it sells. An upward trend in DOM trends to indicate a move towards more of a Buyer’s market, a downward trend indicates a move towards more of a Seller’s market. The DOM for August 2022 was 22, up 69.2% from 13 days last month and up 144.4% from 9 days in August of last year.
The Sold/Original List Price Ratio is Falling** The Sold Price vs. Original List Price reveals the average amount that sellers are agreeing to come down from their original list price. The lower the ratio is below 100% the more of a Buyer’s market exists, a ratio at or above 100% indicates more of a Seller’s market. This month Sold Price vs. Original List Price of 94% is down 4.1% % from last month and down from 6.9% % in August of last year. * Based on 6 month trend – Upward/Downward/Neutral ** Based on 6 month trend – Rising/Falling/Remains Steady
All reports are published September 2022, based on data available at the end of August 2022, except for the today’s stats. All reports presented are based on data supplied by the My Florida Regional MLS DBA Stellar MLS. The My Florida Regional MLS DBA Stellar MLS does not guarantee or is not in anyway responsible for its accuracy. Data maintained by the My Florida Regional MLS DBA Stellar MLS may not reflect all real estate activities in the market. Information deemed reliable but not guaranteed.
Zip 34202, Zip 34211 Published: September 2022* Property Types: All Res. Proptype - All Properties - All Properties - All Property Statuses Price Range: $0 - No Limit SQFT Range: 0 - No Limit Bedrooms: 0 - No Limit Full Baths: 0 - No Limit Half Baths: 0 - No Limit Year Built: 0 - No Limit
The Average For Sale Price is Depreciating* The Average For Sale Price in August was $745,000, down 32.1% from $1,097,000 in August of 2021 and down 2.1% from $761,000 last month.
The Average Sold Price is Neutral* The Average Sold Price in August was $777,000, up 33.5% from $582,000 in August of 2021 and down 4.3% from $812,000 last month.
The Median Sold Price is Neutral* The Median Sold Price in August was $630,000, up 34% from $470,000 in August of 2021 and down 3.8% from $655,000 last month. * Based on 6 month trend – Appreciating/Depreciating/Neutral
It is a Neutral Market* A comparatively lower Months of Inventory is more beneficial for sellers while a higher months of inventory is better for buyers. *Buyer’s market: more than 6 months of inventory Seller’s market: less than 3 months of inventory Neutral market: 3 – 6 months of inventory
Months of Inventory based on Closed Sales The August 2022 Months of Inventory based on Closed Sales of 3.2 was increased by 651.2% compared to last year and down 11.3% compared to last month. August 2022 is Neutral market. Months of Inventory based on Pended Sales The August 2022 Months of Inventory based on Pended Sales of 3.4 was increased by 573.3% compared to last year and up 6.3% compared to last month. August 2022 is Neutral market.
All reports are published September 2022, based on data available at the end of August 2022, except for the today’s stats. All reports presented are based on data supplied by the My Florida Regional MLS DBA Stellar MLS. The My Florida Regional MLS DBA Stellar MLS does not guarantee or is not in anyway responsible for its accuracy. Data maintained by the My Florida Regional MLS DBA Stellar MLS may not reflect all real estate activities in the market. Information deemed reliable but not guaranteed.
Zip 34202, Zip 34211 Published: September 2022* Property Types: All Res. Proptype - All Properties - All Properties - All Property Statuses Price Range: $0 - No Limit SQFT Range: 0 - No Limit Bedrooms: 0 - No Limit Full Baths: 0 - No Limit Half Baths: 0 - No Limit Year Built: 0 - No Limit
It is a Neutral Market* Absorption Rate measures the inverse of Months of Inventory and represents how much of the current active listings (as a percentage) are being absorbed each month. *Buyer’s market: 16.67% and below Seller’s market: 33.33% and above Neutral market: 16.67% - 33.33%
Absorption Rate based on Closed Sales The August 2022 Absorption Rate based on Closed Sales of 30.9 was decreased by 86.7% compared to last year and up 9.6% compared to last month. Absorption Rate based on Pended Sales The August 2022 Absorption Rate based on Pended Sales of 29.8 was decreased by 84.9% compared to last year and down 4.8% compared to last month.
All reports are published September 2022, based on data available at the end of August 2022, except for the today’s stats. All reports presented are based on data supplied by the My Florida Regional MLS DBA Stellar MLS. The My Florida Regional MLS DBA Stellar MLS does not guarantee or is not in anyway responsible for its accuracy. Data maintained by the My Florida Regional MLS DBA Stellar MLS may not reflect all real estate activities in the market. Information deemed reliable but not guaranteed.