Mark Boehmig
Realtor, GRI, CLHMS
(941)807-6936
markboehmig@michaelsaunders.com
MarkitSoldFL.com
Mark Boehmig
Realtor, GRI, CLHMS
(941)807-6936
markboehmig@michaelsaunders.com
MarkitSoldFL.com
Published: June 2024*
Property Types: Single Family Home - All Property Statuses
Price Range: $0 - No Limit SQFT Range: 0 - No Limit
Bedrooms: 0 - No Limit Full Baths: 0 - No Limit
Half Baths: 0 - No Limit Year Built: 0 - No Limit

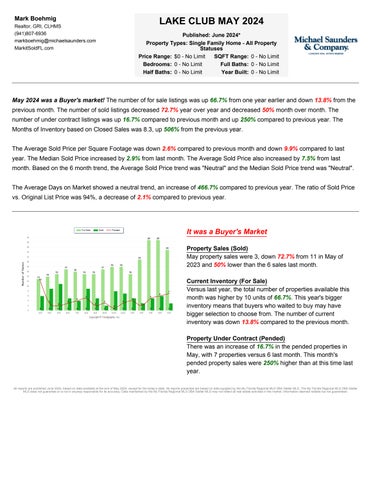
May 2024 was a Buyer's market! The number of for sale listings was up 66.7% from one year earlier and down 13.8% from the previous month. The number of sold listings decreased 72.7% year over year and decreased 50% month over month. The number of under contract listings was up 16.7% compared to previous month and up 250% compared to previous year. The Months of Inventory based on Closed Sales was 8.3, up 506% from the previous year.
The Average Sold Price per Square Footage was down 2.6% compared to previous month and down 9.9% compared to last year. The Median Sold Price increased by 2.9% from last month. The Average Sold Price also increased by 7.5% from last month. Based on the 6 month trend, the Average Sold Price trend was "Neutral" and the Median Sold Price trend was "Neutral".
The Average Days on Market showed a neutral trend, an increase of 466.7% compared to previous year. The ratio of Sold Price vs. Original List Price was 94%, a decrease of 2.1% compared to previous year.
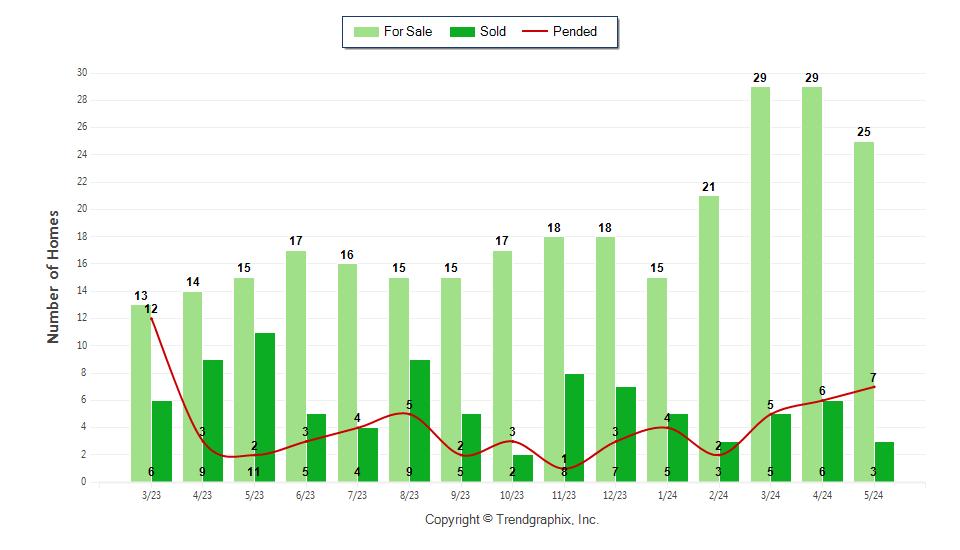
May property sales were 3, down 72.7% from 11 in May of 2023 and 50% lower than the 6 sales last month.
Versus last year, the total number of properties available this month was higher by 10 units of 66.7%. This year's bigger inventory means that buyers who waited to buy may have bigger selection to choose from. The number of current inventory was down 13.8% compared to the previous month.
There was an increase of 16.7% in the pended properties in May, with 7 properties versus 6 last month. This month's pended property sales were 250% higher than at this time last year.
Mark Boehmig
Realtor, GRI, CLHMS
(941)807-6936
markboehmig@michaelsaunders.com
MarkitSoldFL.com
Published: June 2024*
Property Types: Single Family Home - All Property Statuses
Price Range: $0 - No
Bedrooms: 0 - No
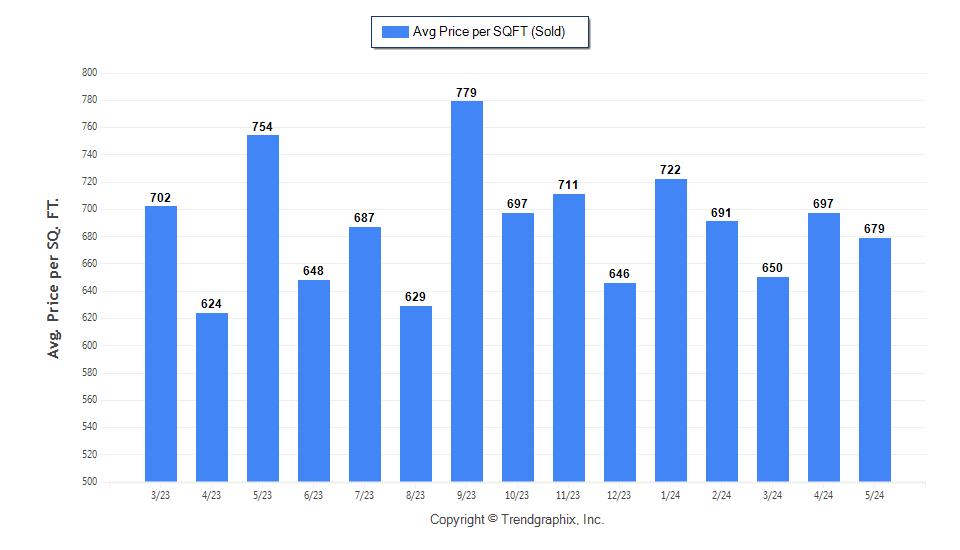
The Average Sold Price per Square Footage was Neutral*
The Average Sold Price per Square Footage is a great indicator for the direction of property values. Since Median Sold Price and Average Sold Price can be impacted by the 'mix' of high or low end properties in the market, the Average Sold Price per Square Footage is a more normalized indicator on the direction of property values. The May 2024 Average Sold Price per Square Footage of $679 was down 2.6% from $697 last month and down 9.9% from $754 in May of last year.
* Based on 6 month trend – Appreciating/Depreciating/Neutral
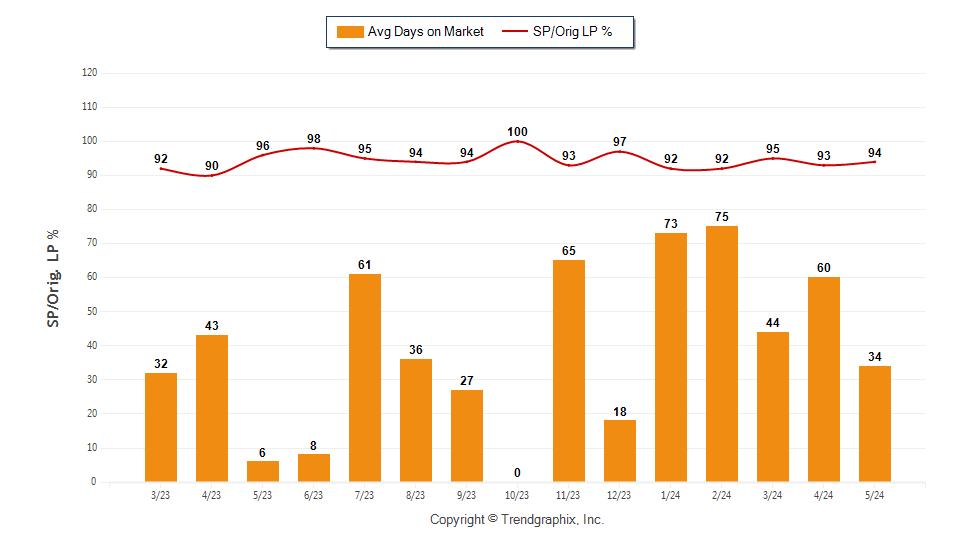
The average Days on Market (DOM) shows how many days the average property is on the market before it sells. An upward trend in DOM trends to indicate a move towards more of a Buyer’s market, a downward trend indicates a move towards more of a Seller’s market. The DOM for May 2024 was 34, down 43.3% from 60 days last month and up 466.7% from 6 days in May of last year.
The Sold/Original List
The Sold Price vs. Original List Price reveals the average amount that sellers are agreeing to come down from their original list price. The lower the ratio is below 100% the more of a Buyer’s market exists, a ratio at or above 100% indicates more of a Seller’s market. This month Sold Price vs. Original List Price of 94% was up 1.1% % from last month and down from 2.1% % in May of last year.
* Based on 6 month trend – Upward/Downward/Neutral
** Based on 6 month trend – Rising/Falling/Remains Steady
Mark Boehmig
Realtor, GRI, CLHMS
(941)807-6936
markboehmig@michaelsaunders.com
MarkitSoldFL.com
Published: June 2024*
Property Types: Single Family Home - All Property Statuses
Price Range: $0 - No
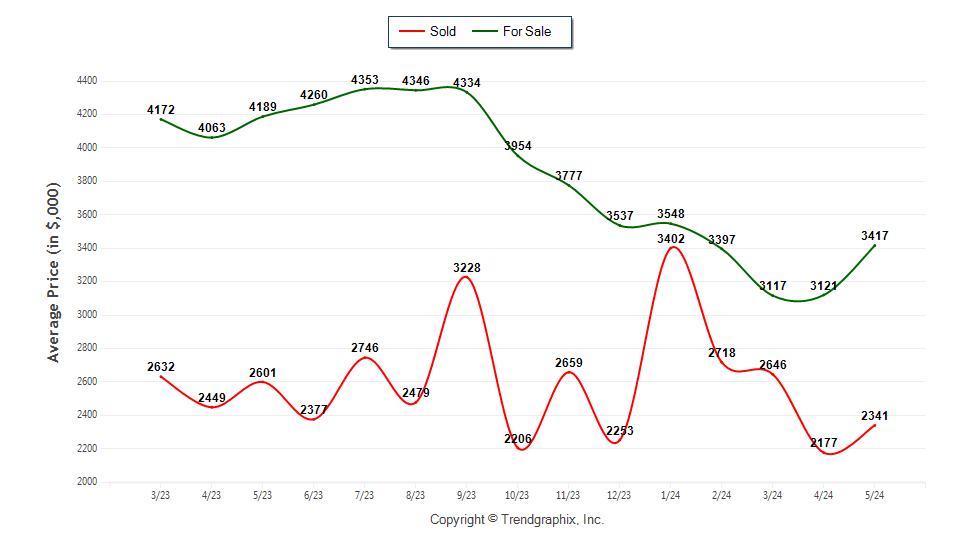
Average For Sale Price was Neutral*
The Average For Sale Price in May was $3,417,000, down 18.4% from $4,189,000 in May of 2023 and up 9.5% from $3,121,000 last month.
The Average Sold Price was Neutral*
The Average Sold Price in May was $2,341,000, down 10% from $2,601,000 in May of 2023 and up 7.5% from $2,177,000 last month.
The Median Sold Price was Neutral*
The Median Sold Price in May was $2,300,000, down 11.5% from $2,600,000 in May of 2023 and up 2.9% from $2,235,000 last month.
* Based on 6 month trend – Appreciating/Depreciating/Neutral
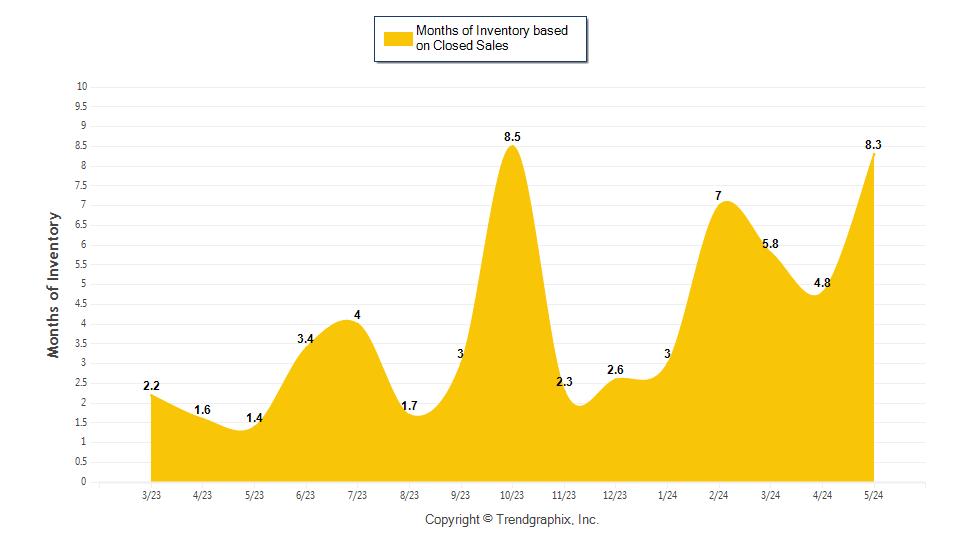
A comparatively lower Months of Inventory is more beneficial for sellers while a higher months of inventory is better for buyers.
*Buyer’s market: more than 6 months of inventory
Seller’s market: less than 3 months of inventory
Neutral market: 3 – 6 months of inventory
The May 2024 Months of Inventory based on Closed Sales of 8.3 was increased by 506% compared to last year and up 72.4% compared to last month. May 2024 was Buyer's market.
The May 2024 Months of Inventory based on Pended Sales of 3.6 was decreased by 52% compared to last year and down 24.8% compared to last month. May 2024 was Neutral market.
Mark Boehmig
Realtor, GRI, CLHMS
(941)807-6936
markboehmig@michaelsaunders.com
MarkitSoldFL.com
Published: June 2024*
Property Types: Single Family Home - All Property Statuses Price Range: $0 - No
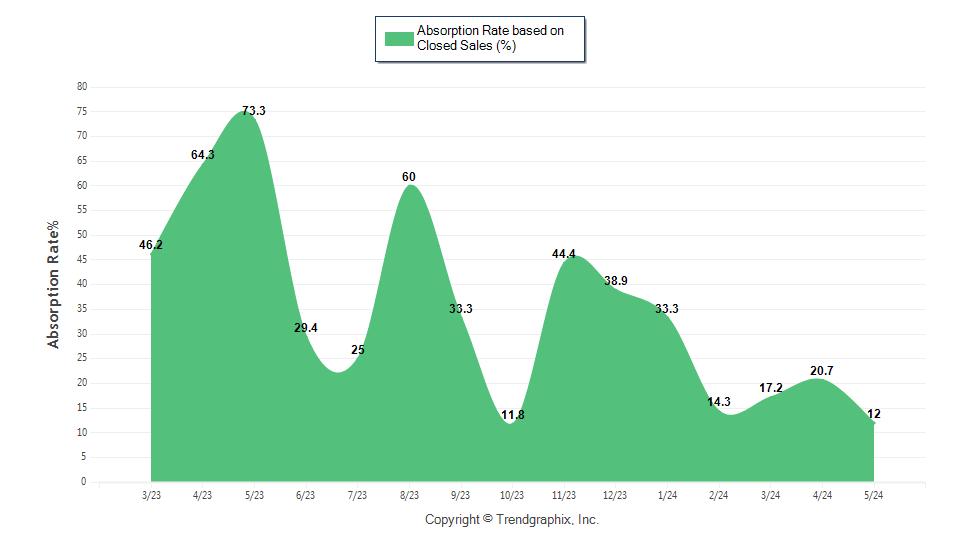
Absorption Rate measures the inverse of Months of Inventory and represents how much of the current active listings (as a percentage) are being absorbed each month.
*Buyer’s market: 16.67% and below
Seller’s market: 33.33% and above
Neutral market: 16.67% - 33.33%
Absorption Rate based on Closed Sales
The May 2024 Absorption Rate based on Closed Sales of 12 was decreased by 83.6% compared to last year and down 42% compared to last month.
Absorption Rate based on Pended Sales
The May 2024 Absorption Rate based on Pended Sales of 28 was increased by 110.3% compared to last year and up 35.3% compared to last month.