Lakewood Ranch Market Update Dec 2023

Page 1

Mark Boehmig Realtor, GRI, CLHMS (941)807-6936 markboehmig@michaelsaunders.com MarkitsoldLF.com

Zip 34202, Zip 34211 Published: January 2024* Property Types: Single Family Home - All Property Statuses Price Range: $0 - No Limit SQFT Range: 0 - No Limit Bedrooms: 0 - No Limit Full Baths: 0 - No Limit Half Baths: 0 - No Limit Year Built: 0 - No Limit

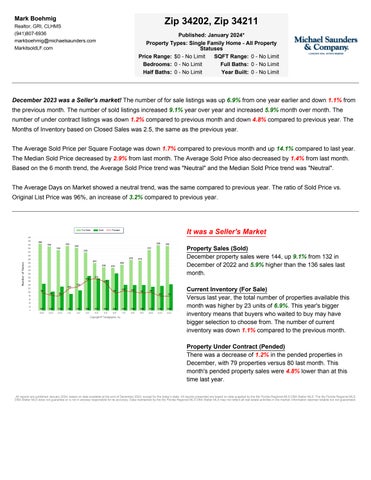
December 2023 was a Seller's market! The number of for sale listings was up 6.9% from one year earlier and down 1.1% from the previous month. The number of sold listings increased 9.1% year over year and increased 5.9% month over month. The number of under contract listings was down 1.2% compared to previous month and down 4.8% compared to previous year. The Months of Inventory based on Closed Sales was 2.5, the same as the previous year. The Average Sold Price per Square Footage was down 1.7% compared to previous month and up 14.1% compared to last year. The Median Sold Price decreased by 2.9% from last month. The Average Sold Price also decreased by 1.4% from last month. Based on the 6 month trend, the Average Sold Price trend was "Neutral" and the Median Sold Price trend was "Neutral". The Average Days on Market showed a neutral trend, was the same compared to previous year. The ratio of Sold Price vs. Original List Price was 96%, an increase of 3.2% compared to previous year.

It was a Seller's Market Property Sales (Sold) December property sales were 144, up 9.1% from 132 in December of 2022 and 5.9% higher than the 136 sales last month. Current Inventory (For Sale) Versus last year, the total number of properties available this month was higher by 23 units of 6.9%. This year's bigger inventory means that buyers who waited to buy may have bigger selection to choose from. The number of current inventory was down 1.1% compared to the previous month. Property Under Contract (Pended) There was a decrease of 1.2% in the pended properties in December, with 79 properties versus 80 last month. This month's pended property sales were 4.8% lower than at this time last year. All reports are published January 2024, based on data available at the end of December 2023, except for the today’s stats. All reports presented are based on data supplied by the My Florida Regional MLS DBA Stellar MLS. The My Florida Regional MLS DBA Stellar MLS does not guarantee or is not in anyway responsible for its accuracy. Data maintained by the My Florida Regional MLS DBA Stellar MLS may not reflect all real estate activities in the market. Information deemed reliable but not guaranteed.


Mark Boehmig Realtor, GRI, CLHMS (941)807-6936 markboehmig@michaelsaunders.com MarkitsoldLF.com

Zip 34202, Zip 34211 Published: January 2024* Property Types: Single Family Home - All Property Statuses Price Range: $0 - No Limit SQFT Range: 0 - No Limit Bedrooms: 0 - No Limit Full Baths: 0 - No Limit Half Baths: 0 - No Limit Year Built: 0 - No Limit

The Average Sold Price per Square Footage was Neutral* The Average Sold Price per Square Footage is a great indicator for the direction of property values. Since Median Sold Price and Average Sold Price can be impacted by the 'mix' of high or low end properties in the market, the Average Sold Price per Square Footage is a more normalized indicator on the direction of property values. The December 2023 Average Sold Price per Square Footage of $348 was down 1.7% from $354 last month and up 14.1% from $305 in December of last year. * Based on 6 month trend – Appreciating/Depreciating/Neutral

The Days on Market Showed Neutral Trend* The average Days on Market (DOM) shows how many days the average property is on the market before it sells. An upward trend in DOM trends to indicate a move towards more of a Buyer’s market, a downward trend indicates a move towards more of a Seller’s market. The DOM for December 2023 was 53, up 29.3% from 41 days last month and the same as in December of last year.

The Sold/Original List Price Ratio was Rising** The Sold Price vs. Original List Price reveals the average amount that sellers are agreeing to come down from their original list price. The lower the ratio is below 100% the more of a Buyer’s market exists, a ratio at or above 100% indicates more of a Seller’s market. This month Sold Price vs. Original List Price of 96% was the same as last month and up from 3.2% % in December of last year. * Based on 6 month trend – Upward/Downward/Neutral ** Based on 6 month trend – Rising/Falling/Remains Steady

All reports are published January 2024, based on data available at the end of December 2023, except for the today’s stats. All reports presented are based on data supplied by the My Florida Regional MLS DBA Stellar MLS. The My Florida Regional MLS DBA Stellar MLS does not guarantee or is not in anyway responsible for its accuracy. Data maintained by the My Florida Regional MLS DBA Stellar MLS may not reflect all real estate activities in the market. Information deemed reliable but not guaranteed.


Mark Boehmig Realtor, GRI, CLHMS (941)807-6936 markboehmig@michaelsaunders.com MarkitsoldLF.com

Zip 34202, Zip 34211 Published: January 2024* Property Types: Single Family Home - All Property Statuses Price Range: $0 - No Limit SQFT Range: 0 - No Limit Bedrooms: 0 - No Limit Full Baths: 0 - No Limit Half Baths: 0 - No Limit Year Built: 0 - No Limit

The Average For Sale Price was Depreciating* The Average For Sale Price in December was $1,052,000, up 15.4% from $912,000 in December of 2022 and down 0.8% from $1,060,000 last month.

The Average Sold Price was Neutral* The Average Sold Price in December was $915,000, up 18.4% from $773,000 in December of 2022 and down 1.4% from $928,000 last month.

The Median Sold Price was Neutral* The Median Sold Price in December was $747,000, up 9.5% from $682,000 in December of 2022 and down 2.9% from $769,000 last month. * Based on 6 month trend – Appreciating/Depreciating/Neutral

It was a Seller's Market* A comparatively lower Months of Inventory is more beneficial for sellers while a higher months of inventory is better for buyers. *Buyer’s market: more than 6 months of inventory Seller’s market: less than 3 months of inventory Neutral market: 3 – 6 months of inventory

Months of Inventory based on Closed Sales The December 2023 Months of Inventory based on Closed Sales of 2.5 was the same compared to last year and down 3.8% compared to last month. December 2023 was Seller's market. Months of Inventory based on Pended Sales The December 2023 Months of Inventory based on Pended Sales of 4.5 was increased by 12.5% compared to last year and the same compared to last month. December 2023 was Neutral market. All reports are published January 2024, based on data available at the end of December 2023, except for the today’s stats. All reports presented are based on data supplied by the My Florida Regional MLS DBA Stellar MLS. The My Florida Regional MLS DBA Stellar MLS does not guarantee or is not in anyway responsible for its accuracy. Data maintained by the My Florida Regional MLS DBA Stellar MLS may not reflect all real estate activities in the market. Information deemed reliable but not guaranteed.


Mark Boehmig Realtor, GRI, CLHMS (941)807-6936 markboehmig@michaelsaunders.com MarkitsoldLF.com

Zip 34202, Zip 34211 Published: January 2024* Property Types: Single Family Home - All Property Statuses Price Range: $0 - No Limit SQFT Range: 0 - No Limit Bedrooms: 0 - No Limit Full Baths: 0 - No Limit Half Baths: 0 - No Limit Year Built: 0 - No Limit

It was a Seller's Market* Absorption Rate measures the inverse of Months of Inventory and represents how much of the current active listings (as a percentage) are being absorbed each month. *Buyer’s market: 16.67% and below Seller’s market: 33.33% and above Neutral market: 16.67% - 33.33%

Absorption Rate based on Closed Sales The December 2023 Absorption Rate based on Closed Sales of 40.6 was increased by 2% compared to last year and up 7.1% compared to last month. Absorption Rate based on Pended Sales The December 2023 Absorption Rate based on Pended Sales of 22.3 was decreased by 10.8% compared to last year and the same compared to last month.

All reports are published January 2024, based on data available at the end of December 2023, except for the today’s stats. All reports presented are based on data supplied by the My Florida Regional MLS DBA Stellar MLS. The My Florida Regional MLS DBA Stellar MLS does not guarantee or is not in anyway responsible for its accuracy. Data maintained by the My Florida Regional MLS DBA Stellar MLS may not reflect all real estate activities in the market. Information deemed reliable but not guaranteed.


Issuu converts static files into: digital portfolios, online yearbooks, online catalogs, digital photo albums and more. Sign up and create your flipbook.