2 minute read
LAKEWOOD RANCH COUNTRY CLUB


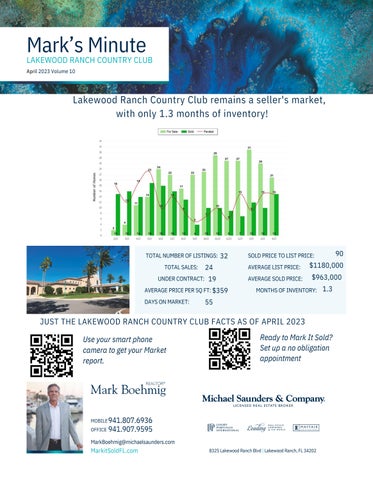
April 2023 was a Seller's market! The number of for sale listings was up 128.6% from one year earlier and down 11.1% from the previous month. The number of sold listings increased 84.6% year over year and increased 118.2% month over month. The number of under contract listings was down 5% compared to previous month and up 11.8% compared to previous year. The Months of Inventory based on Closed Sales was 1.3, up 18.6% from the previous year.
The Average Sold Price per Square Footage was up 1.1% compared to previous month and down 9.1% compared to last year. The Median Sold Price increased by 13.8% from last month. The Average Sold Price also increased by 10.2% from last month. Based on the 6 month trend, the Average Sold Price trend was "Neutral" and the Median Sold Price trend was "Neutral".
Advertisement
The Average Days on Market showed a neutral trend, an increase of 2,650% compared to previous year. The ratio of Sold Price vs. Original List Price was 90%, a decrease of 13.5% compared to previous year.
It was a Seller's Market
Property Sales (Sold)
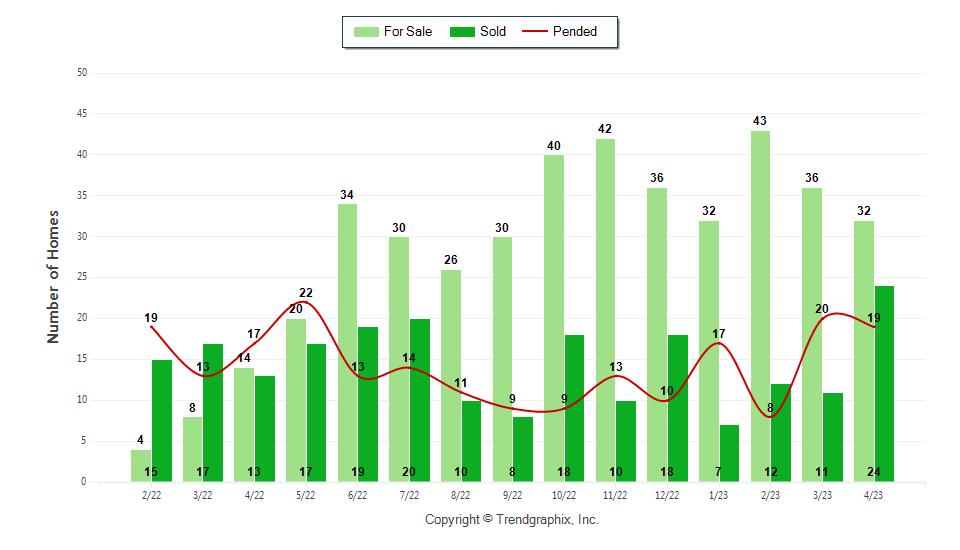
April property sales were 24, up 84.6% from 13 in April of 2022 and 118.2% higher than the 11 sales last month.
Current Inventory (For Sale)
Versus last year, the total number of properties available this month was higher by 18 units of 128.6%. This year's bigger inventory means that buyers who waited to buy may have bigger selection to choose from. The number of current inventory was down 11.1% compared to the previous month.
Property Under Contract (Pended)
There was a decrease of 5% in the pended properties in April, with 19 properties versus 20 last month. This month's pended property sales were 11.8% higher than at this time last year.
Mark Boehmig
REALTOR,
GRI, CLHMS
(941)807-6936 markboehmig@michaelsaunders.com
MarkitSoldFL.com
The Average Sold Price per Square Footage was Neutral*
The Average Sold Price per Square Footage is a great indicator for the direction of property values. Since Median Sold Price and Average Sold Price can be impacted by the 'mix' of high or low end properties in the market, the Average Sold Price per Square Footage is a more normalized indicator on the direction of property values. The April 2023 Average Sold Price per Square Footage of $359 was up 1.1% from $355 last month and down 9.1% from $395 in April of last year.
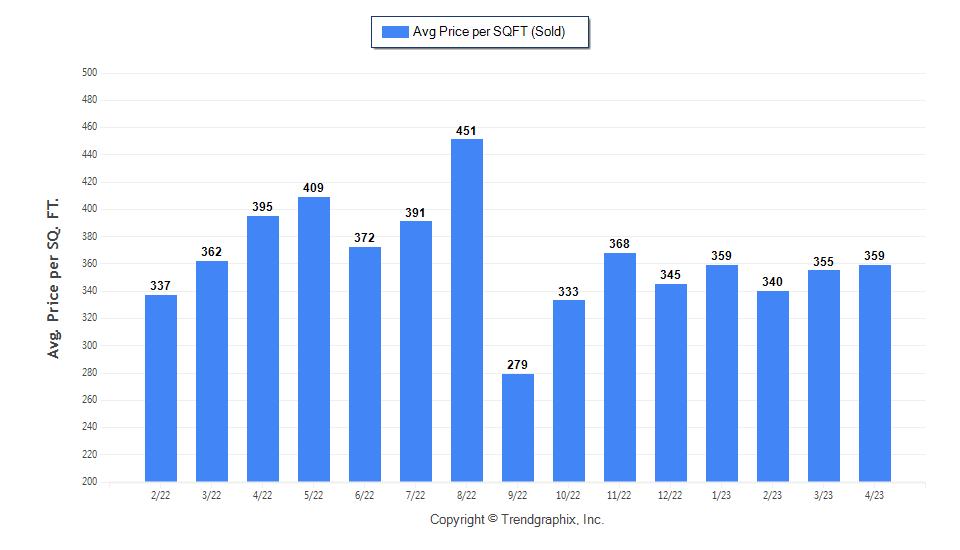
* Based on 6 month trend – Appreciating/Depreciating/Neutral
The Days on Market Showed Neutral Trend*
The average Days on Market (DOM) shows how many days the average property is on the market before it sells. An upward trend in DOM trends to indicate a move towards more of a Buyer’s market, a downward trend indicates a move towards more of a Seller’s market. The DOM for April 2023 was 55, up 1.9% from 54 days last month and up 2,650% from 2 days in April of last year.
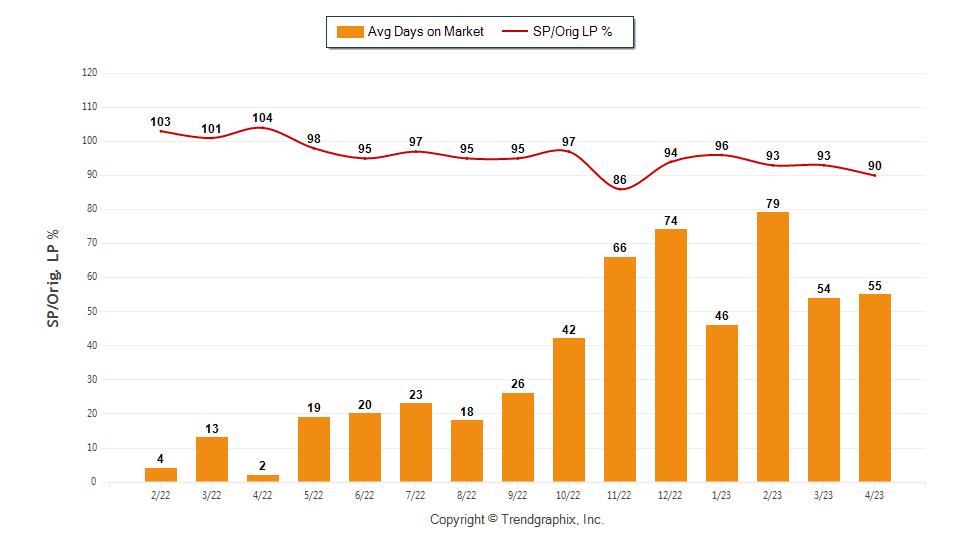
The Sold/Original List Price Ratio was Falling**
The Sold Price vs. Original List Price reveals the average amount that sellers are agreeing to come down from their original list price. The lower the ratio is below 100% the more of a Buyer’s market exists, a ratio at or above 100% indicates more of a Seller’s market. This month Sold Price vs. Original List Price of 90% was down 3.2% % from last month and down from 13.5% % in April of last year.
* Based on 6 month trend – Upward/Downward/Neutral
** Based on 6 month trend – Rising/Falling/Remains Steady
Mark Boehmig
REALTOR, GRI, CLHMS
(941)807-6936 markboehmig@michaelsaunders.com
MarkitSoldFL.com