1 minute read
LAKEWOOD RANCH COUNTRY CLUB


Published: March 2023*
Property Types: All Res. Proptype - All Properties - All Properties - All Property Statuses
Advertisement
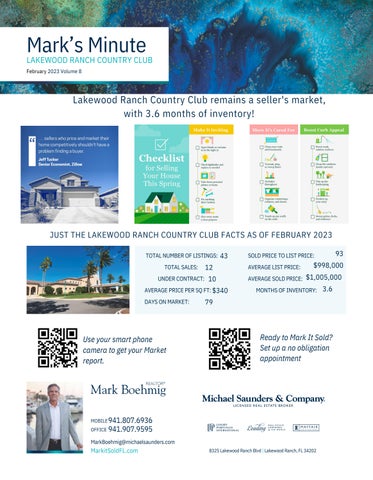
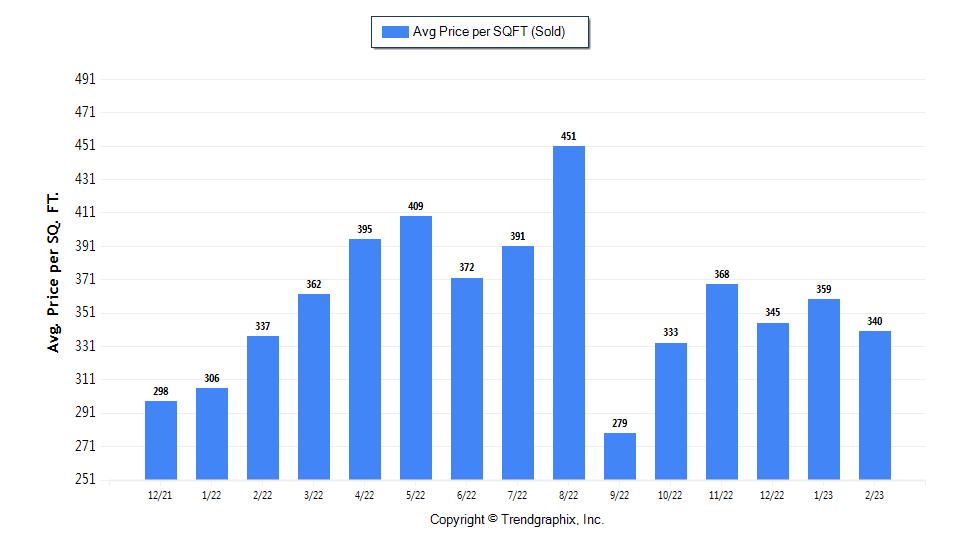
The Average Sold Price per Square Footage was Neutral*
The Average Sold Price per Square Footage is a great indicator for the direction of property values. Since Median Sold Price and Average Sold Price can be impacted by the 'mix' of high or low end properties in the market, the Average Sold Price per Square Footage is a more normalized indicator on the direction of property values. The February 2023 Average Sold Price per Square Footage of $340 was down 5.3% from $359 last month and up 0.9% from $337 in February of last year.
* Based on 6 month trend – Appreciating/Depreciating/Neutral
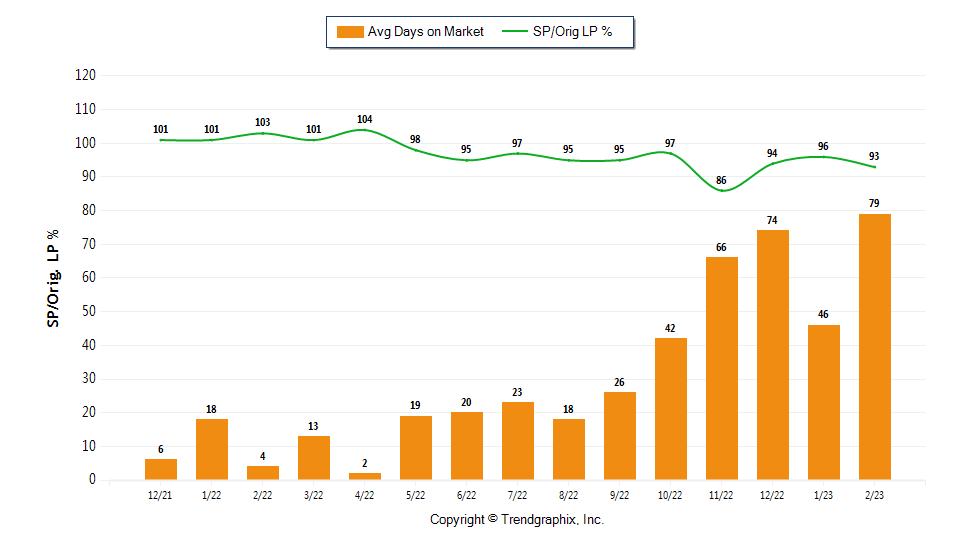
The Days on Market Showed Upward Trend*
The average Days on Market (DOM) shows how many days the average property is on the market before it sells. An upward trend in DOM trends to indicate a move towards more of a Buyer’s market, a downward trend indicates a move towards more of a Seller’s market. The DOM for February 2023 was 79, up 71.7% from 46 days last month and up 1,875% from 4 days in February of last year.
The Sold/Original List Price Ratio Remains Steady**
The Sold Price vs. Original List Price reveals the average amount that sellers are agreeing to come down from their original list price. The lower the ratio is below 100% the more of a Buyer’s market exists, a ratio at or above 100% indicates more of a Seller’s market. This month Sold Price vs. Original List Price of 93% was down 3.1% % from last month and down from 9.7% % in February of last year.
* Based on 6 month trend – Upward/Downward/Neutral
** Based on 6 month trend – Rising/Falling/Remains Steady
Mark Boehmig
Realtor,
GRI, CLHMS
(941)807-6936 markboehmig@michaelsaunders.com
MarkitSoldFL.com