Mark’s Minute
LAKEWOOD RANCH COUNTRY CLUB February 2023 Volume 8
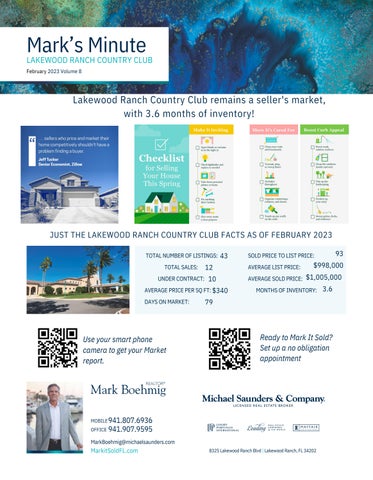
Lakewood Ranch Country Club remains a seller's market, with 3.6 months of inventory!
JUST THE LAKEWOOD RANCH COUNTRY CLUB FACTS AS OF FEBRUARY 2023 TOTAL NUMBER OF LISTINGS: 43 TOTAL SALES:
12
UNDER CONTRACT: 10 AVERAGE PRICE PER SQ FT: $340 DAYS ON MARKET:
Use your smart phone camera to get your Market report.
AVERAGE LIST PRICE:
$998,000
AVERAGE SOLD PRICE: $1,005,000 MONTHS OF INVENTORY:
3.6
79
Ready to Mark It Sold? Set up a no obligation appointment
MOBILE 941.807.6936 OFFICE 941.907.9595
MarkBoehmig@michaelsaunders.com
MarkitSoldFL.com
93
SOLD PRICE TO LIST PRICE:
8325 Lakewood Ranch Blvd | Lakewood Ranch, FL 34202