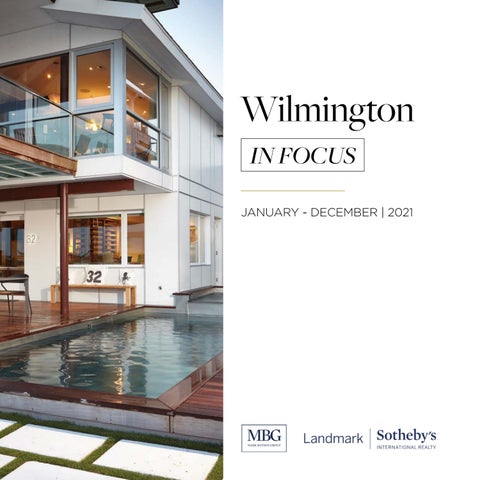
Wilmington IN FOCUS JANUARY - DECEMBER | 2021
Locally owned and operated, Mark Batson Group of Landmark Sotheby’s International Realty is one of Wilmington’s most qualified real estate teams. As a sister company to the award-winning design + build firm Tongue and Groove, our group has strong ties in the homebuilding and real estate industries affording us greater flexibility to address and respond to our clients’ needs— Whether it be buying, selling, architecture, home construction, renovations, or property maintenance. By providing exceptional service, in-depth market knowledge, and unmatched marketing opportunities, we can ensure our clients receive every advantage in the market. The direct affiliation with the Sotheby’s Auction House and Sotheby’s International Realty offers our group an unparalleled global reach allowing our clients the benefit of receiving prime exposure to a network of nearly 1,000 Offices in 75 countries and territories.
GLOBAL REACH BRAND HERITAGE PROVEN RESULTS
WE ARE
MBG
m
bu s
NC 87
C ou
Cas
Roan Island
nty
NC 13
270
17 17
Northwest
I 140 Dollisons Swamp
Lake Sutton 14 14
Sandy Creek 8 8 10
Wilmington
US 74 NC 133
Navassa US 74 US 76
Leland
WIL US 17 US 74 US 76
1 39 39
NC 133
US 17
North Carolina
Wilmington
Hanover C o unty New
Wilmington is a port city in North Carolina. Known for its beautiful clean beaches, locally caught seafood, and active lifestyle, this historic beach town is a perfect mix of small-town charm and big city living. The community of people living in Wilmington, North Carolina, is part of what makes living in the area so exceptional. Due to its rise in popularity, Wilmington has become a culturally booming city amidst a relaxed coastal community.
5 5
10
US 117
nty
stle Hayne 414 US 17
33 416A
20 416B 20B-A 416B
23
NC 132
23
IS LA ND
25
420
Figure Eight Island
US 74
BE
LA
AC H
ND
NC 87 LMINGTON
North Carolina Coastal Land Trust: Orton Plantation Holdings, LLC
TS VI
LL
E
US 17 US 76
Wrightsville Beach
GH RI W
NC 133
US 421
CAROLINA Carolina Beach BEACH
US 76
ou nty
Boiling Spring Lakes
New Hanover County
FA L
L
FI GU RE
EI GH T
420A
US 117 NC 132
Military Ocean Terminal a H ew SunnyNPoint
no ve rC
NC 132
Coastal MangementMasonboro Estaurine Resource Pre
Coastal MangementMasonboro Estaurine Resource Pre
Kure Beach KURE BEACH
NC 87 NC 133
NC 211
Ehnr Zekes Island-
Average # of Sunny Days: 216
Average Annual Weather Temp: 68
Average Water Temp: 64 -76
Top States Moving to North Carolina
06 California
07 Texas
09
04 08 10 01
Pennsylvania
New York
New Jersey
Maryland
Virginia
05
03
South Carolina
Movement Trends TOP 10 STATES OF PEOPLE WHO MOVED TO NORTH CAROLINA IN 2021 (INBOUND MOVES) 1.) Virginia 2.) Florida 3.) South Carolina 4.) New York 5.) Georgia 6.) California 7.) Texas 8.) New Jersey 9.) Pennsylvania 10.) Maryland
Georgia
02 Florida
*Source: Movement trends information provided by the U.S. Census Bureau
FIGURE EIGHT ISLAND BEACH
BOATING
GATED
Privately owned by its homeowners, and only accessible by a single bridge that crosses the Intracoastal Waterway, the island is a rumored haven for celebrities, wealthy CEOs and company owners, and any visitor who just wants a private escape. Though difficult to access, visitors who make the cut by renting or buying a vacation home on the island will be treated to one of the quietest beach landscapes in the area. As a result, Figure Eight Island retains its reputation as one of the most pristine destinations in the coastal Carolinas.
PE RC E N T OF M AR KET
FI G UR E E I G H T I S LA N D
ROLLING 12 MONTHS
AVERAGE SALES PRICE - ROLLING 4 QUARTERS $6M
0% $1.2-$1.99M
0%
$5.5M $5M $4M
UNDER $699K
$3.5M $3M $2.5M $2M $1.5M $1M $500K
0% $700K$1.19M
$250K
100% $2M+
$0 JAN-MAR ‘21
APR-JUN ‘21
JULY-SEPT ‘21
OCT-DEC ‘21
CHANGE IN ANNUAL STATISTICS
-73.9%
AVG. DAYS ON MARKET
Rolling 12 Months Average Sales Price Average Price per SF Average Days on Market Highest Price Sold Properties % Sold to List Price
2020
2021
% Change
$3,144,231
$4,023,690
$741
$1,072
44.7%
188
49
-73.9%
$5,500,000
$5,712,000
-3.85%
26
10
-61.5%
92.2%
98.7%
28.0%
7.0%
WRIGHTSVILLE BEACH
BEACH
BOATING
Known for its crystal blue water, spacious beaches, and active island lifestyle, this beach town is a highly sought-after destination for residents and visitors. Wrightsville Beach offers boaters many accommodating marinas surrounding the island and is famously known for having some of the best surf on the east coast. As land values escalated over the last 20 years, many older beach cottages were renovated or replaced by larger, modern homes, making the community an attractive option for year-round residents and buyers of second homes and summer houses.
PE RC E N T OF M AR KET
WR I G H T S V I LLE BE A C H
ROLLING 12 MONTHS
AVERAGE SALES PRICE - ROLLING 4 QUARTERS $6M $5.5M $5M
39%
6%
$2M+
UNDER $699K
$4M $3.5M $3M $2.5M $2M $1.5M
28% $700K$1.19M
27%
$1M $500K $250K $0 JAN-MAR ‘21
$1.2-$1.99M
APR-JUN ‘21
JULY-SEPT ‘21
OCT-DEC ‘21
CHANGE IN ANNUAL STATISTICS Rolling 12 Months
64.87%
HIGHEST SOLD PRICE
Average Sales Price Average Price per SF Average Days on Market Highest Price Sold Properties % Sold to List Price
2020
2021
% Change
$1,111,262
$1,280,375
15.2%
$603
$754
25.0%
103
50
-52%
$3,895,500
$6,422,686
64.87%
176
150
-14.8%
96.5%
99.1%
2.7%
COUNTRY CLUB OF LANDFALL GOLF
SUBURBAN
GATED
The largest gated community in Wilmington, Landfall is home to some of the area’s finest properties and lavish amenities, boasting two championship golf courses designed by Jack Nicklaus and Pete Dye, all located only a few short minutes from Wrightsville Beach. Twenty-nine miles of private roads wind around mature oak trees and immaculate landscaping, complementing an eclectic array of award-winning architecture. The community provides 24/7 security and a beautiful, neighborly environment for all with its park areas and private club.
PE RC E N T OF M AR KET
C O UN T R Y C LUB O F LA N D FA LL
ROLLING 12 MONTHS
AVERAGE SALES PRICE - ROLLING 4 QUARTERS $2M $1.8M
37%
11%
$2M+
UNDER $699K
$1.6M $1.4M $1.2M $1M $800K $600K
32% $700K$1.19M
$400K $200K $0 JAN-MAR ‘21
APR-JUN ‘21
JULY-SEPT ‘21
OCT-DEC ‘21
19% $1.2-$1.99M
CHANGE IN ANNUAL STATISTICS Rolling 12 Months Average Sales Price
46.6%
AVG. SALES PRICE
Average Price per SF Average Days on Market Highest Price Sold Properties % Sold to List Price
2020
2021
% Change
$828,091
$1,214,240
46.6%
$215
$279
29.8%
98
83
$5,000,000
$4,800,000
-4.00%
164
147
-10.4%
98.1%
97.9%
-0.2%
15%
CAROLINA BEACH
BEACH
BOATING
Find your laid-back beach vibe at Carolina Beach, one of the most down-to-earth, good-time beaches on the Atlantic Coast located just 15 miles from Wilmington. Fun-loving and free-spirited, Carolina Beach offers live music and events, a vintage boardwalk and colorful characters around every corner for a beach community that’s unmistakably Carolina Beach.
PE RC E N T OF M AR KET
C A R O LI N A BE A C H
ROLLING 12 MONTHS
AVERAGE SALES PRICE - ROLLING 4 QUARTERS $600K $550K $500K
76%
$450K
UNDER $699K
$400K $350K $300K $250K $200K $150K $100K
2%
$50K
$700K$1.19M
$0 JAN-MAR ‘21
6%
1%
$1.2-$1.99M
$2M+
APR-JUN ‘21
JULY-SEPT ‘21
OCT-DEC ‘21
CHANGE IN ANNUAL STATISTICS Rolling 12 Months Average Sales Price Average Price per SF
21.5%
AVG. PRICE PER SQ. FT.
Average Days on Market Highest Price Sold Properties % Sold to List Price
2020
2021
% Change
$407,646
$488,840
19.9%
$297
$361
21.5%
65
29
-55.4%
$2,100,000
$2,200,000
4.76%
508
551
8.5%
98.1%
100%
1.9%
KURE BEACH
BEACH
HISTORIC
Located just 18 miles from Wilmington, here you’ll find the kind of small-town beach you visited as a kid. Home to the oldest fishing pier on the Atlantic Coast, an oceanfront park, a nearby state aquarium and historic fort and beautiful seaside surroundings, Kure Beach provides the perfect setting for you and your family to explore this pure and natural playground. Peek into the past under the windswept live oak trees as you tour the grounds of the largest land-sea battle of the Civil War at the Fort Fisher State Historic Site.
PE RC E N T OF M AR KET
K UR E BE A C H
ROLLING 12 MONTHS
AVERAGE SALES PRICE - ROLLING 4 QUARTERS $900K $825K $750K
34%
48%
$675K
$700K$1.19M
UNDER $699K
$600K $525K $450K $375K $300K $225K $150K
14% $1.2-$1.99M
4%
$75K
$2M+
$0 JAN-MAR ‘21
APR-JUN ‘21
JULY-SEPT ‘21
OCT-DEC ‘21
CHANGE IN ANNUAL STATISTICS Rolling 12 Months Average Sales Price
26.3%
AVERAGE SALES PRICE
Average Price per SF Average Days on Market Highest Price Sold Properties % Sold to List Price
2020
2021
% Change
$541,974
$684,477
$277
$351
26.7%
77
25
67.5%
$1,950,000
$2,000,000
2.56%
154
146
-5.2%
98.0%
100%
2.0%
26.3%
WILMINGTON BEACH
BOATING
HISTORIC
From Wilmington’s vibrant riverfront and scenic Riverwalk that winds around the storied Cape Fear River to three colorful island beaches, there’s something about the water here that surrounds, transforms, and enthralls residents and visitors alike. One destination with four unique settings creates a bounty of vibrant vacation experiences.
PE RC E N T OF M AR KET
WI LM I N G T O N
ROLLING 12 MONTHS
AVERAGE SALES PRICE - ROLLING 4 QUARTERS $600K
8% $2M+
4%
$550K $500K $450K
$1.2-$1.99M
$400K $350K
76% 12% $700K$1.19M
UNDER $699K
$300K $250K $200K $150K $100K $50K $0 JAN-MAR ‘21
APR-JUN ‘21
JULY-SEPT ‘21
OCT-DEC ‘21
CHANGE IN ANNUAL STATISTICS
-44.7%
AVG. DAYS ON MARKET
Rolling 12 Months
2020
2021
$346,778
$392,111
$168
$193
47
26
-44.7%
$5,500,000
$5,712,000
3.85%
Sold Properties
5,340
5,300
-0.7%
% Sold to List Price
98.5%
100.1%
1.6%
Average Sales Price Average Price per SF Average Days on Market Highest Price
% Change 13.1% 14.9%
Total Dollar Volume By Neighborhood JANUARY - DECEMBER 2021
Area
2021
2020
Figure Eight Island
$40,236,900
$81,750,000
-50.8%
Wrightsville Beach
$192,056,186
$195,582,116
-1.8%
Carolina Beach
$269,351,093
$207,084,365
30.1%
Kure Beach
$99,933,589
$83,464,012
19.7%
Landfall
$177,279,033
$135,806,910
30.5%
$2,077,794,155
$1,851,446,990
12.2%
Wilmington
% Change
DISCOVER WILMINGTON
EVERY REAL ESTATE JOURNEY HAS A STORY. If you're selling, let's tell it. If you're buying, let's create it. If you're building, let's design it. Whether you're looking to sell, buy, build, or renovate, our group of professionals are ready to assist you. 910.679.4611 | markbatsonrealty.com
Report based on sales volume from information provided by InfoSparks, a program powered by the North Carolina Regional Listing Service, Inc. as of December 31, 2021. All data, including all measurements and calculations of area, has not been, and will not be, verified or guaranteed by broker of MLS nor do they bear any responsibility for the accuracy of the data or information provided. All information should be independently reviewed and verified for accuracy. Properties may or may not be listed by the office/agent presenting the information.