8 minute read
Enhanced modelling of maritime’s future fuel mix

BOOTH NO. 1.507
OFFSHORE ENERGY AMSTERDAM
Advertisement
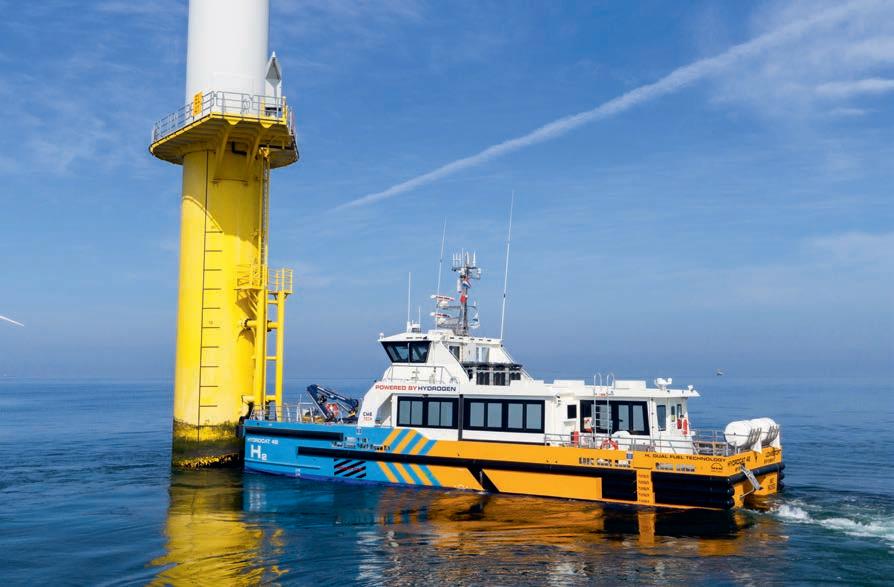
Photo courtesy of CMB.TECH.
All carbon-neutral options are needed in the future fuel mix to meet existing and accelerated targets to decarbonise shipping. This creates a big challenge for deciding what fuel production, distribution and bunkering infrastructure to invest in, and which on-board technologies to choose.
WORDS BY EIRIK OVRUM, MARITIME PRINCIPAL CONSULTANT AT DNV AND LEAD AUTHOR OF MARITIME FORECAST TO 2050. ALL IMAGES COURTESY OF DNV, UNLESS STATED OTHERWISE.
DNV’s sixth Maritime Forecast to 2050 presents the findings of an enhanced GHG Pathway Model running 24 updated fuel scenarios to generate insights for decision-making processes to achieve more robust and future-proof emissions-reduction solutions for shipping.
Investigating future availability
The Maritime Forecast to 2050 report uses an enhanced version of the GHG Pathway Model to build and run an updated portfolio of scenarios to explore the fuel transition ahead. The modelling shows that the future fuel mix is highly dependent on underlying assumptions, notably regarding fuel prices and policy ambitions. Vessel owners therefore need transition plans that reflect the uncertain future, and flexible fuel solutions that provide robustness and reduce carbon risk.
The model updates DNV’s portfolio of decarbonisation scenarios for investigating what will determine the future fuel mix and uptake of carbonneutral fuels. The scenarios are applied to assess fuel costs by region. The report also illustrates what impacts regional fuel production and infrastructure will have on the fuel mix. The results highlight key factors for achieving specified decarbonisation pathways. Using scenarios can assist strategic decisions on newbuilding and onshore fuel infrastructure for an industry that needs to be flexible and resilient to a range of possible regulatory and technology futures.
Two pathways
DNV explored twelve scenarios (Figure 1) in each of two decarbonisation pathways: IMO Ambitions, in which shipping achieves the ambitions in the current IMO GHG Strategy to halve total GHG emissions by 2050 compared with in 2008, and full Decarbonisation by 2050. Six ‘fuel family’ variations, simulate the availability of sustainable biomass to produce biofuels (for example bio-MGO), renewable electricity to produce electrofuels (for example e-MGO), and fossil fuels with CCS (so called blue fuels). For each of these three fuel families, ‘High’ or ‘Very high’ fuel-price advantage are assigned to one fuel family over the others on a basis described in the report. Three cost variations are explored for specific fuel types, in which changes in the relative cost di erences between fuels within each family are explored (as described fully in the report).
Figure 2 shows the energy mix in midcentury for each of the 24 numbered scenarios in Figure 1. The report describes the 24 energy mixes in fuller detail, but illustrative highlights include: IMO ambitions scenarios (scenarios 1-12): fossil fuels have a 53% to 63% share in the total energy consumption of the fuel mix. The share of carbon-neutral fuels (not including electricity from grid) is 30% to 40%. Decarbonisation by 2050 scenarios (scenario 13-24): fossil fuels are eliminated. All scenarios: around 3.5% of total energy is from grid electricity, mainly from shore power, but also from battery-driven ships. >>

Figure 1: List of the 24 scenarios described in DNV’s report.

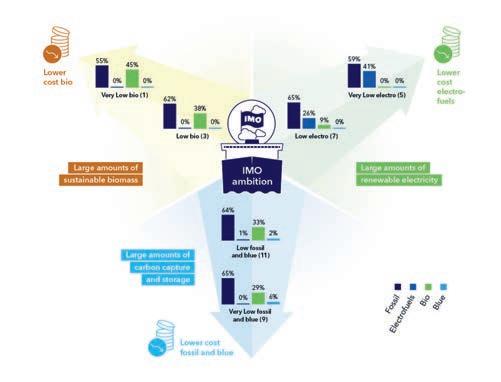
Figure 3: The 2050 energy mix of IMO ambitions fuel family variation scenarios.

Figure 4: The 2050 energy mix of Decarbonisation by 2050 family variation scenarios.
What energy will vessels get from carbon-neutral fuels?
According to DNV in most of the scenarios, around 5% of the energy use in 2030 is from carbon-neutral fuels. Under IMO ambitions, this grows to around 20% in 2040, depending on the scenario. In Decarbonisation by 2050, the share of carbon-neutral fuels reaches 40% to 50% in 2040. Some carbon-neutral fuels dominate the 2050 energy mix in at least one scenario, namely bio-MGO and e-MGO, bio-LNG, blue ammonia and e-ammonia, and bio-methanol. Among carbon-neutral fuels, the share of carbon-neutral dropin fuels (bio-MGO, e-MGO, bio-LNG, e-LNG) is greater in IMO ambitions
Policy key driver
DNV’s survey shows that the narrow range of fuel families that will contribute to the 2050 energy mix for shipping reflects how policy decisions are the main influencers of uptake of carbonneutral fuels. According to the company it is only in the ‘Very Low bio’ and ‘Very Low electro’ scenarios that one can see a slightly lower fossil share, and this is attributed to biofuels and electrofuels being cost-competitive with fossil in some regions. Biofuels dominate the carbon-neutral fuels’ share in scenarios where the bio price is advantageous (‘Low bio’ or ‘Very Low bio’). Where electrofuels have the price advantage (‘Low electro’ or ‘Very Low electro’) they can outcompete bio-alternatives.
Drop-in fuels can outcompete
In the IMO ambitions scenarios (Figure3), the bio- and electrofuel families include drop-in fuels compatible with conventional fossil fuel technology: namely bio-LNG or e-LNG for LNG, and bio-MGO or e-MGO for MGO/LSFO. The blue fuel family lacks drop-in options, and bio-alternatives therefore also dominate in the IMO ambitions scenarios where blue fuels are assigned price preference (‘Low blue’ or ‘Very Low blue’). In these, fossil fuel prices are also low. Consequently, drop-in solutions in which either cheap fossil fuel or expensive biofuel can be used outcompete those that need more expensive on-board fuel technology and storage.
Impact of decarbonisation
All fossil fuels are removed by policy requirements when it comes to the Decarbonisation by 2050 scenarios (Figure 4). In these scenarios, biofuels dominate the mix when the bio- price is advantageous (‘Low bio’ and ‘Very Low bio’) but are also much in evidence when blue fuels are given preference (‘Low blue’ and ‘Very Low blue’). Blue fuels attain only a 58% share even under the most advantageous conditions. Where they have the price advantage (‘Low electro’ and ‘Very Low electro’), electrofuels can outcompete the bioalternatives.
In general, the share of drop-in fuels among carbon-neutral fuels is less in Decarbonisation by 2050 scenarios than in IMO ambitions. This is because the decarbonisation regulations require all ships to be fully carbon-neutral when 2050 is approaching (and newbuilds from 2040). Hence, more ships tend to invest in ammonia or methanol technology instead of fulfilling the requirements with carbon-neutral dropin fuel. Aside from newbuild and retrofit costs for vessels, shipowners contemplating the energy transition are likely to factor in fuel availability and decisions by other stakeholders. The availability of carbon-neutral fuels and relevant technologies will be critical to achieving either the IMO ambitions or Decarbonisation by 2050 pathways. The modelling varies fuel prices to simulate fuel-supply constraints. For example, if there is insu cient sustainable biomass to meet demand, its consequently high price will lead to either the ‘Low electro’ or ‘Low blue’ scenarios in which lowerpriced electro or blue fuels, respectively, will replace biofuels.
Pricing the maritime fuel transition
Achieving each scenario will require substantial investment in on-board technologies for vessels to use new fuels, and in onshore infrastructure for producing and distributing carbonneutral fuels. Fuel infrastructure investments outpace on-board investments in almost all our scenarios. Decarbonisation by 2050 would need about 150% more investment than IMO ambitions. About USD 28 billion to 90 billion per year will be required to scale up onshore production, fuel distribution and bunkering infrastructure to supply 100% carbon-neutral fuels by mid-century. The largest onshore investment needs are for renewable electricity production and electrolysis plants. These occur in scenarios with ‘Low electro’ and ‘Very Low electro’ prices and high uptake.
Carbon-neutral fuel use accelerates after 2040
In DNV’s modelling, carbon-neutral fuels, disadvantaged by their higher cost, make a limited contribution to emission reduction before 2030. Until then, requirements are met mainly by LNG’s increasing share in the mix, energye ciency measures, logistics improvements and speed reduction. Beyond 2030, carbon-neutral fuel use grows to become the dominant measure for reducing CO2 emissions beyond the year 2040. Nevertheless, multiple stakeholders are already considering what advantages there might be for first movers initiating projects making carbon-neutral fuels available at volume in specific regions. These players include vessel and cargo owners, finance, fuel providers, energy majors, governments and ports, including some involved or interested in green shipping corridors. To demonstrate how modelling can inform decision-making for this purpose, DNV has run Decarbonisation by 2050 scenario 19 with increased (‘High’) initial availability of ammonia in Europe and South East Asia. The results show significant short- and long-term increases in uptake with higher initial availability. Uptake of ammonia also increases in other regions, such as Middle East and North Africa), and globally (Figure 5).
Collaboration is key
The initial availability in selected regions has ripple e ects beyond their borders, and they have seen this pattern before in the uptake of LNG and batteries in shipping. DNV expects similar e ects for other carbon-neutral fuels assigned favourable conditions in the scenario design. Driven by procurement requirements from governments, uptake of LNG and batteries was assisted by infrastructure first being developed locally, then nationally, then regionally and globally. It illustrates that the public sector can be an important enabler for phasing in new low-emission technology in shipping. The challenges and opportunities illustrated in DNV’s modelling can only be solved by strong alliances among the sector’s stakeholders and with other industries competing for carbon-neutral fuels.
i.dnv.com

