3 minute read
Key factors that could lead to misinterpretation

from A guide to using the Data Farming application for Satellite NDVI imaging to assist in identifying an

Key factors that could lead to misinterpretation Cloud cover
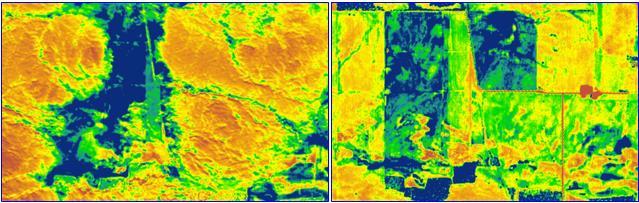
While the DATA FARMING program presents an estimate of cloud cover across your site region for each image, and it is recommended to use images showing 0% cloud cover, there are times when the period you need to analyse has cloud cover on every satellite pass. Sometimes you can gain cloud free images from times when there is 20-30% cloud cover shown on the tab, as these clouds may not fall on your particular site. There are some rare occasions when a 0% cloud cover tab may still show a cloud in your image, so keep this in mind if something appears out of place. As seen in Figure 10, clouds can present as areas lacking growth, such as a very sandy or bare area. Cloud shadows can also distort NDVI image colours. Cloud distortions are recognised by:
comparing these images with other site dates, comparing the presence of specific features; ground truthing, or just knowing the site you are dealing with; and becoming familiar with the distinct clouds image shapes after gaining program experience.
Figure 10. NDVI image of same location by with (left) and without (right) cloud cover
Trees or other perennial vegetation
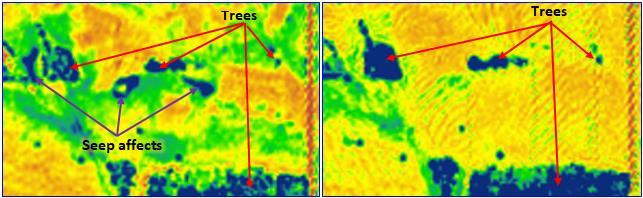
Perennial vegetation can easily be mistaken for seep affected areas, particularly when they appear in close proximity to sandy rises, as shown in Figure 11. Again, a knowledge of the site, or ground truthing will quickly overcome any confusion. While the first image (left) shows seep affected areas appearing similar to the treed areas in October, the second image (right) is in late November after harvest and a summer weed spray. The plant growth associated with the seep areas has essentially been removed while the treed areas remain blue.
Figure 11. NDVI image of same location showing how trees can imitate seep affected areas
Summer crops / summer weeds
In targeting areas of persistent plant growth through summer to help ascertain any presence of perched water tables in the landscape, one must be mindful of other factors causing paddock growth. Summer rainfall resulting in unsprayed summer weeds could appear as a potential seep threatened area. This may well be an indicator of areas of higher water availability, but may also be unrelated to deeper soil moisture. Similarly, Figure 12 shows a contrast of times and reasons for the blue high growth areas due to summer crops. Seeking farmer knowledge is vital in these cases.
Figure 12. NDVI image from Nov 5th showing frost effects on NDVI imaging.
Frost Events
October and November are key times to assess potential seep affects due to crops maturing later in wet areas. However, sometimes frost events can cause a similar affect in areas where they have reshot and remain green for an extended period. Farmer knowledge of the areas affected by frost may prove critical in gaining an accurate interpretation of spring NDVI images and assessing potential seep risks and management strategies, as evident in Figure 13. In a season that cut off early with a dry spring, many of the swale areas between sandy rises were frosted and stayed green. However, there were also specific zones of seep affected areas that were clearly identifiable through the following spring’s NDVI imaging as well as ground truthing.
Figure 13. Same NDVI Site. Nov 4 (left) - threatening seeps, Jan 18 (right) - summer cropping


