2 minute read
Infrastructural Footprints


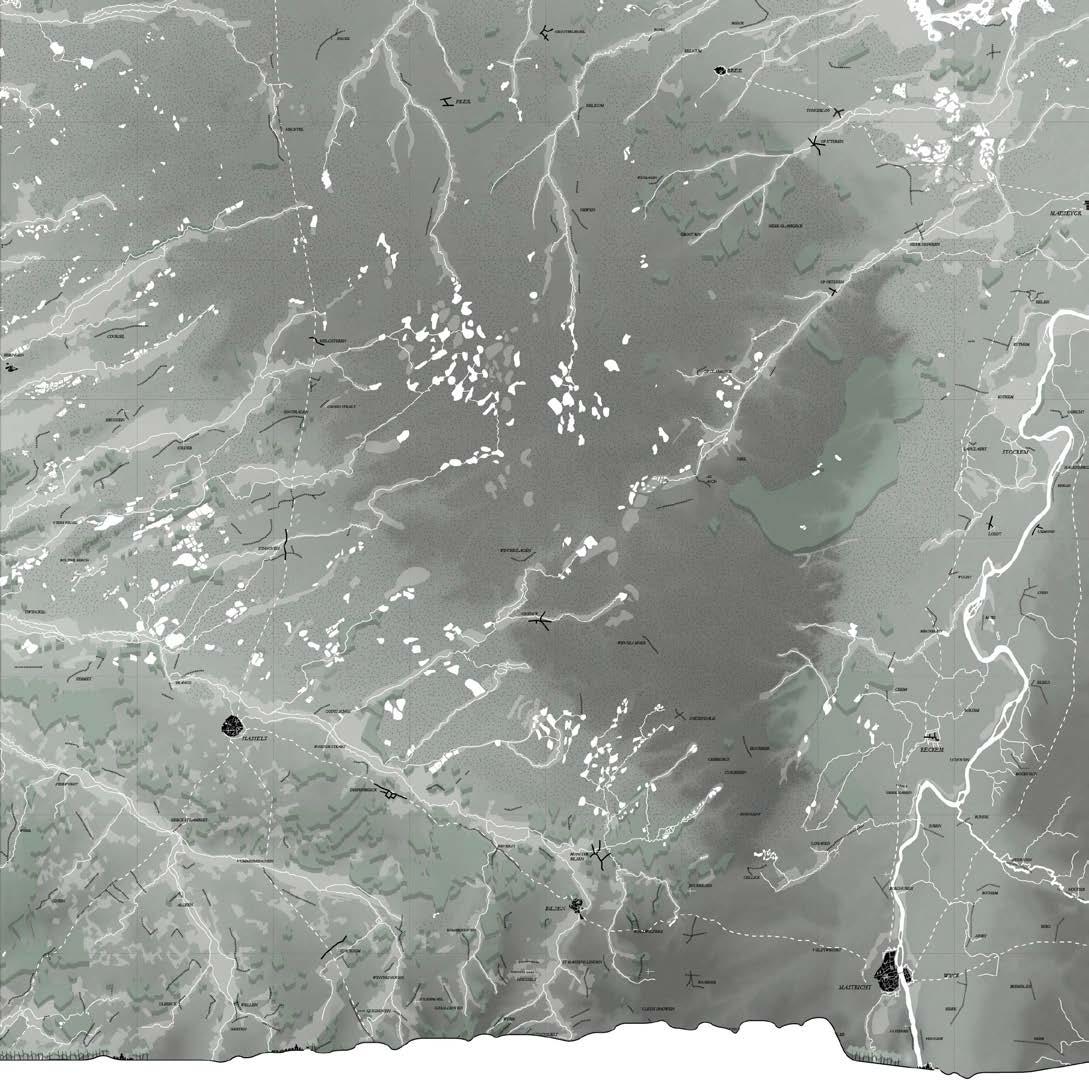
The situation around 1850’s shows an infertile plateau covered with heathland while on the other hand edges of the topography and valleys are fertile, well irrigated and covered with small villages developed along the water. The east side of the plateau is made of fingers-like irrigation while the west side of the plateau follows an NS axis underlined by the Meuse. Together with those natural dynamics, we can already see two trade roads with NS orientation and following the edge of the plateau: in Houthalen-Helchteren there is the ‘Grote Baan’ from Hasselt to the north and in Maasmechelen there is the road connecting Maastricht and Maaseik.
Interpretation
Advertisement

Map sources: Ferraris map (1775): Arcgis online Topography Belgium (2015): Arcgis online Historical maps the Netherlands (1820): http://www.kaart.edugis.nl/ Topography the NethererlandS (2015): http://www.opentopo.nl/ Fricx (1712): Arcgis online Grote Baan Houthalen-Helchteren before 1939 source: http://tantelily.blogvie.com/2014/01/10/kronieken/


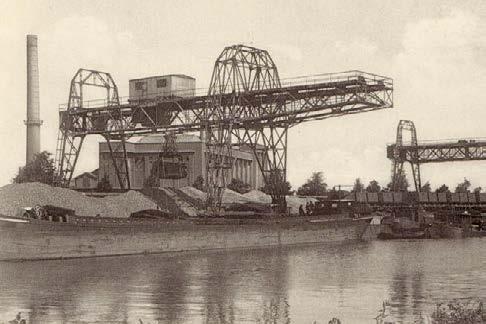
Interpretation Around the 1930’s, industrial activity was located on the plateau, re-orienting the evolution of the region. Mining changed the topography at the micro scale with terrils and excavations. It modified the landscape, from heathland to pine forests and led the urban development growth with new cités for people working in the mines. New infrastructures were built to optimize productivity such as the canals that replaced the rivers while reinforcing the valley figures by respecting topography, or the railways, that cross the plateau to link all the mining sites.
Map sources: Topography Belgium (2015): Arcgis online Historical maps the Netherlands (1820): http://www.kaart.edugis.nl/ Topography the Nethererlands (2015): http://www.opentopo.nl/ Vandermaelen map (1851): Arcgis online NGI Map (1939): http://www.cartesius.be/CartesiusPortal/# Historical maps Belgium (1850): http://www.cartesius.be/CartesiusPortal/# Historical maps the Netherlands (1850): http://watwaswaar.nl/#---1-1v-1E3gYq-Aee Eisden source: Delcampe http://www.delcampe.be/items?language=F&catLists%5B0 %5D=8892&page=1&searchString=&useAsDefault=N&layoutForm%5Blistit emsperpage%5D=50


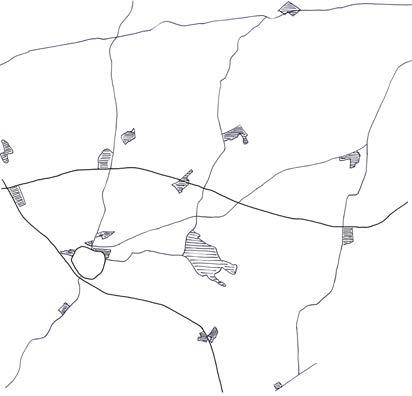
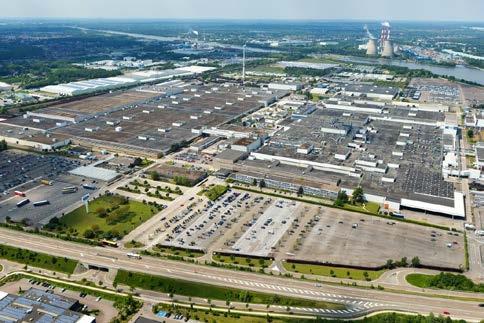
Interpretation The current map shows the construction of the highways E314/E40 and E313, which are related to the bipole Hasselt Genk. This road network allows industrial developments to take place anywhere and to spread out. We notice three different urbanization patterns: in the south, fertile land and ribbon development that surrounds the agricultural plots; in the middle, a bipolar development alongside the former industrial axis and in the north a combination of more dense cities, large open space structures on top of the Campine plateau and forest structures.
In this urban pattern structure Houthalen is related to the Bipole of Hasselt –Genk while Maasmechelen, is part of a north-south development along the canal, and thus related to Lanaken and Maastricht
Map sources: NGI map(2015): http://www.ngi.be/topomapviewer/public?lang=nl& Holland Map(2015): http://www.opentopo.nl/ Limburg Map (1969) Cartesius: http://www.cartesius.be/arcgis/home/ webmap/viewer.html?useExisting=1&services=01de8311ea4a4c9993d73c7 79a0b0288 Figure ground (2015) : Agiv online Ford Genk Souce: http://s1.hbvlcdn.be/Assets/Images_Upload/2015/07/17/34c80ef82cbb-11e5-96ea-98e5cc2bbabf_web_scale_0.2419355_0.2419355__.jpg