9 minute read
Eric Baack

from Agora Fall 2022

Investigating Sunflower Ancestry and Catching Up to Next-Generation Sequencing
by ERIC BAACK, Professor of Biology
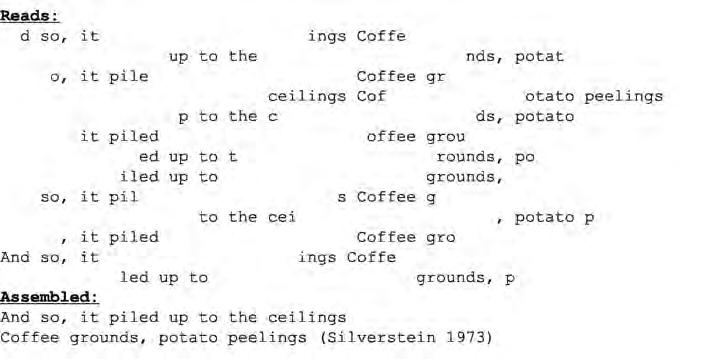
Ifinished my PhD in 2003, and my post-doc in 2007, just as the first “next generation” DNA sequencers were being put to use. These tools have vastly reduced the price of genome sequencing, making repeated sequencing of cancer tumors a clinical tool. By 2014, genome sequencing had become a standard tool in my field of evolutionary biology, but one that I didn’t know how to use. During my last sabbatical, I spent the fall of 2014 in the greenhouse and lab at the University of British Columbia, developing my expertise by preparing nearly every species of sunflower (genus Helianthus) for genome sequencing. In April of 2015, I received the reads—all 50 gigabytes of data—but the challenge of analyzing the data led me to let them sit until this sabbatical, when I opened them up to see what sense I could make of them. Contemporary sequencing techniques take an organism’s complete DNA, which in the case of humans and sunflowers is around 6 billion pairs of bases, and break it into small fragments of about 500 bases. Each of these is “read” by a sequencer that obtains the sequence of the two ends of the fragment (Figure 1). By doing this millions of times, the sequencing will “read” all parts of the DNA multiple times, allowing scientists to reassemble the genome from the fragments. Imagine that two lines of a poem (analogous to the sequence of a gene) were concealed in an organism, and could not be read without sequencing the organism. Here are what the paired end reads might look like, and how they could be assembled into the full two lines (Figure 2). In this example, I laid out the fragments by hand, but software is essential for dealing with the billions of bases generated by sequencing. One of my goals for this project was gaining experience with current sequencing technologies and the software tools for analyzing the data so that I could better understand scholarly papers that I was reading with students. However, I was also thinking about a way to investigate why the majority of plant species have duplicated genomes. Species with diploid (two fold) genomes are familiar to us, as humans, most other species of mammals, and birds have two copies of their chromosomes. In polyploid organisms, there may be four sets (or more!) of chromosomes. This is quite common in plants: bread wheat has six sets of chromosomes (“hexaploidy”), as do Jerusalem artichokes (Helianthus tuberosus). One enduring question in evolutionary biology is why polyploidy is so common in plants. Having more chromosomes and more DNA is often disadvantageous as cells require more time to duplicate all the extra DNA,
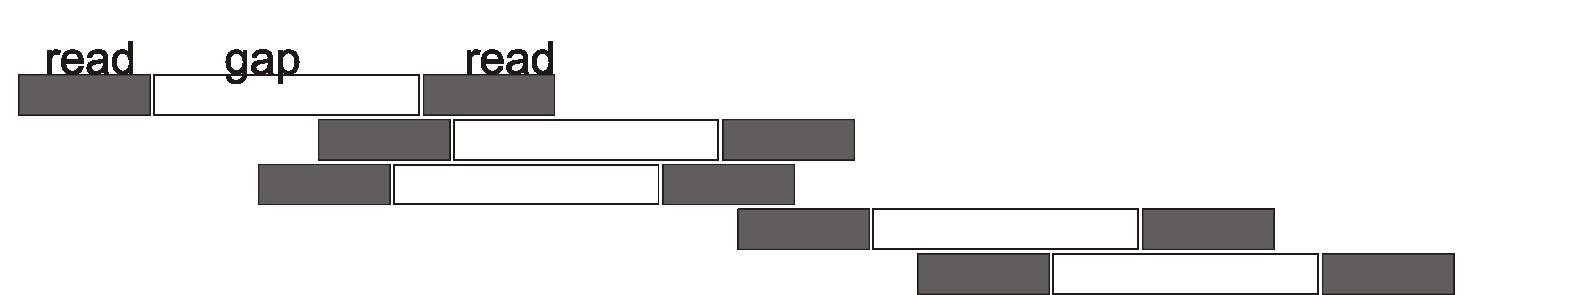
Figure 1: Schematic of next generation sequencing using paired-end reads. The top line shows the length of a gene. The bottom five lines show how sequencing reads two short portions of the original, separated by a gap. With enough reads, the full sequence of the original gene will be covered. Eric Baack

and extra DNA uses more nitrogen and phosphorous. One hypothesis has been that polyploid organisms have more evolutionary flexibility than their diploid relatives. If you have one set of genes that is crucial to your survival, mutations to those genes, or to the nearby regions that regulate them, may be unfavorable. However, if you had a second set of these genes, one set might experience mutations without any harm as the other set was still working as it should. In some cases, this second set might take on new functions that would lead to higher fitness. We know that this is sometimes true in the case of duplicated genes, which are surprisingly common: the average human offspring has ten duplicated genes that aren’t present in either parent, and any two humans are likely to differ in the number of copies of some genes. However, it is not clear if having four or six copies of chromosomes leads to different evolutionary patterns. The ideal test case would compare a large number of closely related polyploid species with a large number of diploid relatives. The sunflowers of North America could be a perfect group to study. There are around 50 species of sunflowers, and over a dozen of these have experienced genome duplications. All of the species have originated in the last five million years, so they are very closely related. The next step in the study would be to make sure that the relationships between the species were well understood in order to compare the evolution of polyploid species with their closest diploid relatives. Unfortunately, some of the same factors that make sunflowers ideal to study also lead to difficulties. Evolutionary biologists look for shared changes from an ancestor to group species together. If species A shares many changes with species B, then we infer that species A and B share a recent common ancestor (Figure 3). But, over short periods of time (e.g. a few million years for plant species), very few changes might occur to genes, making it more difficult to figure out relationships. Mutations would occur, but many mutations to genes that are important would have harmful effects and so would not persist. Even those that did not lower survival would often be lost due to chance. As a result, several species might be identical in their DNA sequences for a gene, making it difficult to infer ancestry. Polyploid species add a second layer of complexity, as they often form when two species hybridize, then a mutation leads to a doubling of the genome. Polyploid species therefore share ancestry with two different species. With luck, the DNA sequencing would capture copies of genes from both ancestors, allowing me to infer both relationships, but this would only work if enough changes had occurred between the ancestors to allow me to distinguish their genes, and if the sequencing worked well enough to allow me to read both copies. I knew that there was a good chance that I wouldn’t succeed in making progress on my scientific question, but I was confident that I would learn a great deal in the attempt. One approach to these challenges is to use more data—and this is where next generation sequencing comes in. Back when I was in graduate school, papers would be published using one or two genes to understand the relationships between species. Now, scientists often use complete genomes. With my budget, I couldn’t afford to sequence 20,000 genes from 100 samples—but I could afford to sequence 900 genes. I was particularly hopeful that I might sequence enough introns—the areas in the middle of genes that don’t have code for proteins, so might evolve at a higher pace—to be able to figure out ancestors. So, in January of 2022 I sat down to dig into 50 gigabytes of sequence data, with each gene broken into pieces that had 120 bases of DNA sequence separated by a gap of unknown length. The data had sequences from 900 genes from 100 samples; I needed to sort out each gene for each sample—so sort things into 90,000 piles. Then I had to assemble the gene fragments into full genes for each of these piles, line my genes up, and attempt to figure out relationships. Many scientists have done this work for diploid species, and have left careful instructions on what to do. However, the software tools are constantly changing, and those that worked in 2014 no longer work today. Fortunately, I’d spent some of the time between 2014 and 2022 taking computer science courses, so had the programming skills that allowed me to use the tools in different combinations. In my sampling, I had deliberately included multiple populations of some species with the hope that they would group together, but in the case of Helianthus giganteus, they did not. Instead, one population of H. giganteus clustered with H. divaricatus (Figure 4). There are several potential causes for this. First, some of the sunflower species are very tough to tell apart. I grew seeds from a seedbank operated by the US Department of Agriculture, and their collectors have included some of the best sunflower taxonomists. But when I checked the traits of the plants, I found that some did not quite match the species’ descriptions. Perhaps this was because many sunflowers can hybridize, and so one or more populations might have been descendants of hybrids between two species. A study from the 1950s (Long 1955) suggested that H. divaricatus can hybridize with H. giganteus, and that the offspring look like H. giganteus. I am still working on
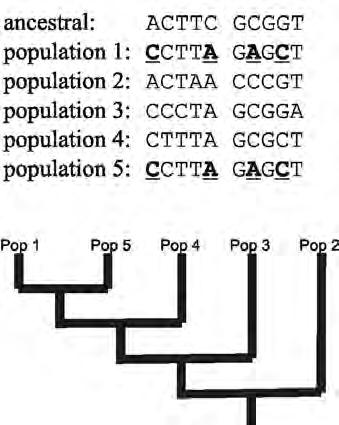
Figure 3: Sequences from an ancestor and five descendant populations, and inferred evolutionary relationships. Populations 1 & 5 share four changes from the ancestor (underlined), so are most closely related to each other.
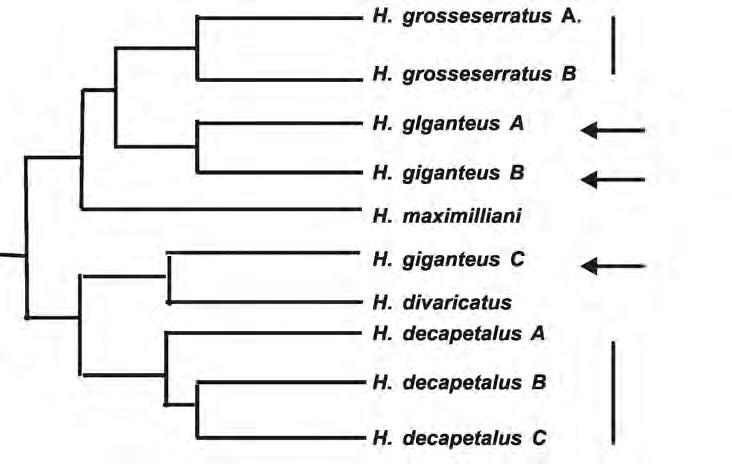
Figure 4: Portion of diploid sunflower phylogeny. Vertical bars on right show two populations of Helianthus grosseserratus and three populations of H. decapetalus that clustered together, as expected. Arrows show three populations of Helianthus giganteus which do not cluster together.
analyzing the data to determine if there is evidence for hybridization. In summary, I am not sure that my method has failed, but I have reason to worry. I found a larger issue when I went to add the polyploid species. I’d hoped that I’d have multiple sequences at each gene to help determine who are the closest diploid relatives, but in most cases, I had just a single sequence. This may be due to the software tools I used to assemble my gene fragments into full genes. The assembler I used (Bankevich et al 2012) incorporates error correction, which is important because next generation sequencing isn’t perfect—some fraction of the reads it produces have errors. However, I worry that the assembler might mistake two slightly different copies of a gene for sequencing errors, and therefore collapse the differences into a single assembled sequence. To see if this might be true, I’ll need to return to generate some simulated data for the assembler to align to see if it works correctly. My sabbatical did not allow me to answer the question of how polyploid sunflower species are related to their diploid relatives, much less the question of why so many plant species are polyploid. All the same, I’m happy with the progress I’ve made so far. While some parts of my results are unexpected, many other pieces fit well with prior analyses. I have a better sense of how the tools work and where they might not work perfectly. In this genomic era, many biology students think of genome sequencing as the first step in solving biological questions. As a result of my sabbatical, I have a deeper sense of why some questions will remain challenging despite the potential of this approach.
References
Bankevich, Anton, Sergey Nurk, Dmitry
Antipov, Alexey A. Gurevich, Mikhail
Dvorkin, Alexander S. Kulikov, Valery
M. Lesin, et al. 2012. SPAdes: A New
Genome Assembly Algorithm and Its
Applications to Single-Cell Sequencing.
Journal of Computational Biology 19: 455–77. Long Jr, Robert W. 1955. Hybridization in
Perennial Sunflowers. American Journal of Botany, 1955, 769–77. Silverstein, Shel. 1984. Where the Sidewalk
Ends. Columbia New York, 1984.