your suburb by suburb property guide MARCH 2021 | ISSUE 49
Reporting on the December Quarter 2020
1
TH
ANNIVERSARY
p4
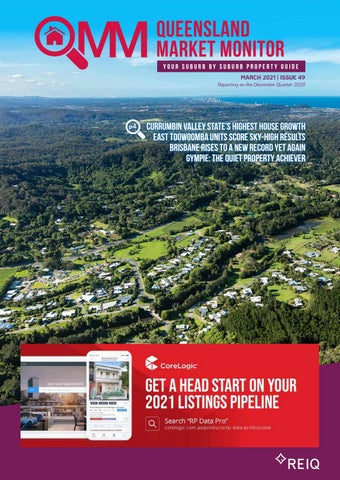
Currumbin Valley State’s Highest House Growth East Toowoomba Units Score Sky-High Results Brisbane Rises to a New Record Yet Again Gympie: The Quiet Property Achiever
REIQ Research Explanatory Notes SALES MARKET DATA
All figures for the most recent quarterly and yearly periods are preliminary only and subject to further revision as additional sales records become available (see Research Methodology online at reiq.com).
“Vendor Discount” is the median difference between the contract price on a property and the first advertised price. The figure is expressed as a percentage and is an average of all private treaty sales which sold for less than their initial asking price.
As of the June quarter 2013, all sales data includes “Recent Sales” as advised by real estate agents as well as official records as advised by DNRM. As such comparisons with figures published prior to the June quarter 2013 should be done with caution.
“Total Listings” is the total unique number of properties that have been advertised for sale and captured by CoreLogic RP Data over the 12 month period. To be included in the count, the listings have to be matched to an actual address.
A median sale price is derived by arranging a set of sale prices from lowest to highest and then selecting the middle value within this set (i.e. the 50th percentile, where half of recorded sales were less and half were higher than the median).
“% Stock on Market” is the percentage of dwellings within the suburb or local government area that has been listed for sale over the past year.
Only suburbs and regions to record sufficient sales numbers (at least 20 sales for the quarter) at the time of reporting are published. Median price changes are influenced by varying quality of properties sold. N/A
Due to insufficient sales numbers (as at the time of data extraction) no median sale price has been calculated.
N/D
Not displayed due to price movements potentially driven by type of stock transacting.
(LGA) Local Government Area (SD) Brisbane Statistical Division comprising the LGA of Brisbane City, Ipswich City, Logan City, Moreton Bay Regional and Redland City. Sunshine Coast (SD) Sunshine Coast Region comprising the LGA of Sunshine Coast Regional and Noosa. #
Figures based upon the new council boundaries
^
Indicates acreage sales only (with land size greater than 2400m2). All other data is based upon sales with a land size of less than 2400m2
#1
Smallest stock on market refers to all houses for the year to November 2018. The annual median house prices refer to houses <2400m2 and for the year to December 2018.
ON THE MARKET INDICATORS
At the time of publication, latest information available was for the 12 months ending the month prior to end of the quarter reporting period. “Days on Market” is calculated as the median number of days it has taken to sell those properties sold by private treaty during the last 12 months. The calculation excludes auction listings and listings where an asking price is not advertised. The days on market calculation uses the contract date on the property compared with the first advertised date.
RENTAL MARKET DATA
All median weekly rents are published on a postcode basis, as calculated by the Residential Tenancies Authority, where sufficient data is available. Caution should be exercised when interpreting any median rental price data based upon a relatively small number of new bond lodgements. L
Listed localities (or suburbs) represent one on potentially several that fall within that postcode.
N/A
Due to insufficient new bond lodgements, no median rental price has been calculated
Source: Residential Tenancies Authority, rental bond lodgements
GROSS RENTAL YIELDS
House yields are based upon median house prices and RTA median weekly rent for three-bedroom houses. Unit yields are based upon median unit and townhouse sale prices and RTA median weekly rent for two-bedroom units.
The market trends data changed in November 2018 to improve the accuracy of the residential property universe. Recent changes have had an impact in the overall counts of properties and overall listing volumes. As such, an annual comparison of the stock on market may not necessarily provide an accurate representation of trends. Source: REIQ, data supplied by CoreLogic
PRICE POINT GRAPHS
Some data contained within these graphs represents preliminary sales numbers and is subject to revision as additional sales records become available. The data excludes any recent sales transactions where the contract sale price was not disclosed. The intention of these graphs is to gauge trends in sales activity between periods in lieu of actual final sales results and compare it with historical data. Source: REIQ, data supplied by CoreLogic
DEMOGRAPHICS INFOGRAPHICS
Population data has been sourced from the Australian Bureau of Statistics and refers to December 2017. Median age and ownership structure of the dwellings has been sourced from the 2016 Census data.
EMPLOYMENT INFOGRAPHICS
The employment data for the SA4 region is sourced from the Australian Bureau of Statistics (ABS 6291.0.555.001). The data refers to the relevant QMM quarter.
HOUSE AND UNIT MARKET INFOGRAPHICS Arrows denote annual trend for the relevant indicator.
Rental Yield Trend: Steady = +/- 0 to 0.3%pts Up = + 0.3%pts or more Down = - 0.3%pts or more
VACANCY RATES
All figures are based upon all residential rentals as at the end of each quarterly period, as submitted by real estate agents. N/A
Due to insufficient information received no vacancy rate has been calculated.
Source: REIQ Residential Rental Survey The REIQ classes rental markets into three categories, weak, healthy, or tight. These markets are classified according to vacancy rates: 0 - 2.5% = tight 2.6 - 3.5% = healthy 3.6% - plus = weak
2 | QUEENSLAND MARKET MONITOR • MARCH 2021 | ISSUE 49 REPORTING ON THE DECEMBER QUARTER 2020
REIQ.com
rt
cting
n
ne
prope
y
Co
Table of Contents
Queensland Market Overview..............................4
Sunshine Coast..............................................60
Capital City Comparison......................................10
Fraser Coast...................................................68
Sales Market Summary.......................................18
Bundaberg.....................................................72
Rental Market Summary......................................24
Gladstone.......................................................76
Greater Brisbane Market Updates
Rockhampton.................................................80
Greater Brisbane............................................28
Mackay...........................................................86
Brisbane LGA.................................................42
Townsville.......................................................90
Regional Market Updates
Cairns.............................................................94
Gold Coast......................................................50
Other Regional...............................................98
Toowoomba.....................................................56
Editor: Olivier Björksäter-Bleylock T. 07 3249 7300 E. media@reiq.com.au
Data: Yvette Burton Analysis: Olivier Björksäter-Bleylock, Nicola McDougall, Kieran Clair Sub-editors: Rory Scott, Aislinn Dwyer Graphic Designer: Kristina Tindall
The Real Estate Institute of Queensland Ltd. Copyright 2018 50 Southgate Ave, Cannon Hill Qld 4170 PO Box 3447, Tingalpa DC Qld 4173 Ph: 1300 MY REIQ Email: marketing@reiq.com.au
Source: REIQ, data supplied by CoreLogic REIQ.com
QUEENSLAND MARKET MONITOR • MARCH 2021 | ISSUE 49 REPORTING ON THE DECEMBER QUARTER 2020 | 3
Queensland Market Overview
ople a nd
pe
Queensland Market Overview EMPLOYMENT MARKET Unemployment Rate
5.4%
Participation Rate
64.4%
HOUSE MARKET (<2400M ) 2
Annual
Quarter median price
$520,000
Annual median price
$490,000 5yrs
Annual volume of sales
63,316
Annual median price 5yrs ago
$449,512
HOUSE MARKET ALL Median days on market
40 Days Median vendor discount
-3.6%
Stock on market
7.0%
The Problem with Property Predictions: Fiction Versus Fact Editor: Olivier Björksäter-Bleylock Data: Yvette Burton Analysis: Nicola McDougall and Kieran Clair
At the onset of COVID-19, one by one, Australia’s ‘big four’ banks flooded the market with property predictions. Fortunately for property owners, most of the “Armageddon” forecasts were a miss many by a long shot. So, what’s wrong with predictions? Whenever the unexpected happens, it seems everyone is keen to predict possible outcomes for our property markets. As we strive to move on from the COVID-19 crisis and the uncertainty it’s caused, 2020 saw its fair share of property market predictions ranging from dire warnings of imminent collapse through to assurances that the next boom was on its way. Such forecasts may be exciting, interesting or even frightening, but they are rarely of any real value to investors, and that’s not just because they often turn out to be wrong. The main problem is that most predictions are simply sweeping generalisations that lump together different types of properties as if they always perform the same way, but the potential performance of different types of housing in the same suburb often varies, because they appeal to many different types of buyers and renters. We also know that units and houses can perform very differently. There are market differences between renter versus buyer demands, as well as response rate differences between investor, first buyer, upgrader and downsizer demands. Yet, much of the media provides property price predictions, housing market forecasts, home value indexes or real estate estimates in which they lump all types of properties together, ultimately showing a combined average performance, which is of little practical use and could even be misleading. Another issue with many property market predictions is they combine suburbs in one city or state together to make a sweeping forecast such as “Brisbane’s housing market expected to crash” which ran only a few weeks after lockdowns were in force across Queensland. But the best was reserved for our big banks whose own predictions ranged from dire to apocalyptic. In May 2020, we had both Westpac and the ANZ predicting a 10% decline in national property values, while the NAB predicted falls of up to 15%. Not to be outdone, the Commonwealth Bank made headlines with claims that house prices would collapse by up to 32%. What a difference a year can make, with “Brisbane property prices set to boom” the most recent headline splashed across the front page of many tabloids. You would think the big banks would have learned their lesson… but they’ve come out in force once more, revering previous forecasts. ANZ is now predicting 9% growth in 2021, the NAB and Commonwealth Bank are forecasting 5% growth, and Westpac sees a 15% "surge" in property values over 2021-2023. One of the most outlandish doomsayers for 2020 was Harry S. Dent Jr., the “Contrarian’s Contrarian,” who for almost 20 years has been periodically predicting cataclysmic market crashes in Australia. He appeared on Sky News, announcing that we’re on the verge of an economic winter and when it comes, the fallout could be worse than even the Great Depression of 1929. His prediction was a 70% price reduction in property because Australia is set to go through a much-needed “detox for a crack-addicted economy.” The fact is, we can’t really use these predictions, even if they turn out to be (almost) right, because we generally only buy one property in a suburb, not an entire city. Suburbs in any region are very likely to perform differently from each other and some may boom, even as others bust. For any prediction to be of possible value, you need to be able to trust the source its coming from. We often hear and see such predictions made by those who may promote a property market purely because it’s in their interests to motivate us to purchase. That’s why property market predictions
4 | QUEENSLAND MARKET MONITOR • MARCH 2021 | ISSUE 49 REPORTING ON THE DECEMBER QUARTER 2020
REIQ.com
need to be as accurate as possible, because they could lead us into making decisions involving huge amounts of money and many years of financial commitment. Ultimately, it’s important to ensure that any forecasts you intend to rely on are provided by recognised analysts and experts who have a proven published record of past success. Ensure that they are not based on hidden agendas, gut feel or intuition, but on proven statistical methodologies which have delivered a consistently high rate of accuracy such as the Real Estate Institute of Queensland (REIQ). Throughout 2020, the REIQ recognised early that while the property market was insulated thanks to wide range of monetary and fiscal policies rolled out by both the Federal and State Governments in an attempt to soften the blow to the broader economy, the biggest concern was the impact of job losses as it was likely to create some downward pressure on property values as income and borrowing capacity became limited, and sentiment levels dropped. However, with the Federal Government’s tax cuts and spending measures in the October 2020 budget, CEO Antonia Mercorella identified that because the Federal Government budget also included lending reforms intended to improve access to credit, that it wasn’t all set to be doom and gloom as some experts might have had us think. “We’re clearly living in extraordinary times. As a result of the COVID-19 pandemic, not only has it haphazardly fluctuated consumer sentiment – that same unpredictability has seen Queensland’s property market perform in ways that go against all of the economic predictions that were made early this year,” explained Ms. Mercorella at the time. “Real estate across the State has remained extremely stable with steady growth that continues to strengthen its appeal. Between record-low mortgage rates, low stock availability for sale, improvements in consumer sentiment and Queensland’s lifestyle drawcard, we’re likely to see broader increases in values in 2021.” Queensland’s local affordability and lifestyle advantages saw it rank as the most popular destination for Australians seeking to ultimately relocate in 2020. In fact, the State has seen an unusually high net interstate migration. That said, an interesting insight from the most recent interstate migration figures shows something else happening. According to the Australian Bureau of Statistics provisional regional internal migration estimates, Queensland gained the most people from net interstate migration REIQ.com
over the September 2020 quarter of anywhere in the nation. There was a net gain of 7,200 people from internal migration in the September 2020 quarter, compared with 6,800 in the previous quarter and 5,500 in the September 2019 quarter. In fact, the net gain for the 2020 quarter was the largest since the December 2017 quarter, up 7,700. On a side note, another interesting statistic in the data set was also the reduction in the number of departures from Queensland to other parts of the country, which decreased from 17,400 to 15,100. So, with fewer people leaving Queensland but more people arriving, it’s easy to understand why stock on market can’t keep up with demand. The volume of people who may have usually left the Sunshine State for, say, Sydney and Melbourne have fallen, which correspondingly means the properties that they own or rent are not put on the market for sale or lease. Of course, no one has a crystal ball, but all indicators seem to point to strong market conditions over the shortto-medium term, with a low supply of listings set to be a key factor for some time yet. Ultimately, it was never the REIQ’s view that an outcome of COVID-19 would be a market crash. Instead, softer price gains over time, after an initial moderate hit, was a more likely scenario. For proof of these predictions, you only need examine 2020’s property price results. Throughout the year, activity shows that things have tracked well across all market sectors. And COVID-19’s negative impact recoiled despite a massive debt overhang and revenue reductions, as well as stubborn unemployment. That said, despite witnessing the country’s first recession in nearly three decades, the Queensland property market was still tipped for strong growth come 2021. In summary, while there’s no “one size fits all” when it comes to property predictions (especially in these uncertain times), if you’re looking for predictions, look to those that are produced using accurate methodologies and are delivered by reputable analysts. In the meantime, let’s push fiction to the side and taker closer look at the most current facts: the performance highlights around Queensland, and how they stack up this quarter. BRISBANE HOUSE MARKET <2400m2 Continued evidence of strengthening market conditions based on the following key metrics: • Sales activity, up 22.5% over the quarter and 1.9% over the year.
• Median house prices up 4.5% over the quarter, and up 5.8% over the year. • Days on market and vendor discounting continue to come down, with houses taking just 28 days to sell (down from 38 a year ago) and vendors discounting by 3% pts (down from 3.6% a year ago) • All indicators continue to point to a sellers’ market with listing numbers being absorbed quickly, down 13.2% over the year. • Cycle Status: remaining in a rising market. • Outlook: Continued healthy market conditions with improved vendor confidence likely to entice more listings to the market. BRISBANE UNIT MARKET The Brisbane unit market has started showing signs of recovery with an improvement in its median sale price over the quarter (+4.3%) and steady over the year. • Sales numbers have lifted over the quarter (+16%) indicating the market has passed the bottom of the cycle. • Signs of recovery is further evident in an improvement in days on market, reduced by 11 days to a median 40 days, coupled with a slight improvement in vendor discounting down 0.5% pts compared to a year ago. • Unit listing numbers are down 9.9% over the year and is reflective of subdued vendor confidence in the unit market in recent years. • Cycle status: Recovering – with all key metrics levelling out with early signs of improvement. Buyers still hold the upper hand. • Outlook: Early signs of improvement in ‘on the market’ metrics and sales activity numbers indicate continued recovery mode for the short to medium term. GREATER BRISBANE HOUSE MARKET <2400m2 Rising market driven by Brisbane, Redland and Moreton Bay, with Logan and Ipswich remaining in recovery mode but with improving conditions and outlook. • LOGAN: Recovering market conditions with strong growth in sales activity over the quarter (+22%) and over the year (+16.9%), along with improving median prices, up 3.5% over the quarter. Listing numbers down 10.5% over the year, with less time on market, down 9 days
QUEENSLAND MARKET MONITOR • MARCH 2021 | ISSUE 49 REPORTING ON THE DECEMBER QUARTER 2020 | 5
Queensland Market Overview
to 45 median days and median vendor discounting also improving 0.3% pts. Outlook: Continued improving market conditions and likely to enter into rising phase in the short to medium term. • IPSWICH: Recovering phase with sales numbers improving over the quarter (+5.5%) and median prices showing signs of improvement also (+2.4%). Listing numbers are down 9.6% and despite improved days on market (down 12 days), vendor discounting remains relatively unchanged (-0.1%pts). Outlook: Likely to remain in recovery mode until vendor confidence returns to the market. • REDLAND: Rising phase with sales activity strengthening over the quarter (+30%) and year (+18.6%). Both quarterly and annual median price up 3.8%. Greatest improvement in days on market for Greater Brisbane, down 17 days to 33 median days and vendor discounting down 0.7% pts. Outlook: All indicators point to continued strengthening conditions. • MORETON BAY: Rising phase with sales activity strengthening over the quarter (+16.2%) and year (+14.2%). Median prices up 1.3% and 5.2% over the quarter and year respectively. Improvement in days on market, down 13 days to 32 median days and vendor discounting down 0.6% pts. Outlook: All indicators point to continued strengthening conditions. GREATER BRISBANE UNIT MARKET Recovering phase led by Brisbane and Moreton Bay. • LOGAN: Still in stabilising mode but nearing bottom of the cycle. Improvement in quarterly sales numbers (+19% / 27 sales). Median price down over the quarter but unchanged over the year. Slight improvements in days on market and vendor discounting. Outlook: Nearing bottom of the cycle, likely in the short to medium term given improved metrics asides from movements in median price. • IPSWICH: Stabilising mode with median price up 9.5% over the quarter, however this is likely due to a shift in volume of new stock and not a reflection of improving market conditions, evidenced by the median price down over the year. Sales activity remained relatively unchanged on the previous quarter. Days on market are down 13 days, however at 90 days, the Ipswich unit listing market is the slowest selling in SEQ. Subdued conditions further evidenced by vendor discounting increasing by 1.2% pts over the year. Listing numbers are down 14.7% over the year, however this is likely due to a lack of vendor confidence
• Improved market conditions over the December quarter with an uplift in sales (+24%) and median sale price (+5.1%). Of note is the increase in median sale price over the year, up 5.5%. • Further evidence the Gold Coast unit market is on the improve is a reduction in days on market (50 days, down from 63 the previous 12 months) and a corresponding reduction in vendor discounting, currently sitting at 3.7 % (down from 4.2% a year ago). • A recovery in sales turnover is contributing to an absorption of current stock on the market, which, along with reduced days on market and vendor discounting, will likely induce a return of confidence to the market. Over the year to November 2020, unit listing numbers were down 13.1%. • Cycle Status: Recovering and nearing rising phase – with all key metrics showing improvement. • Outlook: Underlying housing demand and strong rental market conditions is likely to see the Gold Coast unit market move into rising market conditions in the short to medium term.
impeding on new listings coming to market. Outlook: Ipswich’s unit market makes up a small proportion of the region’s residential market and indicators point to continued stabilisation in the market. • REDLAND: Steady reaching bottom of the cycle with slight improvement in quarterly sales numbers, however median price down 2.9%. Indications the market could be at the bottom is an improvement in the annual median (+5.2%). Listing numbers down somewhat over the year, whilst days on market and vendor discounting have improved. Outlook: Further steadying of market conditions, with signs of recovery anticipated for 2021. • MORETON BAY: Entering recovery phase with improved conditions across the board – sales numbers up 23% over the quarter and an increase of 10.5% in the median price. This is however likely underpinned by a shift towards higher-end stock selling compared to the previous quarter, most notably in Redcliffe which posted an increase of 17% with sales numbers also up. Days on market and vendor discounting have shown strong improvement down 19 days and 1.1% pts respectively, while listing numbers are down 4.1%. Outlook: continued improving market conditions.
SUNSHINE COAST HOUSE MARKET <2400m2
GOLD COAST HOUSE MARKET <2400m2 Continued evidence of a rising market as follows: • Strengthening sales activity, up 13.9% over the quarter and a significant increase of 31.4% over the year. • Median house prices up 7.7% over the quarter and up 6.1% over the year. • Days on market and vendor discounting continue to come down, with houses taking 34 days to sell (down from 50 a year ago) and vendors discounting by just 3.2% (down from 3.8% a year ago). • All indicators point to a sellers’ market with listing numbers being absorbed quickly, down 12.3% over the year. • Cycle Status: Remaining in a rising market. • Outlook: Continued healthy market conditions with improved vendor confidence likely to entice more listings to the market. GOLD COAST UNIT MARKET • The Gold Coast unit market is showing signs of uplift with a strong increase in sales numbers over the December quarter, up 24% compared to the September Quarter 2020.
6 | QUEENSLAND MARKET MONITOR • MARCH 2021 | ISSUE 49 REPORTING ON THE DECEMBER QUARTER 2020
• Sunshine Coast SD: Rising conditions with all key metrics continuing to strengthen across both the Noosa and Sunshine Coast LGAs. The Sunshine Coast property market is one of the strongest in Queensland for both houses and units. • Sunshine Coast (LGA): Rising with continued improvement in sales activity up 11.5% over the quarter and 23.8% over the year. Increased median prices reflective of strong buyer demand, up 8.9% and 7.7% over the quarter and year respectively. Listings are down 8.1% with vendor discounting remaining relatively stable (down 0.4% pts) however time on market has come down by 16 days to 37 days. Outlook: All indicators point to continued strengthening conditions. • Noosa: Rising with sales activity over the quarter relatively unchanged, down slightly by 2.3% but up 22% over the year. Increased median prices up 2% and 15.4% over the quarter and year respectively. Annual increase in median price is reflective of an increase in prestige house sales, namely in the suburb of Noosaville. Vendor discounting relatively stable (down 0.5% pts) whilst days on market has come down by 7 days. Despite slightly softer sales activity for the quarter, strengthening buyer demand is evidenced in listings down 13.5% over the year. Outlook: All indicators point to continued strengthening conditions. REIQ.com
• Sunshine Coast SD: Rising conditions with all key metrics continuing to strengthen across both the Noosa and Sunshine Coast LGAs.
Annual
Quarter median price
$405,000
Annual median price
$390,000 5yrs
• Sunshine Coast (LGA): Rising with continued improvement in sales activity up 16.7% and median prices increasing by 3.2% over the quarter. Over the year, median unit prices were up 8.0%. Listings are down 12.5% with vendor discounting remaining down 0.7% pts and time on market down by 15 days. Outlook: All indicators point to continued strengthening conditions.
• Noosa: Rising with sales activity over the quarter up 21.6% with a lift of 4.3% in the median price. Over the year, Noosa recorded the highest increase for the state’s largest LGAs posting a 14.3% increase. Vendor discounting was down 0.8% pts whilst days on market has come down markedly by 26 days. Listing numbers were down 15%, indicating buyer demand greater than vendor appetite to sell. Outlook: All indicators point to continued strengthening conditions.
Regional Queensland Annual volume of sales
23,218
Annual median price 5 yrs ago
$386,900
BUNDABERG HOUSE MARKET <2400m2 • Rising market conditions with strong growth in sales activity over the quarter (+20.5%) and over the year (+20.4%), along with improving median prices, up 5.5% over the year, despite only a marginal increase (+0.6%) over the quarter. • Listing numbers down 11.7% over the year, with less time on market, down 8 days and median vendor discounting also improving 1.1% pts.
• Outlook: Continued improving market conditions and likely to enter into a more established rising phase in the short to medium term.
UNIT MARKET ALL
BUNDABERG UNIT MARKET
Median days on market
50 Days
• Stabilising market conditions with key metrics still fluctuating.
• Sales activity over the quarter down 5.2% despite a strong increase of 49.8% (shift in upper end sales) over the quarter and the annual median was down (-3.6%).
• Listing numbers down 25.3% over the year, with less time on market, down 45 days and median vendor discounting improving 0.7% pts. These combined metrics indicate weak vendor confidence in the market with time on market reduced likely due to fewer listings coming to market.
Median vendor discount
-3.6%
• Outlook: Continued stabilising market conditions and likely to see steadying conditions over the medium term. CAIRNS HOUSE MARKET <2400m2
Stock on market
6.2%
• Recovering phase with sales numbers continuing to improve over the quarter (+15.4%) with median prices showing signs of improvement posting +1.2% over the quarter and year.
Queensland’s local affordability and lifestyle advantages saw it rank as the most popular destination for Australians seeking to ultimately relocate in 2020.
• Listing numbers are down 9.4% with a slightly improved days on market (down 5 days) and vendor discounting relatively unchanged (-0.3% pts). • Outlook: Likely to remain in recovery mode with overall confidence in the market generally improving. CAIRNS UNIT MARKET • Early recovering phase with sales numbers up over the quarter (+23.4%) and median prices showing signs of improvement, posting +2.3% over the quarter, however down 2% over the year.
• Listing numbers are down 15.4% with improved days on market (down 9 days) and vendor discounting relatively unchanged (-0.2% pts). • Outlook: Likely to remain in recovery mode with overall confidence in the market to improve.
REIQ.com
QUEENSLAND MARKET MONITOR • MARCH 2021 | ISSUE 49 REPORTING ON THE DECEMBER QUARTER 2020 | 7
Queensland Market Overview
SUNSHINE COAST UNIT MARKET
UNIT MARKET
FRASER COAST HOUSE MARKET <2400m2
Queensland Market Overview
• Early rising phase with sales activity strengthening over the quarter (+26.9%) and year (+19%) and the quarterly and annual median price up 4.5% and 3.5%. • Days on market however were down just 8 days to 58 median days and vendor discounting down 0.7% pts to sub-4% levels. • Outlook: Continued improvement in key metrics over 2021. FRASER COAST UNIT MARKET • Recovery phase with sales activity strengthening over the quarter (+84.7%) and the quarterly and annual median price up 11.2% and 3.1% respectively. • Days on market however were up slightly (+4 days) and vendor discounting marginally up 0.4% pts. Meanwhile listing numbers were down 7.8%. • Outlook: Continued improvement in key metrics and expected to enter into rising conditions over 2021. GLADSTONE HOUSE MARKET <2400m2 • Rising phase and regional Queensland’s strongest house market.
• Sales activity up over the quarter (+14.8%) and a significant increase over the year (+67.5%) with median prices up 7.1% and up 9.1% over the quarter and year respectively.
• Despite strong market conditions, days on market over the year increased by 7 days to 60 median days coupled with an increase in listings by 3.6% indicating improving vendor confidence. Median vendor discounting however improved by 1.7% pts to a more healthier level of 4.5%. • Outlook: All indicators point to continued strengthening conditions. GLADSTONE UNIT MARKET • With steadying conditions, sales activity was up over the quarter (+35.1%) with median prices up 20% over the quarter, however down over the year (-1%).
• Days on market over the year increased by 20 days to 86 median days despite a fall in listings by 16.5%. Median vendor discounting however improved by 2% pts to 5.4%. • Outlook: All indicators point to steadying of key metrics with potential to move into recovery stage given the strength of Gladstone’s house market.
MACKAY HOUSE MARKET <2400m2 • Early rising phase with sales activity strengthening over the quarter (+10.5%) and year (+30.3%) and the quarterly and annual median price up 1.6% and 4.5%. • Days on market however were down just 7 days and vendor discounting down 1% pt. Meanwhile, listing numbers increased slightly by 0.6% pts. • Outlook: Continued improvement in key metrics over 2021. MACKAY UNIT MARKET • While sales activity improved over the quarter (+5.6%),, median prices declined over both the quarter (-16.2%) and year (-1.3%). Given the size of Mackay’s unit market however, the shift in median is likely due to a shift in the quality of stock sold. • Days on market were down 21 days and vendor discounting down 2.3% pts. And listing numbers decreased by 7.1% pts. • Outlook: Continued improvement in key metrics over 2021. ROCKHAMPTON HOUSE MARKET <2400m2 • Rising market conditions with strong growth in sales activity over the quarter (+7.5%) and over the year (+54.7%), along with improving median prices, up 4.5% over the quarter and up 3.8% over the year.
• Listing numbers marginally down (-1.3%) over the year, with less time on market, down 11 days and median vendor discounting also improving 1.8% pts, the largest improvement of all major LGAs. • Outlook: Continued improving market conditions. ROCKHAMPTON UNIT MARKET • Recovery phase with improving sales activity over the quarter (+39.1%) along with steadying median prices (-0.1% for the quarter).
• Days on market however down 11 days to 41 median days and vendor discounting down 0.8% pts to sub-4% levels. Listing numbers down 9.2%. • Outlook: Continued improvement in key metrics over 2021. TOOWOOMBA UNIT MARKET • Early rising phase with sales activity strengthening over the quarter (+28.6%) with the quarterly and annual median price up 9.7% and 9.6% respectively. • Days on market however remained unchanged, however vendor discounting was down 1.3% with listing numbers down 14.9% • Outlook: Continued improvement in key metrics over 2021. TOWNSVILLE HOUSE MARKET <2400m2 • Early rising phase with sales activity strengthening over the quarter (+15.5%) and year (+34.3%) with the quarterly and annual median price up 0.6% and 3.8%. • Days on market however were down just 6 days and vendor discounting down 0.3% pts. Meanwhile, listing numbers were also marginally down (-1.2% pts). • Outlook: Continued improvement in key metrics over 2021. TOWNSVILLE UNIT MARKET • Recovery phase with sales activity strengthening over the quarter (+23.7%) and year (+11.7%) with the quarterly median price up 7.9%, however down over the year (-2.7%). • Days on market however were down just 5 days and vendor discounting up 0.3% pts. Meanwhile listing numbers were also marginally down (-1.4% pts). • Outlook: Continued improvement in key metrics over 2021.
• Listing numbers marginally down (-2.1%) over the year, with less time on market, down 34 days and median vendor discounting also improving 3.8% pts, the largest improvement of all major LGAs however still one of the largest discounted markets at a median of 6%. • Outlook: Continued improving market conditions. TOOWOOMBA HOUSE MARKET <2400m2 • Rising phase with sales activity strengthening over the quarter (+15.4%) and year (+19.1%) with the quarterly and annual median price up 2.7% and 3.7%.
8 | QUEENSLAND MARKET MONITOR • MARCH 2021 | ISSUE 49 REPORTING ON THE DECEMBER QUARTER 2020
REIQ.com
PROPERTY TYPE
REGION
QTRLY NUMBER OF SALES
QTRLY MEDIAN SALE
QTRLY CHANGE
ANNUAL NUMBER OF SALES
ANNUAL MEDIAN SALE
ANNUAL MEDIAN SALE (1YR AGO)
1 YR CHANGE
ANNUAL MEDIAN SALE (5YRS AGO)
5YR CHANGE
Queensland
Houses
15881
$520,000
6.1%
63,316
$490,000
$480,000
2.1%
$449,512
9.0%
Queensland
Houses ^
2276
$590,000
2.1%
10,370
$570,000
$550,000
3.6%
$515,000
10.7%
Queensland
Units
6195
$405,000
3.8%
23,218
$390,000
$400,000
-2.5%
$386,900
0.8%
Queensland
Land
1945
$210,000
5.7%
14,189
$224,000
$233,000
-3.9%
$218,000
2.8%
Queensland
Land ^
880
$213,000
13.3%
4,307
$205,000
$237,000
-13.5%
$239,000
-14.2%
Queensland House Market Annual Median Sale Price
Queensland Unit Market
Annual Number of Sales
Annual Median Sale Price
$550,000
$500,000
Annual Number of Sales
$410,000
110,000
60,000
$390,000
100,000
50,000
$400,000
80,000
$350,000
70,000
Median Sale Price
90,000
40,000
$350,000 $330,000
30,000
$310,000
Number of Sales
$450,000
Number of Sales
Median Sale Price
$370,000
20,000
$290,000 $300,000
60,000
10,000
50,000
$250,000
Nov-06 Mar-07 Jul-07 Nov-07 Mar-08 Jul-08 Nov-08 Mar-09 Jul-09 Nov-09 Mar-10 Jul-10 Nov-10 Mar-11 Jul-11 Nov-11 Mar-12 Jul-12 Nov-12 Mar-13 Jul-13 Nov-13 Mar-14 Jul-14 Nov-14 Mar-15 Jul-15 Nov-15 Mar-16 Jul-16 Nov-16 Mar-17 Jul-17 Nov-17 Mar-18 Jul-18 Nov-18 Mar-19 Jul-19 Nov-19 Mar-20 Jul-20 Nov-20
$250,000
Nov-06 Mar-07 Jul-07 Nov-07 Mar-08 Jul-08 Nov-08 Mar-09 Jul-09 Nov-09 Mar-10 Jul-10 Nov-10 Mar-11 Jul-11 Nov-11 Mar-12 Jul-12 Nov-12 Mar-13 Jul-13 Nov-13 Mar-14 Jul-14 Nov-14 Mar-15 Jul-15 Nov-15 Mar-16 Jul-16 Nov-16 Mar-17 Jul-17 Nov-17 Mar-18 Jul-18 Nov-18 Mar-19 Jul-19 Nov-19 Mar-20 Jul-20 Nov-20
$270,000
0
Queensland Land Market Annual Median Sale Price
Annual Number of Sales
$300,000
40000 35000
$250,000
30000 25000
$150,000
20000 15000
$100,000
Number of Sales
Median Sale Price
$200,000
10000 $50,000
5000
Nov-06 Mar-07 Jul-07 Nov-07 Mar-08 Jul-08 Nov-08 Mar-09 Jul-09 Nov-09 Mar-10 Jul-10 Nov-10 Mar-11 Jul-11 Nov-11 Mar-12 Jul-12 Nov-12 Mar-13 Jul-13 Nov-13 Mar-14 Jul-14 Nov-14 Mar-15 Jul-15 Nov-15 Mar-16 Jul-16 Nov-16 Mar-17 Jul-17 Nov-17 Mar-18 Jul-18 Nov-18 Mar-19 Jul-19 Nov-19 Mar-20 Jul-20 Nov-20
$0
QUEENSLAND HOUSE MARKETS
QUEENSLAND UNIT MARKETS
December Qtr 2020
Sunshine Coast (SD) Sunshine Coast (LGA) Gold Coast Noosa Gladstone Rockhampton Greater Brisbane Toowoomba Mackay Fraser Coast Bundaberg Townsville Cairns
December Qtr 2020
Sunshine Coast (SD) Sunshine Coast (LGA) Noosa
STEADY
FALLING
RISING
RECOVERING
0
STABILISING
Toowoomba
Gold Coast Fraser Coast Mackay Townsville Rockhampton Greater Brisbane
STEADY
RISING
FALLING
RECOVERING
STABILISING
Cairns
STEADY
Bundaberg
STEADY Gladstone
Source: REIQ. Based on the previous 4 quarters median sale price change and the annual change. Houses < 2400 m2.
REIQ.com
Source: REIQ. Based on the previous 4 quarters median sale price change and the annual change.
QUEENSLAND MARKET MONITOR • MARCH 2021 | ISSUE 49 REPORTING ON THE DECEMBER QUARTER 2020 | 9
Queensland Market Overview
Statewide Statistics
Capital City Comparison
HOUSE MARKET COMPARISON Best performer for the year
Greater Hobart
9.3%
Fastest selling capital city
Greater Hobart
13 Days
Smallest discount capital city
Canberra
-2.2% Largest discount capital city
Greater Darwin
-4.4%
UNIT MARKET COMPARISON Best performer for the year
Greater Hobart
5.3%
Fastest selling capital city
Greater Hobart
10.5 Days Smallest discount capital city
Canberra
-2.0% Largest discount capital city
Greater Darwin
-6.2%
The Only Way is Up Editor: Olivier Björksäter-Bleylock
In researching our capital cities over the last 12 months, it appears Canberra might be the hottest capital city to buy, as the property market enters a post-COVID era. But depending on where you look, dark clouds had certainly gathered over Australia’s property market. Australia’s big four banks predicted “worst-case” scenarios in which property prices were tipped to fall as high as 30% or more, with the two biggest property markets – Sydney and Melbourne – to be the worst-affected. When looking back at 2020, in the beginning Australia’s housing value rebound continued into 2020 with the CoreLogic national home value index up by 0.9% in January 2020. This took the annual growth rate to 4.1%; the fastest pace of growth for a 12-month period since December 2017. During that same time, housing values rose across every capital city and rest-of-state region, apart from regional South Australia, where values held firm over the month. According to CoreLogic, this demonstrated a broader recovery trend which originally began in Sydney and Melbourne midway through 2019, and gradually spread to other areas of the country. Across our capital cities, Sydney and Melbourne continued as the leaders for capital gains after recording more substantial declines during the recent downturn. Values increased by 1.1% and 1.2% over the month respectively, while Hobart (+0.9%) achieved a higher growth rate relative to most other regions. The remaining capital cities generally saw a mild rise in values over the month. For Perth home owners, the results delivered positive news. Housing values were slowly emerging from a slump 5.5 years, as dwelling values edged 0.1% higher over the month. Perth dwelling values posted their first rise over a rolling quarter (+0.4%) since a brief period of growth in May 2018. Darwin, where dwelling values had been consistently falling to be almost 32% below their 2014 peak, also recorded a subtle rise (+0.1%) in January. Across the regional markets, the strongest conditions were recorded in regional Tasmania, where values were up 1.3% over the month, followed by regional Western Australia (+0.9%) then regional Victoria and regional Queensland, both up 0.8%. Although there was apparent recovery happening across every Greater Capital City Statistical Area in Australia, the speed of growth lost some of its momentum, with the national dwelling index slowing from a monthly peak of 1.7% back in November 2019 to 0.9% in January 2020. Tim Lawless, Head of Research at CoreLogic Asia Pacific said, “Seasonal effects provide some explanation for the slowdown. The CoreLogic seasonally adjusted hedonic index implies the time of year shaves about 1 basis point of growth from the December reading and 2 basis points from the January reading.” When you factor in seasonal affects, “the results indicate a reduction in the speed of growth across most markets, especially for Sydney and Melbourne where affordability constraints were once again becoming more pressing”, adds Lawless. “As advertised stock levels rose over the early part of the year, we could see some further dampening of growth rates." Nationally, housing values recovered 6.7% since finding a floor in June 2020, however CoreLogic’s national index remained 2.2% below the October 2017 peak. Meanwhile, with housing values having risen at the quarterly pace of 3.7% we were likely to see a nominal recovery in the national home value measure within the next two-to-three months. However, by the time 2020 was moving behind us, four of Australia’s eight capital cities were already showing home values at new record highs: Brisbane, Adelaide, Hobart and Canberra. Sydney values needed to recover a further 5.4% before posting a full nominal recovery and Melbourne values needed to see a further 1.2%
10 | QUEENSLAND MARKET MONITOR • MARCH 2021 | ISSUE 49 REPORTING ON THE DECEMBER QUARTER 2020
REIQ.com
Median Days on market
Median Vendor Discount
12 months to November Source: REIQ, data supplied by CoreLogic
70
-5%
-4.4%
-5% -4%
-3.6%
-3.0%
50
-3.2%
-2.2%
-4%
-3.0%
-2.8%
40
-2.9%
-3%
64
30
-3%
-2% 45
20
42
34
-2% 33
31
31
Median Vendor Discount
Median Days on Market
60
-1%
10
-1%
13
-
0% Greater Darwin Greater Adelaide
Canberra
Greater Perth
Greater Brisbane Greater Sydney
Greater Melbourne
Greater Hobart
Unit Market Trend Indicators Median Days on market 80
Median Vendor Discount
12 months to November Source: REIQ, data supplied by CoreLogic
-7%
-6.2%
-6% -3.4%
60
-2.0%
50 40
-4.3%
-5%
-3.3% -2.9%
-2.9%
30
52
20
48
45 47
36 -1% 11
Greater Darwin
lift. Perth and Darwin will take a much longer time to see values recover. Although the Perth market seems to be moving into a recovery, housing values remain 21.3% below their 2014 peak and Darwin values are 31.8% below their peak. Of course we must acknowledge the year that no one could have predicted, from a deadly global pandemic to our largest economic downturn since the 1930s. While the initial shock of COVID-19 led to a -2.1% decline in national property values between April and September 2020, Australian housing values were 1.1% higher over the year to November 2020 following a recovery trend in the last two months. Housing values had been supported by a strong mix of regulatory, monetary and fiscal measures, which induced record-low mortgage rates, the deferment of mortgage repayment for households impacted by COVID-19 and saw grants and concessions introduced for owner-occupier purchases. Interestingly, we saw a drastic shift in property price expectations among buyers. Corelogic reported in February 2020 that 66% of Australians thought property prices
Greater Adelaide
Canberra
Greater Perth
-3% -2%
37
10
REIQ.com
-4%
-3.1%
74
Median Vendor Discount
Median Days on Market
70
Greater Brisbane
Greater Sydney
Greater Melbourne
would rise over the next 12 months. Fast forward a few months and that number fell to 10% (May, 2020). But Australia doesn’t have a singular property market, and is instead comprised of many different ones. Demand for lifestyle areas was also a trend that may have been exacerbated, but wasn’t necessarily triggered, by COVID-19. The narrative of Australians fleeing capital cities in search of a sea-change or tree change “because of COVID” has dominated reporting on the housing market through 2020. The relative popularity of lifestyle markets is evident in Corelogic’s reports, and regional Australia out-performed the combined capital cities market. With the exception of the highest median value suburbs, high performing regional areas across the country dominated. Sunshine Beach on the Sunshine Coast saw the highest annual capital growth in houses nationally, compared with 2019 when St Kilda in Melbourne saw the highest housing growth. Alternatively, rental market performance has been highly disparate. COVID-19 has had a severe impact on select
0%
Greater Hobart
rental markets in Australia, with Greater Melbourne unit rents falling -7.0% in the year to November 2020. Inner city rental markets of Sydney, Melbourne and to a lesser extent, Brisbane were particularly impacted by the closure of international borders, where historically high demand from overseas migrants had been disrupted. Notably the vast majority of overseas arrivals to Australia were initially renters. However, there is a completely different dynamic in rental markets across Perth, Darwin, and other mining-related markets that emerged. Following the long withdrawal of investor demand and several years of low new supply additions, rental markets started tightening. Across the suburb of South Headland in Western Australia, which holds the position of highest rental yields for units across the country, rents increased significantly over the year following a long correction post-mining boom. This is also reflected in the WA capital, where Perth rent values increased a remarkable 8.2% across dwellings over the year. In looking ahead to 2021, record-low mortgage rates will likely be a significant
QUEENSLAND MARKET MONITOR • MARCH 2021 | ISSUE 49 REPORTING ON THE DECEMBER QUARTER 2020 | 11
Capital City Comparison
House Market Trend Indicators
Melbourne, Victoria
Capital City Comparison
In looking ahead to 2021, record-low mortgage rates will likely be a significant tailwind for property values, and may place upward pressure on prices through the year ahead. Combined with an economic recovery, some earlier factors considered a major risk to housing markets have been reduced, including the end of mortgage repayment deferrals.
tailwind for property values, and may place upward pressure on prices through the year ahead. Combined with an economic recovery, some earlier factors considered a major risk to housing markets have been reduced, including the end of mortgage repayment deferrals. The inner-city Melbourne market is seeing greater risk in 2021, with an increase in listing stock weighing on a recovery in values. For example, modelled sales volumes for November 2020 estimate 4,301 transactions took place across Melbourne, compared with 8,054 new listings added to the market in the same period. This means there was around 0.5 sales for each new listing added. This is very different from conditions across other capital cities, where the November 2020 sales to new listings ratio averaged 1.2 sales for each new listing added. So, despite Melbourne dwelling values joining a broad-based recovery trend, and values rising 0.7% (November, 2020), the disproportionate volume of stock to sales volumes may slow the rate recovery across the city in 2021. Property investment activity is likely to increase across smaller capital cities such as Perth, where rent values rose a remarkable 8.2% in the year to November 2020. In Hobart, where gross rent yields are 4.6% across dwellings, the investor share of mortgage finance increased from a recent low of 16.4% in August 2020, to 21.8% in October across Tasmania. Institutional interventions will continue to shape the profile of property buyers, particularly as HomeBuilder is extended at a reduced rate into the first quarter of 2021, and regulators monitor prudential lending standards. At June 2020, the housing debt to income ratio was 141.2, with housing debt accounting for most of Australian household debt. This poses an ongoing risk to the Australian economy, especially where heavily indebted households may be more likely to save rather than spend during periods of uncertainty or economic hardship. As a result, policy makers and regulators may watch for signs of rising household debt, or a decline in prudential lending standards that could lead to higher household debt. Higher loan to value lending or higher loan to income ratios could be a trigger for macro-prudential intervention in 2021. That said, the Australian housing market outlook for 2021 is positive, given highly accommodative monetary and fiscal policy, signs of an economic recovery and many first home buyer incentives remaining in place at the time of writing,
12 | QUEENSLAND MARKET MONITOR • MARCH 2021 | ISSUE 49 REPORTING ON THE DECEMBER QUARTER 2020
REIQ.com
Hurry, Last chance to enrol! enrol now The Property Services training package is changing The Office of Fair Trading (OFT) has released new training requirements for the real estate industry. As of 30 September 2021, the current training requirements will be superseded and replaced by a new property services training package – CPP41419 Certificate IV in Real Estate Practice. In late-April 2021 the REIQ will start to offer the Registration, Licence Upgrade and Full Licence courses under the new training package. Now is your last chance to enrol into the current training package before it is phased out late-April 2021. Click for information on other courses available or join the waitlist to be notified first when the new training package is available in 2021.
RTO no. 5420
Capital Cities Comparison HOUSES
UNITS
CAPITAL CITIES*
MEDIAN SALES PRICE (QUARTER)
NUMBER OF SALES (QUARTER)
ANNUAL MEDIAN SALES PRICE
ANNUAL NUMBER OF SALES
ANNUAL CHANGE IN MEDIAN SALE PRICE
ANNUAL LISTINGS
MEDIAN DAYS ON MARKET (DAYS)
MEDIAN VENDOR DISCOUNT
AVERAGE HOLD PERIOD (YEARS)
MEDIAN SALES PRICE (QUARTER)
NUMBER OF SALES (QUARTER)
ANNUAL MEDIAN SALES PRICE
ANNUAL NUMBER OF SALES
ANNUAL CHANGE IN MEDIAN SALE PRICE
ANNUAL LISTINGS
MEDIAN DAYS ON MARKET (DAYS)
MEDIAN VENDOR DISCOUNT
AVERAGE HOLD PERIOD (YEARS)
12 MONTHS TO NOV
2020
2020
2020
2020
2020
2020
2020
2020
2020
2020
2020
2020
2020
2020
2020
2020
2020
2020
Greater Adelaide
$510,000
5,452
$493,000
17,728
3.6%
18,421
45
-3.0%
10.7
$370,000
1,337
$375,000
5,193
4.2%
5,408
52
-3.4%
9.9
Greater Brisbane
$575,000
9,737
$560,000
32,400
2.8%
41,512
33
-3.2%
11.6
$407,500
2,925
$391,757
9,651
0.5%
14,162
45
-3.3%
9.8
Canberra
$767,000
1,651
$725,000
5,551
7.4%
4,667
42
-2.2%
11.1
$477,051
973
$451,438
3,229
4.7%
3,598
48
-2.0%
8.9
Greater Darwin
$513,500
402
$485,000
1,165
3.2%
1,265
64
-4.4%
9.7
$305,000
188
$299,500
601
-0.2%
798
74
-6.2%
9.3
Greater Hobart
$565,000
745
$530,000
2,889
9.3%
3,231
13
-2.9%
11.7
$420,500
235
$410,000
973
5.3%
975
11
-2.9%
9.3
Greater Melbourne
$780,000
10,447
$760,000
40,566
5.6%
48,802
31
-3.0%
12.6
$600,000
4,727
$590,000
19,441
5.2%
30,663
36
-3.1%
9.5
Greater Perth
$526,250
8,707
$500,000
26,373
2.0%
34,985
34
-3.6%
12.0
$383,000
1,960
$375,000
5,765
-1.7%
9,352
47
-4.3%
11.1
Greater Sydney
$1,010,000
15,602
$967,500
47,998
6.9%
48,336
31
-2.8%
12.1
$725,000
10,206
$720,000
33,195
2.9%
34,729
37
-2.9%
9.8
* All figures for 12 months, ending November 2020
Australian housing values rose 2.8% in the 3 months to January 2021, with every capital city and rest of state region increasing in value.
In overview, some further highlights to consider beyond 2020 include*: • Australian housing values rose 2.8% in the 3 months to January 2021, with every capital city and rest of state region increasing in value.
• Regional areas of Australia have seen housing values rise 7.9% annually, which is more than four times the pace of capital city values over the past twelve months. • Sales volumes increased an estimated 10.3% nationally in the year to January, rising in every region but Melbourne, Hobart and regional Tasmania. • Rental markets are tightening around most areas of the country, bringing the national increase in rental rates to 2.5% in the year to January.
• Rental market conditions remain highly varied. Of the capital cities, the highest annual increase in dwelling rents was in Darwin, increasing 11.4%. The lowest change in rent values was across Melbourne, falling -2.9% over the year.
• Nationally, gross rental yields fell 2 basis points over the month to 3.69% in January, as property value increases outpaced rental increases over the month.
• The market is looking increasingly favourable for sellers. Nationally, typical time to sell a property has fallen by 1 week compared to a year ago. The typical vendor discount also tightened 30 basis points nationally compared to a year ago. • The amount of property available for sale remains very low. In the 28 days to 31 January, there were 131,657 properties listed nationally, which is -28.3% below the 5 year average for this time of year. • Melbourne continues to be the only capital city region where total stock on the market is higher than the equivalent period of 2020.
• Auction activity picked up earlier than expected in 2021, with the week ending 31st of January returning a 77.2% clearance rate across the combined capitals. • Regional migration trends suggest there was a record movement of Australians from capital cities to regions in the September 2020 quarter, corroborating the increased demand for regional dwellings.
• Approval trends have shown continued divergence. House approvals rose 13.9% annually to new record highs, compared with an -8.6% decline in unit approvals. • The RBA held rates at 0.1% through the first quarter of 2021, with the RBA forecasting the target inflation rate needed to lift rates would not occur in 2021. *Insights taken from CoreLogic’s Monthly Chart Pack – February 2021
14 | QUEENSLAND MARKET MONITOR • MARCH 2021 | ISSUE 49 REPORTING ON THE DECEMBER QUARTER 2020
REIQ.com
Brisbane, Queenland
REIQ.com
QUEENSLAND MARKET MONITOR • MARCH 2021 | ISSUE 49 REPORTING ON THE DECEMBER QUARTER 2020 | 15
Sales Market Summary QUARTER STATISTICS SUMMARY HOUSES (<2400m2) LGA/REGION
UNITS & TOWNHOUSES
VACANT LAND (<2400m2)
QTRLY NO. SALES
QTRLY MEDIAN SALE PRICE
QTRLY CHANGE
QTRLY NO. SALES
QTRLY MEDIAN SALE PRICE
QTRLY CHANGE
QTRLY NO. SALES
QTRLY MEDIAN SALE PRICE
QTRLY CHANGE
15,881
$520,000
6.1%
6,195
$405,000
3.8%
1,945
$210,000
5.7%
GREATER BRISBANE
7,537
$570,000
5.8%
2,443
$410,000
3.9%
897
$234,900
2.6%
BRISBANE LGA
3,369
$752,222
4.5%
1,787
$438,000
4.3%
140
$462,000
10.8%
771
$357,250
2.4%
45
$213,500
9.5%
104
$215,000
-0.7%
LOGAN
942
$409,000
3.5%
168
$223,000
-2.2%
185
$229,900
1.7%
MORETON BAY
1,566
$481,000
1.3%
327
$342,500
10.5%
194
$279,000
2.6%
REDLAND
753
$570,000
3.8%
107
$369,000
-2.9%
245
$35,000
6.1%
GOLD COAST
1,952
$700,000
7.7%
1,805
$446,750
5.1%
147
$340,000
13.7%
SUNSHINE COAST SD
1,542
$685,000
7.5%
858
$490,000
3.2%
121
$377,500
39.8%
SUNSHINE COAST
1,329
$675,000
8.9%
689
$455,000
2.2%
107
$358,500
36.6%
213
$912,500
2.0%
169
$735,000
4.3%
14
$621,750
11.0%
FRASER COAST
481
$350,000
4.5%
109
$285,000
11.2%
97
$170,000
3.0%
CAIRNS
487
$435,000
1.2%
269
$220,000
2.3%
51
$235,000
22.7%
BUNDABERG
341
$295,000
0.6%
55
$307,000
49.8%
95
$135,000
-12.6%
QUEENSLAND QUEENSLAND GREATER BRISBANE
IPSWICH
TOURISM CENTRES
NOOSA
REGIONAL CENTRES GLADSTONE
209
$325,000
7.1%
50
$210,000
20.0%
49
$118,490
-6.0%
MACKAY
432
$385,000
1.6%
57
$188,500
-16.2%
44
$134,000
-23.4%
ROCKHAMPTON
302
$287,250
4.5%
32
$248,000
-0.1%
17
$119,000
-23.7%
TOOWOOMBA
517
$370,500
2.7%
99
$299,000
9.7%
48
$165,000
-6.4%
TOWNSVILLE
649
$340,000
0.6%
146
$245,000
7.9%
62
$149,000
-6.9%
N/D: Not displayed due to price movements potentially driven by type of stock transacting
QUARTER STATISTICS SUMMARY STRONGEST PERFORMERS FOR THE QUARTER HOUSES (<2400)
UNITS
QTRLY CHANGE
LGA/REGION
QTRLY CHANGE
LAND (<2400) LGA/REGION
QTRLY CHANGE
LGA/REGION
8.9%
SUNSHINE COAST
49.8%
BUNDABERG
39.8%
SUNSHINE COAST SD
7.7%
GOLD COAST
20.0%
GLADSTONE
36.6%
SUNSHINE COAST
7.5%
SUNSHINE COAST SD
11.2%
FRASER COAST
22.7%
CAIRNS
WEAKEST PERFORMERS FOR THE QUARTER HOUSES (<2400)
UNITS
QTRLY CHANGE
LGA/REGION
QTRLY CHANGE
LAND (<2400) LGA/REGION
QTRLY CHANGE
LGA/REGION
0.6%
TOWNSVILLE
-16.2%
MACKAY
-23.7%
ROCKHAMPTON
0.6%
CAIRNS
-2.9%
REDLAND
-23.4%
MACKAY
1.2%
CAIRNS
-2.2%
LOGAN
-12.6%
BUNDABERG
16 | QUEENSLAND MARKET MONITOR • MARCH 2021 | ISSUE 49 REPORTING ON THE DECEMBER QUARTER 2020
REIQ.com
HOUSES (<2400m2) LGA/REGION
UNITS & TOWNHOUSES
VACANT LAND (<2400m2)
ANNUAL NO. SALES
ANNUAL MEDIAN SALE PRICE
ANNUAL CHANGE
ANNUAL NO. SALES
ANNUAL MEDIAN SALE PRICE
ANNUAL CHANGE
ANNUAL NO. SALES
ANNUAL MEDIAN SALE PRICE
ANNUAL CHANGE
63,316
$490,000
2.1%
23,218
$390,000
-2.5%
14,189
$224,000
-3.9%
GREATER BRISBANE
29,971
$544,900
2.8%
9,458
$391,800
0.5%
7,440
$238,500
-0.6%
BRISBANE LGA
13,085
$725,000
5.8%
6,894
$420,000
0.0%
1,289
$405,000
-1.0%
IPSWICH
3,262
$355,250
1.5%
202
$216,000
-15.0%
1,320
$213,000
2.4%
LOGAN
3,650
$403,000
1.3%
634
$225,000
0.0%
1,585
$223,900
0.0%
MORETON BAY
6,565
$469,000
5.2%
1,276
$320,000
1.6%
1,955
$265,000
4.1%
REDLAND
2,797
$545,000
3.8%
417
$375,000
5.2%
1,154
$35,000
12.9%
QUEENSLAND QUEENSLAND GREATER BRISBANE
TOURISM CENTRES GOLD COAST
7,617
$658,250
6.1%
6,762
$433,500
5.5%
1,083
$290,000
0.3%
SUNSHINE COAST SD
6,028
$650,000
8.3%
2,973
$475,000
10.5%
1,099
$275,500
0.4%
SUNSHINE COAST
5,095
$630,000
7.7%
2,375
$443,000
8.0%
1,043
$272,977
1.1% 87.6%
NOOSA
933
$900,000
15.4%
598
$710,000
14.3%
56
$620,000
FRASER COAST
1,947
$336,250
3.5%
351
$263,000
3.1%
543
$170,000
3.0%
CAIRNS
2,170
$420,000
1.2%
1,089
$220,000
-2.0%
504
$207,500
-8.0%
REGIONAL CENTRES BUNDABERG
1,347
$290,000
5.5%
251
$240,000
-3.6%
456
$151,000
1.3%
GLADSTONE
836
$300,000
9.1%
158
$178,200
-1.0%
167
$120,990
18.0% 0.6%
MACKAY
1,669
$370,000
4.5%
224
$221,000
-1.3%
295
$180,000
ROCKHAMPTON
1,301
$275,000
3.8%
122
$249,000
-5.6%
151
$163,500
2.2%
TOOWOOMBA
2,174
$363,000
3.7%
349
$285,000
9.6%
523
$180,000
-5.3%
TOWNSVILLE
2,507
$330,000
3.8%
554
$237,500
-2.7%
510
$155,000
-5.5%
N/D: Not displayed due to price movements potentially driven by type of stock transacting *Based on data from MacLeay Island and Russell Island only, and may not accurately represent all of Redland
STRONGEST PERFORMERS FOR THE PAST 12 MONTHS HOUSES (<2400)
UNITS
LAND (<2400)
ANNUAL CHANGE
LGA/REGION
ANNUAL CHANGE
LGA/REGION
ANNUAL CHANGE
LGA/REGION
15.4%
NOOSA
14.3%
NOOSA
87.6%
NOOSA
9.1%
GLADSTONE
10.5%
SUNSHINE COAST SD
18.0%
GLADSTONE
8.3%
SUNSHINE COAST SD
9.6%
TOOWOOMBA
12.9%
REDLAND
WEAKEST PERFORMERS FOR THE PAST 12 MONTHS HOUSES (<2400)
UNITS
LAND (<2400)
ANNUAL CHANGE
LGA/REGION
ANNUAL CHANGE
LGA/REGION
ANNUAL CHANGE
LGA/REGION
1.2%
CAIRNS
-15.0%
IPSWICH
-8.0%
CAIRNS
1.3%
LOGAN
-5.6%
ROCKHAMPTON
-5.5%
TOWNSVILLE
1.5%
IPSWICH
-3.6%
BUNDABERG
-5.3%
TOOWOOMBA
REIQ.com
QUEENSLAND MARKET MONITOR • MARCH 2021 | ISSUE 49 REPORTING ON THE DECEMBER QUARTER 2020 | 17
Sales Market Summary
ANNUAL STATISTICS SUMMARY
QUEENSLAND ALL LGAs ANNUAL STATISTICS PERFORMANCE BY LGA*
HOUSES (<2400m2)
HOUSES (>2400m2)
UNITS
LAND (<2400m2)
LAND (>2400m2)
Sales Market Summary
ANNUAL SALES
ANNUAL MEDIAN SALE
1YR CHANGE
ANNUAL SALES
ANNUAL MEDIAN SALE
1YR CHANGE
ANNUAL SALES
ANNUAL MEDIAN SALE
1YR CHANGE
ANNUAL SALES
ANNUAL MEDIAN SALE
1YR CHANGE
ANNUAL SALES
ANNUAL MEDIAN SALE
1YR CHANGE
BALONNE
26
$183,500
-5.9%
8
N/A
N/A
4
N/A
N/A
4
N/A
N/A
5
N/A
N/A
SUBURB/LGA
BANANA
133
$170,000
3.0%
20
$447,500
57.0%
5
N/A
N/A
19
N/A
N/A
9
N/A
N/A
BARCALDINE
24
$88,500
4.1%
15
N/A
N/A
1
N/A
N/A
5
N/A
N/A
4
N/A
N/A
BARCOO
3
N/A
N/A
0
N/A
N/A
0
N/A
N/A
0
N/A
N/A
1
N/A
N/A
BLACKALL TAMBO
26
N/A
N/A
7
N/A
N/A
1
N/A
N/A
3
N/A
N/A
4
N/A
N/A
BOULIA
1
N/A
N/A
0
N/A
N/A
0
N/A
N/A
0
N/A
N/A
0
N/A
N/A
13,085
$725,000
5.8%
369
$1,200,000
-4.0%
6,894
$420,000
0.0%
1,289
$405,000
-1.0%
65
$910,000
-2.4%
BRISBANE BULLOO BUNDABERG BURDEKIN
3
N/A
N/A
0
N/A
N/A
0
N/A
N/A
2
N/A
N/A
1
N/A
N/A
1,347
$290,000
5.5%
423
$365,000
2.8%
251
$240,000
-3.6%
456
$151,000
1.3%
270
$140,000
-6.7%
187
$175,000
9.4%
34
$332,500
N/A
14
N/A
N/A
19
N/A
N/A
11
N/A
N/A
BURKE
0
N/A
N/A
0
N/A
N/A
0
N/A
N/A
4
N/A
N/A
0
N/A
N/A
CAIRNS
2,170
$420,000
1.2%
154
$690,000
-1.4%
1,089
$220,000
-2.0%
504
$207,500
-8.0%
53
240,000
-5.4%
CARPENTARIA
11
N/A
N/A
0
N/A
N/A
0
N/A
N/A
8
N/A
N/A
3
N/A
N/A
CASSOWARY COAST
281
$230,000
-9.8%
105
$350,000
12.0%
49
$235,000
13.8%
90
$90,000
-14.3%
73
$140,000
-8.2%
CENTRAL HIGHLANDS
305
$260,000
9.7%
58
$462,000
-7.1%
27
$177,500
-1.4%
25
$82,500
N/A
22
$158,500
N/A
CHARTERS TOWERS
78
$147,000
-21.6%
57
$340,000
0.0%
2
N/A
N/A
8
N/A
N/A
21
$95,000
N/A
CLONCURRY
31
$150,000
36.2%
15
N/A
N/A
2
N/A
N/A
5
N/A
N/A
6
N/A
N/A
COOK
17
N/A
N/A
22
N/A
N/A
3
N/A
N/A
14
N/A
N/A
15
N/A
N/A
CROYDON
3
N/A
N/A
0
N/A
N/A
0
N/A
N/A
2
N/A
N/A
0
N/A
N/A
DIAMANTINA
4
N/A
N/A
0
N/A
N/A
0
N/A
N/A
6
N/A
N/A
1
N/A
N/A
DOUGLAS
150
$435,000
-3.3%
54
$522,500
4.5%
188
$262,500
11.5%
33
$150,000
N/A
21
$110,000
2.3%
ETHERIDGE
2
N/A
N/A
4
N/A
N/A
0
N/A
N/A
3
N/A
N/A
2
N/A
N/A
FLINDERS
16
N/A
N/A
5
N/A
N/A
0
N/A
N/A
3
N/A
N/A
1
N/A
N/A
FRASER COAST
1,947
$336,250
3.5%
468
$438,000
9.5%
351
$263,000
3.1%
543
$170,000
3.0%
320
$127,500
40.9%
GLADSTONE
836
$300,000
9.1%
235
$389,000
-4.2%
158
$178,200
-1.0%
167
$120,990
18.0%
140
$160,000
3.2%
GOLD COAST
7,617
$658,250
6.1%
674
$930,000
8.8%
6,762
$433,500
5.5%
1,083
$290,000
0.3%
142
$565,000
8.7%
GOONDIWINDI
94
$265,000
-10.2%
35
$380,000
10.1%
5
N/A
N/A
35
$87,500
493.2%
14
N/A
N/A
GYMPIE
721
$322,500
10.3%
462
$415,000
4.0%
117
$255,000
-3.8%
200
$140,995
4.8%
277
$185,000
4.5%
HINCHINBROOK
115
$210,000
15.1%
34
$292,000
8.1%
4
N/A
N/A
38
$50,500
N/A
15
N/A
N/A
3,262
$355,250
1.5%
245
$575,000
4.5%
202
$216,000
-15.0%
1,320
$213,000
2.4%
167
$335,000
3.1%
ISAAC
204
$250,000
25.0%
18
N/A
N/A
17
N/A
N/A
20
$41,300
N/A
18
N/A
N/A
LIVINGSTONE
618
400,000
5.3%
179
$540,000
14.9%
115
$258,000
21.4%
208
$174,000
2.5%
114
$235,000
-2.1%
LOCKYER VALLEY
227
$250,000
0.0%
469
$405,000
2.5%
15
N/A
N/A
78
$135,000
5.5%
212
$180,000
5.9%
3,650
$403,000
1.3%
790
$630,000
2.4%
634
$225,000
0.0%
1,585
$223,900
0.0%
162
$330,000
10.0%
35
$135,000
-14.3%
6
N/A
N/A
2
N/A
N/A
1
N/A
N/A
6
N/A
N/A
1,669
$370,000
4.5%
254
$480,000
0.3%
224
$221,000
-1.3%
295
$180,000
0.6%
136
$212,500
-7.6%
IPSWICH
LOGAN LONGREACH MACKAY MARANOA
101
$195,000
-10.3%
26
$385,000
17.0%
2
N/A
N/A
9
N/A
N/A
15
N/A
N/A
MAREEBA
126
$290,000
-1.7%
157
$484,408
5.3%
12
N/A
N/A
50
$114,000
-0.2%
81
$147,500
7.3%
MCKINLAY
7
N/A
N/A
2
N/A
N/A
0
N/A
N/A
1
N/A
N/A
1
N/A
N/A
6,565
$469,000
5.2%
937
$735,250
7.8%
1,276
$320,000
1.6%
1,955
$265,000
4.1%
320
$339,900
3.0%
MOUNT ISA
MORETON BAY
206
$255,000
6.3%
10
N/A
N/A
22
$237,500
N/A
6
N/A
N/A
2
N/A
N/A
MURWEIH
43
$88,000
30.4%
11
N/A
N/A
3
N/A
N/A
5
N/A
N/A
8
N/A
N/A
NOOSA
933
900,000
15.4%
332
$749,500
7.8%
598
$710,000
14.3%
56
$620,000
87.6%
22
$557,500
23.9%
NORTH BURNETT
96
$127,500
2.0%
41
$250,000
0.0%
2
N/A
N/A
35
$15,500
-22.5%
42
$72,500
N/A
PAROO
11
N/A
N/A
5
N/A
N/A
0
N/A
N/A
3
N/A
N/A
2
N/A
N/A
QUILPIE
14
N/A
N/A
2
N/A
N/A
0
N/A
N/A
1
N/A
N/A
2
N/A
N/A
REDLAND
2,797
$545,000
3.8%
135
$1,019,325
5.6%
417
$375,000
5.2%
1,154
$35,000
12.9%
20
$650,000
N/A
18 | QUEENSLAND MARKET MONITOR • MARCH 2021 | ISSUE 49 REPORTING ON THE DECEMBER QUARTER 2020
REIQ.com
QUEENSLAND ALL LGAs ANNUAL STATISTICS (CONT’D) HOUSES (<2400m2)
HOUSES (>2400m2)
UNITS
LAND (<2400m2)
LAND (>2400m2)
ANNUAL SALES
ANNUAL MEDIAN SALE
1YR CHANGE
ANNUAL SALES
ANNUAL MEDIAN SALE
1YR CHANGE
ANNUAL SALES
ANNUAL MEDIAN SALE
1YR CHANGE
ANNUAL SALES
ANNUAL MEDIAN SALE
1YR CHANGE
ANNUAL SALES
ANNUAL MEDIAN SALE
1YR CHANGE
9
N/A
N/A
2
N/A
N/A
0
N/A
N/A
1
N/A
N/A
5
N/A
N/A
ROCKHAMPTON
1,301
$275,000
3.8%
119
$380,000
7.0%
122
$249,000
-5.6%
151
$163,500
2.2%
56
$185,000
25.9%
SCENIC RIM
443
$421,000
5.3%
371
$624,750
5.5%
36
14.3%
72
$220,000
7.3%
110
$305,000
-10.3%
SOMERSET
263
$262,000
4.7%
241
$430,000
4.9%
2
N/A
N/A
59
$140,000
26.8%
78
$230,000
5.1%
SOUTH BURNETT
339
$205,000
2.5%
279
$288,000
2.9%
25
$190,000
N/A
109
$40,000
8.1%
198
$89,000
11.3%
SOUTHERN DOWNS
377
$250,000
-3.3%
200
$375,000
-1.4%
27
N/A
88
$83,500
-16.5%
148
$125,500
14.1%
SUNSHINE COAST
5,095
$630,000
7.7%
1,044
$795,000
8.2%
2,375
$443,000
8.0%
1,043
$272,977
1.1%
214
$520,000
0.7%
TABLELANDS
233
$290,000
-3.3%
212
$423,500
-2.0%
33
$215,500
-24.1%
109
$115,000
3.1%
79
$187,000
6.9%
TOOWOOMBA
2,174
$363,000
3.7%
472
$525,000
-3.7%
349
$285,000
9.6%
523
$180,000
-5.3%
252
$210,000
3.4%
SUBURB/LGA
RICHMOND
TORRES TOWNSVILLE WEIPA
$240,000
$240,000
2
N/A
N/A
0
N/A
N/A
1
N/A
N/A
0
N/A
N/A
0
N/A
N/A
2,507
$330,000
3.8%
276
$455,000
6.1%
554
$237,500
-2.7%
510
$155,000
-5.5%
85
$207,000
-13.4%
31
$475,000
3.3%
0
N/A
N/A
3
N/A
N/A
2
N/A
N/A
0
N/A
N/A
WESTERN DOWNS
280
$210,000
12.3%
163
$303,500
-5.2%
42
$129,500
-31.8%
33
$29,000
-17.1%
183
$35,000
16.7%
WHITSUNDAY
448
$350,000
-2.6%
111
$510,000
4.1%
181
$275,000
5.9%
138
$162,500
8.3%
73
$195,000
-14.7%
WINTON
17
N/A
N/A
3
N/A
N/A
0
N/A
N/A
1
N/A
N/A
0
N/A
N/A
*All figures are for 12 months to Sep-20
N/A Not available due to insufficient sales numbers
STRONGEST PERFORMERS BY LGA FOR THE PAST 12 MONTHS HOUSES (<2400m2)
HOUSES (>2400m2)
UNITS
LAND (<2400m2)
LAND (>2400m2)
ANNUAL CHANGE
LGA/REGION
ANNUAL CHANGE
36.2%
CLONCURRY
57.0%
30.4%
MURWEIH
17.0%
MARANOA
14.3%
NOOSA
87.6%
NOOSA
25.9%
ROCKHAMPTON
25.0%
ISAAC
14.9%
LIVINGSTONE
14.3%
SCENIC RIM
26.8%
SOMERSET
23.9%
NOOSA
LGA/REGION
ANNUAL CHANGE
LGA/REGION
ANNUAL CHANGE
LGA/REGION
ANNUAL CHANGE
LGA/REGION
BANANA
21.4%
LIVINGSTONE
493.2%
GOONDIWINDI
40.9%
FRASER COAST
MOST EXPENSIVE LGAs FOR THE PAST 12 MONTHS HOUSES (<2400m2)
HOUSES (>2400m2)
UNITS
LAND (<2400m2)
LAND (>2400m2)
ANNUAL MEDIAN SALE PRICE
LGA/REGION
ANNUAL MEDIAN SALE PRICE
LGA/REGION
ANNUAL MEDIAN SALE PRICE
LGA/REGION
ANNUAL MEDIAN SALE PRICE
LGA/REGION
ANNUAL MEDIAN SALE PRICE
LGA/REGION
$900,000
NOOSA
$1,200,000
BRISBANE
$710,000
NOOSA
$620,000
NOOSA
$910,000
BRISBANE
$725,000
BRISBANE
$1,019,325
REDLAND
$443,000
SUNSHINE COAST
$405,000
BRISBANE
$650,000
REDLAND
$658,250
GOLD COAST
$930,000
GOLD COAST
$433,500
GOLD COAST
$290,000
GOLD COAST
$565,000
GOLD COAST
MOST AFFORDABLE LGAs FOR THE PAST 12 MONTHS HOUSES (<2400m2) ANNUAL MEDIAN SALE PRICE
HOUSES (>2400m2)
LGA/REGION
ANNUAL MEDIAN SALE PRICE
$88,000
MURWEIH
$88,500 $127,500
UNITS
LGA/REGION
ANNUAL MEDIAN SALE PRICE
$250,000
NORTH BURNETT
BARCALDINE
$288,000
NORTH BURNETT
$292,000
LAND (<2400m2) LGA/REGION
ANNUAL MEDIAN SALE PRICE
$250,000
NORTH BURNETT
SOUTH BURNETT
$288,000
HINCHINBROOK
$292,000
LAND (>2400m2)
LGA/REGION
ANNUAL MEDIAN SALE PRICE
LGA/REGION
$15,500
NORTH BURNETT
$35,000
WESTERN DOWNS
SOUTH BURNETT
$29,000
WESTERN DOWNS
$72,500
NORTH BURNETT
HINCHINBROOK
$35,000
REDLAND
$89,000
SOUTH BURNETT
LARGEST SALES MARKETS BY LGA FOR THE PAST 12 MONTHS HOUSES (<2400m2) ANNUAL SALES
HOUSES (>2400m2)
UNITS
LAND (<2400m2)
LGA/REGION
ANNUAL SALES
LGA/REGION
ANNUAL SALES
13,085
BRISBANE
1,044
SUNSHINE COAST
6,894
7,617
GOLD COAST
937
MORETON BAY
6,762
6,565
MORETON BAY
790
LOGAN
2,375
SUNSHINE COAST
REIQ.com
LGA/REGION
LAND (>2400m2)
ANNUAL SALES
LGA/REGION
ANNUAL SALES
LGA/REGION
BRISBANE
1,955
MORETON BAY
320
FRASER COAST
GOLD COAST
1,585
LOGAN
320
FRASER COAST
1,320
IPSWICH
277
GYMPIE
QUEENSLAND MARKET MONITOR • MARCH 2021 | ISSUE 49 REPORTING ON THE DECEMBER QUARTER 2020 | 19
Sales Market Summary
PERFORMANCE BY LGA*
ON THE MARKET INDICATORS HOUSES (ALL) LGA / REGION
TOTAL LISTINGS
STOCK ON MARKET
CHANGE OVER YEAR MEDIAN VENDOR DISCOUNT**
TOTAL LISTINGS
STOCK ON MARKET
DAYS ON MARKET
VENDOR DISCOUNT
12 MONTHS TO SEPTEMBER
2020*
2019*
2020*
2019*
2020*
2019*
2020*
2019*
QUEENSLAND
103,425
114,041
7.0%
7.8%
40
51
-3.6%
-4.2%
-9.3%
CHANGE OVER YEAR
-0.8%
-11
-0.6%
GREATER BRISBANE
43,385
48,771
6.1%
7.0%
34
45
-3.2%
-3.7%
-11.0%
-0.8%
-11
-0.5%
BRISBANE LGA
16,591
19,114
5.3%
6.1%
28
38
-3.0%
-3.6%
-13.2%
-0.8%
-10
-0.6%
IPSWICH
5,160
5,705
7.0%
7.9%
44
56
-3.9%
-4.0%
-9.6%
-0.9%
-12
-0.1%
% PTS
% PTS
LOGAN
6,352
7,097
6.4%
7.2%
45
54
-3.3%
-3.6%
-10.5%
-0.8%
-9
-0.3%
MORETON BAY
9,422
10,329
6.7%
7.4%
32
45
-2.8%
-3.4%
-8.8%
-0.7%
-13
-0.6%
REDLAND
3,987
4,363
7.5%
8.3%
33
50
-3.3%
-4.0%
-8.6%
-0.8%
-17
-0.7%
GOLD COAST
10,776
12,289
7.8%
9.0%
34
50
-3.2%
-3.8%
-12.3%
-1.1%
-16
-0.7%
SUNSHINE COAST SD
8,828
9,708
7.9%
8.8%
39
54
-3.1%
-3.5%
-9.1%
-0.8%
-15
-0.5%
SUNSHINE COAST
7,373
8,026
7.9%
8.7%
37
53
-2.9%
-3.4%
-8.1%
-0.8%
-16
-0.4%
NOOSA
1,455
1,682
7.8%
9.0%
50
57
-3.7%
-4.2%
-13.5%
-1.2%
-7
-0.5%
FRASER COAST
3,528
4,050
8.8%
10.1%
58
66
-3.8%
-4.5%
-12.9%
-1.4%
-8
-0.7%
CAIRNS
3,444
3,800
7.2%
8.0%
42
47
-3.9%
-4.2%
-9.4%
-0.8%
-5
-0.3%
BUNDABERG
2,687
3,044
7.8%
8.9%
50
58
-3.5%
-4.6%
-11.7%
-1.1%
-8
-1.1%
GLADSTONE
1,808
1,746
7.8%
7.6%
60
53
-4.5%
-6.2%
3.6%
0.2%
7
-1.7%
MACKAY
2,920
2,903
7.2%
7.2%
41
48
-4.1%
-5.1%
0.6%
0.0%
-7
-1.0%
ROCKHAMPTON
2,110
2,138
7.1%
7.2%
55
66
-4.9%
-6.7%
-1.3%
-0.1%
-11
-1.8%
TOOWOOMBA
3,709
4,085
7.0%
7.8%
41
52
-3.2%
-4.1%
-9.2%
-0.8%
-11
-0.8%
TOWNSVILLE
4,153
4,203
6.6%
6.7%
47
53
-5.2%
-5.6%
-1.2%
-0.1%
-6
-0.3%
* Figures are preliminary ** Days on Market and Vendor Discount calculation methodology changed from a average calculation to a median calculation
MEDIAN DAYS ON MARKET - HOUSES
Source: REIQ. Data Supplied by CoreLogic RP Data Market Trends
12 months to November Source: REIQ, data supplied by CoreLogic 70 2019*
60
2020*
50 40 30 20
TOWNSVILLE
TOOWOOMBA
MACKAY
ROCKHAMPTON
GLADSTONE
BUNDABERG
CAIRNS
NOOSA
FRASER COAST
SUNSHINE COAST
GOLD COAST
SUNSHINE COAST SD
REDLAND
LOGAN
MORETON BAY
IPSWICH
0
BRISBANE LGA
10
GREATER BRISBANE
Sales Market Summary
MEDIAN DAYS ON MARKET**
0.0% -1.0% -2.0% -3.0% -4.0% -5.0% -6.0% -7.0%
2019*
2020*
MEDIAN VENDOR DISCOUNTING - HOUSES 20 | QUEENSLAND MARKET MONITOR • MARCH 2021 | ISSUE 49 REPORTING ON THE DECEMBER QUARTER 2020
REIQ.com
ON THE MARKET INDICATORS LGA / REGION
TOTAL LISTINGS
STOCK ON MARKET
CHANGE OVER YEAR
MEDIAN DAYS ON MARKET**
MEDIAN VENDOR DISCOUNT**
TOTAL LISTINGS
STOCK ON MARKET
DAYS ON MARKET
VENDOR DISCOUNT
12 MONTHS TO SEPTEMBER
2020*
2019*
2020*
2019*
2020*
2019*
2020*
2019*
CHANGE OVER YEAR
QUEENSLAND
32,804
36,892
6.2%
7.1%
50
62
-3.6%
-4.3%
-11.1%
-0.9%
-12
-0.6%
GREATER BRISBANE
14,264
15,609
5.8%
6.5%
46
58
-3.3%
-3.9%
-8.6%
-0.7%
-12
-0.7%
BRISBANE LGA
10,120
11,232
5.5%
6.2%
40
51
-3.2%
-3.7%
-9.9%
-0.8%
-11
-0.5%
377
442
5.1%
6.1%
90
103
-6.8%
-5.6%
-14.7%
-1.0%
-13
1.2%
% PTS
IPSWICH
% PTS
LOGAN
1,102
1,135
6.5%
6.9%
70
73
-4.4%
-5.1%
-2.9%
-0.3%
-3
-0.6%
MORETON BAY
1,978
2,062
7.1%
7.6%
59
78
-3.1%
-4.2%
-4.1%
-0.5%
-19
-1.1%
REDLAND
586
635
6.9%
7.5%
50
69
-2.5%
-3.1%
-7.7%
-0.6%
-19
-0.6%
GOLD COAST
8,197
9,436
6.8%
8.0%
50
63
-3.7%
-4.2%
-13.1%
-1.1%
-13
-0.4%
SUNSHINE COAST SD
3,463
3,976
7.1%
8.2%
44
62
-3.0%
-3.8%
-12.9%
-1.2%
-18
-0.8%
SUNSHINE COAST
2,901
3,315
7.3%
8.5%
47
62
-2.9%
-3.7%
-12.5%
-1.2%
-15
-0.7%
NOOSA
562
661
6.0%
7.2%
38
64
-3.3%
-4.1%
-15.0%
-1.1%
-26
-0.8%
FRASER COAST
499
541
8.0%
8.8%
86
82
-4.6%
-4.2%
-7.8%
-0.8%
4
0.4%
CAIRNS
1,662
1,964
7.0%
8.4%
57
66
-4.8%
-5.0%
-15.4%
-1.4%
-9
-0.2%
BUNDABERG
324
434
5.8%
7.8%
98
143
-4.4%
-5.2%
-25.3%
-2.0%
-45
-0.7%
GLADSTONE
269
322
6.0%
7.3%
86
67
-5.4%
-7.4%
-16.5%
-1.3%
20
-2.0%
MACKAY
377
406
4.8%
5.3%
61
82
-5.2%
-7.5%
-7.1%
-0.4%
-21
-2.3%
ROCKHAMPTON
238
243
5.0%
5.1%
101
135
-6.0%
-9.8%
-2.1%
-0.2%
-34
-3.8%
TOOWOOMBA
678
797
5.7%
6.9%
72
72
-3.2%
-4.5%
-14.9%
-1.2%
0
-1.3%
TOWNSVILLE
957
971
5.5%
5.6%
74
79
-6.9%
-6.6%
-1.4%
-0.1%
-5
0.3%
* Figures are preliminary ** Days on Market and Vendor Discount calculation methodology changed from a average calculation to a median calculation
MEDIAN DAYS ON MARKET- UNITS
Source: REIQ. Data Supplied by CoreLogic RP Data Market Trends
12 months to November Source: REIQ, data supplied by CoreLogic 160
2019*
140
2020*
120 100 80 60 40
TOWNSVILLE
TOOWOOMBA
MACKAY
ROCKHAMPTON
GLADSTONE
BUNDABERG
CAIRNS
NOOSA
FRASER COAST
SUNSHINE COAST
GOLD COAST
SUNSHINE COAST SD
REDLAND
LOGAN
MORETON BAY
IPSWICH
BRISBANE LGA
0
GREATER BRISBANE
20
0.0% -2.0% -4.0% -6.0% -8.0% -10.0% -12.0%
2019*
2020*
MEDIAN VENDOR DISCOUNTING - UNITS REIQ.com
QUEENSLAND MARKET MONITOR • MARCH 2021 | ISSUE 49 REPORTING ON THE DECEMBER QUARTER 2020 | 21
Sales Market Summary
UNITS & TOWNHOUSES
Rental Market Summary QUARTER STATISTICS SUMMARY RENTAL TRENDS LGA/REGION
MEDIAN WEEKLY RENT 3-BED HOUSE
GREATER BRISBANE
2-BED FLAT
QUARTERLY TREND
GROSS RENTAL YIELDS 3-BED TOWNHOUSE
QUARTERLY TREND
HOUSES
QUARTERLY TREND
UNITS
QUARTERLY TREND
QUARTERLY TREND
BRISBANE LGA
$460
UP
$425
STEADY
$430
UP
3.2%
STEADY
5.0%
STEADY
IPSWICH
$330
UP
$270
UP
$330
UP
4.8%
STEADY
6.6%
DOWN
LOGAN
$355
UP
$295
UP
$340
STEADY
4.5%
STEADY
6.9%
STEADY
MORETON BAY
$380
UP
$295
DOWN
$360
UP
4.1%
STEADY
4.5%
DOWN*
REDLAND
$425
UP
$360
UP
$410
DOWN
3.9%
STEADY
5.1%
STEADY
GOLD COAST
$540
UP*
$450
STEADY
$470
UP
4.0%
STEADY
5.2%
STEADY
SUNSHINE COAST
$490
UP*
$410
UP
$460
UP
3.8%
STEADY
4.7%
STEADY
NOOSA
$570
UP*
$473
UP
$750
UP*
3.2%
UP
3.3%
STEADY
FRASER COAST
$340
STEADY
$280
UP
$355
UP
5.1%
STEADY
5.1%
DOWN
CAIRNS
$420
UP
$330
UP
$380
DOWN
5.0%
STEADY
7.8%
STEADY
BUNDABERG
$325
UP
$255
DOWN
$360
UP*
5.7%
STEADY
4.3%
DOWN*
GLADSTONE
$285
UP*
$220
UP
$280
UP
4.6%
STEADY
5.4%
DOWN*
MACKAY
$395
UP*
$295
DOWN
$375
STEADY
5.3%
STEADY
8.1%
UP*
TOURISM CENTRES
REGIONAL QLD
ROCKHAMPTON
$330
UP
$250
UP
$375
STEADY
6.0%
STEADY
5.2%
STEADY
TOOWOOMBA
$330
UP
$270
UP
$340
STEADY
4.6%
STEADY
4.7%
DOWN
TOWNSVILLE
$350
UP*
$300
UP*
$350
UP
5.4%
STEADY
6.4%
STEADY
*Rent change of $20 or more or 0.5 pts or more (yields) N/A Not available
22 | QUEENSLAND MARKET MONITOR • MARCH 2021 | ISSUE 49 REPORTING ON THE DECEMBER QUARTER 2020
REIQ.com
COUNCIL / REGION
LOCAL GOVERNMENT AREA
UNITS2
DEC-20
SEP-20
DEC-20
SEP-20
BRISBANE
3.2%
3.2%
5.0%
5.3%
IPSWICH
4.8%
4.8%
6.6%
7.1%
LOGAN
4.5%
4.6%
6.9%
6.6%
DEC-20
SEP-20
CHANGE
STATUS
BRISBANE SD
1.8%
2.0%
-0.2%
TIGHT
GREATER BRISBANE
BRISBANE CITY
2.4%
2.8%
-0.4%
TIGHT
BRISBANE INNER (0-5KM)
3.1%
3.8%
-0.6%
HEALTHY
BRISBANE REMAINDER (5KM+)
1.5%
1.6%
0.0%
TIGHT
BRISBANE SURROUNDS
1.0%
1.0%
0.0%
TIGHT
IPSWICH CITY
1.0%
1.1%
-0.1%
TIGHT
LOGAN CITY
1.2%
1.4%
-0.1%
TIGHT
MORETON BAY
0.8%
0.8%
0.0%
TIGHT
TOURISM CENTRES
0.8%
0.7%
0.1%
TIGHT
MORETON BAY - CABOOLTURE
HOUSES1
MORETON BAY
4.1%
4.1%
4.5%
5.0%
REDLAND
3.9%
3.9%
5.1%
4.9%
GOLD COAST
4.0%
4.0%
5.2%
5.5%
SUNSHINE COAST
3.8%
3.9%
4.7%
4.7% 3.4%
MORETON BAY - PINE RIVERS
0.8%
0.8%
0.0%
TIGHT
MORETON BAY - REDCLIFFE
0.9%
1.0%
-0.1%
TIGHT
NOOSA
3.2%
2.9%
3.3%
TIGHT
FRASER COAST
5.1%
5.3%
5.1%
5.6%
5.0%
5.0%
7.8%
7.7%
REDLAND CITY
0.7%
0.5%
0.1%
REDLAND CITY - MAINLAND
0.5%
0.4%
0.1%
TIGHT
CAIRNS
REDLAND CITY - BAY ISLANDS
1.6%
1.3%
0.3%
TIGHT
REGIONAL/RESOURCE AREAS
GOLD COAST CITY
0.6%
1.3%
-0.7%
TIGHT
BUNDABERG
5.7%
5.5%
4.3%
6.6%
SUNSHINE COAST SD
0.5%
0.6%
-0.2%
TIGHT
GLADSTONE
4.6%
4.5%
5.4%
6.2%
SUNSHINE COAST
0.4%
0.5%
-0.1%
TIGHT
SUNSHINE COAST - CALOUNDRA
0.3%
0.4%
-0.1%
TIGHT
MACKAY
5.3%
5.1%
8.1%
6.9%
SUNSHINE COAST - MAROOCHY
0.3%
0.4%
-0.1%
TIGHT
5.0%
SUNSHINE COAST - HINTERLAND*
0.3%
0.6%
-0.3%
TIGHT
NOOSA
0.3%
0.5%
-0.2%
TIGHT
FRASER COAST
0.6%
0.8%
-0.2%
TIGHT
FRASER COAST - HERVEY BAY
0.8%
1.0%
-0.2%
TIGHT
BANANA
FRASER COAST - MARYBOROUGH
0.1%
0.2%
-0.1%
TIGHT
BURDEKIN
ROCKHAMPTON
6.0%
6.1%
5.2%
TOOWOOMBA
4.6%
4.6%
4.7%
5.1%
TOWNSVILLE
5.4%
5.1%
6.4%
6.4%
8.4%
9.1%
N/A
N/A
7.1%
8.5%
N/A
N/A
6.7%
7.4%
N/A
N/A
OTHER REGIONAL AREAS
CAIRNS
1.2%
1.2%
0.0%
TIGHT
CASSOWARY COAST
BUNDABERG
0.4%
0.4%
0.0%
TIGHT
CENTRAL HIGHLANDS
6.0%
6.1%
N/A
N/A
GLADSTONE
0.9%
1.3%
-0.3%
TIGHT
DOUGLAS
4.2%
4.2%
6.1%
5.5%
MACKAY
0.9%
0.6%
0.3%
TIGHT
GOONDIWINDI
8.0%
5.4%
N/A
N/A
ROCKHAMPTON
0.3%
0.3%
0.0%
TIGHT
TOOWOOMBA
0.9%
0.5%
0.4%
TIGHT
TOWNSVILLE
1.0%
0.6%
0.3%
TIGHT
BALONNE
0.5%
1.2%
-0.6%
GYMPIE
5.2%
4.9%
5.1%
4.2%
HINCHINBROOK
7.8%
7.7%
N/A
N/A
TIGHT
ISAAC
6.7%
6.3%
N/A
N/A
4.6%
4.7%
5.2%
6.7%
BANANA
0.7%
0.7%
0.0%
TIGHT
LIVINGSTONE
BURDEKIN
0.7%
0.4%
0.3%
TIGHT
LOCKYER VALLEY
6.7%
6.9%
N/A
N/A
CASSOWARY COAST
1.3%
1.3%
0.0%
TIGHT
CENTRAL HIGHLANDS
1.2%
0.7%
0.5%
TIGHT
MAREEBA
6.5%
6.0%
N/A
N/A
GYMPIE
0.4%
0.3%
0.0%
TIGHT
ISAAC
1.4%
0.7%
0.6%
TIGHT
LIVINGSTONE
0.4%
0.4%
-0.1%
TIGHT
LOCKYER VALLEY
1.1%
0.6%
0.5%
TIGHT
MARANOA
1.9%
0.8%
1.1%
TIGHT
MOUNT ISA
0.9%
0.4%
0.5%
TIGHT
SCENIC RIM
0.8%
0.8%
0.0%
TIGHT
SOMERSET
1.2%
0.8%
0.4%
TIGHT
SOUTH BURNETT
0.8%
0.5%
0.3%
TIGHT
SOUTHERN DOWNS
0.5%
0.4%
0.2%
TIGHT
TABLELANDS
0.5%
0.4%
0.1%
TIGHT
WESTERN DOWNS
0.9%
0.8%
0.1%
TIGHT
WHITSUNDAY
1.5%
1.3%
0.2%
TIGHT
* Noosa Hinterland included in Sunshine Coast Hinterland Vacancy trend steady = between -0.3% to 0.3% up = +0.3% or more down = -0.3% or more
Market Status Tight <2.5% Healthy 2.5-3.5% Weak >3.5%
MOUNT ISA
7.1%
9.4%
N/A
N/A
SCENIC RIM
4.1%
4.6%
N/A
N/A
SOMERSET
6.1%
6.6%
N/A
N/A
SOUTH BURNETT
6.8%
7.4%
N/A
N/A
SOUTHERN DOWNS
5.8%
5.0%
N/A
N/A
TABLELANDS
5.3%
6.3%
N/A
N/A
WESTERN DOWNS
5.8%
6.0%
N/A
N/A
WHITSUNDAY
5.5%
5.4%
5.2%
5.8%
Yields comparison based on preliminary data for Dec-20 N/A: Any region with less than 20 transactions is not included in yield calculations ¹ Based upon rents for 3-bedroom houses ; source: Residential Tenancies Authority, Bond Lodgements ² Based upon rents for 2-bedroom flats ; source: Residential Tenancies Authority, Bond Lodgements Rental Yield Trend: Steady = +/- 0 to 0.3%pts Up = + 0.3%pts or more Down = - 0.3%pts or more
Source: REIQ Residential Rental Survey
REIQ.com
QUEENSLAND MARKET MONITOR • MARCH 2021 | ISSUE 49 REPORTING ON THE DECEMBER QUARTER 2020 | 23
Rental Market Summary
GROSS YIELDS
RESIDENTIAL VACANCY RATES
Rental Market Summary
ANNUAL STATISTICS SUMMARY RENTAL TRENDS LGA/REGION
MEDIAN WEEKLY RENT 3-BED HOUSE
GREATER BRISBANE
2-BED FLAT
ANNUAL TREND
GROSS RENTAL YIELDS 3-BED TOWNHOUSE
ANNUAL TREND
HOUSES
ANNUAL TREND
UNITS
ANNUAL TREND
ANNUAL TREND
BRISBANE LGA
$460
UP
$425
UP
$430
UP
3.2%
STEADY
5.0%
STEADY
IPSWICH
$330
UP
$270
UP
$330
UP
4.8%
STEADY
6.6%
UP*
LOGAN
$355
UP
$295
UP
$340
UP
4.5%
STEADY
6.9%
UP*
MORETON BAY
$380
UP
$295
UP
$360
UP
4.1%
STEADY
4.5%
STEADY
REDLAND
$425
UP*
$360
UP
$410
UP
3.9%
STEADY
5.1%
UP
GOLD COAST
$540
UP*
$450
STEADY
$470
UP*
4.0%
STEADY
5.2%
DOWN
SUNSHINE COAST
$490
UP*
$410
UP*
$460
UP
3.8%
STEADY
4.7%
STEADY
NOOSA
$570
UP*
$473
UP*
$750
UP*
3.2%
STEADY
3.3%
STEADY
FRASER COAST
$340
UP*
$280
UP
$355
UP
5.1%
STEADY
5.1%
STEADY
CAIRNS
$420
UP*
$330
UP
$380
DOWN
5.0%
STEADY
7.8%
UP*
TOURISM CENTRES
REGIONAL QLD BUNDABERG
$325
UP*
$255
UP
$360
UP*
5.7%
STEADY
4.3%
STEADY
GLADSTONE
$285
UP*
$220
UP*
$280
UP*
4.6%
STEADY
5.4%
N/A
MACKAY
$395
UP*
$295
UP*
$375
UP
5.3%
STEADY
8.1%
UP*
ROCKHAMPTON
$330
UP*
$250
UP*
$375
UP*
6.0%
UP
5.2%
N/A
TOOWOOMBA
$330
UP*
$270
N/A
$340
UP*
4.6%
STEADY
4.7%
STEADY
TOWNSVILLE
$350
UP*
$300
UP*
$350
UP*
5.4%
STEADY
6.4%
DOWN
*Rent change of $20 or more or 0.5 pts or more (yields) N/A Not available
24 | QUEENSLAND MARKET MONITOR • MARCH 2021 | ISSUE 49 REPORTING ON THE DECEMBER QUARTER 2020
REIQ.com
Rental Market Summary SIZE OF RENTAL MARKET
TOTAL BONDS - ANNUAL TREND
LGA/REGION
QUEENSLAND
HOUSES
312,680
0.6%
STEADY
DEC-20
DEC-19
% CHANGE
ANNUAL TREND
BRISBANE
61,403
61,016
0.6%
IPSWICH
23,697
23,244
LOGAN
26,581
MORETON BAY REDLAND
GREATER BRISBANE
314,572
UNITS
233,437
TOWNHOUSES
226,145
3.2%
UP
DEC-20
DEC-19
% CHANGE
ANNUAL TREND
STEADY
95,899
93,878
2.2%
1.9%
STEADY
5,395
5,015
25,369
4.8%
UP
6,734
32,454
32,093
1.1%
STEADY
8,702
8,707
-0.1%
67,668
TOTAL
64,332
5.2%
UP
DEC-20
DEC-19
% CHANGE
ANNUAL TREND
UP
23,011
22,345
3.0%
7.6%
UP
2,619
2,289
6,105
10.3%
UP
6,602
10,577
10,042
5.3%
UP
STEADY
1,718
1,698
1.2%
615,677
603,157
2.1%
UP
DEC-20
DEC-19
% CHANGE
ANNUAL TREND
UP
180,313
177,239
1.7%
STEADY
14.4%
UP
31,711
30,548
3.8%
UP
6,082
8.5%
UP
39,917
37,556
6.3%
UP
8,846
8,112
9.0%
UP
51,877
50,247
3.2%
UP
STEADY
2,074
1,927
7.6%
UP
12,494
12,332
1.3%
STEADY
TOURISM CENTRES GOLD COAST
30,236
30,078
0.5%
STEADY
37,944
36,136
5.0%
UP
14,152
13,713
3.2%
UP
82,332
79,927
3.0%
UP
SUNSHINE COAST
18,604
18,424
1.0%
STEADY
12,848
12,486
2.9%
UP
3,508
3,308
6.0%
UP
34,960
34,218
2.2%
UP
NOOSA
2,466
2,512
-1.8%
STEADY
1,331
1,257
5.9%
UP
395
370
6.8%
UP
4,192
4,139
1.3%
STEADY
FRASER COAST
6,933
6,996
-0.9%
STEADY
2,676
2,726
-1.8%
STEADY
545
540
0.9%
STEADY
10,154
10,262
-1.1%
STEADY
CAIRNS
9,497
9,559
-0.6%
STEADY
11,242
11,010
2.1%
UP
918
917
0.1%
STEADY
21,657
21,486
0.8%
STEADY
BUNDABERG
6,381
6,438
-0.9%
STEADY
2,933
2,879
1.9%
STEADY
134
136
-1.5%
STEADY
9,448
9,453
-0.1%
STEADY
GLADSTONE
5,353
5,522
-3.1%
DOWN
2,228
2,142
4.0%
UP
782
825
-5.2%
DOWN
8,363
8,489
-1.5%
STEADY
REGIONAL QLD
MACKAY
7,682
7,918
-3.0%
DOWN
4,323
4,264
1.4%
STEADY
497
491
1.2%
STEADY
12,502
12,673
-1.3%
STEADY
ROCKHAMPTON
4,647
4,816
-3.5%
DOWN
2,703
2,694
0.3%
STEADY
172
142
21.1%
UP
7,522
7,652
-1.7%
STEADY
TOOWOOMBA
11,713
11,662
0.4%
STEADY
7,638
7,515
1.6%
STEADY
565
522
8.2%
UP
19,916
19,699
1.1%
STEADY
TOWNSVILLE
14,473
14,766
-2.0%
STEADY
9,250
8,896
4.0%
UP
874
794
10.1%
UP
24,597
24,456
0.6%
STEADY
Bonds Trend: Steady = - 2% to + 2% change Up = + 2% change or more Down = - 2% change or more
REIQ.com
QUEENSLAND MARKET MONITOR • MARCH 2021 | ISSUE 49 REPORTING ON THE DECEMBER QUARTER 2020 | 25
QUEENSLAND ALL LGAS - WEEKLY MEDIAN RENTS BY DWELLING TYPE LGA
FLAT 1-BED Dec-19
Dec-20
FLAT 2-BED
% Change
Dec-19
Dec-20
FLAT 3-BED
HOUSE 2-BED
% Change
Dec-19
Dec-20
% Change
Dec-19
Dec-20
% Change
Rental Market Summary
Balonne Shire Council
N/A
N/A
N/A
N/A
$170
N/A
N/A
N/A
N/A
N/A
N/A
N/A
Banana Shire Council
$200
$160
-20.0%
$265
$250
-5.7%
N/A
N/A
N/A
N/A
N/A
N/A
Barcaldine Regional Council
N/A
N/A
N/A
N/A
$190
N/A
N/A
N/A
N/A
N/A
N/A
N/A
Barcoo Shire Council
N/A
N/A
N/A
N/A
N/A
N/A
N/A
N/A
N/A
N/A
N/A
N/A
Blackall-Tambo Regional Council
N/A
$153
N/A
$108
$150
39.5%
N/A
N/A
N/A
N/A
N/A
N/A
Boulia Shire Council
N/A
N/A
N/A
N/A
N/A
N/A
N/A
N/A
N/A
N/A
N/A
N/A
Brisbane City Council
$365
$350
-4.1%
$420
$425
1.2%
$525
$530
1.0%
$400
$410
2.5%
Bundaberg Regional Council
$250
$270
8.0%
$240
$255
6.3%
$300
$320
6.7%
$270
$280
3.7%
Burdekin Shire Council
$190
$215
13.2%
$210
$220
4.8%
N/A
N/A
N/A
$230
$240
4.3%
Cairns Regional Council
$250
$260
4.0%
$315
$330
4.8%
$388
$400
3.2%
$338
$330
-2.2%
Carpentaria Shire Council
N/A
N/A
N/A
N/A
N/A
N/A
N/A
N/A
N/A
N/A
N/A
N/A 12.0%
Cassowary Coast Regional Council
$170
$190
11.8%
$240
$250
4.2%
$265
$360
35.8%
$250
$280
Central Highlands Regional Council
$200
$205
2.5%
$220
$240
9.1%
$300
$340
13.3%
N/A
N/A
N/A
Charters Towers Regional Council
N/A
N/A
N/A
$200
$220
10.0%
N/A
N/A
N/A
$220
$208
-5.7%
Cloncurry Shire Council
$133
N/A
N/A
$278
$250
-9.9%
N/A
N/A
N/A
N/A
$270
N/A
Cook Shire Council
$250
N/A
N/A
$240
N/A
N/A
N/A
N/A
N/A
$250
$250
0.0%
Diamantina Shire Council
N/A
N/A
N/A
N/A
N/A
N/A
N/A
N/A
N/A
N/A
N/A
N/A
Douglas Shire Council
$235
$235
0.0%
$328
$305
-6.9%
$380
$350
-7.9%
$330
$280
-15.2%
Flinders Shire Council
$150
N/A
N/A
N/A
N/A
N/A
N/A
N/A
N/A
N/A
N/A
N/A
Fraser Coast Regional Council
$206
$250
21.7%
$270
$280
3.7%
$350
$360
2.9%
$280
$293
4.5%
Gladstone Regional Council
$200
$180
-10.0%
$180
$220
22.2%
$235
$280
19.1%
$250
$235
-6.0%
Gold Coast City Council
$360
$360
0.0%
$450
$450
0.0%
$520
$560
7.7%
$420
$420
0.0%
Goondiwindi Regional Council
$170
$180
5.9%
$220
$250
13.6%
N/A
N/A
N/A
$258
$275
6.8%
Gympie Regional Council
$220
$240
9.1%
$235
$255
8.5%
$298
$310
4.2%
$270
$300
11.1%
Hinchinbrook Shire Council
N/A
N/A
N/A
$168
$180
7.5%
N/A
$170
N/A
N/A
N/A
N/A
Ipswich City Council
$235
$245
4.3%
$263
$270
2.6%
$300
$310
3.3%
$275
$288
4.5%
Isaac Regional Council
N/A
$130
N/A
$260
$225
-13.5%
$395
$255
-35.4%
$220
N/A
N/A
Livingstone Shire Council
$220
$230
4.5%
$300
$305
1.7%
$330
$340
3.0%
$288
$335
16.5%
Lockyer Valley Regional Council
N/A
N/A
N/A
$258
$263
1.9%
$278
$300
8.1%
$283
$250
-11.5%
Logan City Council
$250
$255
2.0%
$285
$295
3.5%
$340
$350
2.9%
$290
$300
3.4%
Longreach Regional Council
N/A
N/A
N/A
$185
$180
-2.7%
N/A
N/A
N/A
N/A
$200
N/A
Mackay Regional Council
$235
$280
19.4%
$270
$295
9.3%
$350
$380
8.6%
$295
$340
15.3%
Maranoa Regional Council
N/A
N/A
N/A
$174
$175
0.3%
$220
N/A
N/A
$195
$180
-7.7%
Mareeba Shire Council
$210
$195
-7.1%
$250
$280
12.0%
$315
$300
-4.8%
$298
$280
-5.9%
Moreton Bay Regional Council
$250
$255
2.0%
$290
$295
1.7%
$330
$345
4.5%
$300
$310
3.3%
Mount Isa City Council
$190
$200
5.3%
$220
$255
15.9%
$328
$365
11.5%
$300
$380
26.7% 4.3%
Murweh Shire Council
N/A
N/A
N/A
N/A
N/A
N/A
N/A
N/A
N/A
$173
$180
Noosa Shire Council
$308
$320
4.1%
$420
$473
12.5%
$499
$650
30.3%
$423
$430
1.8%
North Burnett Regional Council
N/A
N/A
N/A
$200
$210
5.0%
N/A
N/A
N/A
$200
$220
10.0%
Paroo Shire Council
N/A
N/A
N/A
N/A
N/A
N/A
N/A
N/A
N/A
N/A
N/A
N/A
Quilpie Shire Council
N/A
N/A
N/A
N/A
N/A
N/A
N/A
N/A
N/A
N/A
N/A
N/A
Redland City Council
$230
$240
4.3%
$351
$360
2.5%
$420
$430
2.4%
$260
$270
3.8%
Richmond Shire Council
N/A
N/A
N/A
N/A
N/A
N/A
N/A
N/A
N/A
N/A
N/A
N/A
Rockhampton Regional Council
$170
$220
29.8%
$223
$250
12.4%
$300
$300
0.0%
$240
$275
14.6%
Scenic Rim Regional Council
$250
$250
0.0%
$265
$270
1.9%
$310
$313
0.8%
$295
$290
-1.7%
Somerset Regional Council
N/A
N/A
N/A
N/A
$200
N/A
N/A
N/A
N/A
$300
$275
-8.3%
South Burnett Regional Council
$180
$181
0.5%
$220
$230
4.5%
$270
$275
1.9%
$220
$250
13.6%
Southern Downs Regional Council
$150
$175
16.7%
$210
$210
0.0%
$290
$300
3.4%
$235
$245
4.3%
Sunshine Coast Regional Council
$300
$310
3.3%
$380
$410
7.9%
$450
$470
4.4%
$380
$428
12.5%
Tablelands Regional Council
$178
$230
29.6%
$240
$260
8.3%
$290
$270
-6.9%
$260
$290
11.5%
Toowoomba Regional Council
$200
$200
0.0%
$250
$270
8.0%
$315
$325
3.2%
$270
$280
3.7%
Torres Shire Council
N/A
N/A
N/A
N/A
N/A
N/A
N/A
N/A
N/A
N/A
N/A
N/A
Townsville City Council
$230
$270
17.3%
$280
$300
7.1%
$375
$390
4.0%
$295
$310
5.1%
Weipa - part of Cook
N/A
N/A
N/A
$500
$500
0.0%
$588
$610
3.8%
N/A
N/A
N/A
Western Downs Regional Council
$160
$160
0.2%
$185
$205
10.8%
$220
$238
8.0%
$210
$220
4.8%
Whitsunday Regional Council
$193
$220
14.3%
$300
$300
0.0%
$345
$390
13.0%
$250
$290
16.0%
Winton Shire Council
N/A
N/A
N/A
N/A
N/A
N/A
N/A
N/A
N/A
N/A
N/A
N/A
26 | QUEENSLAND MARKET MONITOR • MARCH 2021 | ISSUE 49 REPORTING ON THE DECEMBER QUARTER 2020
REIQ.com
QUEENSLAND ALL LGAS - WEEKLY MEDIAN RENTS BY DWELLING TYPE (CONT’D) HOUSE 3-BED % Change
HOUSE 4-BED
Dec-19
Dec-20
Dec-19
Dec-20
Balonne Shire Council
$245
$250
2.0%
$310
N/A
Banana Shire Council
$280
$275
-1.8%
$370
$380
Barcaldine Regional Council
$230
$190
-17.4%
N/A
N/A
Barcoo Shire Council
N/A
N/A
N/A
N/A
Blackall-Tambo Regional Council
$175
$250
42.9%
N/A
% Change
TOWNHOUSE 2-BED
TOWNHOUSE 3-BED
Dec-19
Dec-20
% Change
Dec-19
Dec-20
% Change
N/A
N/A
N/A
N/A
N/A
N/A
N/A
2.7%
$350
N/A
N/A
N/A
N/A
N/A
N/A
N/A
N/A
N/A
N/A
N/A
N/A
N/A
N/A
N/A
N/A
N/A
N/A
N/A
N/A
N/A
N/A
N/A
N/A
N/A
N/A
N/A
N/A
Boulia Shire Council
N/A
N/A
N/A
N/A
N/A
N/A
N/A
N/A
N/A
N/A
N/A
N/A
Brisbane City Council
$445
$460
3.4%
$550
$550
0.0%
$390
$400
2.6%
$420
$430
2.4% 9.1%
Bundaberg Regional Council
$300
$325
8.3%
$350
$380
8.6%
$263
N/A
N/A
$330
$360
Burdekin Shire Council
$270
$265
-1.9%
$300
$320
6.7%
N/A
N/A
N/A
N/A
N/A
N/A
Cairns Regional Council
$400
$420
5.0%
$465
$490
5.4%
$290
$300
3.4%
$390
$380
-2.6%
Carpentaria Shire Council
$200
N/A
N/A
N/A
N/A
N/A
N/A
N/A
N/A
N/A
N/A
N/A
Cassowary Coast Regional Council
$300
$320
6.7%
$330
$388
17.4%
$265
$250
-5.7%
N/A
N/A
N/A
Central Highlands Regional Council
$273
$298
9.2%
$380
$390
2.6%
$280
N/A
N/A
$350
$330
-5.7%
Charters Towers Regional Council
$260
$290
11.5%
$348
$380
9.4%
N/A
N/A
N/A
N/A
N/A
N/A
Cloncurry Shire Council
$320
$305
-4.7%
$425
$460
8.2%
N/A
N/A
N/A
N/A
N/A
N/A
Cook Shire Council
$375
$320
-14.7%
$365
$380
4.1%
N/A
N/A
N/A
N/A
N/A
N/A
Diamantina Shire Council
N/A
N/A
N/A
N/A
N/A
N/A
N/A
N/A
N/A
N/A
N/A
N/A -10.9%
Douglas Shire Council
$380
$400
5.3%
$450
$530
17.8%
$370
$335
-9.5%
$460
$410
Flinders Shire Council
N/A
$208
N/A
N/A
N/A
N/A
N/A
N/A
N/A
N/A
N/A
N/A
Fraser Coast Regional Council
$320
$340
6.3%
$380
$420
10.5%
$283
$305
8.0%
$343
$355
3.6%
Gladstone Regional Council
$240
$285
18.8%
$300
$350
16.7%
$190
$230
21.1%
$240
$280
16.7%
Gold Coast City Council
$520
$540
3.8%
$515
$550
6.8%
$400
$420
5.0%
$450
$470
4.4%
Goondiwindi Regional Council
$308
$300
-2.4%
$400
$425
6.3%
N/A
N/A
N/A
N/A
N/A
N/A
Gympie Regional Council
$300
$325
8.3%
$360
$375
4.2%
$278
$300
8.1%
$300
$595
98.3%
Hinchinbrook Shire Council
$240
$270
12.5%
$240
$290
20.8%
N/A
N/A
N/A
N/A
N/A
N/A
Ipswich City Council
$315
$330
4.8%
$375
$390
4.0%
$270
$280
3.7%
$320
$330
3.1%
Isaac Regional Council
$300
$320
6.7%
$335
$400
19.4%
$250
N/A
N/A
$360
$480
33.3%
Livingstone Shire Council
$310
$370
19.4%
$350
$430
22.9%
$330
N/A
N/A
$400
$400
0.0%
Lockyer Valley Regional Council
$300
$320
6.7%
$350
$350
0.0%
$265
N/A
N/A
N/A
N/A
N/A
Logan City Council
$350
$355
1.4%
$400
N/A
N/A
$290
$285
-1.7%
$330
$340
3.0%
Longreach Regional Council
$270
$250
-7.4%
$350
$325
-7.1%
N/A
N/A
N/A
N/A
N/A
N/A
Mackay Regional Council
$370
$395
6.8%
$420
$450
7.1%
$320
$350
9.4%
$370
$375
1.4%
Maranoa Regional Council
$250
$260
4.0%
$330
$350
6.1%
N/A
N/A
N/A
N/A
N/A
N/A
Mareeba Shire Council
$320
$360
12.5%
$400
$415
3.8%
N/A
N/A
N/A
N/A
N/A
N/A
Moreton Bay Regional Council
$370
$380
2.7%
$430
$445
3.5%
$308
$310
0.8%
$350
$360
2.9%
Mount Isa City Council
$390
$425
9.0%
$468
$490
4.8%
N/A
N/A
N/A
N/A
$375
N/A
Murweh Shire Council
$220
$230
4.5%
$300
$270
-10.0%
N/A
N/A
N/A
N/A
N/A
N/A
Noosa Shire Council
$495
$570
15.2%
$600
$690
15.0%
$480
$500
4.2%
$600
$750
25.0%
North Burnett Regional Council
$240
$250
4.2%
$275
$245
-10.9%
N/A
N/A
N/A
N/A
N/A
N/A
Paroo Shire Council
N/A
N/A
N/A
N/A
N/A
N/A
N/A
N/A
N/A
N/A
N/A
N/A
Quilpie Shire Council
N/A
N/A
N/A
N/A
N/A
N/A
N/A
N/A
N/A
N/A
N/A
N/A
Redland City Council
$400
$425
6.3%
$498
$510
2.4%
$350
$355
1.4%
$405
$410
1.2%
Richmond Shire Council
N/A
$220
N/A
N/A
N/A
N/A
N/A
N/A
N/A
N/A
N/A
N/A
Rockhampton Regional Council
$290
$330
13.8%
$380
$400
5.3%
$280
$300
7.1%
$350
$375
7.1%
Scenic Rim Regional Council
$350
$350
0.0%
$380
$405
6.6%
$268
N/A
N/A
$310
$310
0.0%
Somerset Regional Council
$320
$325
1.6%
$318
$335
5.5%
N/A
N/A
N/A
N/A
N/A
N/A
South Burnett Regional Council
$270
$270
0.0%
$320
$350
9.4%
N/A
N/A
N/A
N/A
N/A
N/A
Southern Downs Regional Council
$275
$280
1.8%
$328
$350
6.9%
N/A
N/A
N/A
N/A
N/A
N/A 2.2%
Sunshine Coast Regional Council
$460
$490
6.5%
$540
$565
4.6%
$375
$430
14.7%
$450
$460
Tablelands Regional Council
$320
$330
3.1%
$380
$395
3.9%
N/A
N/A
N/A
N/A
N/A
N/A
Toowoomba Regional Council
$320
$330
3.1%
$400
$410
2.5%
$275
$280
1.8%
$338
$340
0.7%
Torres Shire Council
N/A
N/A
N/A
N/A
N/A
N/A
N/A
N/A
N/A
N/A
N/A
N/A
Townsville City Council
$330
$350
6.1%
$400
$410
2.5%
$280
$310
10.7%
$330
$350
6.1%
Weipa - part of Cook
$600
$680
13.3%
$690
$800
15.9%
N/A
N/A
N/A
N/A
N/A
N/A
Western Downs Regional Council
$240
$260
8.3%
$295
$300
1.7%
N/A
$275
N/A
$225
$240
6.7%
Whitsunday Regional Council
$360
$380
5.6%
$423
$425
0.6%
$350
$320
-8.6%
$380
$405
6.6%
Winton Shire Council
N/A
N/A
N/A
N/A
N/A
N/A
N/A
N/A
N/A
N/A
N/A
N/A
REIQ.com
QUEENSLAND MARKET MONITOR • MARCH 2021 | ISSUE 49 REPORTING ON THE DECEMBER QUARTER 2020 | 27
Rental Market Summary
LGA
Greater Brisbane EMPLOYMENT MARKET
EMPLOYMENT MARKET
EMPLOYMENT MARKET
IPSWICH
LOGAN - BEAUDESERT
MORETON BAY - NORTH
Unemployment Rate
Unemployment Rate
Unemployment Rate
Participation Rate
Participation Rate
Participation Rate
6.6%
64.5% EMPLOYMENT MARKET MORETON BAY - SOUTH
Unemployment Rate
5.1%
Participation Rate
73.3%
Part of the attraction for the outer LGAs remains relative affordability. As demand continues to run hot in inner Brisbane, the LGAs of Moreton, Ipswich, Logan and – to some extent – Redland allow buyers to get more property for their dollar.
7.9%
63.5%
9.4%
58.1%
Greater Brisbane: A Rush to the Outer Regions A year ago, things looked fairly dire for Australian real estate as the economy hunkered down to weather the pandemic storm that was to come. It delivered uncertainty, which is a huge threat to property markets as Australians crave stability when it comes to buying, selling and renting. But of course, Queensland weathered the COVID-19 crisis better than most, and our southeast property market has been the beneficiary with historic low interest rates and a raft of government stimulus packages all helping drive demand higher. In fact, many are now touting South East Queensland as the best place to invest. After years of being the bridesmaid among eastern seaboard capital city markets, 2021 is shaping up as our year with the strength of our hot inner-Brisbane suburbs now filtering through, with surrounding LGAs reaping the rewards. REIQ Ipswich Zone Chair Glenn Ball said the western corridor, like most of Greater Brisbane, has seen an extraordinary turnaround. “We’re definitely experiencing a supply and demand issue, where buyers and tenants outweigh what we have on the books. It’s creating huge demand and multiple offers on most of our property,” he explained. “There’s three main contributors, in my opinion. One is low interest rates where buyers who couldn’t previously afford to get into the market are now seeing it as a viable option. Secondly, I’m getting people coming from Brisbane in droves to relocate here, because they’ve liked Ipswich in previous years, but didn’t want to travel for work each day. Now the change with working from home means they now don’t have to worry so much about the commute. And lastly, there’s a massive number of people coming up from interstate – I don’t see this market slowing up for at least another 12 months.” Part of the attraction for the outer LGAs remains relative affordability. As demand continues to run hot in inner Brisbane, the LGAs of Moreton, Ipswich, Logan and – to some extent – Redland allow buyers to get more property for their dollar. House Market <2400m2 One of the more compelling graphics in this quarter’s report is the property price clock for houses. In previous issues of the Queensland Market Monitor, the five South East Queensland LGAs would be dispersed throughout different phases of the cycle. On the current clock, however, they’re all within the rising price phase. And this is reflected in the hard data. All housing markets saw an increase in annual values to December 2020. Outside of the Brisbane LGA, Moreton Bay had the most convincing gain at 5.2%, but even Logan’s 1.3% is an excellent outcome. Of note, Greater Brisbane housing saw a 13.8% increase on its median house price over the past five years, meaning those with medium- to long-term investment outlooks are coming up trumps.
28 | QUEENSLAND MARKET MONITOR • MARCH 2021 | ISSUE 49 REPORTING ON THE DECEMBER QUARTER 2020
REIQ.com
Greater Brisbane HOUSE MARKET (<2400M2)
HOUSE MARKET (<2400M2)
HOUSE MARKET (<2400M2)
GREATER BRISBANE
IPSWICH
LOGAN
Annual
Quarter median price
Annual median price
$570,000 $544,900
Quarter median price
$357,250
5yrs
Annual volume of sales
29,971 REIQ.com
Annual median price 5yrs ago
$479,000
Annual
Annual
Annual median price
$355,250
Quarter median price
$409,000 $403,000 5yrs
5yrs
Annual volume of sales
3,262
Annual median price 5yrs ago
$325,000
Annual median price
Annual volume of sales
3,650
Annual median price 5yrs ago
$363,000
QUEENSLAND MARKET MONITOR • MARCH 2021 | ISSUE 49 REPORTING ON THE DECEMBER QUARTER 2020 | 29
Greater Brisbane
HOUSE MARKET (<2400M2) MORETON BAY
Annual
Quarter median price
Annual median price
$481,000 $469,000 5yrs
Annual volume of sales
6,565
Annual median price 5yrs ago
$410,000
HOUSE MARKET (<2400M2) REDLAND
Annual
Quarter median price
Annual median price
$570,000 $545,000 5yrs
Annual volume of sales
2,797
Annual median price 5yrs ago
$487,000
Local sources say the demand for houses is wide ranging, with all buyer types and price points seeing a surge of activity. The statistics show the imbalance between supply and demand. For Greater Brisbane, the annual total listing volume fell a substantial 11% for the year to November 2020, coming in at 43,385. Stock on market was mildly lower for the year dropping from 7.0% in 2019 to 6.1% in 2020. Selling periods also saw a reduction in the median days on market, with a 2020 selling time of 34 days, compared to 45 days in 2019. And, vendor discounting over the 12 months to November also fell from a -3.7% discount in 2019 to a -3.2% discount in 2020. A look across all outer LGA numbers shows all jurisdictions saw tighter numbers in favour of sellers. Outside of the Brisbane LGA, it was Moreton Bay with the lowest days on market at 32, which was a substantial reduction of 13 days on last year’s result. Moreton also saw the tightest vendor discount at 2.8%. Logan had the lowest stock on market in the outer LGA’s at 6.4% and the most dramatic percentage fall in stock numbers, down 10.5% for the year. Unit Market Upon closer inspection, all Greater Brisbane LGAs are positioned within the lower phase of their price cycle – some approaching the bottom and others just past it. This means, as a collective, prices are moving closer to an upswing. Perhaps what’s most telling is that these markets were far more widely spread in the previous quarterly report. For example, Ipswich was past its peak, and while unit prices in this LGA have softened substantially in the year to December 2020 (down 15.0%) they have progressed further through the price cycle thanks to the strength of the current market. While attached housing continues to face challenges, it would appear the improvement in Brisbane’s real estate market as a whole is helping bolster prices across the board, and that includes units. As they say, a rising tide floats all boats. Looking at the December 2020 quarterly data, Ipswich and Moreton saw the best short-term outcomes, while Logan and Redland units lost value. Attached housing markets are traditionally volatile in these outer LGAs, so the quarterly figures can swing more dramatically than they do for houses. The Greater Brisbane region saw its annual unit and townhouse median sale price rise 0.5% to $391,800 across 9,458 transactions to the end of December 2020. The outer LGAs saw mixed results. Ipswich’s annual median had the most dramatic fall, with its 15.0% drop resulting in a $216,000 median across 202 transactions for the year. Logan units stayed flat with a median of $225,000 while Redland saw a solid 5.2% gain. Moreton Bay’s attached housing reversed all its losses as reported in the previous Queensland Market Monitor, posting a 1.6% gain to reach $320,000. Looking at the numbers for the December 2020 quarter only, Logan and Redland were the only jurisdiction reporting a percentage loss of -2.2% and -2.9% respectively. Moreton’s 10.5% median price improvement for the quarter was a standout result. For Greater Brisbane over the year, listings were down a substantial 8.6% while stock on market shortened 0.9 per cent. Drilling down into the metrics and, outside the Brisbane LGA, Ipswich saw the most dramatic fall in total unit listings – down a notable 14.7% for the year. All other jurisdictions revealed a drop in listing numbers of between 2.9% and 7.7%. Stock on market across outer LGAs tightened between 0.3 and 1.0 per cent. The median days on market comparison for outer LGAs saw the greatest retraction in both Redland and Moreton, with both down 19 days. Logan was the only jurisdiction to see vendor discounting increase – up 1.2% for the year. Vacant Land Market Greater Brisbane vacant land sales are reaping the rewards of increased first homebuyer activity, low interest rates and government stimulus, with much of the gains coming in recent months. Local sources tell us the backlog of vacant land sitting on developers’ books has been soaked up and demand from buyers isn’t abating. Demand is strong across large multi-stage estates (e.g. Springfield Lakes) and smaller infill projects alike. Buyers are so eager to secure a site that many lots are reportedly going under contract prior to titling. Unfortunately, the numbers are yet to fully catch up on the increases. The annual vacant land median sale price to December 2020 was $240,000, which was a fall of 0.6%% on last year. However, the December 2020 quarterly median sale price
30 | QUEENSLAND MARKET MONITOR • MARCH 2021 | ISSUE 49 REPORTING ON THE DECEMBER QUARTER 2020
REIQ.com
HOUSE MARKET ALL
HOUSE MARKET ALL
GREATER BRISBANE
IPSWICH
LOGAN
Median days on market
Median days on market
Median days on market
Median vendor discount
Median vendor discount
Median vendor discount
Stock on market
Stock on market
Stock on market
34 Days
-3.2% 6.1% HOUSE MARKET ALL MORETON BAY
Median days on market
32 Days
Median vendor discount
-2.8%
Stock on market
6.7% HOUSE MARKET ALL REDLAND
44 Days
-3.9% 7.0%
45 Days
-3.3% 6.4%
shows some positivity at $234,900, a 2.6% increase on the previous period. Given this was measured across almost 2,000 sales, the outcome has statistical relevance. And, as we progress further into 2021, there’s every indication the annual percentage change in values will flip back into positive territory. Rental Market Local sources tell us that, like sales, demand for rentals is outstripping supply and it’s translating into increased rents. Any decent rental property listing will attract multiple applications, with prospective tenants looking for ways to ensure they stand out from the competition. December 2020 quarter median rental yields across outer Brisbane LGAs ranged from 3.9% (Redland) to 4.8% (Ipswich) for houses, and 4.5% (Moreton) to 6.9% (Logan) for units. These returns have held relatively steady as compared to the previous quarter’s results. Median annual rent for outer-Brisbane, three-bedroom houses ranged from $330 per week in Ipswich to $425 per week in Redland. The same measure for two-bedroom units ranged from $270 per week in Ipswich to $360 per week in Redland. Quarterly rental price movements for housing were generally positive across all outer LGAs. For the three months to December 2020, house rents ranged for $330 per week in Ipswich to $425 per week in Redland. The Greater Brisbane vacancy rate was at 1.8% in the December 2020 quarter. This quarterly figure has remained sub-3.0% in reported data since June 2017, which is indicative of a balanced-to-tight market. Meanwhile, the quarterly vacancy rate for outer LGAs was exceptionally tight. Moreton saw the tightest result at 0.8% while Logan had the highest vacancy at just 1.2%. These figures demonstrate just how strong the demand is for rental property across the region.
Median days on market
33 Days
Median vendor discount
-3.3%
Stock on market
7.5% REIQ.com
QUEENSLAND MARKET MONITOR • MARCH 2021 | ISSUE 49 REPORTING ON THE DECEMBER QUARTER 2020 | 31
Greater Brisbane
HOUSE MARKET ALL
GREATER BRISBANE HOUSE MARKETS
GREATER BRISBANE UNIT MARKETS
December Qtr 2020
December Qtr 2020
STEADY
STEADY
Brisbane
Moreton Bay Redland
RISING
FALLING
RISING
FALLING
RECOVERING
STABILISING
RECOVERING
STABILISING
Logan Ipswich
Brisbane
STEADY
Ipswich Moreton
STEADY
Logan
Redland Source: REIQ. Based on the previous 4 quarters median sale price change and the annual change. Houses < 2400 m2.
Source: REIQ. Based on the previous 4 quarters median sale price change and the annual change.
32 | QUEENSLAND MARKET MONITOR • MARCH 2021 | ISSUE 49 REPORTING ON THE DECEMBER QUARTER 2020
REIQ.com
UNIT MARKET
UNIT MARKET
GREATER BRISBANE
IPSWICH
LOGAN
Annual
Quarter median price
Annual
Annual median price
$410,000 $391,800
Quarter median price
$213,500
5yrs
Annual volume of sales
9,458
$216,000
Quarter median price
$223,000
5yrs
Annual median price 5 yrs ago
$417,850
Looking at the numbers for the December 2020 quarter only, Logan and Redland were the only jurisdiction reporting a percentage loss of -2.2% and -2.9% respectively. Moreton’s 10.5% median price improvement for the quarter was a standout result.
Annual volume of sales
202
Annual median price 5 yrs ago
$306,900
Annual volume of sales
634
UNIT MARKET
MORETON BAY
REDLAND Annual
Quarter median price
$342,500
Annual median price
$320,000
1,276
$355,000
$225,000
Annual median price 5 yrs ago
$250,000
Annual
Quarter median price
Annual median price
$369,000 $375,000
5yrs
Annual median price 5 yrs ago
Annual median price
5yrs
UNIT MARKET
Annual volume of sales
REIQ.com
Annual median price
Annual
5yrs
Annual volume of sales
417
Annual median price 5 yrs ago
$394,500
QUEENSLAND MARKET MONITOR • MARCH 2021 | ISSUE 49 REPORTING ON THE DECEMBER QUARTER 2020 | 33
Greater Brisbane
UNIT MARKET
UNIT MARKET
UNIT MARKET
UNIT MARKET
GREATER BRISBANE
IPSWICH
LOGAN
Greater Brisbane
Median days on market
Median days on market
Median days on market
Median vendor discount
Median vendor discount
Median vendor discount
Stock on market
Stock on market
Stock on market
46 Days
-3.3% 5.8%
90 Days
70 Days
-6.8%
-4.4%
5.1%
UNIT MARKET
6.5%
OUTER BRISBANE HOUSE SALES Jun-20
MORETON BAY
1,674
1,548
1,492
1,348 1,142 837
Median vendor discount
-3.1%
Dec-20 *
1,972
Median days on market
59 Days
Sep-20
1,081
861
92
65 <$350K
$350K+
$500k+
91
$1M+
*Preliminary data Houses<2400m2
OUTER BRISBANE UNIT SALES
Stock on market
Jun-20
7.1%
Sep-20
Dec-20 *
458 389 328
UNIT MARKET
182
REDLAND
103
134 84
57
100 5
Median days on market
50 Days
<$350K
$350K+
-2.5%
$1M+
OUTER BRISBANE LAND SALES Sep-20
Dec-20 *
2,239 1,790
670
Stock on market
6.9%
14
*Preliminary data
Jun-20
Median vendor discount
$500k+
13
142 <$350k
188
74
$350k+
41
72 $500k+
36
9
13
20
$1M+
*Preliminary data
34 | QUEENSLAND MARKET MONITOR • MARCH 2021 | ISSUE 49 REPORTING ON THE DECEMBER QUARTER 2020
REIQ.com
Save time, money and the environment
FREE 30 day * DocuSign trial To claim your free trial 1. Click here to log-in to Realworks 2. Follow the prompts in the notifications section to create a NEW Docusign account 3. Start trialling Docusign on your real estate forms and agreements
Start Free Trial *Free 30 day trial only available to new DocuSign accounts created, offer valid till 30 June 2021
REIQ.com
QUEENSLAND MARKET MONITOR • MARCH 2021 | ISSUE 49 REPORTING ON THE DECEMBER QUARTER 2020 | 35
SALES MARKET - HOUSES <2400m2 SUBURB/ LGA
Greater Brisbane
GREATER BRISBANE GREATER BRISBANE ^ IPSWICH (LGA) IPSWICH (LGA) ^
SALES MARKET - HOUSES <2400m2 (CONT’D)
ANNUAL ANNUAL QTRLY QTRLY ANNUAL ANNUAL MEDIAN MEDIAN QTRLY 1YR 5YR NO. MEDIAN NO. MEDIAN SALE SALE CHANGE CHANGE CHANGE SALES SALE SALES SALE (1YR (5YRS AGO) AGO)
7537 661
$570,000 $666,500
5.8% 3.7%
29971 3207
$544,900 $530,000 $645,000 $630,000
2.8% $479,000 2.4% $550,000
13.8% 17.3%
771
$357,250
2.4%
3262
$355,250 $350,000
1.5% $325,000
9.3%
64
$582,000
-3.0%
245
$575,000 $550,000
4.5% $490,000
17.3%
AUGUSTINE HEIGHTS
28
$620,000
17.1%
100
$555,000 $490,000
13.3% $499,000
11.2%
BELLBIRD PARK
18
$392,000
1.8%
93
$385,000 $380,000
1.3% $333,750
15.4%
SUBURB/ LGA
ANNUAL ANNUAL QTRLY QTRLY ANNUAL ANNUAL MEDIAN MEDIAN QTRLY 1YR 5YR NO. MEDIAN NO. MEDIAN SALE SALE CHANGE CHANGE CHANGE SALES SALE SALES SALE (1YR (5YRS AGO) AGO)
FLAGSTONE
18
$455,000
5.8%
68
$430,000 $395,000
8.9% $390,250
10.2%
FLAGSTONE ^
7
N/A
N/A
34
$546,500 $510,000
7.2% $445,000
22.8%
FORESTDALE ^
6
N/A
N/A
41
$805,000 $726,250
10.8% $732,750
9.9%
GREENBANK ^
11
$653,000
5.2%
76
$630,000 $625,000
0.8% $554,000
13.7%
HERITAGE PARK
16
$470,000
12.2%
73
$460,000 $455,000
1.1% $420,750
9.3%
HILLCREST
21
$400,000
3.4%
66
$389,500 $372,500
4.6% $344,000
13.2%
HOLMVIEW
17
$392,250
6.7%
53
$373,500 $380,000
-1.7% $357,500
4.5%
JIMBOOMBA ^
21
$588,000
-2.0%
90
$595,000 $580,000
2.6% $465,000
28.0%
KINGSTON
33
$290,000
6.2%
127
$295,000 $285,000
3.5% $295,000
0.0%
LOGAN CENTRAL
15
$290,000
7.8%
57
$290,000 $285,100
1.7% $298,000
-2.7%
-0.6% $379,000
4.9%
BOOVAL
16
$289,500
10.1%
55
$290,000 $319,000
-9.1% $279,500
3.8%
LOGAN RESERVE
23
$383,000
N/A
78
$397,500 $400,000
BRASSALL
51
$338,000
1.7%
178
$345,000 $326,500
5.7% $323,500
6.6%
LOGAN VILLAGE
3
N/A
N/A
20
$600,000
N/A
N/A
N/A
N/A
BROOKWATER
19
$875,000
6.7%
66
$825,000 $775,000
6.5%
N/A
LOGAN VILLAGE ^
8
N/A
N/A
38
$665,000 $630,000
5.6%
$513,750
29.4%
BUNDAMBA
34
$322,500
4.0%
111
$309,000 $304,500
1.5% $280,000
10.4%
LOGANHOLME
33
$410,000
-8.9%
115
$410,000 $385,000
6.5% $385,000
6.5%
CAMIRA
18
$432,500
5.5%
76
$442,500 $417,500
6.0% $355,000
24.6%
LOGANLEA
24
$368,500
4.0%
84
$368,000 $355,000
3.7% $340,000
8.2%
CHURCHILL
N/A
5
N/A
N/A
22
$277,500 $270,000
2.8% $243,000
14.2%
MARSDEN
41
$370,000
3.0%
176
$365,000 $368,800
-1.0% $338,000
8.0%
COLLINGWOOD PARK
23
$385,000
16.8%
134
$364,000 $330,000
10.3%
$317,500
14.6%
MEADOWBROOK
12
$502,500
N/A
41
$460,000 $425,000
8.2% $380,000
21.1%
DEEBING HEIGHTS
19
$410,000
0.0%
70
$425,000 $419,500
1.3% $380,000
11.8%
MOUNT WARREN PARK
17
$412,500
14.7%
90
$407,000 $405,000
0.5% $360,000
13.1%
EAST IPSWICH
15
$350,000
44.3%
67
$282,500 $284,500
-0.7% $274,500
2.9%
MUNRUBEN ^
10
$645,000
N/A
34
$615,000 $597,500
2.9% $523,500
17.5%
EASTERN HEIGHTS
23
$361,250
30.9%
84
$345,000 $323,000
6.8% $269,000
28.3%
NEW BEITH ^
11
$677,500
6.7%
59
$645,500 $639,000
1.0% $558,750
15.5%
FLINDERS VIEW
16
$442,500
29.2%
79
$350,000 $380,000
-7.9% $356,000
-1.7%
PARK RIDGE
20
$442,000
0.1%
113
$450,000 $454,500
GAILES
2
N/A
N/A
16
N/A $247,500
N/A $245,000
N/A
REGENTS PARK
42
$412,500
-1.2%
181
$417,000 $410,000
-1.0%
N/A
N/A
1.7% $372,000
12.1%
GOODNA
31
$305,000
14.0%
123
$290,000 $285,000
1.8% $290,000
0.0%
ROCHEDALE SOUTH
55
$540,000
0.2%
203
$535,000 $520,000
2.9% $460,000
16.3%
IPSWICH
6
N/A
N/A
39
$425,000 $330,000
28.8% $301,000
41.2%
SHAILER PARK
48
$585,000
-1.7%
193
$590,000 $550,000
7.3%
14.2%
KARALEE ^
18
$672,000
N/A
58
$611,000 $620,000
-1.5% $510,000
19.8%
SLACKS CREEK
31
$340,000
3.0%
99
$335,000 $331,000
1.2% $320,000
4.7%
LEICHHARDT
17
$245,000
6.1%
74
$235,000 $255,000
-7.8% $220,000
6.8%
SPRINGWOOD
26
$530,000
-0.2%
98
$525,500 $517,500
1.5%
12.6%
$516,500
$466,661
NEWTOWN
10
$432,500
N/A
37
$347,000 $337,500
2.8% $322,000
7.8%
TANAH MERAH
15
$430,000
-8.5%
60
$462,500 $450,000
2.8% $415,000
11.4%
NORTH BOOVAL
10
$270,000
-5.6%
41
$279,000 $262,500
6.3% $279,000
0.0%
UNDERWOOD
22
$615,000
-18.4%
84
$622,500 $575,000
8.3% $500,000
24.5%
NORTH IPSWICH
24
$321,250
-1.2%
95
$300,000 $305,000
-1.6% $269,500
11.3%
WATERFORD
21
$436,500
3.3%
94
$407,500 $375,000
8.7% $394,000
3.4%
ONE MILE
10
$266,000
N/A
35
$255,000 $269,750
-5.5% $235,000
8.5%
WATERFORD WEST
21
$321,875
-3.9%
68
$337,000 $337,500
-0.1% $319,000
5.6%
RACEVIEW
42
$329,500
-4.4%
192
$329,000 $313,250
5.0% $310,000
6.1%
WINDAROO
11
$605,000
39.1%
47
$500,000 $475,000
5.3% $413,000
21.1%
REDBANK
4
N/A
N/A
28
$340,000 $325,000
4.6% $306,000
11.1%
WOODRIDGE
33
$305,000
10.0%
113
$282,500 $280,000
0.9% $292,250
-3.3%
REDBANK PLAINS
79
$330,000
4.3%
308
$320,000 $325,000
-1.5% $315,000
1.6%
YARRABILBA
41 $367,500
-6.4%
139
$376,450 $390,000
-3.5% $391,440
-3.8%
RIPLEY
21
$405,000
8.9%
94
$396,000 $393,650
0.6% $339,000
16.8%
RIVERVIEW
19
$250,000
4.2%
48
$240,000 $240,000
0.0% $233,750
2.7%
ROSEWOOD
11
$270,000
N/A
45
$287,500 $282,500
1.8%
$271,500
5.9%
SADLIERS CROSSING
9
N/A
N/A
28
$358,750
N/A $325,000
10.4%
SILKSTONE
20
$336,000
0.3%
81
$315,000 $307,000
2.6% $278,000
13.3%
SOUTH RIPLEY
22
$497,500
5.9%
70
$471,000 $447,000
5.4%
N/A
N/A
N/A
MORETON BAY (LGA)
1566
$481,000
1.3%
6565
$469,000 $446,000
5.2% $410,000
14.4%
MORETON BAY (LGA) ^
168
$777,500
5.1%
937
$735,250 $682,000
7.8% $600,000
22.5%
ALBANY CREEK
46
$635,500
0.7%
222
$631,801 $610,000
3.6% $560,000
12.8%
ARANA HILLS
26
$583,750
-0.2%
95
$582,500 $555,000
5.0% $495,000
17.7%
SPRINGFIELD
24
$472,500
-4.4%
102
$461,000 $433,000
6.5% $396,564
16.2%
SPRINGFIELD LAKES
BANKSIA BEACH
56
$681,500
4.0%
202
$613,500 $585,000
4.9%
$512,500
19.7%
60
$445,000
-1.7%
296
$435,000 $421,400
3.2% $415,000
4.8%
BEACHMERE
21
$405,000
2.5%
88
$397,500 $368,000
8.0% $315,000
26.2%
TIVOLI
4
N/A
N/A
32
$289,250 $274,000
5.6% $252,500
14.6%
BELLARA
13
$430,000
2.4%
71
$415,000 $400,000
3.8% $319,000
30.1%
WOODEND
4
N/A
N/A
26
$335,000 $405,000
-17.3%
$285,001
17.5%
BELLMERE
30
$375,000
-1.3%
125
$375,000 $347,450
7.9% $340,750
10.1%
YAMANTO
10
$395,000
6.8%
72
$377,500 $396,750
-4.9% $415,000
-9.0%
BONGAREE
37
$518,000
12.7%
150
$492,750 $467,500
5.4% $415,000
18.7%
BRAY PARK
26
$456,000
1.9%
129
$450,000 $440,000
2.3% $388,500
15.8%
LOGAN (LGA)
942
$409,000
3.5%
3650
$403,000 $397,750
1.3% $363,000
11.0%
BURPENGARY
39
$437,500
0.1%
171
$437,500 $430,000
1.7% $390,000
12.2%
LOGAN (LGA) ^
178
$655,000
5.0%
790
$630,000 $615,000
2.4% $530,000
18.9%
BURPENGARY ^
13
$670,000
-0.7%
59
$678,000 $612,250
10.7% $547,500
23.8%
BURPENGARY EAST
24
$490,000
-3.9%
101
$483,500 $487,025
-0.7% $416,000
16.2%
6
N/A
N/A
50
$667,500 $685,500
-2.6% $560,000
19.2%
BAHRS SCRUB
20
$470,000
9.9%
74
$453,250 $435,360
4.1%
$412,250
9.9%
BEENLEIGH
29
$337,000
7.8%
115
$335,000 $330,000
1.5% $305,750
9.6%
BURPENGARY EAST ^
BERRINBA
13
$470,000
6.8%
40
$455,000 $433,000
5.1%
$411,500
10.6%
CABOOLTURE
92
$370,000
8.5%
366
$344,000 $335,000
2.7% $305,000
12.8%
BETHANIA
11
$360,000
-3.7%
60
$356,250 $350,500
1.6% $309,000
15.3%
CABOOLTURE ^
6
N/A
N/A
67
$640,000 $610,000
4.9% $499,000
28.3%
BORONIA HEIGHTS
18
$380,000
4.7%
87
$350,000 $345,000
1.4% $316,000
10.8%
34
$336,250
15.9%
123
$324,000 $307,000
5.5% $270,000
20.0%
BROWNS PLAINS
19
$347,000
1.5%
77
$340,000 $360,046
-5.6% $320,000
6.3%
CABOOLTURE SOUTH
CEDAR GROVE ^
9
N/A
N/A
31
$510,000 $494,000
3.2% $432,500
17.9%
CASHMERE
11
$820,000
N/A
43
$772,000 $720,000
7.2% $607,500
27.1%
CEDAR VALE ^
11
$515,000
N/A
45
$534,000 $500,000
6.8% $462,500
15.5%
CASHMERE ^
7
N/A
N/A
24
$852,500 $822,500
3.6% $722,500
18.0%
CORNUBIA ^
5
N/A
N/A
23 $1,032,000 $817,500
26.2% $745,250
38.5%
14.9%
CORNUBIA
25
$575,000
-3.4%
110
1.3% $495,000
18.7%
CRESTMEAD
46 $337,500
-1.5%
176 $334,000 $321,000
4.0% $310,000
7.7%
DAISY HILL
29 $575,000
19.8%
88
$548,500 $477,000
15.0% $450,000
21.9%
$587,500 $580,000
EAGLEBY
41 $305,000
3.8%
137 $305,000 $298,000
2.3% $275,000
10.9%
EDENS LANDING
26 $427,500
-0.6%
88 $396,000 $375,000
5.6% $330,000
20.0%
CLONTARF
39
$505,000
7.7%
150
$471,000 $450,000
4.7% $410,000
DAKABIN
10
$495,500
13.1%
45
$455,000 $427,500
6.4% $450,000
1.1%
DAYBORO
8
N/A
N/A
29
$520,000 $528,500
-1.6% $400,000
30.0%
DECEPTION BAY
76
$380,000
5.3%
312
$370,000 $360,000
2.8% $325,000
13.8%
EATONS HILL
32 $687,500
12.9%
119 $672,000 $595,000
12.9% $540,000
24.4%
N/A
45 $630,000 $610,000
3.3% $498,000
26.5%
ELIMBAH ^
8
N/A
36 | QUEENSLAND MARKET MONITOR • MARCH 2021 | ISSUE 49 REPORTING ON THE DECEMBER QUARTER 2020
REIQ.com
SUBURB/ LGA
SALES MARKET - HOUSES <2400m2 (CONT’D)
ANNUAL ANNUAL QTRLY QTRLY ANNUAL ANNUAL MEDIAN MEDIAN QTRLY 1YR 5YR NO. MEDIAN NO. MEDIAN SALE SALE CHANGE CHANGE CHANGE SALES SALE SALES SALE (1YR (5YRS AGO) AGO)
SUBURB/ LGA
ANNUAL ANNUAL QTRLY QTRLY ANNUAL ANNUAL MEDIAN MEDIAN QTRLY 1YR 5YR NO. MEDIAN NO. MEDIAN SALE SALE CHANGE CHANGE CHANGE SALES SALE SALES SALE (1YR (5YRS AGO) AGO)
Greater Brisbane
SALES MARKET - HOUSES <2400m2 (CONT’D)
SURROUNDS
EVERTON HILLS
17
$658,750
11.7%
94
$608,000 $577,500
5.3%
$521,525
16.6%
FERNY HILLS
36
$601,500
0.6%
133
$592,000 $567,500
4.3% $499,999
18.4%
LAIDLEY
10
$240,000
1.2%
74
$240,000 $235,000
2.1% $233,750
2.7%
2.4% $435,384
9.8%
LAIDLEY HEIGHTS ^
5
N/A
N/A
24
$329,000 $356,500
-7.7% $273,750
20.2%
1.6% $875,000
21.4%
REGENCY DOWNS ^
12
$334,500
-13.1%
61
$375,000 $362,500
3.4% $315,000
19.0%
SCENIC RIM (LGA)
106
$446,250
19.0%
443
$421,000 $400,000
5.3% $380,000
10.8%
89
$670,000
3.9%
371
$624,750 $592,000
5.5% $522,500
19.6%
-0.4%
GRIFFIN HIGHVALE ^ JOYNER KALLANGUR
38
$511,000
9.0%
151
5
N/A
N/A
36 $1,062,000
$478,000 $467,000 $1,045,000
6
N/A
N/A
36
$578,750 $513,500
73
$427,500
8.2%
334
$405,500 $393,250
12.7% $532,000 3.1%
$361,590
8.8% 12.1%
KIPPA-RING
26
$442,500
1.3%
$443,000 $425,000
4.2% $385,000
15.1%
SCENIC RIM (LGA) ^
LAWNTON
23 $442,000
-0.1%
78 $422,500 $412,000
2.5% $365,000
15.8%
BEAUDESERT
34
$337,500
-4.9%
134
$338,500 $340,000
MANGO HILL
47
$532,000
-1.1%
179
$535,000 $518,000
3.3% $457,500
16.9%
BOONAH
10
$347,500
8.3%
53
$321,500 $325,000
MARGATE
38
$487,500
3.7%
148
$475,535 $456,000
4.3% $400,000
18.9%
KOORALBYN ^
16
$365,000
N/A
49
$365,000 $360,000
1.4% $327,000
11.6%
MORAYFIELD
87
$367,500
-0.4%
323
$360,000 $345,000
4.3% $330,500
8.9%
TAMBORINE ^
16
$720,000
0.7%
65
$720,000 $640,000
12.5% $500,000
44.0%
TAMBORINE MOUNTAIN
44
$638,500
15.6%
171
$560,000 $534,159
4.8% $455,000
23.1%
TAMBORINE MOUNTAIN ^
17 $1,100,000
36.6%
53
$899,000 $820,000
9.6% $748,250
20.1%
SOMERSET (LGA)
63
$276,000
2.2%
263
$262,000 $250,275
4.7% $252,500
3.8%
SOMERSET (LGA) ^
40
$470,000
5.0%
241
$430,000 $410,000
4.9% $378,000
13.8% 13.4%
101
MORAYFIELD ^
17
$680,000
0.7%
77
$675,000 $630,000
7.1% $545,000
23.9%
MURRUMBA DOWNS
39
$500,000
-9.5%
155
$520,000 $510,000
2.0% $484,000
7.4%
NARANGBA
78
$487,000
-1.2%
316
$491,500 $478,000
2.8% $439,250
11.9%
NEWPORT
18
$895,000
45.1%
142
$743,000 $780,000
-4.7% $830,250
-10.5%
NINGI
17
$433,000
11.0%
86
$386,250 $379,500
1.8% $365,250
5.7%
NINGI ^
4
N/A
N/A
41
$630,000 $600,000
5.0% $525,000
20.0%
$321,500
5.3%
-1.1% $282,000
14.0%
NORTH LAKES
95
$500,000
-1.4%
433
$492,000 $485,000
1.4% $460,000
7.0%
ESK
6
N/A
N/A
27
$257,500
N/A
N/A $227,000
PETRIE
35
$500,000
6.0%
132
$467,000 $443,250
5.4% $393,000
18.8%
FERNVALE
9
N/A
N/A
42
$342,500 $335,000
2.2% $335,000
2.2%
REDCLIFFE
31
$500,000
13.6%
128
$462,500 $436,000
6.1%
18.1%
FERNVALE ^
4
N/A
N/A
30
$413,500 $430,000
-3.8% $380,000
8.8%
ROTHWELL
21
$482,500
6.7%
122
$430,000 $416,000
3.4% $395,000
8.9%
KILCOY
11 $329,500
N/A
41
$315,000 $256,250
22.9% $216,500
45.5%
SAMFORD VALLEY ^
9
N/A
N/A
44 $1,170,000 $1,055,000
10.9% $887,000
31.9%
LOWOOD
18 $235,500
4.0%
76 $230,000 $235,000
-2.1% $253,750
-9.4%
TOOGOOLAWAH
11 $277,000
N/A
34
N/A $193,000
33.4%
$391,750
SANDSTONE POINT
19
$500,000
10.7%
76
$465,250 $450,000
3.4% $390,000
19.3%
SCARBOROUGH
43
$620,250
4.5%
160
$590,000 $569,000
3.7% $485,000
21.6%
STRATHPINE
$460,000 $435,000
5.7% $358,500
28.3%
33
$450,000
-4.0%
185
TOORBUL
4
N/A
N/A
19
UPPER CABOOLTURE
18
$392,500
1.4%
60
UPPER CABOOLTURE ^
11
$637,500
N/A
37
$619,900 $599,000
3.5% $538,000
15.2%
WAMURAN ^
8
N/A
N/A
35
$700,000 $640,000
9.4% $555,000
26.1%
42
$557,500
2.3%
203
$540,000 $522,000
3.4% $485,000
11.3%
4
N/A
N/A
25
$369,000 $342,000
7.9% $315,000
17.1%
23 $580,000
-1.7%
74
$551,000 $520,000
6.0% $440,000
25.2%
35 $500,000 $500,000
0.0% $430,000
16.3%
$545,000 $525,000
3.8% $487,000
11.9%
135 $1,019,325 $965,000
5.6% $851,000
19.8%
WARNER WOODFORD
WOODY POINT WOORIM REDLAND (LGA) REDLAND (LGA) ^
9
N/A
N/A
753
$570,000
3.8%
42 $1,022,500
7.3%
2797
N/A
N/A
$383,870 $369,000
N/A
N/A
N/A
4.0% $337,000
13.9%
ALEXANDRA HILLS
81
$513,750
3.8%
264
$490,000 $456,500
7.3% $425,000
15.3%
BIRKDALE
70
$655,000
12.9%
235
$615,500 $563,500
9.2% $508,000
21.2%
CAPALABA
203
$500,000 $475,000
5.3% $435,500
14.8%
29 $1,020,000 $1,077,500
-5.3% $832,500
22.5%
49
$510,000
0.1%
CAPALABA ^
3
N/A
N/A
CLEVELAND
71
$665,000
-10.3%
271
$645,000 $587,500
9.8% $557,500
15.7%
COOCHIEMUDLO ISLAND
13
$350,000
N/A
43
$345,000 $300,000
15.0% $330,000
4.5%
MACLEAY ISLAND
32
$285,000
19.7%
124
$248,500 $230,000
8.0% $230,000
8.0%
MOUNT COTTON
35
$550,000
0.0%
124
$548,500 $530,000
3.5% $480,000
14.3%
ORMISTON
18
$612,750
-27.9%
95
$760,000 $725,000
4.8% $679,750
11.8%
SUBURB/ LGA
GREATER BRISBANE IPSWICH (LGA)
-15.0% $306,900
N/A $299,500
N/A $251,500
N/A
REDBANK PLAINS
5
N/A
N/A
23
$225,000 $334,000
-32.6% $232,000
-3.0% -10.0%
LOGAN (LGA)
168
$223,000
-2.2%
634
$225,000 $225,000
0.0% $250,000
BEENLEIGH
7
N/A
N/A
34
$197,500 $190,000
3.9% $199,500
-1.0%
BROWNS PLAINS
7
N/A
N/A
26
$249,750 $242,000
3.2% $335,950
-25.7%
EAGLEBY
13
$190,000
-16.1%
53
$212,500 $218,500
-2.7% $215,000
-1.2%
LOGAN CENTRAL
3
N/A
N/A
24
$154,000
N/A
N/A $186,000
-17.2%
LOGANLEA
4
N/A
N/A
21
$223,000 $214,000
4.2% $226,500
-1.5%
MARSDEN
11
$262,000
N/A
34
$241,500
N/A
N/A $331,000
-27.0%
MOUNT WARREN PARK
6
N/A
N/A
24
$250,000 $218,500
14.4% $215,000
16.3%
SHAILER PARK
6
N/A
N/A
25
$273,500
N/A
N/A $273,000
0.2%
SLACKS CREEK
7
N/A
N/A
27
$188,500 $192,250
-2.0% $216,500
-12.9%
-1.5% $272,750
-2.3%
SPRINGWOOD
14
$263,500
-4.2%
60
$266,500 $270,675
4
N/A
N/A
21
$377,000
N/A
N/A $360,000
4.7%
1
N/A
N/A
22
$175,000
N/A
N/A $208,750
-16.2%
35
$175,000
-5.4%
84
$167,750 $165,000
1.7% $193,000
-13.1%
$826,250
N/A
N/A
$565,000 $545,000
3.7% $520,000
8.7%
WATERFORD WEST
RUSSELL ISLAND
40
$250,000
20.2%
183
$213,500 $188,500
13.3% $170,000
25.6%
THORNESIDE
20
$610,000
10.3%
57
$583,750 $525,000
11.2% $485,000
20.4% 7.9%
9.7%
288
$593,250 $565,000
5.0% $550,000
241
$545,000 $515,000
5.8% $505,000
7.9%
WELLINGTON POINT
62 $682,750
7.1%
217
$652,500 $637,500
2.4% $569,000
14.7%
-29.6%
$216,000 $254,000
18
34
-3.3%
-6.2%
202
371
$570,675
0.5% $417,850
N/A
N/A
$620,000
$391,800 $390,000
9.5%
5.5%
75
9458
N/A
N/A
72
3.9%
$213,500
$590,000
THORNLANDS
$410,000
4
6
VICTORIA POINT
2443
45
95
N/A
ANNUAL ANNUAL QTRLY QTRLY ANNUAL ANNUAL MEDIAN MEDIAN QTRLY 1YR 5YR NO. MEDIAN NO. MEDIAN SALE SALE CHANGE CHANGE CHANGE SALES SALE SALES SALE (1YR (5YRS AGO) AGO)
BRASSALL
REDLAND BAY
N/A
N/A
SALES MARKET - UNITS & TOWNHOUSES
UNDERWOOD
POINT LOOKOUT
$257,500
WOODRIDGE
SURROUNDS LOCKYER VALLEY (LGA)
43
$250,000
3.3%
227
$250,000 $250,000
0.0% $249,000
0.4%
LOCKYER VALLEY (LGA) ^
100
$419,000
-1.4%
469
$405,000 $395,000
2.5% $360,000
12.5%
23
$250,000
2.0%
105
$260,000 $271,000
-4.1% $259,000
0.4%
8
N/A
N/A
41
$470,000 $460,000
2.2% $365,000
28.8%
GATTON KENSINGTON GROVE ^
REIQ.com
QUEENSLAND MARKET MONITOR • MARCH 2021 | ISSUE 49 REPORTING ON THE DECEMBER QUARTER 2020 | 37
SALES MARKET - UNITS & TOWNHOUSES (CONT’D) SUBURB/ LGA
Greater Brisbane
MORETON BAY (LGA)
SALES MARKET - VACANT LAND <2400m2 (CONT’D)
ANNUAL ANNUAL QTRLY QTRLY ANNUAL ANNUAL MEDIAN MEDIAN QTRLY 1YR 5YR NO. MEDIAN NO. MEDIAN SALE SALE CHANGE CHANGE CHANGE SALES SALE SALES SALE (1YR (5YRS AGO) AGO)
327
$342,500
10.5%
1276
$320,000 $315,000
1.6% $355,000
-9.9%
ALBANY CREEK
1
N/A
N/A
18
N/A $392,500
N/A $417,500
N/A
BELLARA
4
N/A
N/A
31
$352,500 $305,000
15.6% $270,000
BONGAREE
22
$349,000
-4.4%
76
$347,000 $320,000
BRENDALE
21
$269,000
-2.2%
78
$269,500 $262,000
SUBURB/ LGA
ANNUAL ANNUAL QTRLY QTRLY ANNUAL ANNUAL MEDIAN MEDIAN QTRLY 1YR 5YR NO. MEDIAN NO. MEDIAN SALE SALE CHANGE CHANGE CHANGE SALES SALE SALES SALE (1YR (5YRS AGO) AGO)
BAHRS SCRUB
3
N/A
N/A
124
$227,000 $224,000
1.3%
N/A
BELIVAH
0
N/A
N/A
23
$182,500 $179,500
1.7%
N/A
N/A
30.6%
FLAGSTONE
5
N/A
N/A
78
$174,000 $172,000
1.2% $159,950
8.8%
8.4% $317,500
9.3%
GREENBANK
21
$227,000
-3.4%
167
$230,000 $222,000
3.6%
N/A
N/A
2.9% $273,750
-1.6%
HILLCREST
4
N/A
N/A
65
$243,000 $225,000
8.0% $215,000
13.0%
-7.0% $179,250
18.8%
BURPENGARY
5
N/A
N/A
32
$266,750 $253,750
5.1% $321,500
-17.0%
HOLMVIEW
6
N/A
N/A
52
$212,900 $229,000
CABOOLTURE
10
$212,500
21.4%
61
$186,000 $173,000
7.5% $180,000
3.3%
JIMBOOMBA
6
N/A
N/A
33
$189,900
CLONTARF
7
N/A
N/A
32
$366,575 $328,000
11.8% $322,500
13.7%
LOGAN RESERVE
37
$220,000
2.3%
257
N/A
$220,000 $215,000
DECEPTION BAY
16
$258,500
1.9%
56
$252,375 $240,500
4.9% $241,000
4.7%
LOGANHOLME
4
N/A
N/A
33
$261,250
KALLANGUR
14
$253,750
N/A
51
$267,000 $287,500
-7.1% $310,000
-13.9%
LOGANLEA
6
N/A
N/A
24
$232,500 $243,250
N/A
N/A
N/A
N/A
N/A
2.3% $174,000
26.4%
N/A
N/A
-4.4% $205,000
N/A
13.4%
KIPPA-RING
11
$256,000
2.6%
62
$250,000 $256,000
-2.3% $275,000
-9.1%
NEW BEITH
0
N/A
N/A
10
N/A $304,750
N/A
N/A
MANGO HILL
8
N/A
N/A
32
$309,000 $380,000
-18.7% $363,900
-15.1%
NEW BEITH ^
6
N/A
N/A
36
$330,000 $292,500
12.8% $295,000
11.9%
MARGATE
13
$535,000
N/A
38
$429,000 $403,500
6.3% $369,000
16.3%
PARK RIDGE
51
$235,000
3.3%
320
$229,990 $231,500
-0.7% $169,000
36.1%
MORAYFIELD
6
N/A
N/A
34
$233,500 $225,000
3.8% $268,500
-13.0%
SOUTH MACLEAN
4
N/A
N/A
52
$167,500 $165,000
1.5%
N/A
N/A
MURRUMBA DOWNS
8
N/A
N/A
27
$265,000 $275,000
-3.6% $345,000
-23.2%
YARRABILBA
6
N/A
N/A
158
$184,500 $183,000
0.8% $170,375
8.3%
N/A
NORTH LAKES
10
$363,125
N/A
41
$348,000 $364,000
-4.4% $385,800
-9.8%
REDCLIFFE
46
$462,000
17.0%
155
$395,000 $370,000
6.8% $387,500
1.9%
MORETON BAY (LGA)
194
$279,000
2.6%
1955
$265,000 $254,500
4.1% $235,000
12.8%
3
N/A
N/A
18
N/A $387,500
N/A $378,000
N/A
42
$395,000
-21.0%
320
$339,900 $330,000
3.0% $326,000
4.3%
SCARBOROUGH
35
$550,000
6.8%
105
$502,500 $447,500
12.3% $456,975
10.0%
MORETON BAY (LGA) ^
STRATHPINE
10
$307,750
N/A
31
$285,500 $265,715
7.4% $267,500
6.7%
BANKSIA BEACH
7
N/A
N/A
45
$400,000 $495,000
-19.2% $347,500
15.1%
WOODY POINT
21
$495,000
4.3%
74
$416,500 $402,500
3.5% $400,000
4.1%
BELLMERE
1
N/A
N/A
17
N/A $200,000
WOORIM
10
$370,000
5.7%
34
$382,000 $410,000
-6.8% $340,000
12.4%
BRAY PARK
0
N/A
N/A
43
$287,000
BURPENGARY
13
$278,000
-0.4%
87
$270,000 $239,500
107
$369,000
-2.9%
417
$375,000 $356,500
5.2% $394,500
-4.9%
BURPENGARY EAST
15
$248,250
N/A
113
CAPALABA
13
$335,000
-4.3%
65
$340,000 $290,000
17.2% $390,000
-12.8%
CABOOLTURE
8
N/A
N/A
146
CLEVELAND
38
$418,250
-4.8%
143
$420,000 $400,000
5.0% $412,500
1.8%
CABOOLTURE ^
4
N/A
N/A
36
ORMISTON
10
$364,500
N/A
37
$355,000
N/A
N/A $375,000
-5.3%
CABOOLTURE SOUTH
5
N/A
N/A
POINT LOOKOUT
11
$515,000
43.1%
48
$440,000 $470,000
-6.4% $412,500
6.7%
DELANEYS CREEK ^
1
N/A
THORNESIDE
12
$305,000
N/A
32
$310,000 $315,500
-1.7% $321,000
-3.4%
ELIMBAH ^
1
WELLINGTON POINT
5
N/A
N/A
24
$455,000 $440,000
3.4% $454,900
0.0%
GRIFFIN
SANDSTONE POINT
REDLAND (LGA)
SURROUNDS SCENIC RIM (LGA)
11
$202,000
N/A
36
$240,000 $210,000
14.3%
$243,000
-1.2%
SALES MARKET - VACANT LAND <2400m2 SUBURB/ LGA
ANNUAL ANNUAL QTRLY QTRLY ANNUAL ANNUAL MEDIAN MEDIAN QTRLY 1YR 5YR NO. MEDIAN NO. MEDIAN SALE SALE CHANGE CHANGE CHANGE SALES SALE SALES SALE (1YR (5YRS AGO) AGO)
N/A
N/A
N/A
N/A
N/A
12.7% $221,000
22.2%
$248,750 $241,000
3.2% $215,000
15.7%
$224,000 $217,500
3.0% $186,750
19.9%
$316,250 $309,950
2.0% $265,000
19.3%
74
$197,400 $192,250
2.7% $182,200
8.3%
N/A
22
$277,500 $271,500
2.2%
N/A
N/A
N/A
N/A
16
N/A
N/A
N/A
31
$295,000
7.3%
381
$280,000 $283,000
-1.1% $245,000
14.3%
-1.7% $235,000
12.1%
N/A
N/A
$311,500
KALLANGUR
12
$272,000
1.1%
60
$263,500 $268,000
LAWNTON
6
N/A
N/A
52
$269,000
MANGO HILL
4
N/A
N/A
113
$285,000 $295,000
N/A
N/A
N/A
N/A
-3.4% $260,000
9.6% 17.0%
MORAYFIELD
21
$210,000
0.0%
151
$213,000 $185,000
15.1% $182,000
MURRUMBA DOWNS
0
N/A
N/A
21
$305,500 $315,000
-3.0%
NARANGBA
7
N/A
N/A
92
NEWPORT
35
$337,900
8.3%
4
N/A
N/A
NINGI
N/A
N/A
N/A
$261,000 $257,500
1.4% $213,500
22.2%
200
$321,400 $324,900
-1.1%
N/A
N/A
49
$249,000 $228,500
9.0% $199,500
24.8%
ROTHWELL
2
N/A
N/A
64
$245,900 $233,900
5.1%
N/A
STRATHPINE
0
N/A
N/A
54
$293,000
N/A
N/A
N/A
UPPER CABOOLTURE
6
N/A
N/A
49
$208,000 $185,500
12.1% $242,500
-14.2%
UPPER CABOOLTURE ^
2
N/A
N/A
43
$310,000
N/A
N/A
N/A
GREATER BRISBANE
897
$234,900
2.6%
7440
$238,500 $240,000
-0.6% $219,925
8.4%
GREATER BRISBANE ^
181
$375,000
2.7%
998
$325,000 $315,000
3.2% $270,000
20.4%
IPSWICH (LGA)
104
$215,000
-0.7%
1320
$213,000 $208,000
2.4% $185,000
15.1%
REDLAND (LGA)
245
$35,000
6.1%
1154
$35,000
$31,000
24
$335,000
-6.9%
167
$335,000 $325,000
3.1% $250,000
34.0%
RELAND (LGA) ^
3
N/A
N/A
20
$650,000
N/A
N/A
N/A
N/A
19
$26,000
-18.1%
43
$25,000
N/A
N/A
N/A
N/A
68
$38,750
10.7%
217
$35,000
$30,000
16.7%
$32,000
9.4%
9
N/A
N/A
55
9.1% $295,000
13.6%
118
$28,000
16.7%
582
$24,000
$18,125
32.4%
5
N/A
N/A
122
$312,000 $305,000
2.3% $303,000
3.0%
IPSWICH (LGA) ^
N/A
N/A
N/A
12.9% $260,000
-86.5%
BELLBIRD PARK
12
$249,500
9.0%
121
$237,000 $233,000
1.7% $223,000
6.3%
LAMB ISLAND
BRASSALL
5
N/A
N/A
43
$192,500 $196,000
-1.8% $180,000
6.9%
MACLEAY ISLAND
COLLINGWOOD PARK
3
N/A
N/A
79
$199,000 $199,000
0.0%
N/A
N/A
REDLAND BAY
DEEBING HEIGHTS
6
N/A
N/A
68
$205,900 $184,900
11.4%
$181,500
13.4%
RUSSELL ISLAND
KARALEE ^
5
N/A
N/A
82
$338,000 $325,000
4.0% $265,000
27.5%
THORNLANDS
REDBANK
5
N/A
N/A
20
$210,000 $169,000
24.3%
REDBANK PLAINS
6
N/A
N/A
100
$195,000 $200,000
-2.5% $164,500
18.5%
SURROUNDS
RIPLEY
7
N/A
N/A
203
$215,000 $215,000
0.0% $172,000
25.0%
LOCKYER VALLEY (LGA)
24
$98,500
-28.4%
78
$135,000 $128,000
5.5% $123,000
9.8%
SOUTH RIPLEY
5
N/A
N/A
106
$215,750 $206,100
4.7% $185,000
16.6%
SPRINGFIELD
1
N/A
N/A
37
$279,700 $280,756
N/A
LOCKYER VALLEY (LGA) ^
55
$160,000
-15.8%
212
$180,000 $170,000
5.9% $145,000
24.1%
N/A
PLAINLAND
1
N/A
N/A
28
$144,500
SCENIC RIM (LGA)
14
$314,000
2.3%
72
SCENIC RIM (LGA) ^
19
$320,000
-12.3%
0
N/A
N/A
SOMERSET (LGA)
14
$150,000
SOMERSET (LGA) ^
17
$270,000
SPRING MOUNTAIN WALLOON LOGAN (LGA) LOGAN (LGA) ^
27 7
$234,500 N/A
2.2% N/A
361 41
$232,000 $240,000 $166,500 $172,000
-0.4% -3.3% -3.2%
N/A
N/A N/A N/A
$335,000 $307,000 $20,000
20.0%
N/A
N/A
185
$229,900
1.7%
1585
$223,900 $224,000
0.0% $183,880
21.8%
25
$395,000
3.9%
162
$330,000 $300,000
10.0% $270,000
22.2%
WOODHILL ^
38 | QUEENSLAND MARKET MONITOR • MARCH 2021 | ISSUE 49 REPORTING ON THE DECEMBER QUARTER 2020
N/A
N/A
N/A
N/A
$220,000 $205,000
7.3% $184,000
19.6%
110
$305,000 $340,000
-10.3% $285,000
7.0%
24
$289,450 $279,250
3.7% $245,000
18.1%
36.4%
59
$140,000 $110,450
26.8% $144,000
-2.8%
12.5%
78
$230,000 $218,750
5.1% $195,000
17.9%
REIQ.com
RENTAL MARKET - 3 BED HOUSES
RENTAL MARKET - 3 BED HOUSES (CONT’D)
DEC-20 LOCALITY L
$/ WEEK
DEC-19
NEW BONDS
$/ WEEK
DEC-15
NEW BONDS
$/ WEEK
NEW BONDS
IPSWICH CITY
$330
638
$315
715
$300
735
4300
Goodna/ Bellbird Pk/ Camira/ Springfield
$365
153
$355
161
$346
189
4301
Redbank/ Redbank Plns/ Collingwood Pk
$330
107
$320
127
$315
112
4303
Dinmore/ Riverview
$288
18
$270
17
$280
24
4304
Booval/ Blackstone/ Bundamba/ Ebbw Vale/ Silkstone
$320
58
$300
83
$285
97
4305
Ipswich/ Brassall/ Bremer/ Churchill/ Flinders View/ Leichardt/ Raceview/ Tivoli/ Yamanto
$315
213
$300
226
$285
252
4306
Amberley/ Fernvale/ Karana Downs/ Mt Crosby/ Peak Crossing/ Swanbank/ Willowbank
$360
70
$345
65
$335
38
4314
4340
Gilla/ Avoca Vale/ Benarkin/ Bernakin North/ Blackbutt/ Blackbutt North/ Blackbutt South/ Cherry Creek/ Colinton/ Googa Creek/ Harlin/ Linville/ Moore/ Mount Binga/ Mount Stanley/ Nukku/ Taromeo/ Teelah
$270
Rosewood/ Ashwell/ Calvert/ Ebenezer/ Grandchester/ Moorang/ Mt Forbes/ Rosevale
$300
8
9
$255
$313
6
26
N/A
$290
N/A
20
LOGAN CITY
$355
857
$350
1079
$345
926
4114
Kingston/ Logan City/ Trinder Pk/ Woodridge
$325
125
$318
168
$320
157
4118
Browns Plains/Brownsleigh/ Forestdale/ Heritage Pk/ Hillcrest/ Regents Pk
$360
69
$350
85
$350
112
4119
Underwood
$400
13
$395
15
$380
15
4123
Priests Gully/ Rochedale
$420
45
$403
56
$390
53
4124
Boronia Hts/ Greenbank/ New Beith
$360
35
$350
50
$340
48
4125
Munruben/ Park Ridge
$350
44
$340
15
N/A
3
4127
Chatswood Hills/ Daisy Hill/ Preistdale/ Slacks Ck/ Springwood
$395
76
$370
96
$370
81
POST CODE
DEC-20 $/ WEEK
LOCALITY L
DEC-19
NEW BONDS
$/ WEEK
DEC-15
NEW BONDS
$/ WEEK
NEW BONDS
Caboolture/ Beachmere/ Donnybrook/ Balingool/ Bellmere/ Meledale/ Moodlu/ Rocksberg/ Toorbul
$338
126
$320
129
$300
130
4511
Godwin Beach/ Ningi/ Sandstone Pt/ Toorbul Pt
$393
12
$388
18
$350
16
4514
Woodford/ Bellthorpe/ Bracalba/ Cedarton/ D'Aguilar/ Delaneys Ck/ Neurum/ Stanmore/ Stoney Ck/ Villeneuve
N/A
3
$350
17
$330
11
REDLAND CITY
$425
231
$400
302
$390
298
4157
Capalaba/ Sheldon
$440
31
$420
39
$382
26
4158
Thornside
N/A
3
$420
10
$400
7
4159
Birkdale/ Aquatic Paradise/ Meridian Pt
$440
14
$410
28
$400
23 28
4510
4160
Ormiston/ Wellington Pt/ Erobin
$450
23
$435
26
$380
4161
Alexandra Hills/ Burwood Hts
$440
32
$410
37
$395
53
4163
Cleveland/ Raby Bay
$430
22
$420
30
$400
32
4164
Thornlands/ Pinklands
$445
12
$425
19
$420
14
4165
Mt Cotton/ Pt Halloran/ Pt Talburpin/ Redland Bay/ Victoria Pt
$445
44
$413
50
$400
59
4183
Amity Pt/ Dunwich/ Pt Lookout
N/A
4
$390
6
$370
7
4184
Coochiemudlo Is/ Karragarra Is/ Lamb Is/ Macleay Is/ Peel Is/ Russell Is
$293
46
$275
57
$250
49
LOCKYER VALLEY REGIONAL
$320
60
$300
76
$295
67 30
4341
Blenheim
$345
20
$290
21
$280
4342
Crowley Vale
$300
10
$310
9
$300
7
4343
Adare
$318
22
$300
39
$300
27
SOMERSET REGIONAL
$325
47
$320
51
$265
50
4311
Atkinsons Dam
$290
11
$300
16
$285
22
4312
Bryden
N/A
4
$280
6
$250
5
4128
Kimberley Pk/ Logan Hyperdome/ Shailer Pk/ Tanah Merah
$430
20
$398
40
$380
29
4129
Logandale/ Loganholme
$398
18
$390
22
$360
30
4313
Biarra
$295
10
$260
9
$250
7
4515
Glenfern
$375
22
$350
20
$275
16
4130
Carbrook/ Cornubia
$410
8
$403
14
$400
13
4131
Loganlea/ Meadowbrook
$358
46
$350
58
$340
40
4132
Crestmead/ Marsden
$350
93
$340
107
$330
94
4133
Chambers Flat/ Logan Reserve/ Waterford
$365
46
$350
52
$360
33
4205
Bethania
$350
23
$338
32
$340
19
4207
Beenleigh/Eaglby/Mt Warren Pk
$350
170
$340
239
$335
167
4280
Flagstone/ Jimboomba/ North Maclean/ South Maclean/ Stockleigh
$380
25
$360
27
$395
29
MORETON BAY REGIONAL
$380
906
$370
1145
$350
989
Redcliffe Region
$400
142
$380
221
$360
216
4019
Clontarf/ Humpybong/ Margate/ Scotts Pt/ Woody Pt
$390
51
$380
80
$360
98
4020
Redcliffe/ Scarborough/ Newport Waters/ Suttons Bch
$408
46
$400
85
$360
68
4021
Kippa-Ring
$380
25
$380
39
$350
39
4022
Rothwell
$410
20
$375
17
$380
11
Pine Rivers Region
$400
374
$390
460
$370
369
4035
Albany Ck/ Bridgeman Downs/ Cashs Crossing
$480
21
$475
27
$395
22
4037
Eatons Hill
N/A
2
N/A
3
N/A
4
4055
Bunya/ Ferny Grove/ Ferny Hills/ Kedron Upper
$463
34
$450
32
$430
31
4500
Bray Pk/ Brendale/ Cashmere/ Clear Mountain/ Joyner/ Strathpine/ Warner
$393
92
$390
103
$370
71
4501
Lawnton
$375
21
$360
28
$350
24
4502
Frenchs Forest/ Petrie
$393
22
$380
40
$350
13
4503
Dakabin/ Dohles Rocks/ Griffin/ Kallangur/ Kurwongbah
$375
101
$370
124
$350
103
4509
Mango Hill
$410
70
$400
88
$385
87
4520
Camp Mountain/ Cedar Ck/ Mt Glorious/ Mt Nebo/ Mt Samson/ Samford/ Yugar
$480
6
$500
10
$500
6
4521
Dayboro/ Mt Mee/ Mt Pleasant/ Ocean View/ Rush Ck
$465
5
$430
5
$355
8
Caboolture Region
$350
390
$340
464
$320
404
4504
Narangba
$400
29
$375
33
$350
24 25
4505
Burpengary
$400
43
$355
40
$330
4506
Morayfield/ Moorina
$340
49
$325
71
$315
55
4507
Banksia Beach/ Bellara/ Bongaree/ Bribie Is/ Woorim
$418
40
$385
57
$350
42
4508
Deception Bay
$335
80
$325
93
$320
92
REIQ.com
RENTAL MARKET GREATER BRISBANE
FOR RENT
Vacancy Rates
1.8%
RENTAL MARKET IPSWICH
FOR RENT
Vacancy Rates
1.0%
House Yields
4.8% Unit Yields
6.6%
QUEENSLAND MARKET MONITOR • MARCH 2021 | ISSUE 49 REPORTING ON THE DECEMBER QUARTER 2020 | 39
Greater Brisbane
POST CODE
RENTAL MARKET - 2 BED UNITS POST CODE
4300
RENTAL MARKET - 2 BED UNITS (CONT’D)
DEC-20 LOCALITY
L
$/ WEEK
DEC-19
NEW BONDS
$/ WEEK
DEC-15
NEW BONDS
$/ WEEK
POST CODE
NEW BONDS
IPSWICH CITY
$270
127
$263
165
$260
206
Goodna/ Bellbird Pk/ Camira/ Springfield
$275
32
$283
30
$270
44
Greater Brisbane
4301
Redbank/ Redbank Plns/ Collingwood Pk
$260
17
$270
23
$270
26
4304
Booval/ Blackstone/ Bundamba/ Ebbw Vale/ Silkstone
$260
23
$257
25
$255
31
4305
Ipswich/ Brassall/ Bremer/ Churchill/ Flinders View/ Leichardt/ Raceview/ Tivoli/ Yamanto etc
$270
44
$260
72
$250
96
4306
Amberley/ Fernvale/ Karana Downs/ Mt Crosby/ Peak Crossing/ Swanbank/ Willowbank etc
$275
4340
Ashwell/ Calvert/ Ebenezer/ Grandchester/ Lanefield/ Lower Mount Walker/ Merryvale/ Moorang/ Mount Forbes/ Mount Mort/ Mount Walker/ Mount Walker West/ Rosevale/ Rosewood/ Tallegalla/ The Bluff/ Woolshed
LOCALITY
LOCKYER VALLEY REGIONAL
4341
Blenheim/ Hatton Vale/ Kensington Grove/ Kentville/ Laidley/ Laidley Creek West/ Laidley Heights/ Laidley North/ Laidley South/ Mount Berryman, Mulgowie/ Plainland/ Regency Downs/ Summerhold/ Thornton/ Townson
4343
Adare
$/ WEEK
DEC-19
NEW BONDS
$/ WEEK
DEC-15
NEW BONDS
$/ WEEK
NEW BONDS
$263
14
$258
28
$218
14
N/A
1
$260
5
N/A
2
$263
12
$260
21
$235
8
RENTAL MARKET - 3 BED TOWNHOUSES
N/A
9
2
$270
N/A
14
1
$265
N/A
7
N/A
LOGAN CITY
$295
318
$285
339
$270
181
4114
Kingston/ Logan City/ Trinder Pk/ Woodridge
$255
50
$250
68
$260
67
4118
Browns Plains/ Forestdale/ Heritage Park/ Hillcrest/ Regents Park
$305
15
$300
13
N/A
3
4123
Priests Gully/ Rochedale South
$320
12
N/A
2
$295
6
4124
Boronia Heights/ Greenbank/ Lyons/ New Beith
$298
6
$295
5
N/A
N/A
4125
Munruben/ Park Ridge/ Park Ridge South
$300
26
$288
20
N/A
N/A
4127
Chatswood Hills/ Daisy Hill/ Preistdale/ Slacks Ck/ Springwood
$320
19
$335
19
$280
17
4128
Kimberley Pk/ Logan Hyperdome/ Shailer Pk/ Tanah Merah
$300
5
$313
8
$310
7
4129
Loganholme
$325
6
N/A
3
N/A
N/A
4131
Loganlea/ Meadowbrook
$300
18
$300
28
$280
5
4132
Crestmead/ Marsden
$293
20
$290
25
$290
11
4133
Chambers Flat/ Logan Reserve/ Waterford
$295
33
$280
36
$290
7
4205
Bethania
N/A
3
N/A
1
N/A
1
4207
Beenleigh/Eaglby/Mt Warren Pk
$295
97
$290
104
$260
55
4280
Flagstone/ Jimboomba/ North Maclean/ South Maclean/ Stockleigh
4019
DEC-20 L
$290
5
N/A
4
N/A
2
MORETON BAY REGIONAL
$295
432
$290
528
$280
452
Redcliffe Region
$309
123
$310
174
$291
145
Clontarf/ Humpybong/ Margate/ Scotts Pt/ Woody Pt
$300
51
$300
82
$270
63
POST CODE
DEC-20 LOCALITY L
$/ WEEK
DEC-19
NEW BONDS
$/ WEEK
DEC-15
NEW BONDS
$/ WEEK
NEW BONDS
IPSWICH CITY
$330
201
$320
234
$315
154
4300
Goodna/ Bellbird Pk/ Camira/ Springfield
$380
54
$350
64
$370
60
4301
Redbank/ Redbank Plns/ Collingwood Pk
$333
60
$330
75
$320
25
4303
Dinmore/ Riverview
$310
18
$305
23
N/A
0
4304
Booval/ Blackstone/ Bundamba/ Ebbw Vale/ Silkstone
$300
37
$290
32
$300
46
4305
Ipswich/ Brassall/ Bremer/ Churchill/ Flinders View/ Leichardt/ Raceview/ Tivoli/ Yamanto
$330
23
$310
32
$300
22
LOGAN CITY
$340
354
$330
445
$340
393
4114
Kingston/ Logan City/ Trinder Pk/ Woodridge
$320
34
$300
32
$315
32
4117
Berrinba/ Karawatha
$328
8
$320
6
N/A
1
4118
Browns Plains/Brownsleigh/ Forestdale/ Heritage Pk/ Hillcrest/ Regents Pk
$345
48
$340
58
$350
60
4119
Underwood
$333
12
$380
20
$410
17
4123
Priests Gully/ Rochedale
$500
5
$350
15
N/A
4
4124
Boronia Hts/ Greenbank/ New Beith
$350
7
$340
5
$345
15
4127
Chatswood Hills/ Daisy Hill/ Preistdale/ Slacks Ck/ Springwood
$323
26
$343
36
$330
37
4128
Kimberley Pk/ Logan Hyperdome/ Shailer Pk/ Tanah Merah
N/A
4
$390
14
$340
12
4131
Loganlea/ Meadowbrook
$350
22
$350
31
$350
36
4132
Crestmead/ Marsden
$345
43
$328
54
$340
57
4133
Chambers Flat/ Logan Reserve/ Waterford
$335
21
$312
25
$325
24
4205
Bethania
$345
21
$325
27
$340
12
4207
Beenleigh/Eaglby/Mt Warren Pk
$335
78
$330
80
$320
80
MORETON BAY REGIONAL
$360
734
$350
811
$340
583
Caboolture Region
$340
178
$335
206
$315
128
4020
Redcliffe/ Scarborough/ Newport Waters/ Suttons Bch
$330
60
$315
84
$310
73
4504
Narangba
$395
15
$365
8
$350
11
4021
Kippa-ring
$295
8
$300
8
$280
9
4505
Burpengary
$345
37
$345
65
$315
34
Pine Rivers Region
$300
110
$298
142
$290
115
4506
Morayfield/ Moorina
$340
64
$330
53
$315
13
4055
Bunya/ Ferny Grove/ Ferny Hills/ Upper Kedron
N/A
1
N/A
1
N/A
3
Bray Pk/ Brendale/ Cashmere/ Clear Mountain/ Joyner/ Strathpine/ Warner
4507
N/A
3
$355
9
$320
9
4500
$300
16
$295
16
$290
33
Banksia Beach/ Bellara/ Bongaree/ Bribie Is/ Woorim
4508
Deception Bay
$325
24
$320
23
$315
41
4501
Lawnton
$295
9
$300
16
$290
7
4502
Frenchs Forest/ Petrie
$295
15
$310
8
N/A
3
4510
$333
32
$330
47
$290
17
4503
Dakabin/ Dohles Rocks/ Griffin/ Kallangur/ Kurwongbah
Caboolture/ Beachmere/ Donnybrook/ Balingool/ Bellmere/ Meledale/ Moodlu/ Rocksberg/ Toorbul
$290
38
$290
59
$280
48
4511
4509
Mango Hill
$340
26
$335
35
$325
16
Caboolture Region
$290
199
$280
212
$260
192
4504
Narangba
N/A
2
N/A
2
N/A
1
4505
Burpengary
$283
16
$285
9
$265
6
4506
Morayfield/ Moorina
$290
45
$278
38
$260
22
4507
Banksia Beach/ Bellara/ Bongaree/ Bribie Is/ Woorim
$335
35
$310
53
$280
42
4508
Deception Bay
$330
11
$310
20
$290
12
4510
Caboolture/ Beachmere/ Donnybrook/ Balingool/ Bellmere/ Meledale/ Moodlu/ Rocksberg/ Toorbul
$280
83
$270
82
$260
104
REDLAND CITY
$360
67
$351
85
$340
75
4157
Capalaba/ Sheldon
$365
12
$350
13
$345
17
4158
Thornside
$333
6
N/A
3
N/A
3
4160
Ormiston/ Wellington Pt/ Erobin
N/A
4
$340
5
N/A
4
4161
Alexandra Hills
$355
9
$350
19
N/A
4
4163
Cleveland/ Raby Bay
$380
26
$410
26
$340
36
4165
Mount Cotton/ Redland Bay/ Victoria Point/ Victoria Point West
$335
5
$393
10
N/A
3
N/A
3
N/A
1
N/A
3
Pine Rivers Region
$365
516
$355
542
$350
383
4035
Albany Ck/ Bridgeman Downs/ Cashs Crossing
$470
75
$430
54
$385
20
4500
Bray Pk/ Brendale/ Cashmere/ Clear Mountain/ Joyner/ Strathpine/ Warner
$368
72
$360
81
$340
51
4501
Lawnton
$350
18
$345
25
$345
11
4502
Frenchs Forest/ Petrie
N/A
4
$335
18
$340
17
4503
Dakabin/ Dohles Rocks/ Griffin/ Kallangur/ Kurwongbah
$360
229
$350
238
$345
157
4509
Mango Hill
$365
117
$360
121
$355
124
Redcliffe Region
$350
40
$345
63
$335
72
4019
Clontarf/ Humpybong/ Margate/ Scotts Pt/ Woody Pt
$375
9
$380
11
$350
12
4020
Redcliffe/ Scarborough/ Newport Waters/ Suttons Bch
$453
12
$370
20
$385
18
4021
Godwin Beach/ Ningi/ Sandstone Pt/ Toorbul Pt
Kippa-Ring
$343
18
$328
30
$330
38
REDLAND CITY
$410
172
$405
194
$400
178
4157
Capalaba/ Sheldon
$398
12
$420
29
$380
20
4158
Thornside
$395
8
$380
11
$380
16
4159
Birkdale
$430
5
$403
10
$400
6
4160
Ormiston/ Wellington Pt/ Erobin
$438
28
$440
29
$415
27
4163
Cleveland/ Raby Bay
$435
23
$415
28
$415
49
4164
Thornlands/ Pinklands
$413
70
$400
52
$395
40
4165
Mt Cotton/ Pt Halloran/ Pt Talburpin/ Redland Bay/ Victoria Pt
$410
19
$410
29
$400
15
40 | QUEENSLAND MARKET MONITOR • MARCH 2021 | ISSUE 49 REPORTING ON THE DECEMBER QUARTER 2020
REIQ.com
RENTAL MARKET
RENTAL MARKET
RENTAL MARKET
LOGAN
MORETON BAY
REDLAND
FOR RENT
Vacancy Rates
1.2%
Vacancy Rates
0.8%
FOR RENT
Vacancy Rates
0.7%
House Yields
House Yields
House Yields
Unit Yields
Unit Yields
Unit Yields
4.5% 6.9%
REIQ.com
FOR RENT
4.1% 4.5%
3.9% 5.1%
QUEENSLAND MARKET MONITOR • MARCH 2021 | ISSUE 49 REPORTING ON THE DECEMBER QUARTER 2020 | 41
Brisbane LGA EMPLOYMENT MARKET
EMPLOYMENT MARKET
EMPLOYMENT MARKET
BRISBANE - EAST
BRISBANE - NORTH
BRISBANE - SOUTH
Unemployment Rate
Unemployment Rate
Unemployment Rate
Participation Rate
Participation Rate
Participation Rate
5.5%
71.1% EMPLOYMENT MARKET BRISBANE - WEST
Unemployment Rate
5.5%
Participation Rate
60.0%
“The main problem we have at the moment is lack of stock. There’s not as much coming to the market and the level of enquiries isn’t slowing down, so it’s busy out there,” said REIQ Brisbane South Zone Chair, Rebecca Herbst.
5.0%
74.1%
6.4%
68.4%
Brisbane LGA: From Hard Predictions to Hot Property Price Records Brisbane’s property market stakeholders travelled anxiously through the start of 2020 chiefly because the uncertainty delivered by COVID-19 was expected to hit real estate prices hard. It was thought owners might sell off assets to buffer against potential unemployment, and that tenants could find themselves unable to pay rent. Fast forward to the end of 2020, and the market feels like it’s turned 180 degrees. A mix of factors such as historic low interest rates, government subsidies and support and general positivity, as measured via consumer confidence, has resulted in a market that’s now geared firmly toward sellers. “The main problem we have at the moment is lack of stock. There’s not as much coming to the market and the level of enquiries isn’t slowing down, so it’s busy out there,” said REIQ Brisbane South Zone Chair, Rebecca Herbst, adding that there’s one particular purchasing cohort she’s seen more of in recent months. “Older buyers who want to be in close proximity to services and facilities are picking up in the market again. During the pandemic it was 25 to 35-year-olds who were more active. We’re also still seeing a steady stream of enquiry from Sydney and some from Melbourne too.” Of course, the stars are aligning in terms of infrastructure and the local economy. Major projects such as Queens Wharf and Cross River Rail are just some of the ventures set to reshape the city – and the flow-on benefits in terms of employment and spending are being welcomed. In short, among the eastern seaboard capitals, Brisbane and its property are viewed as a hot prospect in 2021 by many stakeholders, and the data provides no evidence to the contrary. House Market <2400m2 Local industry sources said detached housing leads the market. Brisbane buyers do, traditionally, prefer houses over units, and they’ve been in hot demand of late. Established homes in near-city suburbs are always desirable, but in the current market they’re going under contract straight after their first open home. Reports are that most selling agents have been advertising houses with “offers over” listing prices to test buyer’s upper limits. This is a sure sign of a strong Brisbane market where each new sale re-benchmarks values. Analysis of quarterly and annual median price movements indicates Brisbane housing has remained in the rising phase of the price cycle. The median house price
42 | QUEENSLAND MARKET MONITOR • MARCH 2021 | ISSUE 49 REPORTING ON THE DECEMBER QUARTER 2020
REIQ.com
EMPLOYMENT MARKET BRISBANE - INNER CITY Unemployment Rate
4.4%
Participation Rate
74.0%
HOUSE MARKET (<2400M2) BRISBANE
Annual
Quarter median price
Annual median price
$752,222 $725,000 5yrs
Annual volume of sales
13,085
Annual median price 5yrs ago
$615,000
HOUSE MARKET ALL Median days on market
28 Days Median vendor discount
-3.0%
Stock on market
5.3% REIQ.com
rose a very substantial 4.5% in the December 2020 quarter to record a result of $752,222 across 3,369 transactions. On an annual basis, the detached house median price rose 5.8% to reach a new record high of $725,000 across 13,085 transactions. Tight supply and rising demand toward the end of 2020 is evident in the listing numbers too. Total annual listing numbers to November 2020 were 16,591 which is a notable fall of 13.2% compared to last year’s figure of 19,114 listings. Median days on market dropped too. For the year to November 2020, the result was 28 days whereas at the same time last year it was 38 days. Median vendor discounting again demonstrated the swing toward sellers. The figure was -3.0% for the year to November 2020 as compared to -3.6% for the year to November 2019. Unit and Townhouse Market Attached housing continues to be a tale of two markets, however the good news is that the investment-unit oversupply issues of 2017 appear to be a thing of the past. According to local contacts, things began turning around just prior to the pandemic, as new unit construction slowed, and extra stock was absorbed. While the pandemic stifled the recovery, particularly for one-bedroom apartments during early 2020, some demand has returned. In addition, owner-occupier style apartments and townhouses remain keenly sought after. Median price movements indicate unit values have passed through the bottom of their price cycle and are now in the recovering phase of their market. Unit and townhouse prices rose by 4.3% in the December 2020 quarter, recording a median of $438,000 across 1,787 transactions. Over the past year, the annual median unit
QUEENSLAND MARKET MONITOR • MARCH 2021 | ISSUE 49 REPORTING ON THE DECEMBER QUARTER 2020 | 43
Brisbane LGA
price remained flat, coming in at $420,000 across 6,894 transactions.
UNIT MARKET Annual
Quarter median price
Annual median price
$438,000 $420,000 5yrs
Annual volume of sales
Annual median price 5 yrs ago
6,894
$450,000
UNIT MARKET Median days on market
40 Days Median vendor discount
The statistics tracking stock levels and demand also demonstrated a move toward sellers. Listing numbers over the year to November 2020 were 10,120 which was a 9.9% fall on the 2019 figure. Stock on market also fell, coming in at 5.5% for the year to November 2020 as compared to 6.2% in 2019. Median days on market dropped by 11 to reach 40 days to November 2020, while the median vendor discount fell by -0.5% to reach -3.2% in 2020. Vacant Land Market Demand for vacant land throughout the Brisbane LGA has been strong. Spurred on by government stimulus and the rise in first homeowners, construction activity has continued to ramp up. Within the bounds of the Brisbane LGA, however, there are few large-scale subdivision projects with most developments sitting in established growth corridors outside the city’s borders. The majority of Brisbane’s vacant land is infill and small-scale development. For Brisbane itself, vacant land recorded a median sale price of $462,000 in the December 2020 quarter, which is an impressive 10.8% increase on last quarter’s figure. On an annual basis, the median reached $405,000 which is a mild 0.1% softening in price for the year to December 2020. Rental Market Demand for rentals remains buoyant, with property managers reporting rising rents and multiple applications on most listings. Brisbane’s overall rental vacancy rate came in at 2.4% for the December 2020 quarter, which indicates a balanced market. The Brisbane LGA three-bedroom house median was $460 per week for the year to December 2020, which was $15 per week more than in 2019. Two-bedroom units saw a $5-per-week rise in median rent during the year to come in at $425 per week. Median rent in the Brisbane LGA for a three-bedroom townhouse rose $10 per week over the year, coming in at $430 per week for the year to December 2020. The detached housing gross rental yield of 3.2%for the December 2020 quarter was identical to the previous quarter’s figure. Units in the Brisbane LGA saw their median gross yield fall to 5.0% in the December 2020 quarter which was 0.3% less than the previous quarter. This is indicative of the increasing value of attached housing after a long period of price stagnation.
-3.2%
Stock on market
5.5% RENTAL MARKET
FOR RENT
Vacancy Rates
2.4%
44 | QUEENSLAND MARKET MONITOR • MARCH 2021 | ISSUE 49 REPORTING ON THE DECEMBER QUARTER 2020
REIQ.com
SUBURB/LGA
BRISBANE (LGA) BRISBANE (LGA) ^
SALES MARKET - HOUSES <2400m2 (CONT’D)
ANNUAL ANNUAL QTRLY QTRLY ANNUAL ANNUAL MEDIAN MEDIAN QTRLY 1YR 5YR NO. MEDIAN NO. MEDIAN SALE SALE CHANGE CHANGE CHANGE SALES SALE SALES SALE (1YR (5YRS AGO) AGO)
3369
$752,222
4.5%
66 $1,225,000
11.9%
13085
$725,000
$685,000
5.8% $615,000 17.9%
369 $1,200,000 $1,250,000
-4.0% $960,000 25.0%
ACACIA RIDGE
22
$420,000
-2.3%
88
$415,000
$395,000
5.1% $367,500
12.9%
ALDERLEY
19
$850,000
-2.9%
74
$850,000
$815,000
4.3% $710,500
19.6%
ALGESTER
27
$547,750
1.4%
96
$527,000
$512,500
2.8%
$481,235
9.5%
ANNERLEY
18
$815,500
13.3%
94
$782,500
$727,500
7.6% $655,000
19.5%
ASCOT
26 $2,005,000
41.7%
ASHGROVE
45 $1,280,000
8.9%
85 $1,476,000 $1,475,000 180 $1,172,500
$970,000
0.1% $1,360,000
8.5%
20.9% $820,000 43.0%
ASPLEY
43
$650,000
-1.7%
168
$632,500
$610,500
3.6% $546,500
15.7%
AUCHENFLOWER
12 $1,245,000
44.3%
58 $1,155,000
$1,137,500
1.5% $918,000
25.8%
BALD HILLS
24
$506,500
8.7%
$458,000
5.9% $401,000
20.9%
-0.6%
96
$485,000
BALMORAL
25 $1,192,500
78 $1,175,000 $1,050,000
11.9% $923,000
27.3%
BANYO
12
$618,000
2.1%
87
$605,000
$550,000
10.0% $475,000
27.4%
BARDON
40 $1,270,000
29.6%
159
$1,162,000
$991,250
17.2% $839,000
38.5%
BELLBOWRIE
13
$600,000
17.1%
60
$584,000
$562,500
3.8% $495,865
17.8%
BELMONT
7
N/A
N/A
57
$715,000
$700,000
2.1% $635,000
12.6%
BOONDALL
35
$565,000
3.3%
133
$545,000
$522,500
4.3% $456,750
19.3%
BRACKEN RIDGE
49
$539,418
7.5%
231
$520,000
$491,000
5.9% $450,000
15.6%
BRIDGEMAN DOWNS
31
$845,000
6.0%
132
$812,950
$780,000
4.2% $730,000
11.4%
BRIGHTON
43
$620,000
7.8%
195
$575,000
$550,000
4.5% $455,000
26.4%
BULIMBA
31 $1,200,000
-10.1%
94 $1,205,000 $1,350,000
-10.7% $1,210,000
-0.4%
CALAMVALE
27
$573,000
-7.6%
127
$621,250
$643,500
CAMP HILL
59
$997,500
7.8%
250
$940,000
$880,000
CANNON HILL
28
$906,000
7.9%
91
$800,000
$720,000
11.1% $675,000
18.5%
CARINA
35
$690,000
-3.2%
121
$690,000
$657,500
4.9% $607,000
13.7%
CARINA HEIGHTS
22
$765,000
1.5%
79
$760,000
$661,013
15.0% $585,500
29.8%
CARINDALE
34
$911,000
0.9%
173
$905,000
$868,000
4.3% $790,000
14.6%
CARSELDINE
27
$665,000
-1.5%
103
$642,000
$640,000
0.3% $578,500
11.0%
CHAPEL HILL
29
$924,000
8.5%
120
$875,500
$801,750
9.2% $733,500
19.4%
CHELMER
18 $1,600,000
N/A
54 $1,200,000
$1,187,500
1.1% $983,000
22.1%
CHERMSIDE
15
$645,000
2.0%
45
$640,500
$590,000
8.6% $534,000
19.9%
CHERMSIDE WEST
28
$642,500
-1.9%
110
$628,500
$621,000
1.2% $525,000
19.7%
CLAYFIELD
27 $1,225,000
11.6%
98 $1,225,000 $1,055,000
16.1% $1,070,000
14.5%
COOPERS PLAINS
19
$575,000
-4.2%
62
$594,250
$537,050
10.7% $505,000
17.7%
COORPAROO
43
$965,000
4.0%
186
$932,500
$952,000
-2.0% $780,000
19.6%
CORINDA
-3.5%
$619,500
0.3%
6.8% $748,000
25.7%
20
$892,500
32.2%
57
$893,500
$816,500
9.4% $677,750
31.8%
DARRA
6
N/A
N/A
44
$410,000
$385,000
6.5% $430,000
-4.7%
DEAGON
17
$530,000
5.7%
65
$525,000
$485,000
8.2% $434,500
20.8%
DOOLANDELLA
19
$460,000
-9.1%
55
$470,000
$458,000
2.6% $430,000
9.3%
SUBURB/LGA
ANNUAL ANNUAL QTRLY QTRLY ANNUAL ANNUAL MEDIAN MEDIAN QTRLY 1YR 5YR NO. MEDIAN NO. MEDIAN SALE SALE CHANGE CHANGE CHANGE SALES SALE SALES SALE (1YR (5YRS AGO) AGO)
HAMILTON
15 $2,520,000
42.0%
64 $1,600,000 $1,525,000
4.9% $1,132,500
HAWTHORNE
24 $1,310,000
2.9%
98 $1,150,000 $1,185,000
-3.0% $1,070,050
7.5%
HEATHWOOD
14
$630,000
7.7%
60
$595,250
$593,850
0.2% $564,750
5.4%
7
N/A
N/A
39
$549,000
$510,000
7.6% $440,000
24.8%
23 $1,240,000
16.7%
83 $1,050,000 $1,060,500
-1.0% $940,000
11.7%
HEMMANT HENDRA HERSTON
5
N/A
N/A
26
HIGHGATE HILL
9
N/A
N/A
$885,000
N/A
N/A
41.3%
N/A
N/A
45 $1,240,000 $1,010,000
22.8% $1,022,500
21.3%
HOLLAND PARK
24
$851,000
14.6%
101
$825,000
$713,500
15.6% $650,000
26.9%
HOLLAND PARK WEST
18
$783,500
4.7%
80
$750,000
$720,000
4.2% $640,000
17.2%
INALA
22
$360,000
5.3%
141
$346,000
$350,000
-1.1% $330,000
4.8%
INDOOROOPILLY
41
$880,000
-18.4%
115
$945,270
$930,000
1.6% $799,500
18.2% 25.2%
8
N/A
N/A
42
$548,250
$495,000
10.8% $438,000
JINDALEE
JAMBOREE HEIGHTS
27
$620,000
3.3%
102
$620,000
$587,500
5.5% $527,500
17.5%
KALINGA
8
N/A
N/A
27 $1,275,000 $1,227,500
3.9% $950,000
34.2%
KARANA DOWNS
2
N/A
N/A
28
$464,500
$472,500
-1.7% $410,000
13.3%
KARANA DOWNS ^
6
N/A
N/A
40
$631,500
$580,000
8.9% $517,000
22.1%
KEDRON
19
$850,000
9.9%
131
$802,500
$740,000
8.4% $600,000
33.8%
KELVIN GROVE
11
$837,000
N/A
35
$830,000
$785,000
5.7% $747,750
11.0%
33
$755,000
0.7%
142
$745,000
$710,000
4.9% $615,000
21.1%
7
N/A
N/A
22
$905,000
$854,000
6.0% $757,500
19.5%
KEPERRA
30
$580,000
6.4%
113
$570,500
$547,500
4.2% $470,000
21.4%
KURABY
16
$681,000
7.7%
77
$685,000
$705,000
-2.8% $625,000
9.6%
LOTA
16
$606,500
N/A
55
$690,000
$600,000
15.0% $568,000
21.5%
KENMORE KENMORE HILLS
LUTWYCHE
5
N/A
N/A
22
$805,000
$765,000
5.2% $745,000
8.1%
MACGREGOR
15
$705,000
12.8%
53
$720,000
$736,000
-2.2% $728,400
-1.2% 10.2%
9
N/A
N/A
28
$806,500
N/A
N/A $732,000
MANLY
MACKENZIE
29
$980,000
-3.4%
80
$895,500
$880,000
1.8% $760,500
17.8%
MANLY WEST
39
$702,500
9.3%
154
$659,000
$595,000
10.8% $545,000
20.9%
MANSFIELD
23
$715,000
-5.9%
101
$725,000
$700,000
3.6% $600,000
20.8%
MCDOWALL
29
$721,000
-1.1%
93
$695,000
$680,000
2.2% $600,000
15.8%
MIDDLE PARK
12
$552,500
-15.6%
53
$647,000
$605,000
6.9% $576,000
12.3%
MILTON MITCHELTON
1
N/A
N/A
16
N/A
N/A
N/A $720,000
N/A
36
$743,000
3.2%
117
$688,250
$665,000
3.5% $588,944
16.9%
MOGGILL
15
$530,000
-3.8%
89
$552,000
$545,000
1.3% $530,000
4.2%
MOOROOKA
37
$750,000
11.1%
144
$682,750
$630,000
8.4% $570,000
19.8%
MORNINGSIDE
49
$890,000
9.9%
140
$820,000
$800,000
2.5% $715,000
14.7%
MOUNT GRAVATT
9
N/A
N/A
47
$670,000
$630,000
6.3% $625,000
7.2%
MOUNT GRAVATT EAST
35
$705,000
3.7%
167
$685,000
$639,000
7.2% $580,000
18.1%
DREWVALE
17
$655,000
10.4%
58
$613,750
$575,000
6.7% $541,000
13.4%
MOUNT OMMANEY
7
N/A
N/A
24
$862,000
$890,000
-3.1% $795,000
8.4%
DURACK
18
$450,000
0.0%
51
$428,000
$412,500
3.8% $389,000
10.0%
MURARRIE
27
$745,000
N/A
82
$696,500
$620,790
12.2%
13.7%
$612,500
DUTTON PARK
6
N/A
N/A
14
N/A
$880,500
N/A
N/A
N/A
NEW FARM
26 $1,917,000
4.2%
75 $1,845,000 $1,550,000
19.0% $1,475,000
25.1%
EAST BRISBANE
18
$990,000
23.7%
57
$895,000
$815,000
9.8% $790,000
13.3%
NEWMARKET
19
14.9%
50
0.0% $765,000
17.6%
EIGHT MILE PLAINS
29
$792,000
-0.8%
81
$780,000
$750,000
4.0% $735,000
6.1%
NORMAN PARK
27 $1,100,000
23.6%
22.8%
N/A
NORTHGATE
22
$630,500
-18.1%
20
$731,500
N/A
ELLEN GROVE
3
N/A
N/A
13
N/A
N/A
N/A $258,000
$982,500
$900,000
$900,000
98
$982,500
$907,500
8.3% $800,000
71
$660,000
$692,500
-4.7% $629,000
4.9%
58
$690,000
$620,000
11.3% $565,000
22.1% 20.5%
ENOGGERA
18
$797,500
11.9%
74
$746,000
$689,000
8.3% $630,000
18.4%
NUDGEE
EVERTON PARK
36
$655,000
-3.7%
141
$650,000
$613,750
5.9% $540,000 20.4%
NUNDAH
22
$780,000
1.0%
88
$801,100
$770,000
4.0% $665,000
21.3%
OXLEY
39
$644,000
9.2%
142
$593,750
$580,000
2.4% $500,000
18.8%
19.3%
PADDINGTON
32 $1,246,250
6.9%
127 $1,120,000 $1,200,000
-6.7% $897,500
24.8%
FAIRFIELD
11
$750,500
N/A
42
$755,250
$775,000
FERNY GROVE
16
$680,500
16.8%
74
$640,000
FIG TREE POCKET
23 $1,050,000
N/A
69
$976,000 $1,100,000
FITZGIBBON
20
$457,500
8.3%
87
$475,000
$468,750
FOREST LAKE
89
$467,481
10.0%
331
$435,000
$440,000
-1.1% $416,000
4.6%
PULLENVALE ^
7
N/A
GAYTHORNE
5
N/A
N/A
30
$725,000
$725,750
-0.1% $642,000
12.9%
RED HILL
24
$980,000
GEEBUNG
17
$660,000
13.0%
71
$610,000
$575,000
6.1% $490,500
24.4%
RIVERHILLS
18
$561,000
N/A
GORDON PARK
13
$861,750
N/A
49
$850,000
$841,000
1.1% $720,000
18.1%
ROBERTSON
11
$932,000
GRACEVILLE
17 $1,040,000
15.6%
79 $1,012,500
$897,500
12.8% $781,000
29.6%
ROCHEDALE
16
$944,944
GRANGE
13 $1,043,000
-6.0%
58 $1,017,500
$960,000
6.0% $870,000
17.0%
ROCKLEA
5
N/A
N/A
23
GREENSLOPES
20
$895,000
6.4%
71
$830,000
$759,000
9.4% $706,000
17.6%
RUNCORN
17
$659,000
16.6%
86
7
N/A
N/A
23
$900,000
$845,000
6.5%
21.4%
SALISBURY
18
$594,250
-0.1%
87
GUMDALE
REIQ.com
$620,000
-2.5% $622,500 3.2% $536,388 $912,500
7.0%
PALLARA
1.3% $436,500
8.8%
PARKINSON
-11.3%
$741,250
2
N/A
N/A
42
$551,000
$543,500
1.4%
N/A
N/A
35
$689,000
-5.6%
119
$685,000
$648,000
5.7% $593,000
15.5%
N/A
52 $1,217,500 $1,100,000
10.7% $945,000
28.8%
7.7%
72
$922,500
$855,500
7.8% $820,000
12.5%
64
$517,250
$495,000
4.5% $460,000
12.4%
N/A
34
$957,500 $1,010,000
1.1%
80 $1,033,750
-5.2% $874,000
9.6%
$975,000
6.0% $918,000
12.6%
$445,000
$405,500
9.7% $390,000
14.1%
$579,000
$548,000
5.7% $525,000
10.3%
$625,000
$605,500
3.2% $526,750
18.7%
QUEENSLAND MARKET MONITOR • MARCH 2021 | ISSUE 49 REPORTING ON THE DECEMBER QUARTER 2020 | 45
Brisbane LGA
SALES MARKET - HOUSES <2400m2
SALES MARKET - UNITS & TOWNHOUSES
SALES MARKET - HOUSES <2400m2 (CONT’D) SUBURB/LGA
Brisbane LGA
SANDGATE
ANNUAL ANNUAL QTRLY QTRLY ANNUAL ANNUAL MEDIAN MEDIAN QTRLY 1YR 5YR NO. MEDIAN NO. MEDIAN SALE SALE CHANGE CHANGE CHANGE SALES SALE SALES SALE (1YR (5YRS AGO) AGO)
16
$765,000
-13.6%
53
$771,000
$712,500
SUBURB/LGA
ANNUAL ANNUAL QTRLY QTRLY ANNUAL ANNUAL MEDIAN MEDIAN QTRLY 1YR 5YR NO. MEDIAN NO. MEDIAN SALE SALE CHANGE CHANGE CHANGE SALES SALE SALES SALE (1YR (5YRS AGO) AGO)
8.2% $590,000 30.7%
BRISBANE (LGA)
1787
$438,000
4.3%
6894
ALBION
11
$380,000
-28.4%
36
ALDERLEY
10
$519,000
21.9%
ALGESTER
3
N/A
N/A
SEVEN HILLS
18 $1,175,000
44.2%
53
$910,000
$920,000
-1.1%
SEVENTEEN MILE ROCKS
8
N/A
N/A
41
$670,000
$635,000
5.5% $619,000
$741,500 22.7% 8.2% 9.2%
$420,000 $420,000
0.0% $450,000
-6.7%
$395,000
$371,150
6.4% $440,000
-10.2%
46
$441,500 $390,000
13.2% $475,000
-7.1%
20
$292,000 $285,000
2.5% $304,000
-3.9% 7.4%
SHERWOOD
12
$760,000
-25.1%
57
$917,500
$917,500
0.0% $840,000
ANNERLEY
18
$421,250
2.1%
98
$419,000 $415,000
1.0% $390,000
SHORNCLIFFE
4
N/A
N/A
22
$870,500
$802,500
8.5% $675,000 29.0%
ASCOT
23
$493,500
12.2%
99
$448,000 $482,500
-7.2% $426,000
5.2%
SINNAMON PARK
21
$840,000
22.6%
72
$805,000
$740,000
8.8% $620,500 29.7%
ASHGROVE
12
$410,000
-2.4%
45
$420,000 $445,000
-5.6% $456,150
-7.9%
ST LUCIA
13 $1,430,000
-7.7%
60
STAFFORD
30
$697,000
9.4%
121
STAFFORD HEIGHTS
30
$653,750
0.6%
11 $1,003,500
N/A
STRETTON
$1,520,000 $1,227,500 23.8% $1,080,000 40.7%
ASPLEY
7
N/A
N/A
30
$380,250 $385,000
-1.2% $385,000
-1.2%
5.0% $556,000 20.5%
AUCHENFLOWER
17
$460,000
N/A
58
$455,000 $445,000
2.2% $481,000
-5.4%
$620,000
5.1% $555,000
17.4%
BALMORAL
9
N/A
N/A
39
$510,000 $466,250
9.4% $532,500
-4.2%
$861,250
5.7% $828,000
9.9%
BARDON
9
N/A
N/A
30
$711,500 $620,000
14.8% $574,000
24.0%
7.1% $680,000 10.3%
$670,000
$638,000
119
$651,750
33
$910,000
SUNNYBANK
24
$749,000
-1.4%
72
$750,000
$700,000
BOWEN HILLS
19
$375,000
5.6%
63
$375,000 $381,500
-1.7% $433,000
-13.4%
SUNNYBANK HILLS
35
$646,250
4.2%
146
$635,000
$660,000 -3.8% $633,500
0.2%
BRACKEN RIDGE
6
N/A
N/A
29
$315,000 $315,000
0.0% $326,043
-3.4%
TAIGUM
13
$600,000
N/A
48
$542,500
$512,000
6.0% $482,000
12.6%
BRISBANE CITY
87
$485,000
16.3%
353
$463,000 $495,000
-6.5% $499,000
-7.2%
TARINGA
13 $1,075,000
28.0%
57
$950,000
$900,000
5.6% $852,500
11.4%
BULIMBA
37
$610,000
-16.4%
113
$620,000 $677,000
-8.4% $612,500
1.2%
TARRAGINDI
50
-5.4%
169
$872,500
$789,500 10.5% $692,500 26.0%
CALAMVALE
15
$345,000
-1.1%
95
$352,000 $335,000
5.1% $394,950
-10.9%
$832,888
TENERIFFE
8
N/A
N/A
24
THE GAP
71
$807,500
10.0%
235
$1,887,500 $1,870,000 $750,000
0.9% $1,475,000 28.0%
CAMP HILL
11
$582,500
5.9%
43
$467,500 $480,000
-2.6% $463,625
0.8%
$720,000
4.2% $620,500 20.9%
CANNON HILL
7
N/A
N/A
42
$449,000 $448,750
0.1% $455,900
-1.5%
TINGALPA
26
$607,000
2.0%
92
TOOWONG
22
$920,000
-6.4%
83
$596,000
$535,000
11.4% $467,500 27.5%
CARINA
39
$435,000
-0.4%
119
$455,000 $435,000
4.6% $465,000
-2.2%
$981,000
$880,000
11.5% $730,000 34.4%
CARINA HEIGHTS
26
$475,000
9.4%
78
$470,000 $450,000
4.4% $478,000
UPPER KEDRON
17
$772,000
12.1%
-1.7%
68
$700,000
$645,500
8.4% $605,000
15.7%
CARINDALE
8
N/A
N/A
31
$482,500 $462,500
4.3% $540,000
-10.6%
UPPER MOUNT GRAVATT
24
$659,500
0.7%
102
$665,000
$615,000
8.1% $580,944
14.5%
CARSELDINE
23
$405,000
6.6%
66
$389,000 $342,500
13.6% $396,500
-1.9%
CHERMSIDE
44
$375,000
-4.5%
164
$375,000 $375,000
0.0% $440,143
-14.8%
VIRGINIA
10
$735,000
N/A
43
$742,500
$604,000 22.9% $560,000 32.6%
WAKERLEY
32
$887,500
15.8%
127
$792,500
$763,174
3.8% $710,000
WAVELL HEIGHTS
55
$803,250
8.2%
209
$762,500
$717,500
6.3% $630,000 21.0%
WEST END
11 $1,165,000
N/A
31
$1,115,500
$978,125 14.0% $1,000,000
11.6%
$747,500
$731,250
2.2% $650,250
15.0%
$1,162,500 $1,042,500
11.5% $974,500
19.3%
$897,500
$991,000 -9.4% $767,875
16.9%
WESTLAKE
$750,000
N/A
48
WILSTON
20 $1,380,000
28.4%
53
WINDSOR
18
$915,000
9.4%
68
WISHART
26
$812,750
-1.4%
92
$785,000
$724,000
11
$861,337
-12.1%
37
$870,000
$757,500 14.9% $742,500
17.2% 12.1%
WOOLLOONGABBA
11
11.6%
8.4% $651,000 20.6%
WOOLOOWIN
12 $1,032,500
N/A
38
$863,000
$808,000
6.8% $770,000
WYNNUM
55
$725,000
6.5%
216
$683,250
$645,000
5.9% $620,000 10.2%
WYNNUM WEST
51
$620,000
3.3%
186
$573,500
$540,000
6.2% $485,000
YERONGA
19 $1,130,000
6.4%
69
$1,085,000
ZILLMERE
19
-0.5%
91
$485,000
$492,500
18.2%
$847,500 28.0% $730,000 48.6% $466,250
4.0% $442,500
9.6%
CLAYFIELD
41
$385,500
7.1%
146
$373,750 $350,000
6.8% $382,500
-2.3%
COORPAROO
43
$395,000
-0.3%
171
$390,000 $370,000
5.4% $418,000
-6.7%
CORINDA
6
N/A
N/A
26
$403,000 $435,000
-7.4% $430,000
-6.3%
EAST BRISBANE
15
$405,500
15.9%
45
$375,000 $400,000
-6.3% $424,000
-11.6%
EIGHT MILE PLAINS
13
$388,000
3.5%
57
$380,000 $366,000
3.8% $429,000
-11.4%
ENOGGERA
7
N/A
N/A
28
$440,000 $383,000
14.9% $394,250
11.6%
27
$389,000
-5.1%
86
$394,500 $375,000
5.2% $440,000
-10.3%
EVERTON PARK FAIRFIELD
6
N/A
N/A
27
$440,000
47
$393,500
5.6%
163
$385,000 $390,000
GAYTHORNE
8
N/A
N/A
28
$407,500 $375,000
8.7% $441,500
-7.7%
GORDON PARK
0
N/A
N/A
25
$352,500
12.2% $400,250
-11.9%
FORTITUDE VALLEY
N/A
$314,166
N/A
N/A
-1.3% $450,000
N/A
-14.4%
GREENSLOPES
17
$397,500
8.2%
95
$385,000 $370,000
4.1% $410,000
-6.1%
HAMILTON
38
$465,000
-8.4%
131
$470,000 $475,250
-1.1% $552,500
-14.9%
HAWTHORNE
8
N/A
N/A
43
$458,000 $500,000
-8.4% $561,000
-18.4%
HIGHGATE HILL
18
$500,000
-2.5%
53
$520,000 $532,500
-2.3% $595,000
-12.6%
INDOOROOPILLY
30
$540,000
19.3%
100
$475,000 $455,000
4.4% $526,000
-9.7%
KANGAROO POINT
40
$542,500
-2.7%
183
$490,000 $470,000
4.3% $515,900
-5.0%
KEDRON
20
$415,000
10.0%
49
$387,250 $395,000
-2.0% $454,250
-14.7%
KELVIN GROVE
26
$431,000
26.8%
91
$395,000 $412,500
-4.2% $485,000
-18.6%
LUTWYCHE
14
$420,000
6.3%
46
$400,000 $422,500
-5.3% $480,000
-16.7%
MANLY WEST
7
N/A
N/A
41
$391,800 $395,000
-0.8% $392,500
-0.2%
MILTON
7
N/A
N/A
33
$480,000 $450,000
6.7% $579,000
-17.1%
MITCHELTON
5
N/A
N/A
21
$393,000 $406,000
-3.2% $426,500
-7.9%
MOOROOKA
24
$345,000
-5.5%
87
$359,000 $350,000
2.6% $425,000
-15.5%
MORNINGSIDE
28
$500,000
8.9%
126
$472,500 $455,000
3.8% $495,000
-4.5%
MOUNT GRAVATT EAST
22
$399,000
-9.9%
73
$415,000 $396,100
4.8% $451,750
-8.1%
MURARRIE
6
N/A
N/A
23
$537,000 $552,500
-2.8% $548,750
-2.1%
NEW FARM
54
$570,000
-6.6%
216
$645,000 $572,500
12.7% $570,000
13.2%
NEWMARKET
6
N/A
N/A
26
$452,500 $412,000
9.8% $430,250
5.2%
NEWSTEAD
38
$640,000
-1.5%
122
$650,000 $619,000
5.0% $589,000
10.4%
NORMAN PARK
16
$605,000
N/A
35
$569,500
N/A
N/A $482,500
18.0%
NORTHGATE
11
$355,000
-3.1%
41
$362,500
N/A
N/A $412,000
-12.0%
40
$365,000
-0.7%
188
$365,000 $385,000
-5.2% $432,000
-15.5%
NUNDAH
46 | QUEENSLAND MARKET MONITOR • MARCH 2021 | ISSUE 49 REPORTING ON THE DECEMBER QUARTER 2020
REIQ.com
RENTAL MARKET - 3 BED HOUSES
SUBURB/LGA
ANNUAL ANNUAL QTRLY QTRLY ANNUAL ANNUAL MEDIAN MEDIAN QTRLY 1YR 5YR NO. MEDIAN NO. MEDIAN SALE SALE CHANGE CHANGE CHANGE SALES SALE SALES SALE (1YR (5YRS AGO) AGO)
OXLEY
5
N/A
N/A
34
$353,250
N/A
N/A $363,000
-2.7%
PADDINGTON
16
$561,250
10.6%
60
$505,000 $452,000
11.7% $532,500
-5.2%
RED HILL
9
N/A
N/A
31
$480,000 $455,500
5.4% $485,000
-1.0%
RICHLANDS
13
$305,000
N/A
37
$285,000 $277,000
2.9% $346,900
-17.8%
RUNCORN
18
$330,000
6.5%
67
$320,000 $335,000
-4.5% $355,000
-9.9%
SHERWOOD SOUTH BRISBANE
18 46
$403,500 $502,500
4.8% -2.4%
61 167
$395,000 $410,000 $460,000 $500,500
-3.7% $456,500 -8.1% $510,000
-13.5% -9.8%
SPRING HILL
47
$394,500
3.0%
127
$407,250 $372,000
9.5% $452,533
-10.0%
ST LUCIA
27
$460,000
2.2%
106
$447,500 $462,000
-3.1% $494,000
-9.4%
STAFFORD
5
N/A
N/A
46
$351,000 $361,250
-2.8% $447,750
-21.6%
SUNNYBANK HILLS
6
N/A
N/A
27
$342,000 $331,800
3.1% $350,000
-2.3%
TAIGUM
10
$315,000
-3.1%
52
$325,000 $310,000
4.8% $338,000
-3.8%
TARINGA
33
$440,000
2.6%
128
$407,500 $405,500
0.5% $436,500
-6.6%
TENERIFFE
54
$577,500
-5.3%
190
$586,250 $565,000
3.8% $590,000
-0.6%
TINGALPA
4
N/A
N/A
35
$361,500 $357,500
1.1% $360,500
0.3%
TOOWONG
33
$440,000
-1.1%
142
$450,000 $429,000
4.9% $465,500
-3.3%
UPPER MOUNT GRAVATT
14
$385,000
-1.3%
51
$385,000 $378,000
1.9% $455,000
WAKERLEY
8
N/A
N/A
32
$406,500 $426,500
-4.7% $425,000
WEST END
43
$590,000
15.2%
143
$524,500 $527,500
$460
2434
$445
2937
$420
2853
$460
126
$440
149
$415
144
4178
Lindum/Lytton/Wynnum
$465
80
$440
85
$415
85
4179
Lota/Manly
$455
46
$440
64
$420
59
City - Inner
$583
232
$550
230
$550
228
4000
Brisbane City/Spring Hill
$600
20
$573
24
$550
23
4005
New Farm/Teneriffe
$620
19
$560
20
$750
21
4006
Bowen Hills/Valley/Herston/Newstead
$480
11
$473
12
$550
5
4064
Milton/Paddington/Rosalie
$610
43
$610
55
$570
51
4066
Auchenflower/MtCootha/Toowong
$620
29
$490
39
$515
36
4067
Ironside/St Lucia
$450
17
$550
8
$500
8
4101
Highgate Hill/South Bris/West End
$600
34
$575
30
$570
31
4102
Buranda/Dutton Park/Wooloongabba
$500
23
$453
14
$490
24
4169
East Bris/Kangaroo Point
$578
36
$550
28
$500
29
North - Inner
$510
249
$485
320
$470
292 19
$550
17
$560
$485
8
$450
5
4011
Clayfield/Hendra
$575
31
$580
23
$545
30
-15.4%
4012
Nundah/Toombul/Wavell Heights
$478
56
$460
72
$450
59
-4.4%
4030
Lutwyche/Windsor/Wooloowin
$543
32
$495
49
$480
51
-0.6% $565,000
-7.2%
4031
Gordon Park/Kedron
$488
46
$490
61
$450
44
4051
Alderley/Enogerra/Gaythorne/Grange/ Newmarket/Wilston
$490
55
$475
90
$480
84
North - Outer
$430
325
$415
432
$400
412
4013
Northgate
$465
13
$440
10
$395
13
4014
Banyo/Nudgee/Virginia
$450
43
$420
53
$420
37 108
40
$384,000 $396,500
-3.2% $483,400
-20.6%
39
$409,250 $395,000
3.6% $390,000
4.9%
WOOLLOONGABBA
16
$415,000
-2.5%
55
$407,500 $415,000
-1.8% $520,000
-21.6%
WOOLOOWIN
2
N/A
N/A
33
$362,000 $331,000
9.4% $469,000
-22.8%
20
$516,000
13.7%
61
$470,000 $414,250
13.5% $422,500
11.2%
WYNNUM WEST
5
N/A
N/A
46
$343,500 $345,250
-0.5% $345,000
-0.4%
YERONGA
17
$500,000
N/A
55
$440,000 $435,000
1.1% $489,000
-10.0%
5
N/A
N/A
23
$430,000
N/A
N/A $432,700
-0.6%
10
$314,250
N/A
52
$316,750 $310,000
2.2% $362,250
-12.6%
BRISBANE (LGA) ^
BRISBANE CITY Bayside
18
N/A
140
NEW BONDS
10
N/A
BRISBANE (LGA)
$/ WEEK
$515
N/A
QTRLY QTRLY ANNUAL ANNUAL QTRLY NO. MEDIAN NO. MEDIAN CHANGE SALES SALE SALES SALE
DEC-15
NEW BONDS
$640
$415,000
SUBURB/LGA
$/ WEEK
Ascot/Hamilton
8
SALES MARKET - VACANT LAND <2400m
DEC-19
NEW BONDS
Albion/Breakfast Creek
13
ZILLMERE
$/ WEEK
4007
WINDSOR
YEERONGPILLY
DEC-20 LOCALITY L
4010
WISHART
WYNNUM
POST CODE
2
ANNUAL ANNUAL MEDIAN MEDIAN 1YR 5YR SALE SALE (1YR CHANGE CHANGE (5YRS AGO) AGO)
$462,000
10.8%
1289
$405,000
$409,000
-1.0%
$370,000
9.5%
29 $1,175,000
30.9%
65
$910,000
$932,500
-2.4%
$870,000
4.6%
4017
Bracken Ridge/Brighton/Deagon/Sandgate
$435
84
$420
112
$380
4018
Fitzgibbon/Taigum
$400
28
$400
36
$400
39
4032
Chermside/Craigslea
$430
49
$400
61
$410
54
4034
Aspley/Boondal/Geebung/Zillmere
$440
91
$420
136
$395
142
4036
Bald Hills
$410
17
$390
24
$380
19
North West - Inner
$570
84
$570
91
$525
115 47
4059
Ballymore/Ithaca/Kelvin Grove/Red Hill
$555
40
$575
48
$583
4060
Ashgrove/Dorrington/St Johns Wood
$550
23
$530
22
$500
38
4065
Bardon/Jubilee/Rainworth
$580
21
$625
21
$485
30
North West - Outer
$460
202
$450
286
$420
232
4053
Brookside/Everton Park/McDowall/Stafford
$470
129
$450
180
$420
150
4054
Arana Hills/Keperra
$450
53
$440
71
$400
43
4061
The Gap
$450
20
$470
35
$465
39
South - Inner
$460
294
$450
378
$420
364 43
BRACKEN RIDGE
2
N/A
N/A
18
N/A
$352,000
N/A
N/A
N/A
4103
Annerley/Fairfield
$515
32
$500
44
$430
BRIDGEMAN DOWNS
3
N/A
N/A
60
$449,000
$425,000
5.6%
$398,000
12.8%
4104
Yeronga
$630
7
$548
12
$440
18
DOOLANDELLA
3
N/A
N/A
30
$324,000
$272,000
19.1%
$265,000
22.3%
4105
Clifton Hill/Moorooka/Tennyson
$458
36
$450
31
$400
42 20
ELLEN GROVE
2
N/A
N/A
34
$282,700
$282,900
-0.1%
N/A
N/A
4120
Greenslopes/Stones Corner
$498
22
$520
17
$450
HEMMANT
4
N/A
N/A
79
$395,000
$405,000
-2.5%
$315,000
25.4%
4121
Ekibin/Holland Park/Tarragindi/Wellers Hill
$475
78
$460
107
$450
89
OXLEY
1
N/A
N/A
18
N/A
$389,000
N/A
N/A
N/A
4122
Mansfield/Mt Gravatt/Wishart
$450
119
$420
166
$400
150
PALLARA
13
$334,900
5.3%
270
$312,200
$305,000
2.4%
N/A
N/A
South - Outer
$400
288
$395
331
$390
272
ROCHEDALE
6
N/A
N/A
65
$550,000
$469,000
17.3%
$445,000
23.6%
4106
Brisbane Market/Rocklea
$385
9
$380
12
$370
5
RUNCORN
2
N/A
N/A
17
N/A
N/A
N/A
N/A
N/A
4107
Salisbury
$410
11
$410
23
$375
20 28
UPPER KEDRON
2
N/A
N/A
79
$375,000
$412,500
-9.1%
$341,500
9.8%
4108
Archerfield/Coopers Plains
$390
31
$375
31
$400
WAKERLEY
0
N/A
N/A
17
N/A
$455,000
N/A
N/A
N/A
4109
Altandi/Macgregor/Robertson/Sunnybank
$415
90
$400
92
$395
95
WYNNUM
3
N/A
N/A
22
$402,500
N/A
N/A
N/A
N/A
4110
Acacia Ridge/Larapinta/Willawong
$370
45
$355
40
$350
28
REIQ.com
4112
Kuraby
$400
11
$380
15
$380
6
4113
Eight Miles Plains/Runcorn
$400
55
$400
81
$400
55
4115
Algester/Parkinson
$410
21
$410
16
$410
21
4116
Calamvale/Drewvale/Stretton
$425
15
$415
21
$420
14
South East - Inner
$520
251
$490
285
$460
309
4151
Coorparoo
$515
30
$495
35
$470
39
4152
Camp Hill/Carina/Carindale
$510
83
$470
102
$440
112
4170
Cannon Hill/Morningside/Norman Park
$520
84
$500
86
$470
93
4171
Balmoral/Bulimba/Hawthorne
$540
37
$590
44
$510
40
4172
Murarrie
$520
17
$425
18
$420
25
QUEENSLAND MARKET MONITOR • MARCH 2021 | ISSUE 49 REPORTING ON THE DECEMBER QUARTER 2020 | 47
Brisbane LGA
SALES MARKET - UNITS & TOWNHOUSES (CONT’D)
RENTAL MARKET - 3 BED HOUSES (CONT’D) DEC-20
POST CODE
$/ WEEK
LOCALITY L
RENTAL MARKET - 2 BED UNITS
DEC-19
NEW BONDS
$/ WEEK
DEC-15
NEW BONDS
$/ WEEK
NEW BONDS
Brisbane LGA
South East - Outer
$460
31
$445
43
$420
60
4153
Belmont
$500
8
$480
9
$420
8
4154
Gumdale/Ransome/Wakerley
$510
9
N/A
4
$435
10
4173
Tingalpa
$445
10
$435
18
$420
31
4174
Doboy/Hemant
N/A
3
$415
10
$400
9
South West - Inner 4068
$500
Chelmer/Indooroopilly/Taringa
4075 4069
100
$535
41
$475
101
$520
$445
42
$480
POST CODE
DEC-20 LOCALITY L
$/ WEEK
DEC-19
NEW BONDS
$/ WEEK
DEC-15
NEW BONDS
$/ WEEK
NEW BONDS
BRISBANE CITY
$425
6237
$420
5664
$400
4523
Bayside
$400
61
$370
65
$345
51
4178
Lindum/Lytton/Wynnum
$415
42
$380
45
$345
31
4179
Lota/Manly
$380
19
$370
20
$320
20
City - Inner
$470
3139
$500
2498
$490
1846
96
4000
Brisbane City/Spring Hill
$460
516
$550
380
$590
279
34
4005
New Farm/Teneriffe
$500
254
$500
221
$500
301
4006
Bowen Hills/Valley/Herston/Newstead
$460
733
$500
639
$483
273
Corinda/Graceville/Oxley/Sherwood
$485
59
$450
59
$430
62
South West - Outer
$385
252
$380
291
$370
329
4064
Milton/Paddington/Rosalie
$500
107
$450
90
$430
63
Brookfield/Chapel Hill/Kenmore
$480
37
$490
47
$465
34
4066
Auchenflower/MtCootha/Toowong
$430
285
$400
225
$400
208
4070
Anstead/Bellbowrie/Moggill
$413
10
$400
7
$380
17
4067
Ironside/St Lucia
$370
122
$400
92
$400
91
4073
Seventeen Mile Rocks/Sinnamon Park
$400
11
$430
11
$425
12
4101
Highgate Hill/South Bris/West End
$500
648
$535
467
$530
331
4074
Jindalee/MtOmmaney/Sumner/Westlake
$435
52
$430
51
$395
64
4102
Buranda/Dutton Park/Wooloongabba
$460
181
$475
149
$460
85
4076
Darra/Wacol
$340
25
$360
25
$330
16
4169
East Bris/Kangaroo Point
$475
293
$470
235
$470
215
North - Inner
$400
1041
$385
1096
$360
893
4007
Ascot/Hamilton
$460
204
$470
231
$450
164
4010
Albion/Breakfast Creek
$415
62
$440
64
$350
16
4011
Clayfield/Hendra
$350
110
$340
122
$340
134
4012
Nundah/Toombul/Wavell Heights
$380
215
$380
206
$385
206
4030
Lutwyche/Windsor/Wooloowin
$410
249
$400
212
$340
125
4031
Gordon Park/Kedron
$360
87
$348
106
$345
112
4051
Alderley/Enogerra/Gaythorne/Grange/ Newmarket/Wilston
$378
114
$365
154
$349
136
North - Outer
$370
288
$360
316
$350
266
4013
Northgate
$320
23
$320
29
$310
33
4014
Banyo/Nudgee/Virginia
N/A
4
N/A
4
$350
11
4017
Bracken Ridge/Brighton/Deagon/Sandgate
$330
11
$320
12
$320
10
4018
Fitzgibbon/Taigum
$335
14
$340
9
$300
9
4032
Chermside/Craigslea
$395
168
$400
171
$390
129
4034
Aspley/Boondal/Geebung/Zillmere
$350
68
$350
90
$340
74
North West - Inner
$420
190
$423
150
$450
204
4077
Doolandella/Durack/Inala/Richlands
$350
56
$340
76
$325
85
4078
Forest Lake/Carole Park
$370
61
$368
74
$360
101
BRISBANE LGA HOUSE SALES Jun-20
Sep-20
Dec-20 * 2,600 2,172 1,885
784 79
396
324
82
46
<$350K
809
482
276
$350K+
$500k+
$1M+
*Preliminary data Houses<2400m2
BRISBANE LGA UNIT SALES Jun-20
Sep-20
Dec-20 *
730 553
536
395
379
554
313 56
<$350K
$350K+
$500k+
93 $1M+
BRISBANE LGA LAND SALES Jun-20
146
Sep-20
Dec-20 *
151
111 88
98
25
<$350k *Preliminary data
$500k+
$450
102
$495
136
40
$370
34
$380
53
4065
Bardon/Jubilee/Rainworth
$450
14
$480
14
$415
15
North West - Outer
$385
98
$380
110
$380
81
Brookside/Everton Park/McDowall/Stafford
$385
89
$370
96
$385
77
South - Inner
$380
499
$370
500
$350
449
4103
Annerley/Fairfield
$360
98
$350
112
$345
125
4104
Yeronga
$350
37
$358
28
$350
29
4105
Clifton Hill/Moorooka/Tennyson
$350
69
$350
63
$340
64
4111
Nathan
4120
Greenslopes/Stones Corner
15
18
N/A
4
N/A
2
N/A
4
$375
95
$360
97
$350
84 52
4121
Ekibin/Holland Park/Tarragindi/Wellers Hill
$350
37
$350
42
$350
4122
Mansfield/Mt Gravatt/Wishart
$405
159
$410
156
$410
91
South - Outer
$380
97
$340
83
$315
56
4106
Brisbane Market/Rocklea
N/A
3
N/A
4
$250
8
4108
Archerfield/Coopers Plains
$380
17
$390
10
$385
11
4109
Altandi/Macgregor/Robertson/Sunnybank
$395
44
$375
29
$340
19
4113
Eight Miles Plains/Runcorn
$400
23
$320
18
N/A
3
4115
Algester/Parkinson
N/A
4
$290
7
$290
5
South East - Inner
$410
493
$400
512
$385
409
4151
Coorparoo
$380
179
$380
185
$355
141
4152
Camp Hill/Carina/Carindale
$395
48
$385
49
$370
40
4170
Cannon Hill/Morningside/Norman Park
$420
158
$413
152
$400
97
4171
Balmoral/Bulimba/Hawthorne
$450
99
$425
117
$455
128
4173
13 $350k+
136
4172 60
53
$423 $400
83
*Preliminary data
161
Ballymore/Ithaca/Kelvin Grove/Red Hill Ashgrove/Dorrington/St Johns Wood
4053
889
518
4059 4060
Murrarie
$420
9
$410
9
N/A
3
South East - Outer
$373
6
N/A
4
$307
6
Tingalpa
$350
5
N/A
4
N/A
4
South West - Inner
$395
311
$400
311
$380
243 182
4068
Chelmer/Indooroopilly/Taringa
$395
231
$410
227
$380
4075
Corinda/Graceville/Oxley/Sherwood
$398
80
$398
84
$360
61
South West - Outer
$325
14
$300
19
$310
19 4
$1M+
4069
Brookfield/Chapel Hill/Kenmore
N/A
3
N/A
2
N/A
4076
Darra/Wacol
N/A
3
$273
8
N/A
3
4077
Doolandella/Durack/Inala/Richlands
N/A
1
N/A
1
N/A
4
4078
Forest Lake/Carole Park
N/A
4
$328
6
$340
7
48 | QUEENSLAND MARKET MONITOR • MARCH 2021 | ISSUE 49 REPORTING ON THE DECEMBER QUARTER 2020
REIQ.com
RENTAL MARKET - 3 BED TOWNHOUSES POST CODE
DEC-20 LOCALITY L
BRISBANE CITY
$/ WEEK
DEC-19
NEW BONDS
$/ WEEK
RENTAL MARKET - 3 BED TOWNHOUSES (CONT’D)
DEC-15
NEW BONDS
$430
1778
$420
1939
$/ WEEK
NEW BONDS
$415
1594
POST CODE
DEC-20 LOCALITY
L
$/ WEEK
DEC-19
NEW BONDS
$/ WEEK
DEC-15
NEW BONDS
$/ WEEK
NEW BONDS
Bayside
$425
71
$410
103
$400
147
South - Inner
$460
169
$450
172
$450
139
4178
Lindum/Lytton/Wynnum
$420
44
$410
73
$400
107
4103
Annerley/Fairfield
$500
28
$525
29
$520
23
4179
Lota/Manly
$430
27
$413
30
$400
40
4104
Yeronga
$500
20
$518
18
$500
19
City - Inner
$573
84
$600
78
$600
65
4105
Clifton Hill/Moorooka/Tennyson
$460
19
$423
24
$420
19 16
4000
Brisbane City/Spring Hill
N/A
1
N/A
2
N/A
4
4120
Greenslopes/Stones Corner
$510
17
$495
15
$460
4005
New Farm/Teneriffe
$710
10
$860
13
$600
5
4121
Ekibin/Holland Park/Tarragindi/Wellers Hill
$473
14
$435
11
$450
6
4006
Bowen Hills/Valley/Herston/Newstead
$533
16
$585
8
$650
6
4122
Mansfield/Mt Gravatt/Wishart
$440
71
$440
74
$425
56
4064
Milton/Paddington/Rosalie
$545
8
$550
9
$600
7
South - Outer
$400
372
$395
408
$390
309
4066
Auchenflower/MtCootha/Toowong
$550
15
$525
15
$550
8
4107
Salisbury
$435
9
$400
7
$485
5
4067
Ironside/St Lucia
$525
12
$550
13
$580
10
4108
Archerfield/Coopers Plains
$470
10
$500
11
N/A
3 47
4101
Highgate Hill/South Bris/West End
$710
12
$750
13
$670
14
4109
Altandi/Macgregor/Robertson/Sunnybank
$410
45
$420
52
$405
4169
East Bris/Kangaroo Point
$540
8
N/A
2
$570
9
4110
Acacia Ridge/Larapinta/Willawong
$370
20
$355
34
$350
19
North - Inner
$520
134
$500
143
$480
123
4112
Kuraby
$375
21
$390
16
$385
21
4007
Ascot/Hamilton
$623
20
$650
19
$520
17
4113
Eight Miles Plains/Runcorn
$405
126
$405
127
$410
95
4011
Clayfield/Hendra
$560
17
$600
17
$520
11
4115
Algester/Parkinson
$380
37
$385
42
$375
28
4012
Nundah/Toombul/Wavell Heights
$480
26
$475
23
$460
24
4116
Calamvale/Drewvale/Stretton
$400
101
$390
119
$385
90
4030
Lutwyche/Windsor/Wooloowin
$525
6
$513
12
$490
15
South East - Inner
$505
234
$500
249
$480
240
4031
Gordon Park/Kedron
$480
21
$500
23
$450
22
4051
Alderley/Enogerra/Gaythorne/Grange/ Newmarket/Wilston
$495
38
$468
46
$475
34
North - Outer
$400
229
$400
236
$390
178
4013
Northgate
$435
10
$498
10
$430
10
4014
Banyo/Nudgee/Virginia
$470
28
$465
34
$430
7
4017
Bracken Ridge/Brighton/Deagon/Sandgate
$390
49
$375
39
$370
38
4018
Fitzgibbon/Taigum
$400
43
$400
46
$395
43
4032
Chermside/Craigslea
$430
19
$430
31
$430
19
4034
Aspley/Boondal/Geebung/Zillmere
$395
75
$395
71
$385
54
4036
Bald Hills
$360
5
$370
5
$365
7
North West - Inner
$560
19
$550
23
$530
15
4059
Ballymore/Ithaca/Kelvin Grove/Red Hill
$600
7
$550
11
$500
7
4060
Ashgrove/Dorrington/St Johns Wood
N/A
4
$548
6
N/A
4
4065
Bardon/Jubilee/Rainworth
$555
8
$575
6
N/A
4
North West - Outer
$500
116
$470
135
$420
58
4053
Brookside/Everton Park/McDowall/Stafford
$500
99
$475
117
$420
50
4054
Arana Hills/Keperra
$405
8
$415
8
N/A
4
4061
The Gap
$600
9
$543
10
N/A
4
REIQ.com
4151
Coorparoo
$555
12
$495
21
$475
12
4152
Camp Hill/Carina/Carindale
$475
113
$480
111
$450
103
4170
Cannon Hill/Morningside/Norman Park
$515
62
$505
68
$490
88
4171
Balmoral/Bulimba/Hawthorne
$645
36
$600
31
$600
26
4172
Murarrie
$520
11
$518
18
$540
11
South East - Outer
$433
32
$420
37
$410
45
4153
Belmont
N/A
3
$438
6
$430
5
4154
Gumdale/Ransome/Wakerley
$445
13
$420
17
$415
24
4173
Tingalpa
$423
10
$410
12
$385
14
4174
Doboy/Hemant
N/A
3
N/A
2
N/A
2
$480
57
$475
73
$460
69
South West - Inner 4068
Chelmer/Indooroopilly/Taringa
$540
26
$528
30
$525
21
4075
Corinda/Graceville/Oxley/Sherwood
$420
31
$440
43
$395
48 206
South West - Outer
$360
261
$360
282
$365
4069
Brookfield/Chapel Hill/Kenmore
$588
14
$650
13
$445
5
4073
Seventeen Mile Rocks/Sinnamon Park
$430
5
$420
5
$405
9 19
4074
Jindalee/MtOmmaney/Sumner/Westlake
$435
9
$400
13
$520
4076
Darra/Wacol
$378
10
$390
13
$380
15
4077
Doolandella/Durack/Inala/Richlands
$360
171
$355
190
$365
114
4078
Forest Lake/Carole Park
$350
50
$354
47
$365
43
QUEENSLAND MARKET MONITOR • MARCH 2021 | ISSUE 49 REPORTING ON THE DECEMBER QUARTER 2020 | 49
Gold Coast EMPLOYMENT MARKET GOLD COAST Unemployment Rate
4.8%
It’s Hot, Hot, Hot on the Glitter Strip! As one of the nation’s leading lifestyle destinations, it’s no surprise the Gold Coast is experiencing a surge in demand from new residents looking to ‘escape the city.’ As a result, it’s translated into rising prices and stiff competition for real estate across the entire Gold Coast region.
HOUSE MARKET (<2400M2)
“The Gold Coast market is super strong. There’s a shortage of supply, while demand outstrips it, across all types of property,” said REIQ Gold Coast Zone Chair, Andrew Henderson who points to a variety of factors driving the local market. “I think a lot of it is about more flexible working-from-home arrangements; interest rates at historic lows has led to a significant amount of the price increase; and, our relative affordability on a national basis has had a big bearing. The Gold Coast was potentially undervalued going into the pandemic – we were slipping behind Sydney and Melbourne year-on-year – and now we’re experiencing the price catch up we’ve been due.”
Annual
House Market <2400m2 Detached house demand is leading the way, and it’s not restricted solely to nearbeach addresses either. While the draw of the coastline certainly plays a major role in house appeal, established suburbs of all types are seeing plenty of buyers. When you crunch the numbers, it’s easy to see the Gold Coast housing market is firmly entrenched in the ‘rising’ phase of its price cycle.
Participation Rate
69.9%
Quarter median price
Annual median price
$700,000 $658,250 5yrs
Annual volume of sales
7,617
Annual median price 5yrs ago
$545,000
HOUSE MARKET ALL Median days on market
34 Days Median vendor discount
-3.2%
Stock on market
7.8%
The Gold Coast’s annual house price rose a substantial 6.1% for the year to December 2020, coming in at $658,250 across 7,617 transactions. Prices rose at a fast clip in December Quarter 2020 too, reflecting a 7.7% gain for the three months to reach $700,000 across 1,952 transactions. This was the second-best quarterly gain across all LGAs analysed this quarter. The level of demand versus supply is evident in the figures too, with less available stock and tighter selling conditions. Total annual house listing numbers fell to 10,776 for the year ending December 2020 – a drop of 12.3% on the previous year’s listings. Stock on market was also down to 7.8% for the year as well. Median days on market fell to 34 – this is a substantial drop of 16 days compared to last year’s measure. And, the median vendor discount for the year of -3.2% reflected a tightening of the -3.8% discount recorded last year. Unit Market This quarter has revealed units and townhouses are moving into their price recovery phase – a premise supported by local sources. And it’s not all about high rises on the beach. Units in three-story walk-up apartment blocks have traditionally offered an affordable alternative to those seeking a home in particular locations. They’re also relatively rare with many of these projects having been redeveloped toward higher-density living. “I think the next phase for the Gold Coast has to be infill development,” continued Henderson. “We’ve been through the phase of just going up and up, and going high. You’re now going to have people who don’t want to live in a high rise and can’t afford a freestanding house, but a duplex or a triplex with a bit of yard allows them to be closer in with less of the costs associated with a high rise.” Units had been underperforming pricewise for some years on the Gold Coast prior to the pandemic, but as demand continues to ramp up, it’s expected many detached-home hunters will begin looking at apartments once more – particular those like sub-penthouses which are designed to appeal to homeowners. Most of the new projects that have seen excellent sale results are those marketing larger units that target owner occupiers. The unit and townhouse median price rose a comprehensive 5.1% over the quarter, coming in at $446,750 across 1,805 transactions. For the year to December 2020, the annual median rose a substantive 5.5% to $433,500 across a total of 6,762 sales.
50 | QUEENSLAND MARKET MONITOR • MARCH 2021 | ISSUE 49 REPORTING ON THE DECEMBER QUARTER 2020
REIQ.com
Gold Coast Like their detached housing counterpart, units and townhouse saw stock levels squeezed in the face of improving demand. Listing numbers for the 12 months to November 2020 were 8,197 – a notable reduction of 13.1% on the previous year’s result. Stock on market also decreased, coming in at 6.8% to November 2020 as compared to 8.0% in the 12 months prior. Median days on market fell to 50 in 2020 from 63 in 2019, while the median vendor discount also fell to -3.7% to November 2020 from -4.2% to November 2019.
UNIT MARKET Annual
Quarter median price
Annual median price
$446,750 $433,500 5yrs
Annual volume of sales
6,762
REIQ.com
Annual median price 5 yrs ago
$379,000
Vacant Land Market New estates are seeing a significant amount of extra demand for land on the Gold Coast, driven by government stimulus and a growing population. Vacant land saw its annual median improve 0.3% to reach $290,000 to December 2020 across 1,083 transactions. On a quarterly basis, the vacant land median of $340,000 reflected a whopping 13.7% increase in price over the December 2020 quarter. Rental Market Multiple factors were at play in driving rental demand to strong levels according to local sources. There’s been a substantial amount of ‘try before you buy’ tenancies in recent months. This is where new residents are leasing property as a test of whether they want to relocate to the Gold Coast permanently. In addition, investors haven’t been out in force during 2020, which has left the stock of available rentals somewhat depleted. The Gold Coast has traditionally seen decent numbers of overseas investors in its market, and this cohort all but dried up in 2020. The December quarter vacancy rate came in at a very tight 0.6% – which is more than half the vacancy rate of the previous quarter. The annual median weekly rent for a three-bedroom house to December 2020 was $540 across 770 new bonds – this was an increase of $20 per week on the 2019 measure. The same comparisons for two-bedroom units saw a 2020 median of $450 per week across 2,447 new bonds – a rental figure that’s held steady from the same time last year. The December Quarter 2020 median yield for houses came in at 4.0% while units recorded a 5.2% median yield.
QUEENSLAND MARKET MONITOR • MARCH 2021 | ISSUE 49 REPORTING ON THE DECEMBER QUARTER 2020 | 51
Gold Coast
There’s been a substantial amount of ‘try before you buy’ tenancies in recent months. This is where new residents are leasing property as a test of whether they want to relocate to the Gold Coast permanently.
RENTAL MARKET
FOR RENT
UNIT MARKET
Vacancy Rates
0.6%
House Yields
4.0% Unit Yields
5.2%
52 | QUEENSLAND MARKET MONITOR • MARCH 2021 | ISSUE 49 REPORTING ON THE DECEMBER QUARTER 2020
Median days on market
50 Days Median vendor discount
-3.7%
Stock on market
6.8%
REIQ.com
SALES MARKET - HOUSES <2400m2 (CONT’D)
SALES MARKET - HOUSES <2400m2 SUBURB/LGA
GOLD COAST (LGA) GOLD COAST (LGA) ^ ARUNDEL
ANNUAL ANNUAL QTRLY QTRLY ANNUAL ANNUAL MEDIAN MEDIAN QTRLY 1YR 5YR NO. MEDIAN NO. MEDIAN SALE SALE CHANGE CHANGE CHANGE SALES SALE SALES SALE (1YR (5YRS AGO) AGO)
$700,000
7.7%
7617
$658,250
$620,650
6.1% $545,000
20.8%
MERRIMAC
8
N/A
N/A
69
$560,000
$523,500
7.0% $472,500
18.5%
148
$950,000
-3.8%
674
$930,000
$855,000
8.8% $730,000
27.4%
MIAMI
15 $1,000,000
11.1%
78
$850,000
$750,000
13.3% $620,000
37.1%
39
$655,000
13.9%
176
$635,000
$559,250
13.5% $525,000
21.0%
MOLENDINAR
20
$640,000
-4.8%
74
$620,000
$583,000
6.3% $555,000
11.7%
MUDGEERABA
38
$650,000
2.4%
147
$630,000
$572,000
10.1% $500,000
26.0% 42.2%
59
$640,000
2.4%
216
$630,000
$565,000
BENOWA
40 $1,000,000
14.3%
148
$900,000
$890,000
24
$840,000
8.9%
75
$765,000
23.2% 16.5%
7.7% $667,500
14.6%
15 $1,055,000
5.5%
87
17.6% $665,000
40.6%
77 $1,349,000
3.4%
215 $1,250,500 $1,200,000
4.2%
$841,250
48.6%
BUNDALL
32
-5.0%
115 $1,045,000 $1,000,000
4.5% $880,000
18.8%
32 $1,160,000
27.5%
103
$915,000
$795,000
$511,500
1.1% $772,500
BONOGIN ^
$997,500
$935,000
$710,000
11.5%
BROADBEACH WATERS
BURLEIGH HEADS
ANNUAL ANNUAL QTRLY QTRLY ANNUAL ANNUAL MEDIAN MEDIAN QTRLY 1YR 5YR NO. MEDIAN NO. MEDIAN SALE SALE CHANGE CHANGE CHANGE SALES SALE SALES SALE (1YR (5YRS AGO) AGO)
1952
ASHMORE
BIGGERA WATERS
SUBURB/LGA
$854,750
7.0% $655,000
39.7%
BURLEIGH WATERS
45
$955,000
14.0%
201
$850,000
$787,500
7.9% $680,000
25.0%
CARRARA
63
$703,000
20.8%
194
$620,000
$610,000
1.6% $486,250
27.5%
CLEAR ISLAND WATERS
16 $1,200,000
COOLANGATTA
7
N/A
COOMBABAH
29
COOMERA
-9.4%
73 $1,250,000 $1,137,500
9.9% $960,500
30.1%
N/A
26
$997,500
$867,500
15.0% $750,000
33.0%
$530,000
10.0%
140
$490,000
$472,500
3.7% $445,000
94
$550,500
4.1%
358
$530,000
$510,000
3.9% $446,000
CURRUMBIN
9
N/A
N/A
31 $1,100,000
$880,000
25.0% $780,000
41.0%
CURRUMBIN VALLEY ^
11 $1,260,000
N/A
34 $1,250,000
$875,000
42.9% $795,000
57.2%
MUDGEERABA ^
$860,000
16.3% $703,000
46
$522,500
10.7%
206
$477,000
$440,000
8.4% $400,000
19.3%
NERANG ^
3
N/A
N/A
24
$890,000
$828,750
7.4% $775,000
14.8%
ORMEAU
NERANG
11 $1,015,000
-1.5%
45 $1,000,000
54
$489,500
-0.1%
209
$485,000
$467,000
3.9% $441,000
10.0%
ORMEAU ^
7
N/A
N/A
33
$853,000
$804,000
6.1%
19.7%
ORMEAU HILLS
17
$550,000
5.3%
84
$525,000
$490,000
7.1% $485,000
8.2%
OXENFORD
49
$526,500
-0.2%
215
$520,000
$498,750
4.3% $466,750
11.4%
PACIFIC PINES
72
$590,000
4.4%
260
$576,000
$523,000
10.1% $480,500
19.9%
PALM BEACH
55
$985,000
9.1%
227
$925,000
$880,000
5.1% $655,000
41.2%
$712,500
PARADISE POINT
35
$885,000
-14.1%
145
$995,000 $1,110,000 -10.4% $1,090,000
-8.7%
PARKWOOD
29
$642,500
0.4%
118
$621,000
$610,500
1.7% $539,950
15.0%
10.1%
PIMPAMA
68
$472,500
3.8%
253
$455,000
$472,000
-3.6% $435,440
4.5%
18.8%
REEDY CREEK
25
$875,000
0.0%
92
$872,500
$795,000
9.7% $690,000
26.4%
ROBINA
92
$750,000
6.4%
337
$710,000
$669,000
6.1% $565,000
25.7%
RUNAWAY BAY
36 $1,102,500
-7.4%
139 $1,035,000
$990,000
4.5%
12.8%
$917,500
CURRUMBIN WATERS
30
$780,000
-9.2%
119
$765,000
$685,000
11.7% $575,000
33.0%
SOUTHPORT
62
$647,000
10.6%
257
$574,000
4.5% $512,000
17.2%
ELANORA
41
$780,000
10.6%
157
$750,000
$710,000
5.6% $561,000
33.7%
SURFERS PARADISE
35 $1,347,500
0.7%
130 $1,512,500 $1,377,500
9.8% $1,225,000
23.5%
$600,000
GILSTON
6
N/A
N/A
23
$653,000
$568,000
15.0% $540,000
20.9%
TALLAI ^
7
N/A
N/A
47 $1,026,000
$987,500
3.9% $880,000
16.6%
HELENSVALE
71
$638,750
-12.8%
303
$675,000
$637,500
5.9% $545,000
23.9%
TALLEBUDGERA ^
7
N/A
N/A
41 $1,100,000
$937,500
17.3% $786,500
39.9%
HIGHLAND PARK
23
$591,000
7.8%
82
$570,000
$526,000
8.4% $475,000
20.0%
UPPER COOMERA
108
$519,250
-0.1%
460
$500,000
$485,000
3.1% $432,750
15.5%
9
N/A
N/A
45
$745,000
$685,500
8.7% $650,000
14.6%
VARSITY LAKES
44
$635,000
-2.3%
154
$635,000
$610,000
4.1% $550,000
15.5%
278 $1,087,500
HOLLYWELL HOPE ISLAND
82 $1,135,000
19.5%
$940,000
15.7% $600,000
81.3%
WONGAWALLAN ^
2
N/A
N/A
24
$892,250
$860,000
3.8% $616,000
44.8%
JACOBS WELL
12
$645,000
15.7%
52
$587,500
$532,500
10.3% $404,000
45.4%
WORONGARY
10
$619,500
N/A
39
$552,000
$545,000
1.3% $425,000
29.9%
LABRADOR
50
$547,000
30.2%
197
$475,000
$448,000
6.0% $470,000
1.1%
WORONGARY ^
9
N/A
N/A
34
$870,000
$787,500
10.5% $730,000
19.2%
MAUDSLAND
21
$649,000
11.5%
106
$583,500
$565,000
3.3% $465,000
25.5%
MERMAID BEACH
15 $1,562,500
19.0%
MERMAID WATERS
48
4.3%
REIQ.com
$952,000
61 $1,452,500 $1,450,000 184
$930,000
$940,000
0.2% $1,224,375
18.6%
-1.1% $766,250
21.4%
QUEENSLAND MARKET MONITOR • MARCH 2021 | ISSUE 49 REPORTING ON THE DECEMBER QUARTER 2020 | 53
SALES MARKET - UNITS & TOWNHOUSES SUBURB/LGA
Gold Coast
GOLD COAST (LGA) ARUNDEL
SALES MARKET - UNITS & TOWNHOUSES (CONT’D)
ANNUAL ANNUAL QTRLY QTRLY ANNUAL ANNUAL MEDIAN MEDIAN QTRLY 1YR 5YR NO. MEDIAN NO. MEDIAN SALE SALE CHANGE CHANGE CHANGE SALES SALE SALES SALE (1YR (5YRS AGO) AGO)
1805
$446,750
5.1%
6762
$433,500
$411,000
5.5% $379,000
14.4%
13
$308,500
N/A
54
$332,500
$340,000
-2.2% $320,000
3.9%
SUBURB/LGA
ANNUAL ANNUAL QTRLY QTRLY ANNUAL ANNUAL MEDIAN MEDIAN QTRLY 1YR 5YR NO. MEDIAN NO. MEDIAN SALE SALE CHANGE CHANGE CHANGE SALES SALE SALES SALE (1YR (5YRS AGO) AGO)
PIMPAMA
6
N/A
N/A
26
$335,000
$335,000
0.0% $320,000
4.7%
REEDY CREEK
13
$400,000
6.7%
52
$380,000
$362,000
5.0% $305,000
24.6%
ROBINA
87
$489,000
18.3%
272
$455,000
$431,250
5.5% $430,000
5.8%
RUNAWAY BAY
38
$580,000
27.2%
147
$530,000
$470,000
12.8% $452,500
17.1%
ASHMORE
19
$387,500
2.2%
57
$355,500
$329,000
8.1% $295,000
20.5%
BENOWA
19
$542,500
-9.4%
84
$545,000
$480,000
13.5% $540,000
0.9%
BIGGERA WATERS
59
$378,000
-0.5%
219
$379,000
$355,000
6.8% $436,000
-13.1%
SOUTH STRADBROKE
7
N/A
N/A
26
$116,000
$142,000
N/A
N/A
BILINGA
17
$725,000
N/A
51
$635,000
$672,500
-5.6% $492,000
29.1%
SOUTHPORT
176
$367,500
11.4%
565
$360,000
$350,000
2.9% $380,000
-5.3%
BROADBEACH
114
$557,500
-2.2%
454
$550,000
$517,000
6.4% $435,000
26.4%
SURFERS PARADISE
323
$400,000
0.0%
1245
$392,250
$370,000
6.0% $354,250
10.7%
BROADBEACH WATERS
12
$522,500
N/A
45
$530,000
$440,000
20.5% $440,000
20.5%
TUGUN
30
$587,500
23.7%
109
$505,000
$470,000
7.4% $372,000
35.8%
BUNDALL
9
N/A
N/A
31
$472,500
$394,000
19.9% $349,450
35.2%
UPPER COOMERA
14
$355,000
0.0%
84
$350,000
$327,500
6.9% $325,000
7.7%
BURLEIGH HEADS
61
$585,000
11.4%
222
$550,000
$580,500
-5.3% $419,000
31.3%
VARSITY LAKES
68
$470,000
4.2%
217
$442,250
$426,500
3.7% $400,000
10.6%
BURLEIGH WATERS
23
$520,000
15.6%
81
$450,000
$406,250
10.8% $370,000
21.6%
CARRARA
27
$435,000
-7.1%
129
$440,000
$425,000
3.5% $433,000
1.6%
8
N/A
N/A
34
$477,500
$502,000
-4.9% $442,500
7.9%
COOLANGATTA
51
$605,000
-8.5%
203
$605,000
$600,000
0.8% $464,500
30.2%
COOMBABAH
21
$377,500
-7.9%
99
$383,500
$355,000
8.0% $335,000
14.5%
CLEAR ISLAND WATERS
SALES MARKET - VACANT LAND <2400m2 SUBURB/LGA
COOMERA
26
$332,500
10.8%
108
$312,500
$286,500
9.1% $342,450
-8.7%
CURRUMBIN
10
$597,500
N/A
50
$550,000
$517,500
6.3% $425,000
29.4%
GOLD COAST (LGA)
CURRUMBIN WATERS
14
$543,500
24.9%
46
$443,250
$430,000
3.1% $359,000
23.5%
ELANORA
14
$457,750
8.7%
60
$432,500
$390,000
10.9% $340,000
27.2%
GOLD COAST (LGA) ^
HELENSVALE
15
$319,500
-15.9%
49
$325,000
$340,000
-4.4% $413,750
-21.5%
HOPE ISLAND
52
$510,000
2.0%
195
$524,000
$516,500
1.5% $540,000
-3.0%
LABRADOR
90
$370,000
2.2%
317
$359,000
$345,000
4.1% $330,000
8.8%
MAIN BEACH
55
$727,500
11.9%
214
$740,000
$750,000
-1.3% $636,000
16.4%
MERMAID BEACH
57
$480,000
6.7%
201
$463,750
$435,000
6.6% $356,250
30.2%
MERMAID WATERS
26
$443,000
11.4%
117
$420,000
$385,500
8.9% $359,500
16.8%
MERRIMAC
18
$353,500
4.9%
75
$355,000
$357,500
-0.7% $364,500
-2.6%
MIAMI
37
$580,000
31.8%
113
$505,000
$435,000
16.1% $402,500
25.5%
MOLENDINAR
5
N/A
N/A
30
$317,500
$291,500
8.9% $295,000
7.6%
MUDGEERABA
17
$400,500
2.0%
75
$408,000
$382,500
6.7% $348,500
17.1%
NERANG
18
$328,000
2.5%
88
$325,000
$305,000
6.6% $300,000
8.3%
OXENFORD
10
$310,000
N/A
34
$327,000
$306,000
6.9% $290,000
12.8%
PACIFIC PINES
13
$340,000
11.5%
66
$332,500
$327,500
1.5% $342,500
-2.9%
PALM BEACH
64
$537,150
-2.6%
236
$502,000
$455,000
10.3% $343,750
46.0%
PARADISE POINT
22
$682,500
-1.1%
84
$820,000
$742,500
10.4% $650,000
26.2%
ANNUAL ANNUAL QTRLY QTRLY ANNUAL ANNUAL MEDIAN MEDIAN QTRLY 1YR 5YR NO. MEDIAN NO. MEDIAN SALE SALE CHANGE CHANGE CHANGE SALES SALE SALES SALE (1YR (5YRS AGO) AGO)
Jun-20
Sep-20
147
$340,000
13.7%
1083
$290,000 $289,000
0.3% $239,000
21.3%
34
$750,000
34.2%
142
$565,000 $520,000
8.7% $385,000
46.8%
ARUNDEL
0
N/A
N/A
15
N/A $362,000
COOMERA
35
$298,000
2.8%
219
$290,000 $285,450
97
$399,900 $389,900
11.5%
53
$650,000 $695,000
-6.5%
N/A
N/A
JACOBS WELL
4
N/A
N/A
35
$570,000 $305,000
86.9%
N/A
N/A
MAUDSLAND ^
0
N/A
N/A
13
N/A $497,500
N/A
N/A
N/A
ORMEAU
7
N/A
N/A
91
$260,000 $255,950
1.6% $231,500
12.3%
PIMPAMA
37
$273,500
1.3%
366
$272,000 $271,000
0.4% $239,000
13.8%
3
N/A
N/A
24
$375,000 $293,280
27.9% $240,000
56.3%
UPPER COOMERA
Jun-20
Sep-20
Dec-20 *
713 607
587
566
600
471 401
358 467
292
356
434
143
238
68
30 $350K+
-25.9%
N/A
$666,000
GOLD COAST UNIT SALES
438
<$350K
2.6% $540,000
$444,950
19
Dec-20 *
896
*Preliminary data Houses<2400m2
N/A 22.4%
16
1,174
58
N/A
HELENSVALE
1,441
273
N/A
1.6% $236,900
HOPE ISLAND
GOLD COAST HOUSE SALES
47
-18.3%
$500k+
$1M+
<$350K
$350K+
$500k+
122
$1M+
*Preliminary data
54 | QUEENSLAND MARKET MONITOR • MARCH 2021 | ISSUE 49 REPORTING ON THE DECEMBER QUARTER 2020
REIQ.com
RENTAL MARKET - 2 BED UNITS
DEC-20
POST CODE
DEC-19
DEC-15
POST CODE
$/ NEW $/ NEW $/ NEW WEEK BONDS WEEK BONDS WEEK BONDS
LOCALITY L
GOLD COAST CITY
$540
770
$520
1010
$450
909
4208
Gilberton/Jacobs Well/Ormeau
$428
18
$420
15
$400
18
4209
Canowindra/Coomera/ Pimpama/ Willow Vale/ Yawalpah
$420
135
$400
154
$390
111
4210
Oxenford/Studio Village/Wongawallan
$505
12
$460
16
$395
19
4211
Advancetown/Beechmont/ Binna Burra/Carrara/ Gaven/ Nerang
$500
63
$450
79
$425
84
4212
Boykambil/Helensvale/Hope Island/Sanctuary Cove
$550
38
$535
60
$475
63
4213
Austinville/Mudgeeraba/Springbrook/ Tallai/ Worongary
$570
23
$540
35
$450
37
4214
Arundel/Ashmore/Ernest/ Parkwood
$505
58
$480
70
$435
76
4215
Chirn Pk/Southport/Labrador/Keebra Pk
$500
100
$480
117
$440
112
4216
Biggera Wtrs/ Coombabah/Hollywell/ Paradise Pt/ Runaway Bay
$500
39
$500
61
$460
66
4217
Benowa/Bundall/Main Bch/ Sorrento/ Surfers Paradise
$665
32
$630
33
$595
36
4218
Broadbeach/Mermaid Bch/ Nobby Bch/Rialto
$700
45
$630
56
$580
57
4220
Andrews/Burleigh/Miami/Tally Valley
$640
53
$640
84
$550
49
4221
Elanora/Palm Bch
$685
30
$620
72
$530
4223
Currumbin/Currumbin Valley
$620
25
$593
28
4224
Tugun
N/A
3
$565
4225
Bilinga/Coolangatta/Greenmount/ Kirra/ Rainbow Bay
N/A
3
4226
Kerrydale/Merrimac/Robina
$563
4227
Reedy Ck/Stephens/Varsity Lakes
$580
Scenic Rim Regional
$350
$450
2447
$450
4209
$340
17
$343
18
$248
9
4210
Oxenford/Studio Village/Wongawallan
$355
18
$355
20
$320
21
4211
Advancetown/Beechmont/ Binna Burra/Carrara/ Gaven/ Nerang
$425
34
$405
42
$320
51
4212
Boykambil/Helensvale/Hope Island/Sanctuary Cove
$458
66
$420
45
$400
46
4213
Austinville/ Bonogin/ Mugeeraba/ Neranwood/ Springbrook/ Tallai/ Worongary
N/A
3
$400
6
N/A
3
4214
Arundel/Ashmore/Ernest/ Parkwood
$398
14
$375
18
$310
21
4215
Chirn Pk/Southport/Labrador/Keebra Pk
$430
702
$430
718
$360
535
4216
Biggera Wtrs/ Coombabah/Hollywell/ Paradise Pt/ Runaway Bay
$440
193
$410
190
$390
230
4217
Benowa/Bundall/Main Bch/ Sorrento/ Surfers Paradise
$475
551
$470
553
$425
474
4218
Broadbeach/Mermaid Bch/ Nobby Bch/Rialto
$480
259
$450
322
$385
271
4220
Andrews/Burleigh/Miami/Tally Valley
$460
171
$460
175
$410
185
4221
Elanora/Palm Bch
$465
112
$430
154
$350
121
53
4223
Currumbin/Currumbin Valley
$500
23
$440
25
$370
32
$480
31
4224
Tugun
$438
20
$433
40
$360
38
12
$460
8
4225
Bilinga/Coolangatta/Greenmount/ Kirra/ Rainbow Bay
$450
82
$430
130
$370
94
$550
5
$440
8
60
$545
68
$480
48
31
$540
43
$480
32
75
4272
Mt Tamborine
4275
Benobble/ Biddaddaba/ Boyland/ Canungra/ Ferny Glen/ Flying Fox/ Illinbah/ Lamington National Park/ Sarabah/ Witheren/ Wonglepong
4285
Beaudesert/ Cedar Vale/ Innisplain/ Kooralbyn/ Lamington
4309
Aratula/ Kalbar
N/A
1
4310
Boonah/ Duganden/ Mt Alford
$310
17
$350
94
$350
3
N/A
3
$450
6
$480
17
$450
25
$425
29
N/A
3
N/A
3
$420
9
$340
30
$330
41
$300
34
$320
8
$280
8
$280
13
$280
14
Dec-20 *
248 207
76 46
<$350k
27 $350k+
51
108
N/A
GOLD COAST LAND SALES
75
66
2701
$380
2253
4226
Kerrydale/Merrimac/Robina
$468
60
$455
108
$420
55
4227
Reedy Ck/Stephens/Varsity Lakes
$490
120
$475
136
$400
64
Scenic Rim Regional
$270
37
$265
24
$220
36
4272
North Tamborine/ Tamborine Mountain
N/A
2
N/A
1
N/A
0
4285
Beaudesert/ Cedar Vale/ Innisplain/ Kooralbyn/ Lamington/ etc
$265
34
$260
22
$220
29
RENTAL MARKET - 3 BED TOWNHOUSES POST CODE
DEC-20 LOCALITY L
DEC-19
DEC-15
$/ NEW $/ NEW $/ NEW WEEK BONDS WEEK BONDS WEEK BONDS
GOLD COAST CITY
$470
961
$450
1072
$410
4208
Gilberton/Jacobs Well/Ormeau
$410
5
$395
9
$385
1056 14
4209
Canowindra/Coomera/ Pimpama/ Willow Vale/ Yawalpah
$400
193
$390
192
$370
145
4210
Oxenford/Studio Village/Wongawallan
$425
17
$418
16
$370
19
4211
Advancetown/Beechmont/ Binna Burra/Carrara/ Gaven/ Nerang
$420
111
$415
157
$390
173
4212
Boykambil/Helensvale/Hope Island/Sanctuary Cove
$520
57
$500
51
$430
46
4213
Austinville/Mudgeeraba/Springbrook/ Tallai/ Worongary
$460
23
$438
26
$375
36
4214
Arundel/Ashmore/Ernest/ Parkwood
$430
32
$440
38
$385
34
4215
Chirn Pk/Southport/Labrador/Keebra Pk
$480
127
$450
97
$400
113
4216
Biggera Wtrs/ Coombabah/Hollywell/ Paradise Pt/ Runaway Bay
$450
58
$450
76
$420
88
4217
Benowa/Bundall/Main Bch/ Sorrento/ Surfers Paradise
$550
36
$545
40
$470
41
4218
Broadbeach/Mermaid Bch/ Nobby Bch/Rialto
$600
21
$630
26
$495
23
4220
Andrews/Burleigh/Miami/Tally Valley
$550
19
$490
46
$530
28
4221
Elanora/Palm Bch
$600
25
$600
33
$450
27
4223
Currumbin/Currumbin Valley
$490
14
$465
17
$420
15
4224
Tugun
$540
6
$543
14
$440
19
4225
Bilinga/Coolangatta/Greenmount/ Kirra/ Rainbow Bay
$610
6
$640
5
N/A
1
4226
Kerrydale/Merrimac/Robina
$550
160
$530
165
$480
169
4227
Reedy Ck/Stephens/Varsity Lakes
$530
47
$500
63
$465
63
51 15
$500k+
DEC-15
Canowindra/Coomera/ Pimpama/ Willow Vale/ Yawalpah
Tamborine/ Biddaddaba/ Boyland/ Mundoolun/ Wonglepong
Sep-20
DEC-19
$/ NEW $/ NEW $/ NEW WEEK BONDS WEEK BONDS WEEK BONDS
GOLD COAST CITY
4270
Jun-20
DEC-20 LOCALITY L
23
23
$1M+
*Preliminary data
REIQ.com
QUEENSLAND MARKET MONITOR • MARCH 2021 | ISSUE 49 REPORTING ON THE DECEMBER QUARTER 2020 | 55
Gold Coast
RENTAL MARKET - 3 BED HOUSES
Toowoomba HOUSE MARKET (<2400M2)
Annual
Quarter median price
Annual median price
$370,500 $363,000 5yrs
Annual volume of sales
2,174
Annual median price 5yrs ago
$355,000
HOUSE MARKET ALL Median days on market
41 Days Median vendor discount
-3.2%
Stock on market
7.0%
The Toowoomba house market finished last year with a continuation of its rising market conditions. The region’s median house price increased 2.7% over the quarter to be $370,500 over the quarter.
Toowoomba Prices Tracking North The Toowoomba property market, like most other regional areas, is experiencing its best conditions for quite some time. Median house and unit prices are rising, with strong demand from local and interstate buyers pushing up sale prices. The Toowoomba median house price increased 2.7% over the quarter to be $370,500 over the quarter and recorded price growth of 3.7% for the year. However, the region’s unit market was one of the best performing major regions in the state last year with the Toowoomba median unit price increasing by 9.7% in the December quarter, as well as a median increase of 9.6% over the year to $285,000. Meanwhile, its vacant land market was under significant pressure from extraordinary demand last year with a staggering jump in sales of nearly 120% over the year. The supply of land in the region is drying up, which is expected to put even more pressure on prices. Toowoomba’s rental market continues to be in deep undersupply territory, with a vacancy rate of just 0.9% recorded in December. Weekly rents are correspondingly rising, with some tenants running the numbers on whether it’s more affordable for them to become homeowners instead. Indeed, many tenants are opting to buy a home or investment property, with the cost of borrowing so low, but rents rising fast. According to local experts, an interesting trend to watch this year will be the growing tree change movement that began in 2020. With lockdowns around the nation motivating many people to consider a tree change, it’s expected that demand for lifestyle or rural properties will remain robust throughout the year ahead. House Market <2400m2 The Toowoomba house market finished last year with a continuation of its rising market conditions. The region’s median house price increased 2.7% over the quarter to be $370,500 over the quarter. The volume of house sales was also up by 19% compared to the year before. According to local valuers, the market will continue to be buoyed by the ongoing interest from interstate buyers this year, with agents reporting strong enquiry levels. A trend to watch this year will also be the demand for affordable inner-city product with renovation potential. This dwelling type can largely be found in suburbs such as Newtown, Toowoomba City, North Toowoomba and South Toowoomba. Local valuers say the market generally should see strong demand for sub $400,000 dwellings where buyers perceive an ability to value-add to their property postpurchase. Another driving factor is set to be the significant trend away from renting to owning for segments of the population, which is being underpinned by strong competition for rental properties and the very low cost of borrowing money. Unit Market The Toowoomba unit market was one of the best performing major regions in the state last year. With median unit price growth of 9.7% recorded in the December quarter as well as a median increase of 9.6% over the year, the region’s unit market is in fine shape indeed. Over the December quarter, the median unit price was $299,000 with the most sales recorded in Kearneys Spring over the period. The volume of unit sales recorded a drop over the year, no doubt due to the paucity of stock hitting the market. But that didn’t stop some significant median unit price increases being recorded over the year in suburbs such as East Toowoomba (which recorded the State’s highest annual percentage price change of 79.1%), Newtown and South Toowoomba, however, new higher-priced unit stock is likely the reason for the price spike. Vacant Land Market Toowoomba has always had a healthy vacant land market, with last year being no exception. It’s clear that buyers took advantage of government initiatives to buy vacant
56 | QUEENSLAND MARKET MONITOR • MARCH 2021 | ISSUE 49 REPORTING ON THE DECEMBER QUARTER 2020
REIQ.com
Toowoomba
EMPLOYMENT MARKET TOOWOOMBA Unemployment Rate
5.0%
Participation Rate
62.3% UNIT MARKET Annual
Quarter median price
Annual median price
$299,000
$285,000 5yrs
Annual volume of sales
Annual median price 5 yrs ago
349
$307,500
72 Days Median vendor discount
-3.2%
According to local valuers, 2020 saw increased demand for vacant land in the region due to the well-publicised introduction of government stimulus packages. It’s likely that 2021 will continue this trend with significant demand expected for both vacant land and established housing. New construction activity across the Darling Downs region is expected to continue deep into this year as well, with a number of builders already reporting a full calendar of work for the next 12 months. It seems the biggest constraint facing the local market in 2021 is the availability of vacant land with fringe suburbs to both the north and south of Toowoomba presenting the highest availability of vacant land. A variety of housing estates and new developments in locations such as Highfields, Kleinton, Kearneys Spring and Cotswold Hill contain the predominant parcels of new land supply in the region. But like many other regional areas in Queensland, with the strong uptick in new house and land sales over the past year, a skills shortage is also beckoning in the construction sector. Rental market The Toowoomba rental market has continued its serious undersupply of available rental properties with a vacancy rate of just 0.9% recorded in December. The situation is not new, however, with the region posting vacancy rates below 2.0% for more than two years now.
UNIT MARKET Median days on market
land with the volume of sales soaring an extraordinary 117% over the year. The median price of vacant land in Toowoomba finished the year at $180,000 with the most sales recorded in Cotswold Hills, which had a median sale price of $155,0000.
It’s an understatement to say tenants are facing increased difficulty trying to find a suitable rental property with rents increasing at the same time. This tough situation is turning some tenants into homebuyers or investors probably sooner than would have previously been the case. The median weekly rent of a two-bedroom unit in Toowoomba increased 8.0% to $270 over the year to December while the median weekly rent for a three-bedroom house rose 3.1% to $330 over the same period. Gross rental yields in Toowoomba are remaining solid with 4.6% recorded for houses and 4.7% for units.
Stock on market
5.7% REIQ.com
QUEENSLAND MARKET MONITOR • MARCH 2021 | ISSUE 49 REPORTING ON THE DECEMBER QUARTER 2020 | 57
SALES MARKET - UNITS & TOWNHOUSES SUBURB/LGA
SALES MARKET - VACANT LAND <2400m2
ANNUAL ANNUAL QTRLY QTRLY ANNUAL ANNUAL MEDIAN MEDIAN QTRLY 1YR 5YR NO. MEDIAN NO. MEDIAN SALE SALE CHANGE CHANGE CHANGE SALES SALE SALES SALE (1YR (5YRS AGO) AGO)
Toowoomba
TOOWOOMBA (LGA)
99
$299,000
9.7%
349
$285,000 $260,000
9.6% $307,500
ANNUAL ANNUAL QTRLY QTRLY ANNUAL ANNUAL QTRLY MEDIAN 1YR MEDIAN 5YR NO. MEDIAN NO. MEDIAN CHANGE SALE (1YR CHANGE SALE (5YRS CHANGE SALES SALE SALES SALE AGO) AGO)
SUBURB/LGA
-7.3%
TOOWOOMBA (LGA)
48
$165,000
-6.4%
523
$180,000 $190,000
-5.3% $170,000
5.9%
TOOWOOMBA (LGA) ^
52
$332,500
67.5%
252
$210,000 $203,000
3.4% $210,000
0.0%
COTSWOLD HILLS
7
N/A
N/A
71
$155,000
N/A
N/A
N/A
N/A
HIGHFIELDS
5
N/A
N/A
66
$188,000 $187,000
0.5%
N/A
N/A
CENTENARY HEIGHTS
6
N/A
N/A
24
$340,000 $350,000
-2.9% $329,000
3.3%
EAST TOOWOOMBA
8
N/A
N/A
38
$497,000 $277,500
79.1% $359,000
38.4%
HARRISTOWN
5
N/A
N/A
21
$242,500 $207,500
16.9% $235,750
2.9%
23
$281,500
N/A
46
$283,000 $285,000
-0.7%
$311,750
-9.2%
HIGHFIELDS ^
4
N/A
N/A
21
$218,000
N/A
N/A
N/A
N/A
NEWTOWN
8
N/A
N/A
31
$252,500 $220,000
14.8% $285,000
-11.4%
KEARNEYS SPRING
2
N/A
N/A
36
$200,500
N/A
N/A $189,500
5.8%
RANGEVILLE
9
N/A
N/A
33
$336,000
N/A
N/A $345,000
-2.6%
KLEINTON
3
N/A
N/A
53
$191,000
N/A
$181,500
5.2%
SOUTH TOOWOOMBA
3
N/A
N/A
21
$300,000 $242,750
23.6% $313,450
-4.3%
MIDDLE RIDGE
2
N/A
N/A
58
$245,700 $235,800
4.2% $240,000
2.4%
WITHCOTT ^
3
N/A
N/A
29
$220,000
N/A
N/A
N/A
11
$148,000
N/A
42
$129,500 $190,000
KEARNEYS SPRING
SURROUNDS WESTERN DOWNS (LGA)
-31.8%
N/A
N/A
SURROUNDS
N/A
GOONDIWINDI (LGA)
RENTAL MARKET
FOR RENT
N/A
8
N/A
N/A
35
$87,500
$14,750
493.2%
N/A
N/A
SOUTHERN DOWNS (LGA)
21
$83,000
-5.7%
88
$83,500 $100,000
-16.5%
$87,750
-4.8%
SOUTHERN DOWNS (LGA) ^
21
$210,000
55.6%
148
$125,500 $110,000
14.1% $132,500
-5.3%
WESTERN DOWNS (LGA)
7
N/A
N/A
33
$29,000
$35,000
-17.1%
N/A
N/A
WESTERN DOWNS (LGA) ^
33
$37,500
32.7%
183
$35,000
$30,000
16.7%
$35,000
0.0%
Vacancy Rates
0.9%
House Yields
4.6%
TOOWOOMBA HOUSE SALES Jun-20
Unit Yields
Sep-20
Dec-20 *
291
4.7%
217
235
211 174
172 136
132
85
<$350K
$350K+
$500k+
*Preliminary data Houses<2400m2
TOOWOOMBA LAND SALES
TOOWOOMBA UNIT SALES Jun-20 70
Sep-20
Dec-20 *
Jun-20
Sep-20
Dec-20 *
312
69
199
45
20 12
<$350K *Preliminary data
9
$350K+
6
11
72 7
12 <$350k
$500k+
16 $350k+
11
5
5
17
$500k+
*Preliminary data
58 | QUEENSLAND MARKET MONITOR • MARCH 2021 | ISSUE 49 REPORTING ON THE DECEMBER QUARTER 2020
REIQ.com
TOOWOOMBA (LGA) ^
SUBURB/LGA
CAMBOOYA
CENTENARY HEIGHTS
116
$530,000
1.0%
472
$350,000
3.7% $355,000
2.3%
$525,000 ANNUAL $545,000
-3.7% ANNUAL $505,000
4.0%
QTRLY QTRLY ANNUAL ANNUAL MEDIAN MEDIAN QTRLY 1YR 5YR NO. MEDIAN NO. MEDIAN SALE SALE CHANGE CHANGE 3 SALEN/A CHANGE N/A SALES21 $329,000 $327,500 0.5% $295,000 11.5% SALES SALE (1YR (5YRS AGO) AGO)
CROWS NEST
POST CODE
DEC-20 $/ WEEK
LOCALITY L
DEC-19
NEW BONDS
$/ WEEK
DEC-15
NEW BONDS
$/ WEEK
NEW BONDS
31
$383,500
0.9%
136
$376,500 $355,500
5.9% $369,000
2.0%
TOOWOOMBA REGIONAL
$270
298
$250
395
$245
385
11
$255,000
N/A
32
$258,750 $237,000
9.2% $240,000
7.8% 4350
Centenary Heights/Darling Heights/Drayton/ Glenvale/Harlaxton/Harristown/Kearney Springs/ Middle Ridge/Mount Lofty/Newtown/Rangeville/ Rockville/Toowoomba/Westbrook/Wilsonton
$270
283
$255
368
$250
359
4352
Cabarlah/Gowrie Junction/Hampton/Highfields/ Hodgson Vale/Kleinton/Meringandan/ Ravensbourne/Withcott/Wyreema
$250
8
$270
9
$280
5
4356
Bongeen/ Broxburn/ Evanslea/ Irongate/ Kincora/ Linthorpe/ Motley/ Mount Tyson/ North Branch/ Norwin/ Pittsworht/ Purrawunda/ Rossvale/ Scrubby Mountain/ Springside/ St Helens/ Stoneleigh/ Yarranlea
N/A
1
N/A
2
N/A
1
N/A
2
$220
11
$205
7
$250
27
$220
27
$190
17
DARLING HEIGHTS
14
$339,500
-6.5%
52
$346,500 $325,000
6.6% $350,000
-1.0%
EAST TOOWOOMBA
28
$670,000
18.6%
101
$560,000 $500,000
12.0% $463,750
20.8%
GLENVALE
27
$360,000
5.9%
90
$350,000 $355,500
-1.5% $370,000
-5.4%
8
N/A
N/A
23
$530,000 $577,250
-8.2% $515,000
2.9%
GLENVALE ^
RENTAL MARKET - 2 BED UNITS
HARLAXTON
7
N/A
N/A
40
$292,000 $290,000
0.7% $279,000
4.7%
HARRISTOWN
29
$335,000
4.7%
128
$321,250 $301,000
6.7% $320,000
0.4%
HIGHFIELDS
18
$545,000
7.3%
62
$515,000 $494,000
4.3% $460,000
12.0%
HIGHFIELDS ^
25
$620,000
6.9%
101
$577,000 $549,500
5.0% $525,000
9.9%
KEARNEYS SPRING
37
$440,000
6.0%
143
$399,999 $376,000
6.4% $368,000
8.7%
KLEINTON
8
N/A
N/A
47
$549,000 $530,000
3.6% $527,000
MERINGANDAN WEST ^
7
N/A
N/A
27
$390,000 $380,000
2.6%
$411,500
-5.2%
4.2%
MIDDLE RIDGE
28
$604,500
9.9%
106
$581,000 $549,500
5.7% $490,000
18.6%
MOUNT LOFTY
30
$597,500
21.9%
106
$492,500 $465,000
5.9% $483,000
2.0%
NEWTOWN
42
$317,500
N/A
185
$309,000 $302,500
2.1% $315,000
-1.9%
NORTH TOOWOOMBA
14
$325,000
-25.3%
74
$365,000 $332,500
9.8% $321,000
13.7%
4401
Oakey GOONDIWINDI REGIONAL
4390
Goondiwindi
$248
26
$220
23
$190
16
SOUTHERN DOWNS REGIONAL
$210
35
$210
57
$200
61
4370
Warwick/Rosenthal Heights/Womina/Freestone/ Maryvale
$210
27
$205
40
$200
34
4380
Stanthorpe/Broadwater/Mount Tully/Severnlea/ Sugarloaf/Greenlands/Pikedale/Eukey
$233
6
$248
16
$230
26
WESTERN DOWNS REGIONAL
$205
43
$185
53
$165
65
OAKEY
7
N/A
N/A
42
$230,000 $207,500
10.8% $235,750
-2.4%
4405
Dalby
$195
23
$190
31
$190
31
PITTSWORTH
12
$292,500
N/A
45
$298,000 $297,500
0.2% $285,000
4.6%
4413
Chinchilla
$230
13
$180
16
$150
28
RANGEVILLE
27
$525,000
18.5%
152
$460,500 $447,500
2.9% $437,500
5.3%
4415
Miles
N/A
4
N/A
1
N/A
4
ROCKVILLE
15
$285,000
14.0%
51
$285,000 $265,000
7.5% $273,000
4.4%
4419
Cookatoo/ Grosmont/ Wandoan
N/A
2
N/A
1
N/A
0
SOUTH TOOWOOMBA
10
$416,500
23.0%
83
$345,000 $336,000
2.7% $333,750
3.4%
TOOWOOMBA CITY
4
N/A
N/A
27
$330,000 $320,000
3.1% $342,500
-3.6%
WESTBROOK
11
$470,000
N/A
48
$465,000 $466,000
-0.2% $450,500
3.2%
WILSONTON
23
$317,500
-0.8%
97
$315,000 $290,000
8.6% $315,000
0.0%
WILSONTON HEIGHTS
13
$285,000
1.2%
48
$275,000 $252,500
8.9% $284,000
-3.2%
TOOWOOMBA REGIONAL
$330
441
$320
578
$300
551
WITHCOTT ^
6
N/A
N/A
37
$450,000 $429,750
4.7% $390,000
15.4%
WYREEMA
7
N/A
N/A
32
$339,500 $325,000
4.5% $325,000
4.5%
4350
Centenary Heights/Darling Heights/Drayton/ Glenvale/Harlaxton/Harristown/Kearney Springs/ Middle Ridge/Mount Lofty/Newtown/Rangeville/ Rockville/Toowoomba/Westbrook/Wilsonton
$340
359
$325
445
$300
455
4352
Cabarlah/Gowrie Junction/Hampton/Highfields/ Hodgson Vale/Kleinton/Meringandan/ Ravensbourne/Withcott/Wyreema
$380
19
$360
31
$370
21 13
RENTAL MARKET - 3 BED HOUSES POST CODE
SURROUNDS 22
$195,000
-35.0%
94
$265,000 $295,000
-10.2% $243,500
8.8%
GOONDIWINDI (LGA) ^
GOONDIWINDI (LGA)
9
N/A
N/A
35
$380,000 $345,000
10.1% $384,399
-1.1%
GOONDIWINDI
11
$331,250
0.4%
64
$326,250 $340,000
-4.0% $305,000
7.0%
DEC-20 LOCALITY L
$/ WEEK
DEC-19
NEW BONDS
$/ WEEK
DEC-15
NEW BONDS
$/ WEEK
NEW BONDS
4355
Crows Nest/Emu Creek
$278
10
$273
10
$265
4356
Pittsworth/Mount Tyson
$283
8
$288
14
$285
6
4357
Millmerran
$250
5
$265
8
$220
12
SOUTHERN DOWNS (LGA)
93
$250,000
-12.0%
377
$250,000 $258,500
-3.3% $235,000
6.4%
SOUTHERN DOWNS (LGA) ^
49
$365,000
-12.0%
200
$375,000 $380,500
-1.4% $350,000
7.1%
4358
Cambooya/Ramsay
$320
5
$320
5
N/A
2
17.6%
4361
Clifton
N/A
3
$275
8
$260
7
2.6%
4400
Kingsthorpe
N/A
3
N/A
4
N/A
3
4401
Oakey
$260
15
$270
37
$270
18
GOONDIWINDI REGIONAL
$300
44
$308
40
$265
35
4387
Inglewood
$230
5
$230
5
$200
5
4390
Goondiwindi
$320
34
$328
32
$290
27
SOUTHERN DOWNS REGIONAL
$280
133
$275
130
$265
163
4362
Allora/Hendon/Talgai/Berat/Deuchar
N/A
4
$315
6
N/A
4
4370
Warwick/Rosenthal Heights/Womina/ Freestone/Maryvale
$278
58
$275
68
$255
87
4373
Killarney/ The Falls/ The Head
$273
6
N/A
3
$255
6
4380
Stanthorpe/Broadwater/Mount Tully/Severnlea/ Sugarloaf/Greenlands/Pikedale/Eukey
$300
53
$280
42
$325
52
WESTERN DOWNS REGIONAL
$260
95
$240
101
$215
123 67
STANTHORPE WARWICK
13 52
$273,000
-2.7%
$238,000
-17.4%
66 222
$276,250 $255,000 $241,000 $262,500
8.3% $235,000 -8.2% $235,000
WESTERN DOWNS (LGA)
60
$235,000
9.3%
280
$210,000 $187,000
12.3% $240,000
-12.5%
WESTERN DOWNS (LGA) ^
33
$250,000
-17.6%
163
$303,500 $320,000
-5.2% $325,000
-6.6%
CHINCHILLA
17
$215,000
14.1%
83
$210,000 $195,000
7.7% $292,284
-28.2%
DALBY
32
$258,750
10.5%
131
$250,000 $212,500
17.6% $243,500
2.7%
DALBY ^
10
$380,000
N/A
62
$415,000 $400,000
3.8% $417,500
-0.6%
TARA ^
12
$96,000
N/A
33
$97,000
$78,000
24.4%
$70,000
38.6%
RENTAL MARKET - 3 BED TOWNHOUSES POST CODE
DEC-20 LOCALITY L
TOOWOOMBA REGIONAL
4350
Centenary Heights/Darling Heights/Drayton/ Glenvale/Harlaxton/Harristown/Kearney Springs/Middle Ridge/Mount Lofty/Newtown/ Rangeville/Rockville/Toowoomba/Westbrook/ Wilsonton
$/ WEEK
$340
$340
DEC-19
NEW BONDS
$/ WEEK
35
35
$338
$338
DEC-15
NEW BONDS
38
38
$/ WEEK
$315
$315
NEW BONDS
29
29
SOUTHERN DOWNS REGIONAL
N/A
2
N/A
3
$265
7
4370
Warwick/Rosenthal Heights/Womina/ Freestone/Maryvale
N/A
1
N/A
3
$265
5
$240
6
$225
12
$200
16
4413
Chinchilla
N/A
2
$230
6
$200
10
WESTERN DOWNS REGIONAL
REIQ.com
4405
Dalby
$270
52
$250
56
$230
4410
Jandowae
N/A
2
$210
9
N/A
2
4413
Chinchilla
$255
20
$240
19
$200
42
4415
Miles
$210
9
$185
11
$180
6
4419
Cookatoo/ Grosmont/ Wandoan
N/A
2
N/A
1
N/A
1
QUEENSLAND MARKET MONITOR • MARCH 2021 | ISSUE 49 REPORTING ON THE DECEMBER QUARTER 2020 | 59
Toowoomba
517 $370,500 2.7% 2174 $363,000 2 SALES MARKET - HOUSES <2400m
TOOWOOMBA (LGA)
Sunshine Coast SD1 HOUSE MARKET (<2400M2)
HOUSE MARKET (<2400M2)
HOUSE MARKET (<2400M2)
SUNSHINE COAST SD
SUNSHINE COAST LGA
NOOSA
Annual
Quarter median price
$685,000
Annual median price
$650,000
Annual
Quarter median price
$675,000
5yrs
Annual volume of sales
6,028
Annual median price 5yrs ago
$505,000
EMPLOYMENT MARKET SUNSHINE COAST Unemployment Rate
6.4%
Participation Rate
62.2%
The Sunshine Coast’s housing market continues to be the toast of the State with strong upward pressure on prices being recorded.
Annual
Annual median price
Quarter median price
$630,000
$912,500 $900,000
5yrs
Annual volume of sales
5,095
Annual median price 5yrs ago
$499,000
Annual median price
5yrs
Annual volume of sales
933
Annual median price 5yrs ago
$560,000
The Sun Shines Strong Over Sunshine Coast It’s likely to come as no surprise to anyone following the Queensland property market that the Sunshine Coast property and rental markets have again continued their super-strong run of results over the December quarter. Indeed, the region’s house market recorded price growth of 8.9% over the quarter and finished the year up 7.7% compared to the year before – making the Sunshine Coast LGA median house price now $630,000. Looking across other categories, the region’s unit market has experienced robust market conditions as well, with price growth of 8.0% over the year ending December. Vacant land sales were also in hot demand from buyers last year, up more than 20% over the year, as first home buyers, investors and upgraders competed to secure their own slice of coastal land. The Sunshine Coast’s rental market has seemingly suffering from a significant undersupply of property as more new residents shift to the region than leave it for elsewhere. Investors also sold off some of their stock during the peak of the pandemic unease last year which has reduced supply even further. Recording a vacancy rate of just 0.4% in December, and with rents rising sharply, the dire rental situation for tenants is unfortunately not likely to improve for some time yet. House Market <2400m2 The Sunshine Coast’s housing market continues to be the toast of the State with strong upward pressure on prices being recorded. Over the December quarter, the median house price for the Sunshine Coast LGA increased a staggering 8.9% to $675,000 and was 7.7% higher over the year. Price growth in the Noosa region appeared to be moderating at the tail end of last year with a median house price rise of 2.0% recorded. Over the year, though, Noosa continued to be the standout major region with an increase of 15.4%. REIQ Sunshine Coast Zone Chair Matt Diesel said the usual timeframe of sales campaigns had evaporated. “You may not be doing as many open homes as you do
60 | QUEENSLAND MARKET MONITOR • MARCH 2021 | ISSUE 49 REPORTING ON THE DECEMBER QUARTER 2020
REIQ.com
traditionally, because normally you’d have that property on the market for about four to six weeks, depending on what it is. Now it’s literally gone in the first week. Even if it has no price, it's gone in the first two weeks,” he further explained. According to CoreLogic data, total property listings on the Sunshine Coast are at their lowest level for more than a decade. This shortage of stock is clearly playing its part in driving buyer activity and prices with a 23% increase in house sales on the coast over the year. And in Noosa, where the annual median house price is now $910,000, the number of house sales grew by 22% over the same period. Investors have started to make a return to the coast market as well, partly driven by the region’s very strong rental market. Unit Market The Sunshine Coast has always had a stellar unit market, courtesy of its myriad desirable locations including ocean, river and hinterland views stretching from Caloundra to Noosa. This is one of the reasons why its unit sector has continued to show price growth when other regional locations have recorded contradictory conditions over recent years. This latest quarter is no exception, with the Sunshine Coast median unit price posting a median price increase of 2.2% and impressive growth of 8.0% over the year ending December. The volume of unit sales on the Sunshine Coast reduced over the past year, but this is more a reflection of the low stock levels available than anything. Indeed, according to CoreLogic data, there were fewer than 1,800 units for sale on the coast in February 2021 – the lowest number since at least 2010. Vacant Land Market The Sunshine Coast land market was in robust demand from buyers over the past year, with the volume of sales up by more than 21%. Over the December quarter, the median vacant land price jumped by more than 36%, however, such a result is mostly likely due to a higher than usual number of more expensive land parcels being sold over the period.
over the December quarter with a median price of just shy of $400,000. The median price of vacant land across the Sunshine Coast more generally was about $358,500 over the quarter. Rental Market The Sunshine Coast has the lowest number of rental vacancies of any major region across the State. The region posted a vacancy rate of just 0.4% in December but within its boundaries some areas, such as Caloundra, Maroochydore, and Noosa, reported a vacancy rate of just 0.3%. In fact, the number of vacancies is the lowest of all publicly available data that goes back to 2005. The Sunshine Coast has welcomed a number of new residents over the past year, with more people able to work remotely as well as seeking a lifestyle change, which the coast offers in comparatively affordable spades. However, like other major regional areas, its rental market had been suffering from more demand than supply before last year, due to a reduction in investment activity as well as well as new supply. Unsurprisingly, weekly rents are increasing off the back of the undersupply of rental property. The median weekly rent of a two-bedroom unit on the Sunshine Coast increased 7.9% to $410 between December last year and the year before while the median weekly rent for a three-bedroom house grew by 6.5% to $490 over the same period. Strong sales price growth is starting to impact yields, but most investors would be more than happy with the capital growth they are achieving in their portfolios. The gross rental yield for units is currently 4.7% and for houses it is 3.8% on the Sunshine Coast.
The vacant land price increased 1.1% over the year ending December. In fact, the suburb of Baringa recorded 15 land sales REIQ.com
QUEENSLAND MARKET MONITOR • MARCH 2021 | ISSUE 49 REPORTING ON THE DECEMBER QUARTER 2020 | 61
Sunshine Coast SD
HOUSE MARKET ALL
HOUSE MARKET ALL
HOUSE MARKET ALL
SUNSHINE COAST SD
SUNSHINE COAST LGA
NOOSA
Median days on market
Median days on market
Median days on market
Median vendor discount
Median vendor discount
Median vendor discount
Stock on market
Stock on market
Stock on market
39 Days
37 Days
-3.1%
50 Days
-2.9%
7.9%
-3.7%
7.9%
7.8%
UNIT MARKET
UNIT MARKET
UNIT MARKET
SUNSHINE COAST SD
SUNSHINE COAST LGA
NOOSA
Annual
Quarter median price
$490,000
Annual median price
$475,000
Quarter median price
$455,000
5yrs
Annual volume of sales
2,973
Annual median price 5 yrs ago
$379,500
Annual
Annual
Annual median price
$443,000
Quarter median price
$735,000 $710,000 5yrs
5yrs
Annual volume of sales
2,375
Annual median price 5 yrs ago
$370,000
62 | QUEENSLAND MARKET MONITOR • MARCH 2021 | ISSUE 49 REPORTING ON THE DECEMBER QUARTER 2020
Annual median price
Annual volume of sales
598
Annual median price 5 yrs ago
$430,000
REIQ.com
Being more personal, more present, and more you is now a whole lot easier with our biggest ever update to Rex. The new automation and efficiency product updates save you precious time every day, releasing you from those repetitive, mundane tasks. Rex frees up more time to focus on those all important relationships with your buyers and sellers.
REIQ.com
Find out more at rexsoftware.com/autopilot
QUEENSLAND MARKET MONITOR • MARCH 2021 | ISSUE 49 REPORTING ON THE DECEMBER QUARTER 2020 | 63
2103-01-RX
Scan the QR code to see what you can put on autopilot.
Sunshine Coast SD
UNIT MARKET
UNIT MARKET
RENTAL MARKET
SUNSHINE COAST LGA
NOOSA
SUNSHINE COAST LGA
Median days on market
Median days on market
Median vendor discount
Median vendor discount
47 Days
FOR RENT
38 Days
-2.9%
Vacancy Rates
0.4%
House Yields
3.8%
-3.3%
Unit Yields Stock on market
4.7%
Stock on market
7.3%
6.0%
RENTAL MARKET NOOSA
FOR RENT
Vacancy Rates
0.3%
SUNSHINE COAST & NOOSA HOUSE SALES Jun-20
Sep-20
Dec-20 * 1,308
House Yields
3.2%
1,046 748
344 201 29
30
308 182
182
Unit Yields
273
3.3%
16
<$350K
$350K+
$500k+
$1M+
*Preliminary data Houses<2400m2
SUNSHINE COAST & NOOSA LAND SALES
SUNSHINE COAST & NOOSA UNIT SALES Jun-20
Sep-20
343
340 303
189 152 104
Jun-20
Dec-20 *
Sep-20
Dec-20 *
318 317 237
170
131
100
94 49
53
49
64
52
77 46
41
6 <$350K *Preliminary data
$350K+
$500k+
$1M+
<$350k
$350k+
$500k+
15
13
$1M+
*Preliminary data
64 | QUEENSLAND MARKET MONITOR • MARCH 2021 | ISSUE 49 REPORTING ON THE DECEMBER QUARTER 2020
REIQ.com
SUBURB/LGA
ANNUAL ANNUAL QTRLY QTRLY ANNUAL ANNUAL MEDIAN MEDIAN QTRLY 1YR 5YR NO. MEDIAN NO. MEDIAN SALE SALE CHANGE CHANGE CHANGE SALES SALE SALES SALE (1YR (5YRS AGO) AGO)
SUNSHINE COAST (SD)
1542
SUNSHINE COAST (SD) ^
336
SUNSHINE COAST (LGA) SUNSHINE COAST (LGA) ^
1329 255
$685,000 $830,000
$675,000 $832,500
ALEXANDRA HEADLAND
15 $1,385,000
AROONA
17
7.5% 8.2%
8.9% 6.7% N/A
6028 1376
5095 1044
$650,000 $780,000
$630,000 $795,000
$600,000 $730,000
$585,000 $735,000
8.3% $505,000 28.7% 6.8% $614,500 26.9%
7.7% $499,000 26.3% 8.2% $620,000 28.2%
SUBURB/LGA
ANNUAL ANNUAL QTRLY QTRLY ANNUAL ANNUAL MEDIAN MEDIAN QTRLY 1YR 5YR NO. MEDIAN NO. MEDIAN SALE SALE CHANGE CHANGE CHANGE SALES SALE SALES SALE (1YR (5YRS AGO) AGO)
NAMBOUR
63
$455,000
4.0%
223
$430,000 $409,500
5.0% $350,500
22.7%
NINDERRY ^
4
N/A
N/A
23
$690,000 $735,000
-6.1% $599,000
15.2%
NIRIMBA
13
$525,000
-0.6%
67
$525,000 $501,650
4.7%
N/A
N/A
PACIFIC PARADISE
7
N/A
N/A
26
$531,000 $495,000
7.3% $397,500
33.6%
20
$501,000
-8.9%
89
$570,000 $512,500
11.2%
N/A
11 $1,016,000
N/A
28
$837,250 $915,000
-8.5%
N/A
N/A
132
$572,000 $538,251
6.3% $448,750
27.5%
PALMVIEW PALMVIEW ^ PALMWOODS
38
$610,000
14.3%
N/A
42 $1,210,000 $1,050,000
15.2% $955,000
26.7%
PARREARRA
21
$790,000
-7.1%
91
$790,000 $760,000
3.9% $600,000
31.7%
$660,000
-0.4%
79
$610,000
$587,500
3.8% $467,500
30.5%
PELICAN WATERS
54
$839,000
6.9%
175
$825,000 $760,000
8.6% $660,000
25.0%
BARINGA
35
$532,000
5.3%
126
$499,500
$510,000
-2.1%
N/A
N/A
PEREGIAN BEACH
23
$833,000
-1.4%
100
$820,000 $817,500
0.3% $710,000
15.5%
BATTERY HILL
12
$670,000
N/A
32
$626,500
$577,000
8.6% $466,500
34.3%
PEREGIAN SPRINGS
61
$744,500
9.1%
238
$697,500 $645,000
8.1% $568,000
22.8%
BEERWAH
30
$525,000
5.4%
139
$481,250
$445,075
8.1% $396,000
21.5%
ROSEMOUNT ^
4
N/A
N/A
24
$875,000 $744,491
17.5% $640,000
36.7%
8
N/A
N/A
38
$675,250
$620,000
8.9% $475,000
42.2%
SIPPY DOWNS
52
$560,000
5.7%
185
$535,000 $520,000
2.9% $455,000
17.6%
BIRTINYA
20
$702,500
-14.1%
60
$730,000
$646,000
13.0% $589,000
23.9%
TWIN WATERS
14
$987,500
7.3%
64
$922,500 $812,000
13.6% $718,000
28.5%
BLI BLI
55
$620,000
8.8%
197
$580,000
$547,000
6.0% $453,250 28.0%
WARANA
11
$775,000
7.6%
61
$770,000 $740,500
4.0% $555,000
38.7%
BOKARINA
13
$925,000
5.2%
59
$879,000
$820,000
7.2% $597,500
47.1%
WITTA ^
5
N/A
N/A
27
$695,000 $677,000
2.7% $499,000
39.3%
BUDDINA
12
$980,000
23.3%
57
$895,000
$845,000
5.9% $645,500
38.7%
WOOMBYE
19
$537,500
-0.8%
64
$538,000 $510,000
5.5% $433,000
24.2%
BUDERIM
161
$797,000
8.4%
560
$740,000
$655,000
13.0% $560,000
32.1%
WURTULLA
24
$772,500
7.9%
101
$650,000 $650,000
0.0% $535,000
21.5%
BUDERIM ^
20
$990,000
N/A
47
$900,000 $1,175,000
-23.4% $886,000
1.6%
YANDINA
13
$521,100
2.7%
44
$510,000 $441,250
15.6% $362,000
40.9%
18.3%
YAROOMBA
12
$972,000
15.0%
51
$882,000 $820,000
7.6% $572,500
54.1%
213
$912,500
2.0%
933
$900,000 $780,000
15.4% $560,000
60.7%
81
$800,000
10.7%
332
$749,500 $695,000
7.8% $579,000
29.4%
BEERWAH ^
BURNSIDE
9
N/A
N/A
64
$491,000
$460,000
6.7% $415,000
CALOUNDRA
10
$677,500
N/A
37
$575,000
$525,000
9.5%
CALOUNDRA WEST
39
$530,000
16.5%
142
$508,500
$475,000
7.1% $440,000
15.6%
NOOSA (LGA)
4
N/A
N/A
26
$502,075
$482,000
4.2% $383,255
31.0%
NOOSA (LGA) ^
COES CREEK
N/A
N/A
COOLUM BEACH
40
$865,000
21.4%
156
$750,000
$669,000
12.1% $530,000
41.5%
BLACK MOUNTAIN ^
6
N/A
N/A
38
$656,500 $725,000
-9.4%
$571,250
CURRIMUNDI
26
$660,500
17.9%
113
$595,000
$542,250
9.7% $469,500
26.7%
COORAN
6
N/A
N/A
21
$470,000 $388,000
21.1%
N/A
N/A
DICKY BEACH
7
N/A
N/A
27
$870,000
$865,500
0.5% $750,000
16.0%
COORAN ^
6
N/A
N/A
25
$610,000 $565,000
8.0% $447,500
36.3% 34.3%
EUMUNDI
9
N/A
N/A
32
$625,000
$600,000
4.2%
EUMUNDI ^
7
N/A
N/A
42
$903,500
$806,000
12.1% $710,000
$517,500 20.8% 27.3%
GLASS HOUSE MOUNTAINS
25
$530,000
-5.8%
69
$527,500
$491,000
7.4% $415,000
27.1%
GLASS HOUSE MOUNTAINS ^
13
$678,000
6.8%
47
$609,000
$578,000
5.4% $515,000
18.3%
GOLDEN BEACH
24
$730,000
14.1%
96
$642,000
$600,000
7.0% $470,000
5
N/A
N/A
27
$565,000
$502,500
KULUIN
COOROIBAH ^
8
N/A
N/A
34
$792,500 $741,250
6.9% $590,000
COOROY
19
$617,500
17.8%
64
$595,000 $532,500
11.7% $426,000
39.7%
COOROY ^
6
N/A
N/A
29
$749,000 $695,000
7.8% $587,500
27.5%
25 $1,070,000
-4.0%
86 $1,065,000 $887,000
20.1% $690,000
54.3%
28
28.2% $614,000
DOONAN ^
N/A
N/A
NOOSA HEADS
30 $1,412,000
31.3%
12.4% $445,000 27.0%
NOOSAVILLE
36 $1,175,000
-10.6%
36.6%
14.9%
LAKE MACDONALD ^
9
$743,500 $580,000
21.1%
127 $1,337,500 $1,245,000
7.4%
$812,500
64.6%
178 $1,210,000
21.0% $770,000
57.1%
$1,000,000
LANDSBOROUGH
9
N/A
N/A
48
$475,768
$435,000
9.4% $365,000
30.3%
PEREGIAN BEACH
23
$833,000
-1.4%
100
$820,000 $817,500
0.3% $710,000
15.5%
LANDSBOROUGH ^
8
N/A
N/A
26
$602,500
$620,000
-2.8% $532,500
13.1%
POMONA
10
$565,000
N/A
27
$545,000 $500,000
9.0% $387,500
40.6%
LITTLE MOUNTAIN
44
$652,500
6.7%
146
$610,000
$575,000
6.1% $520,000
17.3%
POMONA ^
18
$857,500
18.3%
51
$770,000 $610,000
26.2% $490,000
57.1%
MALENY
11
$575,000
-5.3%
53
$620,000
$555,000
11.7% $459,000
35.1%
SUNRISE BEACH
12 $1,465,000
41.5%
86 $1,100,000 $835,000
31.7% $622,500
76.7%
51.9%
SUNSHINE BEACH
12 $2,067,500
1.6%
79 $2,000,000 $1,550,000
29.0% $975,000
105.1%
TEWANTIN
62
4.5%
11.8% $460,000
44.6%
MALENY ^
8
N/A
N/A
42
$907,500
$695,000
30.6% $597,500
MAPLETON
9
N/A
N/A
25
$580,000
$480,000
20.8% $413,000 40.4%
MARCOOLA
11
$660,000
-15.2%
38
$716,250
$540,000
32.6% $523,500
MAROOCHY RIVER^
4
N/A
N/A
31
$842,500
$775,000
8.7% $650,000
29.6%
55
$710,000
4.4%
226
$690,000
$641,250
7.6% $520,000
32.7%
MERIDAN PLAINS
26
$525,250
1.8%
73
$525,000
$520,000
1.0% $429,500
22.2%
8
N/A
N/A
39 $1,275,000 $1,060,000
20.3% $990,000
28.8%
MOFFAT BEACH
19
$900,000
N/A
52
$937,500
$787,500
19.0% $580,000
61.6%
MOOLOOLABA
23
$915,000
-3.9%
102
$920,000
$829,500
10.9% $655,000 40.5%
MOOLOOLAH VALLEY
2
N/A
N/A
37
$515,000
$455,000
13.2% $420,000
22.6%
MOOLOOLAH VALLEY ^
14
$770,000
1.3%
51
$702,500
$680,000
3.3% $525,000
33.8%
MOUNT COOLUM
16
$780,750
8.0%
61
$740,000
$625,000
18.4% $525,000
41.0%
MOUNTAIN CREEK
48
$652,250
9.6%
208
$620,000
$590,000
5.1% $540,000
14.8%
7
N/A
N/A
40
$785,000
$777,500
1.0% $640,000
22.7%
MUDJIMBA
REIQ.com
222
$665,000 $595,000
36.8%
MAROOCHYDORE
MINYAMA
$695,000
QUEENSLAND MARKET MONITOR • MARCH 2021 | ISSUE 49 REPORTING ON THE DECEMBER QUARTER 2020 | 65
Sunshine Coast SD
SALES MARKET - HOUSES <2400m2 (CONT’D)
SALES MARKET - HOUSES <2400m2
SALES MARKET - VACANT LAND <2400M2
SALES MARKET - UNITS & TOWNHOUSES SUBURB/LGA
ANNUAL ANNUAL QTRLY QTRLY ANNUAL ANNUAL MEDIAN MEDIAN QTRLY 1YR 5YR NO. MEDIAN NO. MEDIAN SALE SALE CHANGE CHANGE CHANGE SALES SALE SALES SALE (1YR (5YRS AGO) AGO)
Sunshine Coast SD
121
$377,500
39.8%
1099
$275,500 $274,500
0.4% $250,500
10.0%
43
$536,250
-0.7%
236
$521,000 $500,000
4.2% $321,750
61.9%
SUNSHINE COAST (LGA)
107
$358,500
36.6%
1043
$272,977 $270,000
1.1% $248,950
9.7%
SUNSHINE COAST (LGA) ^
38
$547,500
3.5%
214
$520,000 $516,250
0.7% $320,000
62.5%
36.5%
BARINGA
15
$399,595
N/A
59
$348,850 $225,000
55.0%
N/A
7.3%
BOKARINA
1
N/A
N/A
19
N/A $450,000
N/A
N/A
N/A
21.2%
BUDERIM
8
N/A
N/A
21
$430,000 $492,000
-12.6% $357,000
20.4%
858
SUNSHINE COAST (LGA)
689
$455,000
2.2%
2375
$443,000 $410,000
8.0% $370,000
19.7%
ALEXANDRA HEADLAND
46
$527,500
33.5%
148
$477,500 $390,000
22.4% $355,000
34.5%
BIRTINYA
32
$470,000
N/A
67
$455,000 $430,000
5.8% $455,290
-0.1%
BUDDINA
11
$676,000
N/A
32
$580,000 $550,000
5.5% $425,000
BUDERIM
55
$439,000
8.4%
195
$413,250 $390,000
6.0% $385,000
CALOUNDRA
36
$446,250
4.3%
129
$455,000 $450,000
1.1% $375,500
COOLUM BEACH
3.2%
2973
$475,000 $430,000
10.5% $379,500
ANNUAL ANNUAL QTRLY QTRLY ANNUAL ANNUAL MEDIAN MEDIAN QTRLY 1YR 5YR NO. MEDIAN NO. MEDIAN SALE SALE CHANGE CHANGE CHANGE SALES SALE SALES SALE (1YR (5YRS AGO) AGO)
SUNSHINE COAST (SD) ^
SUNSHINE COAST (SD)
$490,000
SUBURB/LGA
25.2%
SUNSHINE COAST (SD)
N/A
44
$500,000
2.5%
116
$450,000 $427,500
5.3%
$351,150
28.2%
BURNSIDE
2
N/A
N/A
24
$232,500 $236,500
-1.7%
N/A
N/A
CURRIMUNDI
11
$410,000
N/A
31
$435,000 $395,000
10.1% $372,500
16.8%
GOLDEN BEACH
16
$567,500
12.9%
82
$512,250 $435,500
17.6% $377,500
35.7%
GLASS HOUSE MOUNTAINS
1
N/A
N/A
44
$262,500 $267,500
-1.9% $198,000
32.6%
KINGS BEACH
62
$475,250
-5.9%
183
$485,000 $435,000
11.5% $380,000
27.6%
LANDSBOROUGH
1
N/A
N/A
31
$290,000 $270,000
7.4%
N/A
MARCOOLA
26
$457,500
4.0%
85
$434,000 $376,250
15.3% $315,000
37.8%
MOOLOOLAH VALLEY
0
N/A
N/A
51
$304,000 $299,000
1.7%
N/A
N/A
MAROOCHYDORE
119
$478,000
3.2%
427
$460,000 $435,000
5.7% $360,000
27.8%
NAMBOUR
3
N/A
N/A
53
$255,000 $249,000
2.4% $183,500
39.0%
N/A
2
N/A
N/A
22
$393,750 $362,500
8.6% $320,000
23.0%
NIRIMBA
17
$137,500
-12.7%
284
$216,000 $239,866
-9.9%
N/A
MOOLOOLABA
60
$466,000
4.4%
258
$445,000 $410,000
8.5% $380,000
17.1%
PALMVIEW
9
N/A
N/A
194
$254,900 $255,500
-0.2%
N/A
N/A
MOUNT COOLUM
14
$455,000
-1.0%
63
$456,500 $394,000
15.9% $375,000
21.7%
PALMVIEW ^
2
N/A
N/A
21
N/A $312,500
59.2%
MOUNTAIN CREEK
13
$385,000
N/A
41
$393,000 $382,500
2.7% $377,500
4.1%
PALMWOODS
5
N/A
N/A
36
$320,000 $312,000
2.6%
N/A
N/A
MUDJIMBA
3
N/A
N/A
28
$494,000 $471,000
4.9% $352,500
40.1%
PELICAN WATERS
5
N/A
N/A
38
$500,000 $442,500
13.0% $268,000
86.6%
NAMBOUR
22
$317,000
6.2%
71
$301,000 $260,000
15.8% $247,000
21.9%
PEREGIAN SPRINGS
3
N/A
N/A
32
$437,000 $423,875
3.1% $380,000
15.0%
PARREARRA
27
$460,000
-4.2%
89
$480,000 $495,000
-3.0% $435,000
10.3%
WOOMBYE
0
N/A
N/A
12
N/A $320,000
14
$621,750
11.0%
56
$620,000 $330,500
87.6% $315,000
96.8%
5
N/A
N/A
22
$557,500 $450,000
23.9% $370,000
50.7%
MINYAMA
PELICAN WATERS
8
N/A
N/A
33
$575,200 $403,000
42.7% $490,625
17.2%
PEREGIAN BEACH
11
$560,000
N/A
32
$556,250 $570,000
-2.4% $391,500
42.1%
169
NOOSA (LGA)
$735,000
4.3%
598
$710,000 $621,000
14.3% $430,000
65.1%
NOOSA HEADS
59 $1,013,000
15.8%
209
$925,000 $845,000
9.5% $545,000
69.7%
NOOSAVILLE
59
$593,000
5.0%
196
$565,000 $529,750
6.7% $405,000
39.5%
PEREGIAN BEACH
11
$560,000
N/A
32
$556,250 $570,000
-2.4% $391,500
42.1%
SUNRISE BEACH
9
N/A
N/A
40
$557,500 $525,000
6.2% $345,000
61.6%
SUNSHINE BEACH
21
$895,000
4.4%
TEWANTIN
5
N/A
N/A
74
$892,500 $771,000
15.8% $515,000
73.3%
32
$402,500 $362,500
11.0% $292,500
37.6%
RENTAL MARKET - 3 BED TOWNHOUSES POST CODE
DEC-20 LOCALITY L
SUNSHINE COAST REGIONAL
$/ WEEK
DEC-19
NEW BONDS
$/ WEEK
NOOSA (LGA) NOOSA (LGA) ^
$/ WEEK
NEW BONDS
$460
241
$450
318
$405
220
N/A
2
N/A
1
$325
10
4519
Beerwah/ Peachester
4551
Aroona/ Battery Hill/ Caloundra/ Currimundi/ Diamond Head/ Dicky Bch/ Golden Bch/ Kings Bch/ Little Mtn/ Meridan Plns/ Moffat Bch/ Pelican Waters/ Shelly Bch
$450
50
$440
57
$380
31
4556
Buderim/ Forest Glen/ Kunda Pk/ Mons/ Sippy Downs/ Tanawha
$440
50
$430
57
$405
42
4557
Bundills/ Kawana Is/ Mooloolaba/ Mountain Ck
$470
25
$455
42
$410
50
4558
Cotton Tree/ Kuluin/ Maroochydore/ Sunshine Plaza
$460
39
$450
43
$425
21
4560
Bli Bli/ Burnside/ Coes Ck/ Cooloolabin/ Dulong/ Flaxton/ Highworth/ Image Flat/ Kiamba/ Kulangoor/ Kureelpa/ Mapleton/ Montville/ Nambour/ Parklands/ Perwillowen/ Rosemont/ Towen Mtn
$430
9
$400
11
$320
15
4564
Marcoola/ Mudjimba/ Pacific Paradise
$490
11
$440
12
$410
13
4572
Alexandra Headland
N/A
1
N/A
2
N/A
N/A
4573
Centenary Heights/ Coolum Bch/ Marcus Bch/ Mt Coolum/ Peregian Bch/ Pt Arkwright/ Yaroomba
$570
30
$478
60
$470
26
4575
Birtinya/ Bokarina/ Buddina/ Kawana Waters/ Minyama/ Parrearra/ Warana/ Wurtulla
$498
8
$470
20
$480
5
NOOSA SHIRE
$750
12
$600
19
$480
14
4566
Munna Pt/ Noosaville
$750
7
$560
7
$450
4567
Castaways Bch/ Little Cove/ Noosa Heads/ Sunrise Bch/ Sunshine Bch
$750
5
$600
11
$510
N/A
N/A
N/A
N/A
RENTAL MARKET - 3 BED HOUSES POST CODE
DEC-20 LOCALITY L
$/ WEEK
DEC-19
NEW BONDS
$/ WEEK
DEC-15
NEW BONDS
$/ WEEK
NEW BONDS
SUNSHINE COAST REGIONAL
$490
638
$460
890
$420
4518
Glass House Mountains
$423
6
$390
11
$380
9
4519
Beerwah/ Peachester
$410
17
$398
24
$360
14
4550
Landsborough/ Mt Mellum
$420
8
$390
16
$335
7
4551
Aroona/ Battery Hill/ Caloundra/ Currimundi/ Diamond Head/ Dicky Bch/ Golden Bch/ Kings Bch/ Little Mtn/ Meridan Plns/ Moffat Bch/ Pelican Waters/ Shelly Bch
$470
165
$450
213
$420
166
4552
Bald Knob/ Baroon Pocket/ Booroobin/ Conondale/ Maleny/ Mountain View/ Reesville/ Witta
$460
17
$425
13
$370
17 13
DEC-15
NEW BONDS
$497,500
N/A
742
4553
Glenview/ Mooloolah/ Mooloolah Valley/ Palmview
$485
16
$460
23
$380
4555
Chevallum/ Hunchy/ Landers Shoot/ Palmwoods
$470
9
$450
19
$410
7
4556
Buderim/ Forest Glen/ Kunda Pk/ Mons/ Sippy Downs/ Tanawha
$500
51
$473
72
$435
76
4557
Bundills/ Kawana Is/ Mooloolaba/ Mountain Ck
$518
34
$500
54
$460
51
4558
Cotton Tree/ Kuluin/ Maroochydore/ Sunshine Plaza
$515
61
$490
83
$430
41
4559
Diddillibah/ Kiels Mountain/ West Woombye/ Woombye
$480
9
$430
12
$400
16
4560
Bli Bli/ Burnside/ Coes Ck/ Cooloolabin/ Dulong/ Flaxton/ Highworth/ Image Flat/ Kiamba/ Kulangoor/ Kureelpa/ Mapleton/ Montville/ Nambour/ Parklands/ Perwillowen/ Rosemont/ Towen Mtn
$450
60
$410
89
$380
72
4561
Bridges/ Maroochy River/ Ninderry/ Nth Arm/ Valdora/ Yandina/ Yandina Ck
$475
10
$420
20
$400
19
4562
Belli Pk/ Doonan/ Eerwah Vale/ Eumundi/ Verrierdale/ Weba Downs
$493
10
$458
10
$420
11
4564
Marcoola/ Mudjimba/ Pacific Paradise
$540
18
$480
25
$440
24
4572
Alexandra Headland
N/A
3
N/A
4
N/A
4
4573
Centenary Heights/ Coolum Bch/ Marcus Bch/ Mt Coolum/ Peregian Bch/ Pt Arkwright/ Yaroomba
$530
67
$485
96
$440
93
7
4574
Coolabine/ Gheerulla/ Kenilworth/ Kidaman Creek/ Moy Pocket/ Obi Obi
$350
5
N/A
3
N/A
4
6
4575
Birtinya/ Bokarina/ Buddina/ Kawana Waters/ Minyama/ Parrearra/ Warana/ Wurtulla
$510
69
$480
103
$430
95
66 | QUEENSLAND MARKET MONITOR • MARCH 2021 | ISSUE 49 REPORTING ON THE DECEMBER QUARTER 2020
REIQ.com
RENTAL MARKET - 3 BED HOUSES (CONT’D) POST CODE
DEC-20 LOCALITY L
$/ WEEK
RENTAL MARKET - 2 BED UNITS
DEC-19
NEW BONDS
$/ WEEK
DEC-15
NEW BONDS
$/ WEEK
NEW BONDS
NOOSA SHIRE
$570
84
$495
136
$450
124
Black Mountain/ Carters Ridge/ Cooroy/ Tinbeerwah
$500
15
$450
15
$435
9
4565
Boreen Pt/ Cootharaba/ Lake Cootharaba/ Noosa Parklands/ Teewah/ Tewantin
$550
22
$490
45
$445
54
4566
Munna Pt/ Noosaville
$563
10
$600
13
$550
16
4567
Castaways Bch/ Little Cove/ Noosa Heads/ Sunrise Bch/ Sunshine Bch
$850
27
$650
35
$490
30
4568
Pomona
$500
7
$448
18
$360
8
4569
Cooran
N/A
3
$430
7
N/A
4
4563
Recording a vacancy rate of just 0.4% in December, and with rents rising sharply, the dire rental situation for tenants is unfortunately not likely to improve for some time yet.
REIQ.com
POST CODE
DEC-20 LOCALITY L
SUNSHINE COAST REGIONAL
$/ WEEK
$410
DEC-19
NEW BONDS
$/ WEEK
$/ WEEK
NEW BONDS
$380
862
$345
N/A
1
N/A
1
6
$330
9
$270
10
$290
5
N/A
3
N/A
2
$400
114
$370
149
$330
136
Chevallum/ Hunchy/ Landers Shoot/ Palmwoods
N/A
3
$355
8
N/A
0
Buderim/ Forest Glen/ Kunda Pk/ Mons/ Sippy Downs/ Tanawha
$395
55
$390
124
$320
56
4518
Glasshouse Mountains
4519
Beerwah/ Peachester
$370
4550
Landsborough/ Mount Mellum
4551
Aroona/ Battery Hill/ Caloundra/ Currimundi/ Diamond Head/ Dicky Bch/ Golden Bch/ Kings Bch/ Little Mtn/ Meridan Plns/ Moffat Bch/ Pelican Waters/ Shelly Bch
4555 4556
617
DEC-15
NEW BONDS
795
4557
Bundills/ Kawana Is/ Mooloolaba/ Mountain Ck
$450
51
$380
88
$340
101
4558
Cotton Tree/ Kuluin/ Maroochydore/ Sunshine Plaza
$410
119
$390
134
$360
168
4559
Diddillibah/ Kiels Mountain/ West Woombye/ Woombye
$300
9
$300
13
$280
7
4560
Bli Bli/ Burnside/ Coes Ck/ Cooloolabin/ Dulong/ Flaxton/ Highworth/ Image Flat/ Kiamba/ Kulangoor/ Kureelpa/ Mapleton/ Montville/ Nambour/ Parklands/ Perwillowen/ Rosemont/ Towen Mtn
$310
33
$310
44
$260
34
4564
Marcoola/ Mudjimba/ Pacific Paradise
$420
24
$370
46
$360
55
4572
Alexandra Headland
$425
33
$430
42
$360
38
4573
Centenary Heights/ Coolum Bch/ Marcus Bch/ Mt Coolum/ Peregian Bch/ Pt Arkwright/ Yaroomba
$450
54
$410
74
$350
61
4575
Birtinya/ Bokarina/ Buddina/ Kawana Waters/ Minyama/ Parrearra/ Warana/ Wurtulla
$450
100
$420
111
$400
121
NOOSA SHIRE
$473
66
$420
80
$370
99
4563
Black Mountain/ Carters Ridge/ Cooroy/ Cooroy Mountain/ Lake Macdonald/ Ridgewood/ Tinbeerwah
N/A
1
N/A
2
N/A
3
4565
Boreen Pt/ Cootharaba/ Lake Cootharaba/ Noosa Parklands/ Teewah/ Tewantin
$415
10
$380
14
$270
5
4566
Munna Pt/ Noosaville
$470
27
$423
30
$360
35
4567
Castaways Bch/ Little Cove/ Noosa Heads/ Sunrise Bch/ Sunshine Bch
$500
27
$450
32
$380
56
QUEENSLAND MARKET MONITOR • MARCH 2021 | ISSUE 49 REPORTING ON THE DECEMBER QUARTER 2020 | 67
Fraser Coast EMPLOYMENT MARKET WIDE BAY Unemployment Rate
7.5%
Participation Rate
49.6%
HOUSE MARKET (<2400M2)
Annual
Quarter median price
Annual median price
$350,000 $336,250 5yrs
Annual volume of sales
1,947
Annual median price 5yrs ago
$305,000
HOUSE MARKET ALL
Median days on market
58 Days Median vendor discount
-3.8%
Stock on market
8.8%
Fraser Coast Market Finally Fires Up The Fraser Coast region has seen buyer demand gain serious momentum in recent months. And now purchasers have taken up the slack of unsold stock from recent years, the market is likely to experience even more growth, according to REIQ Fraser Coast Zone Chair Kim Carter. “We've cleared all that backlog. All the stock that we couldn’t sell is now selling, and the market has risen to meet seller expectations for things that were, until recently, overpriced,” revealed Carter. “As a result, we’re getting a real cross section of buyers – many from Melbourne and a lot from Darwin as well as buyers locally. I think COVID-19 had some people thinking that while they can’t travel, they’ll do something else like downsize or upsize their home instead.” Local economic growth and employment opportunities are elements worth tracking as the Fraser Coast moves through to a post-pandemic phase. Confidence in travel and open trade look set to grow, but the return of tourism dollars is vital to the region. Most of the buzz around major infrastructure relates to the Hinkler Regional Deal – which is a five-year commitment between the Federal Government, Bundaberg Regional Council and Fraser Coast Regional Council. Under the agreement, the Australian Government has committed $172.9 million towards the deal, supported by over $90 million in investment from Bundaberg and Fraser Coast Regional Councils and other key implementation partners. This will fund road upgrades, training facilities and other major infrastructure works, helping bring jobs and economic benefits to the region. House Market <2400m2 Analysis of both quarterly and annual median house price movements up to the December 2020 quarter indicate Fraser Coast is still within the rising sector of the price cycle – a position maintained from the previous quarterly report. These results agree with the anecdotal evidence coming from local sources who say there’s been a noticeable uptick in both values and sale numbers for detached home. Some suggest both have risen by as much as 10-15% in recent months. The annual median sale price for houses was $336,250 across 1,947 transaction to December 2020 – a rise of 3.5% on last year’s median value. The quarterly median house price to December 2020 was $350,000 across 481 transactions and reflected an increase of 4.5% over the period for the median house price. This was a robust increase in transactions and values compared to the previous quarter. Fraser Coast housing’s listing numbers continued to tighten throughout 2020. The region saw 3,528 listings for the year to November 2020, a substantial 12.9% drop on last year’s number of 4050. Fraser Coast’s stock on market figure fell by -1.4% to reach 8.8% for the year to November 2020. Median days on market for houses fell to 58 as compared to 66 for the same measure in 2019 and the median vendor discount 0.7% lower over the year too. This all points to ongoing tight supply for detached homes. Unit Market Close examination of this quarter’s data shows Fraser Coast’s unit market is currently in the recovering phase of its price cycle. This reflected some striking gains in value across the quarter and the year. Local sources suggest any listed stock that had been sitting idle in the $180,000 to $220,000 bracket has now sold, and the active price point is currently closer to $250,000. This matches closely to what this quarter’s data reveals – an annual median unit sale price at $263,000 across 351 transactions, reflecting a notable 3.1% increase on the previous year’s measure. The quarterly median unit price to December 2020 was $285,000 across 109 transactions, which reflected a 11.2% increase on last quarter’s result. This is a substantial gain in both transaction numbers and values and was the third highest value rise for units across all LGAs this quarter. This result is quite likely bolstered by increased sales of top-end apartments, particularly those close to shorelines.
68 | QUEENSLAND MARKET MONITOR • MARCH 2021 | ISSUE 49 REPORTING ON THE DECEMBER QUARTER 2020
REIQ.com
Fraser Coast
UNIT MARKET Annual
Quarter median price
Annual median price
$285,000 $263,000 5yrs
Annual volume of sales
351
Annual median price 5 yrs ago
$243,000
“We've cleared all that backlog. All the stock that we couldn’t sell is now selling, and the market has risen to meet seller expectations for things that were, until recently, overpriced,” revealed Carter.
Total listing numbers for units fell over the year by 7.8% while stock on market was down 0.8%. Median days on market rose by four which is a modest outcome while vendor discounting increased slightly by 0.4%. Vacant Land Market Vacant land values rose over the year to reach a median value of $170,000 across 543 transactions which was a 3.0% increase on last year’s figure. On a quarterly comparison land values have remained steady. Our numbers show the median of $170,000 for the December Quarter 2020 remains unchanged from the previous period. Many of the buyers in this sector are first homebuyers taking advantage of the various grants and rebates on offer. Local sources also believe that this younger generation prefer new construction, so they’re among the most active in the vacant land market. Rental Market The Fraser Coast is enjoying the regional boost of lifestyle migration. Capital city dwellers capable of working remotely are choosing to head away from the big smokes so they can enjoy the relaxed lifestyle and increased affordability and liveability in regions such as the Fraser Coast. This is translating into good demand for rental properties. Local agents report 30-40 applicants for many of their listed rentals. There are also reports of prospective tenants offering to pay rent six months in advance to beat out their competition and secure a lease.
REIQ.com
QUEENSLAND MARKET MONITOR • MARCH 2021 | ISSUE 49 REPORTING ON THE DECEMBER QUARTER 2020 | 69
Fraser Coast
The December 2020 vacancy rate was a very low 0.6% – coming off the previous record low of 0.8% recorded for the September 2020 quarter. When it came to rent levels, three-bedroom houses recorded an annual median weekly rent of $340 to December 2020, which was $20 more per week compared to 2019’s result. Twobedroom units had a median of $280 per week. This was an increase of $10 per week compared to the same time last year. And, three-bedroom townhouses came in at $355 per week across 41 new rental bonds. This was a $13 per week increase on last’s year’s result.
UNIT MARKET
Median days on market
86 Days
Gross rental yields for detached houses of 5.1% for the December 2020 quarter is a slight tightening on the previous period, reflecting the possible rise in house values. The unit gross yield also tightened over the quarter, coming in at 5.1% to December 2020 as compared to 5.6% in the previous quarter.
Median vendor discount
-4.6%
SALES MARKET - UNITS & TOWNHOUSES
Stock on market
8.0%
ANNUAL ANNUAL QTRLY QTRLY ANNUAL ANNUAL MEDIAN MEDIAN QTRLY 1YR 5YR NO. MEDIAN NO. MEDIAN SALE SALE CHANGE CHANGE CHANGE SALES SALE SALES SALE (1YR (5YRS AGO) AGO)
SUBURB/LGA
FRASER COAST (LGA)
RENTAL MARKET
FOR RENT
Vacancy Rates
109
$285,000
11.2%
351
MARYBOROUGH
6
N/A
N/A
27
$263,000 $255,000 $195,000
PIALBA
12
$282,000
8.5%
53
3.1% $243,000
N/A
N/A
8.2%
N/A
N/A
$245,000 $255,000
-3.9% $240,000
2.1%
SCARNESS
17
$310,000
37.8%
55
$260,000 $300,000
-13.3% $270,000
-3.7%
TORQUAY
22
$233,750
1.1%
62
$236,250 $230,000
2.7% $213,750
10.5%
URANGAN
42
$298,750
1.7%
115
$280,000 $258,750
8.2% $263,440
6.3%
SURROUNDS
0.6%
34
$257,500
-10.4%
117
$255,000 $265,000
-3.8% $250,000
2.0%
GYMPIE
GYMPIE (LGA)
8
N/A
N/A
25
$263,700 $265,000
-0.5% $239,000
10.3%
RAINBOW BEACH
15
$315,000
1.6%
52
$247,500 $341,250
-27.5% $205,000
20.7%
TIN CAN BAY
2
N/A
N/A
20
$307,500
N/A
N/A
N/A
N/A
House Yields
5.1%
RENTAL MARKET - 3 BED TOWNHOUSES POST CODE
4655
Unit Yields
5.1%
4570
DEC-20 $/ WEEK
LOCALITY L
Sep-20
$/ WEEK
DEC-15
NEW BONDS
$/ WEEK
NEW BONDS
FRASER COAST REGIONAL
$355
41
$343
42
$330
51
Hervey Bay/Pialba/Scarness/Urangan
$355
41
$343
42
$330
48
GYMPIE REGIONAL
$595
9
$300
11
N/A
4
Gympie/Amamoor/Curra/Imbil/Kandanga/ Monkland/Southside/Victory Heights
$595
9
$320
7
N/A
3
3
5
FRASER COAST HOUSE SALES Jun-20
DEC-19
NEW BONDS
FRASER COAST UNIT SALES
Dec-20 *
Jun-20
331
Sep-20
Dec-20 *
90 78
242
229
227
184
53
98 33
<$350K *Preliminary data Houses<2400m2
$350K+
59
64
16 3
$500k+
<$350K
$350K+
15 4
$500k+
*Preliminary data
70 | QUEENSLAND MARKET MONITOR • MARCH 2021 | ISSUE 49 REPORTING ON THE DECEMBER QUARTER 2020
REIQ.com
SALES MARKET - HOUSES <2400m2 SUBURB/LGA
FRASER COAST (LGA)
481
$350,000
4.5%
1947
$336,250 $325,000
3.5% $305,000
FRASER COAST (LGA)
97
$170,000
3.0%
543
$170,000 $165,000
9.5% $374,500
17.0%
FRASER COAST (LGA) ^
83
$140,000
27.3%
320
$127,500
8.6% $356,000
18.3%
BURRUM HEADS
99
$449,500
7.0%
468
$438,000 $400,000
BURRUM HEADS
19
$445,000
0.0%
86
$421,000 $387,500
CRAIGNISH
11
$475,000
N/A
33
$465,000 $436,000
6.7%
N/A
N/A
CRAIGNISH ^
7
N/A
N/A
28
$545,000 $515,000
5.8% $436,500
24.9%
DUNDOWRAN BEACH
5
N/A
N/A
27
$630,000 $530,000
18.9% $555,000
DUNDOWRAN BEACH ^
3
N/A
N/A
29
$625,000 $572,500
9.2% $547,000
ELI WATERS
23
$403,000
11.0%
91
$342,500 $325,000
5.4% $330,000
3.8%
GRANVILLE
6
N/A
N/A
41
$228,000
7.9% $210,000
8.6%
HOWARD
N/A
41
$155,000 $139,000
11.5% $103,500
49.8%
-5.7%
89
$76,000
$74,000
2.7%
$66,000
15.2%
NIKENBAH
1
N/A
N/A
45
$190,000 $190,000
0.0%
N/A
N/A
13.5%
PIALBA
1
N/A
N/A
27
$190,000 $185,000
2.7%
N/A
N/A
14.3%
RIVER HEADS
20
$128,000
42.2%
78
$110,000 $100,000
10.0% $105,500
4.3%
URANGAN
8
N/A
N/A
33
$190,000 $175,000
8.6%
$171,000
11.1%
URRAWEEN
6
N/A
N/A
44
$175,000
N/A
N/A $154,750
13.1%
0
N/A
N/A
23
$175,000
N/A
N/A $155,000
12.9%
N/A
N/A
24
$245,000 $239,000
2.5%
$197,500
24.1%
WONDUNNA
10.1%
112
$359,000 $350,000
2.6% $330,000
8.8%
SURROUNDS
MARYBOROUGH
10.3%
72
$225,000
4.7%
344
$215,000 $203,000
5.9% $195,000
NIKENBAH
6
N/A
N/A
24
$424,000
N/A
N/A
N/A
N/A
OAKHURST ^
4
N/A
N/A
24
$372,500 $399,000
-6.6%
N/A
N/A
POINT VERNON
37
$344,500
-6.8%
78 136
$355,000 $313,500
13.2% $286,500
$339,000 $335,000
1.2% $308,000
40.1%
N/A
$435,000
25.6%
$91,000
$74,000
4
$389,500
40.9%
13.3%
5
20
26
$90,500
3.0% $150,000
20
GLENWOOD ^
KAWUNGAN
PIALBA
ANNUAL ANNUAL QTRLY QTRLY ANNUAL ANNUAL MEDIAN MEDIAN QTRLY 1YR 5YR NO. MEDIAN NO. MEDIAN SALE SALE CHANGE CHANGE CHANGE SALES SALE SALES SALE (1YR (5YRS AGO) AGO)
10.2%
FRASER COAST (LGA) ^
$211,250
SUBURB/LGA
GYMPIE (LGA)
41
$149,000
7.2%
200
$140,995 $134,498
4.8% $129,000
9.3%
GYMPIE (LGA) ^
55
$185,000
-5.1%
277
$185,000 $177,000
4.5% $127,000
45.7%
CHATSWORTH ^
11
$188,000
0.3%
53
$187,000
N/A $129,000
45.0%
23.9%
CURRA ^
15
$128,000
N/A
36
$135,000 $129,000
N/A
4.7%
35.1%
10.1%
COOLOOLA COVE
8
N/A
N/A
51
$114,000 $105,000
8.6% $104,500
9.1%
13
$147,500
N/A
43
$140,000
$131,000
6.9% $134,000
4.5%
$99,950
RIVER HEADS
14
$329,500
8.2%
49
$340,000 $365,000
-6.8% $300,000
13.3%
GYMPIE
SCARNESS
18
$363,500
13.6%
80
$322,500 $302,500
6.6% $270,500
19.2%
PIE CREEK ^
7
N/A
N/A
38
$190,000
N/A
N/A
N/A
N/A
-4.3%
SOUTHSIDE
2
N/A
N/A
34
$145,000 $140,000
3.6%
N/A
N/A
SOUTH BURNETT (LGA)
23
$41,000
-15.9%
109
$40,000
$37,000
8.1%
$39,500
1.3%
SOUTH BURNETT (LGA) ^
45
$100,000
5.3%
198
$89,000
$80,000
11.3%
$83,000
7.2%
TINANA
24
$275,000
N/A
65
$287,000 $267,500
7.3% $300,000
TINANA ^
4
N/A
N/A
33
$420,000 $377,500
11.3%
N/A
N/A
TOOGOOM
32
$372,000
-2.4%
101
$380,000 $335,000
13.4% $310,000
22.6%
TORQUAY
28
$397,500
13.6%
99
$360,000 $325,000
10.8% $305,000
18.0%
URANGAN
49
$400,000
8.8%
229
$365,000 $349,000
4.6%
17.2%
URRAWEEN
40
$399,500
11.7%
151
$365,000 $368,900
-1.1% $353,500
3.3%
WONDUNNA
16
$484,000
N/A
52
$410,000 $430,000
-4.7% $410,000
0.0%
$311,500
RENTAL MARKET - 3 BED HOUSES POST CODE
SURROUNDS GYMPIE (LGA)
180
$328,000
-0.6%
721
$322,500 $292,500
10.3% $275,000
17.3%
GYMPIE (LGA) ^
105
$420,000
0.7%
462
$415,000 $399,000
4.0% $350,000
18.6%
25
$370,000
7.2%
86
$338,000 $305,000
10.8% $280,750
20.4%
CURRA ^
COOLOOLA COVE
11
$346,000
4.8%
51
$325,000 $325,000
0.0% $266,000
22.2%
GYMPIE
22.9%
DEC-20 LOCALITY L
$/ WEEK
DEC-19
NEW BONDS
$/ WEEK
DEC-15
NEW BONDS
$/ WEEK
NEW BONDS
FRASER COAST REGIONAL
$340
224
$320
266
$290
4650
Maryborough region
$300
72
$280
95
$270
303 127
4655
Hervey Bay/Pialba/Scarness/Urangan
$360
137
$340
158
$310
160
4659
Burrum/Burrum Heads/Howard
$290
13
$300
13
$255
14
GYMPIE REGIONAL
$325
87
$300
157
$275
135
78
$297,500
2.6%
294
$295,000 $270,000
9.3% $240,000
JONES HILL
5
N/A
N/A
26
$375,000 $370,000
1.4%
N/A
N/A
4570
Gympie/Amamoor/Curra/Imbil/Kandanga/ Monkland/Southside/Victory Heights
$328
64
$300
126
$275
110
MONKLAND
1
N/A
N/A
27
$277,000 $243,000
14.0%
N/A
N/A
4580
Cooloola/Tin Can Bay
$335
14
$320
17
$280
15
PIE CREEK ^
3
N/A
N/A
26
$482,500 $436,000
10.7%
N/A
N/A
RAINBOW BEACH
10
$549,000
N/A
36
$474,000 $500,000
-5.2% $397,500
19.2%
4601
Barahmbah/ Boonara/ Booubyjan/ Goomeri/ Goomeribong/ Kinbombi/ Manumbar/ Tansey/ Wrattens Forest
N/A
4
$225
7
N/A
3
SOUTH BURNETT REGIONAL
$270
75
$270
137
$240
125
4605
Barlil
$255
13
$250
21
$220
24
4606
MP Creek
$250
5
$270
8
$210
19
4608
Charlestown
N/A
1
N/A
4
N/A
2
4610
Alice Creek
$285
38
$280
76
$250
58
4615
Barker Creek Flat
$260
15
$250
25
$235
20
SOUTHSIDE
31
$367,500
-8.4%
134
$367,750 $332,500
10.6% $320,000
14.9%
TIN CAN BAY
18
$360,000
10.8%
65
$330,000 $335,000
-1.5% $295,000
11.9%
1
N/A
N/A
19
103
$206,500
8.7%
339
VETERAN ^ SOUTH BURNETT (LGA)
N/A
N/A
N/A
$205,000 $200,000
$417,500
N/A
2.5% $187,250
9.5%
SOUTH BURNETT (LGA) ^
73
$255,000
-10.2%
279
$288,000 $280,000
2.9% $240,000
20.0%
KINGAROY
47
$255,000
9.4%
157
$240,000 $236,750
1.4% $230,000
4.3%
0.8% $370,000
-1.4%
KINGAROY ^
12
$357,500
N/A
40
$365,000 $362,000
MURGON
14
$120,000
N/A
36
$145,000 $120,000
20.8%
$132,500
9.4%
NANANGO
16
$201,500
15.1%
57
$180,000 $180,000
0.0%
$172,500
4.3%
NANANGO ^
7
N/A
N/A
29
$295,000 $260,000
13.5%
N/A
N/A
WONDAI
12
$142,500
N/A
30
$142,500 $185,000
-23.0% $180,000
-20.8%
FRASER COAST LAND SALES Jun-20
Sep-20
Dec-20 *
334
166
RENTAL MARKET - 2 BED UNITS POST CODE
6 $350k+
5
2
2
DEC-19
NEW BONDS
$/ WEEK
DEC-15
NEW BONDS
$/ WEEK
NEW BONDS
FRASER COAST REGIONAL
$280
114
$270
140
$240
Aldershot
$210
21
$205
30
$190
44
4655
Hervey Bay/Pialba/Scarness/Urangan
$298
88
$280
108
$255
120
GYMPIE REGIONAL
$255
33
$235
47
$210
43
4570
Gympie/Amamoor/Curra/Imbil/Kandanga/ Monkland/Southside/Victory Heights
$250
26
$220
28
$199
28
4580
Cooloola/Tin Can Bay
N/A
3
$270
6
$220
7
4581
Rainbow Beach/Inskip
N/A
4
$260
12
$260
7
$230
37
$220
53
$185
50
SOUTH BURNETT REGIONAL
4
$/ WEEK
4650
166
<$350k
DEC-20 LOCALITY L
4605
Barlil
4610
Alice Creek
168
N/A
4
N/A
3
$170
7
$230
25
$220
42
$200
36
7
$500k+
*Preliminary data
REIQ.com
QUEENSLAND MARKET MONITOR • MARCH 2021 | ISSUE 49 REPORTING ON THE DECEMBER QUARTER 2020 | 71
Fraser Coast
SALES MARKET - VACANT LAND <2400M2
ANNUAL ANNUAL QTRLY QTRLY ANNUAL ANNUAL MEDIAN MEDIAN QTRLY 1YR 5YR NO. MEDIAN NO. MEDIAN SALE SALE CHANGE CHANGE CHANGE SALES SALE SALES SALE (1YR (5YRS AGO) AGO)
Bundaberg EMPLOYMENT MARKET WIDE BAY Unemployment Rate
7.5%
Participation Rate
49.6%
HOUSE MARKET (<2400M2)
Annual
Quarter median price
$295,000
Annual median price
$290,000 5yrs
Annual volume of sales
1,347
Annual median price 5yrs ago
$280,000
HOUSE MARKET ALL
Median days on market
50 Days Median vendor discount
-3.5%
Stock on market
7.8%
A Buyer’s Bonanza in Bundaberg… But at a Price Like many regional centres across Queensland, Bundaberg is enjoying a long-awaited uptick in demand. With stock levels remaining tight, the inevitable rise in property values – particularly for detached housing – has arrived. The reopening of borders and rollout of the vaccine have yet to take full effect on the market, but positivity has returned and it’s fuelling growth. According to REIQ Bundaberg Zone Chair, Le-Anne Allan, local agents are being run off their feet, with demand from a variety of buyers. “Out of town buyers – whether they’re in Brisbane, Sunshine Coast, Gold Coast or the southern states – are coming. Some southern-state purchasers were even buying sight unseen only a couple of months ago,” Ms Allan said. “It’s also good to see young buyers are now getting into property. I've heard of stories where rentals are so tight here that there can be 20 or 30 prospective tenants at an open home for a rental. So, when they miss out, what are they doing? They’re buying properties instead.” In terms of the economy, locals are looking forward to tourists coming back to the region. Local operators are gearing up via a number of projects, including one who has opened an on-water hotel for those looking to eat, sleep and stay on the Great Barrier Reef. In addition, the opening of a new RV park at Burnett Heads will help bring the nomadic set to Bundaberg. Locals say many tourists come to the area and then, once the natural joys of the region are discovered, settle in and become residents. It’s yet another source of purchasers for local property. House Market <2400m2 Analysis of both quarterly and annual median price movement indicate Bundaberg’s housing is in the steady sector of the rising phase of its price cycle. Bundaberg’s median house price rose 5.5% in the year to December 2020, coming in at $290,000 based on 1,347 transactions. This was more transactions than at the same time last year which is somewhat surprising in the wake of the pandemic shutdowns. The region’s December quarter 2020 median price was $295,000 based on 341 sales. This was a 0.6% increase on the median price as compared to the previous quarter. These gains are supported by what’s been reported on the ground, with available stock falling while demand remains strong. Total annual house listing numbers fell by 11.7% for the year to November 2020, which continued on from the previous fall of 13.4% for the year to September 2020. Stock on market decreased from 8.9% in 2019 to 7.8% in 2020. And median days on market fell by 8 for the year. This again, continued the downwards trend indicating demand for housing is good to strong. Given these outcomes, there’s little surprise sellers discounted their asking prices by less. The median vendor discount figure fell from -4.6% for the year to November 2019, to -3.5% for the year to November 2020. These numbers mirrored the opinion of local sources who said agents are having trouble getting enough stock to satisfy buyer demand, with increasing incidence of houses achieving above price expectations. Unit Market Analysis of all available data revealed an unusual short-term result for units and townhouses, but the numbers could reflect a rise in demand for prestige apartments in beachside suburbs. The quarterly median price to December 2020 was $307,000, which is a staggering 49.8% increase on last quarter’s result. This indicates Bundaberg units had the strongest quarterly median sale price gain of any jurisdiction by an extraordinarily big margin. Among the most recent data were a number of sales of $1-million-plus, esplanadefront units in Bargara. Given the relatively limited number of actual unit transactions in Bundaberg over the quarter, these standout sales could well have caused the dramatic rise in the median price. Importantly, if you were to adopt the longer-term annual analysis, the annual median for units to December 2020 was $240,000 based on 251 transactions. This reflected a 3.6% fall on last year’s result.
72 | QUEENSLAND MARKET MONITOR • MARCH 2021 | ISSUE 49 REPORTING ON THE DECEMBER QUARTER 2020
REIQ.com
Bundaberg Total listings for the year to November 2020 was 324 representing a whopping 25.3% reduction on last year’s total figure of 434 listings. This result shows why prices have remained buoyant. A dramatic fall in listed days revealed demand outstripped the region’s dwindling supply. Median Days on market for the year to November 2020 was 98 days – a massive 45 days lower than last year’s result. Not surprisingly, vendors firmed on their discounting as well. The year to November 2020 revealed a median discount of -4.4%, compared to the 2019 result of -5.2%.
UNIT MARKET Annual
Quarter median price
$307,000
Annual median price
$240,000
Despite this strong anecdotal evidence, Bundaberg saw the largest quarterly fall in land values across all jurisdiction. This may reflect the volume of older stock recently sold at their original list prices. Now that’s cleared, land values are likely to improve in the near future. Nonetheless, annual land values rose 1.3% to reach $151,000 across 456 sales for the year to December 2020. On the quarterly basis however, the vacant land median fell -12.6% to $135,000 across 95 sales.
5yrs
Annual volume of sales
251
REIQ.com
Vacant Land Market Vacant land has grown in appeal across multiple LGAs in 2020 as government stimulus helped drive demand for new-home construction. Local agents report that a backlog of once-unwanted stock has now sold out, and estates are seeing pre-commitments for new releases.
Annual median price 5 yrs ago
$265,000
Rental Market The November quarter 2020 vacancy rates came in at an extraordinarily low 0.4% which is the same as the previous quarter’s result and is tighter than June 2020 quarter’s vacancy rate of 0.7%. This is the tightest vacancy outcome among the data since at least September 2008. And this low vacancy is being reflected in median rental figures as well. Median annual rent for a three-bedroom house to
QUEENSLAND MARKET MONITOR • MARCH 2021 | ISSUE 49 REPORTING ON THE DECEMBER QUARTER 2020 | 73
Bundaberg
UNIT MARKET Median days on market
98 Days
December 2020 was $325 per week. This was $15 per week higher than the median for the 12-months to September 2020, and $25 more than for the year to December 2019. The median annual rent to December 2020 for a two-bedroom unit was $255 per week which was $15 more per week compared to last year’s median. Median rental yields for houses changed marginally with the November 2020 quarterly yield coming in at 5.7% as compared to the 5.5% result for the previous quarter. In contrast, unit yields tightened dramatically coming back from a 6.6% result in September 2020 quarter to reach 4.3% for the December 2020 quarter.
Median vendor discount
-4.4%
BUNDABERG HOUSE SALES Jun-20
Stock on market
Sep-20
Dec-20 *
298
5.8%
215 175 107
RENTAL MARKET
73
61
26
FOR RENT
51
38
Vacancy Rates
0.4%
<$350K
$350K+
$500k+
*Preliminary data Houses<2400m2
BUNDABERG UNIT SALES
House Yields
Jun-20
5.7%
Sep-20
Dec-20 *
75
46
Unit Yields
34
4.3%
8
“Out of town buyers – whether they’re in Brisbane, Sunshine Coast, Gold Coast or the southern states – are coming. Some southernstate purchasers were even buying site unseen only a couple of months ago,” Ms Carter said.
<$350K
10
9 2
$350K+
12
8
$500k+
*Preliminary data
BUNDABERG LAND SALES Jun-20
Sep-20
Dec-20 *
282
148
144
4 <$350k
8 $350k+
13
2
5
4
$500k+
*Preliminary data
74 | QUEENSLAND MARKET MONITOR • MARCH 2021 | ISSUE 49 REPORTING ON THE DECEMBER QUARTER 2020
REIQ.com
SUBURB/LGA
BUNDABERG (LGA)
ANNUAL ANNUAL QTRLY QTRLY ANNUAL ANNUAL MEDIAN MEDIAN QTRLY 1YR 5YR NO. MEDIAN NO. MEDIAN SALE SALE CHANGE CHANGE CHANGE SALES SALE SALES SALE (1YR (5YRS AGO) AGO)
341
BUNDABERG (LGA) ^
92
AVENELL HEIGHTS
13
$295,000 $392,500 $250,000
0.6% 7.5% -3.5%
1347 423 73
$290,000 $275,000 $365,000 $355,000 $252,000 $265,000
5.5% $280,000 2.8% $333,000
3.6% 9.6%
-4.9% $280,000
-10.0%
AVOCA
15
$292,500
0.0%
65
$292,000 $287,000
1.7% $302,000
-3.3%
BARGARA
36
$442,000
15.4%
187
$402,500 $389,500
3.3% $385,000
4.5%
BRANYAN
4
N/A
N/A
26
$298,500
N/A
N/A
N/A
-1.8% $370,000
18.9%
N/A
BRANYAN ^
6
N/A
N/A
44
$440,000 $448,250
BUCCA ^
7
N/A
N/A
26
$345,000
BUNDABERG EAST
10
$325,000
N/A
38
$262,500 $255,000
BUNDABERG NORTH
15
$247,000
-0.8%
65
$237,000 $226,500
4.6% $220,000
7.7%
BUNDABERG SOUTH
13
$215,000
8.3%
53
$230,000
9.0% $246,000
-6.5%
N/A
$211,000
N/A
N/A
N/A
2.9% $246,250
6.6%
ANNUAL ANNUAL QTRLY QTRLY ANNUAL ANNUAL MEDIAN MEDIAN QTRLY 1YR 5YR NO. MEDIAN NO. MEDIAN SALE SALE CHANGE CHANGE CHANGE SALES SALE SALES SALE (1YR (5YRS AGO) AGO)
SUBURB/LGA
BUNDABERG (LGA)
55
$307,000
49.8%
251
$240,000 $249,000
-3.6% $265,000
-9.4%
BARGARA
20
$448,750
70.6%
83
$343,500 $367,500
-6.5% $317,500
8.2%
7
N/A
N/A
34
$168,500 $188,750
BUNDABERG NORTH
-10.7%
N/A
N/A
SALES MARKET - VACANT LAND <2400M2 SUBURB/LGA
ANNUAL ANNUAL QTRLY QTRLY ANNUAL ANNUAL MEDIAN MEDIAN QTRLY 1YR 5YR NO. MEDIAN NO. MEDIAN SALE SALE CHANGE CHANGE CHANGE SALES SALE SALES SALE (1YR (5YRS AGO) AGO)
BUNDABERG (LGA)
95
$135,000
-12.6%
456
$151,000 $149,000
1.3% $145,000
4.1%
BUNDABERG (LGA) ^
70
$157,250
16.5%
270
$140,000 $150,000
-6.7% $149,000
-6.0%
BARGARA
8
N/A
N/A
52
$164,000 $175,000
-6.3% $172,500
-4.9%
1
N/A
N/A
51
$150,000 $155,000
-3.2% $145,000
3.4%
6
N/A
N/A
55
$165,000 $167,000
-1.2% $130,000
26.9% -12.2%
BUNDABERG WEST
9
N/A
N/A
27
$242,000 $226,250
7.0% $247,250
-2.1%
BRANYAN
BURNETT HEADS
19
$358,000
2.1%
62
$345,000 $288,500
19.6% $290,000
19.0%
INNES PARK
CHILDERS
10
$213,750
N/A
35
$227,500
N/A
N/A
MOORE PARK BEACH
10
$110,000
-17.8%
35
$126,500
N/A
N/A $144,000
CORAL COVE
14
$405,500
4.0%
42
$420,500 $381,000
10.4% $399,750
5.2%
WOODGATE
23
$140,000
12.4%
59
$148,000
N/A
N/A
N/A
N/A
ELLIOTT HEADS
9
N/A
N/A
28
$305,500 $320,000
-4.5% $293,250
4.2%
SURROUNDS
INNES PARK
9
N/A
N/A
35
$350,000 $365,000
-4.1% $353,000
-0.8%
NORTH BURNETT (LGA)
7
N/A
N/A
35
$15,500
$20,000
-22.5%
N/A
N/A
KALKIE
9
N/A
N/A
48
$367,500 $330,000
11.4% $360,000
2.1%
KEPNOCK
16
$296,500
-2.8%
75
$265,000 $261,500
1.3% $263,500
0.6%
NORTH BURNETT (LGA) ^
11
$89,000
54.8%
42
$72,500
N/A
N/A
N/A
N/A
N/A
N/A
MILLBANK
9
N/A
N/A
36
$242,750 $227,500
6.7% $240,000
1.1%
MOORE PARK BEACH
10
$300,000
N/A
36
$298,750 $300,000
-0.4% $272,500
9.6%
MOORE PARK BEACH ^
7
N/A
N/A
31
$455,000 $383,750
18.6%
N/A
N/A
20
$250,000
N/A
59
$250,000 $230,000
8.7%
$219,500
13.9%
NORVILLE SVENSSON HEIGHTS
11
$264,000
-0.4%
59
$250,000 $235,000
6.4% $259,000
-3.5%
THABEBAN
12
$272,000
N/A
42
$269,000 $238,300
12.9% $269,000
0.0%
WALKERVALE WOODGATE
14 24
$218,000 $441,250
1.2% 5.7%
53 72
$218,000 $210,000 $420,000 $385,000
3.8% $228,000 9.1% $385,000
-4.4% 9.1%
SURROUNDS NORTH BURNETT (LGA)
21
$135,000
9.3%
96
$127,500 $125,000
2.0% $150,000 -15.0%
NORTH BURNETT (LGA) ^
8
N/A
N/A
41
$250,000 $250,000
0.0% $249,000
0.4%
RENTAL MARKET - 3 BED HOUSES POST CODE
DEC-20 LOCALITY L
$/ WEEK
DEC-19
NEW BONDS
$/ WEEK
DEC-15
NEW BONDS
$/ WEEK
NEW BONDS
BUNDABERG REGIONAL
$325
219
$300
293
$280
368
4660
Apple Tree Creek/Childers/Woodgate
$300
27
$300
21
$280
34
4670
Bundaberg/Avoca/Bargara/Burnett Heads/Innes Park/Kepnock/Millbank/Thabeban
$330
182
$310
256
$285
318
4671
Gin Gin/Mount Perry
$300
9
$280
16
$240
16
NORTH BURNETT REGIONAL
$250
31
$240
29
$220
47 15
4625
Aranbanga
$255
16
$250
14
$250
4626
Beeron
$250
5
$258
6
$220
11
4630
Bancroft
N/A
3
$185
6
$200
13
RENTAL MARKET - 2 BED UNITS POST CODE
4670
DEC-20 LOCALITY L
$/ WEEK
DEC-19
NEW BONDS
$/ WEEK
DEC-15
NEW BONDS
$/ WEEK
NEW BONDS
BUNDABERG REGIONAL
$255
123
$240
151
$230
157
Bundaberg, Avoca, Bargara, Burnett Heads, Innes Park, Kepnock, Millbank, Thabeban
$258
118
$240
143
$230
147
RENTAL MARKET - 3 BED TOWNHOUSES POST CODE
4670
REIQ.com
DEC-20 LOCALITY L
$/ WEEK
DEC-19
NEW BONDS
$/ WEEK
DEC-15
NEW BONDS
$/ WEEK
NEW BONDS
BUNDABERG REGIONAL
$360
5
$330
9
$290
9
Bundaberg/Avoca/Bargara/Burnett Heads/Innes Park/Kepnock/Millbank/Thabeban
$360
5
$330
8
$290
9
QUEENSLAND MARKET MONITOR • MARCH 2021 | ISSUE 49 REPORTING ON THE DECEMBER QUARTER 2020 | 75
Bundaberg
SALES MARKET - UNITS & TOWNHOUSES
SALES MARKET - HOUSES <2400m2
Gladstone EMPLOYMENT MARKET FITZROY Unemployment Rate
5.6%
Participation Rate
68.9%
HOUSE MARKET (<2400M2)
Annual
Quarter median price
Annual median price
$325,000 $300,000 5yrs
Annual volume of sales
836
Annual median price 5yrs ago
$365,000
The Gladstone median house price has skyrocketed 9.1% over the year ending December 2020 – second only to Noosa for house price growth over the period.
Gladstone Market Kicks Up Another Gear It wasn’t that long ago that the Gladstone property market was seen as one that was best to give a wide berth for everyone but local residents. As they say, what a difference a year makes. That is, over the past 12 months, property prices in the region have kicked up a couple of gears in quick succession to be one of the best performing in the State. Indeed, local agents say that market conditions are the best they have experienced since about 2012. The Gladstone median house price has skyrocketed 9.1% over the year ending December 2020 – second only to Noosa for house price growth over the period. Likewise, the region’s unit market is also showing signs of recovery, with prices starting to increase as well as demand. Sales of vacant land as well as prices have also skyrocketed over the past year, recording a median price increase of 18% over the period. And what about Gladstone’s rental market? Like the rest of the state, it’s also struggling with a significant undersupply of properties that’s resulting in weekly rents jumping up by more than 20% over the year in some instances. House Market <2400m2 There’s no question that the Gladstone housing market is well into its next market cycle with its fourth quarter of median price growth recorded at the end of last year. Not only did the region record a median house price increase of 9.1% over the year ending December 2020 – the second highest in the state behind Noosa – it was also one of the top performers over the quarter as well. In fact, the Gladstone median house price soared 7.1% over the December quarter to be $325,000. Supply remains a major problem in Gladstone with most properties selling very quickly. But, even with an undersupply of listings, time-poor locals are still being selective about what they purchase, according to REIQ Gladstone Zone Chair Alicia Williams, who commented, “There is a property that is probably the cheapest on the market in Gladstone, but no one’s looking at it. They don’t want to do the work because they’re so time-poor.” The region’s economy is strong with low unemployment as well as new hydrogen and aluminium projects recently announced. However, the construction sector, and many industries generally, are crying out for workers because many residents had moved into the resources and other sectors when times were less economically favourable. Unit Market With the most affordable unit market of any major region in the state, it was only a matter of time before this much maligned segment of the market started to make some improvements. Well, it’s certainly achieved that over the December 2020 quarter, with the Gladstone median unit price increasing 20% to $210,000. Over the year, the median unit price posted a marginal price fall of -1.0%, with the next round of data very likely to show a positive result over the year. Homebuyers and investors are starting to see value in the region’s unit market from an affordable price point as well as yield perspective. Some buyers are tipping their cash into unit stock rather than leaving it in the bank, with interest rates so low. Some recent unit sales in Gladstone had been above agent price expectations, which is a fairly novel turn of affairs over recent years. Vacant Land Market If vacant land had legs in Gladstone, it would have worked itself out the door over the past year with sales soaring over the period! The number of vacant land sales in Gladstone has literally skyrocketed by a staggering 165% over the year ending December 2020. This massive jump in volume has also pushed the median price of vacant land up by 18% over the year to land at $120,990 – a price that still remains below what was being achieved five years ago.
76 | QUEENSLAND MARKET MONITOR • MARCH 2021 | ISSUE 49 REPORTING ON THE DECEMBER QUARTER 2020
REIQ.com
Gladstone HOUSE MARKET ALL
Median days on market
60 Days Median vendor discount
-4.5%
Stock on market
7.8%
REIQ.com
One challenge with vacant land has been the reluctance of buyers to purchase sloping blocks due to the skills shortage in the region. With the construction sector running at full speed, finding the trades to complete a building project is difficult at the best of times, let alone when the site may be seen as a bit warty. Given the sharp increase in demand for vacant land, there are very few lots still available for sale, with only one estate listed for sale on online property portals at present. Rental Market The Gladstone rental market is experiencing the tightest conditions for the best part of 10 years. Its residential vacancy rate for December was just 0.9% – a result that is reflective of a critical undersupply of rental properties. With the region having welcomed plenty of new residents over the past year, the rental sector has not been able to keep up with demand. That said, the region’s less than impressive property market over recent years meant investor activity was subdued as well as building approvals. The pandemic is just another element to add to the undersupply of rental property in the region, which unfortunately is not a situation that’s likely to reverse anytime soon. The lack of supply is causing rents to significantly increase across the region with the weekly rent for a two-bedroom unit jumping 22.2% to $220 over the year ending December. The median weekly rent for a three-bedroom house soared 18.8% to $285 per week over the same period. These types of sharp increases in rents are resulting in healthy gross rental yields for investors with the gross rental yield for a house in Gladstone at 4.6% in December. However, the gross rental yield of a unit reduced to 5.4% at the same time – the reason being the spike in the median unit price over the quarter.
QUEENSLAND MARKET MONITOR • MARCH 2021 | ISSUE 49 REPORTING ON THE DECEMBER QUARTER 2020 | 77
Gladstone
GLADSTONE HOUSE SALES
UNIT MARKET
Jun-20
Sep-20
Dec-20 *
170
Annual 127
123
80 59
Annual median price
Quarter median price
$178,200
$210,000
34 12 <$350K
$350K+
23
21
$500k+
*Preliminary data Houses<2400m2
5yrs
GLADSTONE UNIT SALES Jun-20
Annual volume of sales
Dec-20 *
45
Annual median price 5 yrs ago
158
Sep-20
40
$253,000
25
7
UNIT MARKET
1
0 <$350K
1
0
$350K+
2
$500k+
*Preliminary data
Median days on market
86 Days
GLADSTONE LAND SALES Jun-20
Median vendor discount
Sep-20
Dec-20 *
144
-5.4%
72
Stock on market
6.0%
47
5
0 <$350k
$350k+
5
1
2
2
$500k+
*Preliminary data
RENTAL MARKET
FOR RENT
Vacancy Rates
0.9% House Yields
4.6% Unit Yields
5.4% 78 | QUEENSLAND MARKET MONITOR • MARCH 2021 | ISSUE 49 REPORTING ON THE DECEMBER QUARTER 2020
REIQ.com
SUBURB/LGA
ANNUAL ANNUAL QTRLY QTRLY ANNUAL ANNUAL MEDIAN MEDIAN QTRLY 1YR 5YR NO. MEDIAN NO. MEDIAN SALE SALE CHANGE CHANGE CHANGE SALES SALE SALES SALE (1YR (5YRS AGO) AGO)
SUBURB/LGA
ANNUAL ANNUAL QTRLY QTRLY ANNUAL ANNUAL MEDIAN MEDIAN QTRLY 1YR 5YR NO. MEDIAN NO. MEDIAN SALE SALE CHANGE CHANGE CHANGE SALES SALE SALES SALE (1YR (5YRS AGO) AGO)
209
$325,000
7.1%
836
$300,000 $275,000
9.1% $365,000 -17.8%
GLADSTONE (LGA)
49
$118,490
-6.0%
167
$120,990 $102,500
18.0% $185,000
-34.6%
GLADSTONE (LGA) ^
50
$398,500
3.5%
235
$389,000 $406,000
-4.2% $442,500 -12.1%
GLADSTONE (LGA) ^
31
$185,000
31.2%
140
$160,000 $155,000
3.2% $165,000
-3.0%
AGNES WATER
23
$380,000
-5.0%
71
$410,000 $412,500
-0.6%
AGNES WATER
16
$157,500
15.4%
58
$136,500
N/A
N/A
N/A
AGNES WATER ^
12
$292,500
-24.0%
56
AGNES WATER ^
8
N/A
N/A
48
$155,000
N/A
N/A
N/A
N/A
BOYNE ISLAND
19
$355,000
18.3%
KIRKWOOD
7
N/A
N/A
26
$105,000
N/A
N/A
$191,000
-45.0%
GLADSTONE (LGA)
$412,500
-0.6%
$335,500 $310,000
8.2% $325,000
3.2%
81
$335,000 $285,000
17.5% $385,000
-13.0% -24.2%
CALLIOPE
4
N/A
N/A
45
$273,000 $255,000
7.1% $360,000
CLINTON
19
$300,000
11.5%
79
$295,000 $257,000
14.8% $349,000
-15.5%
GLEN EDEN
10
$268,500
N/A
38
$277,000 $269,250
2.9% $362,000
-23.5%
KIN KORA
15
$290,000
7.4%
38
$262,500 $250,000
5.0% $329,000
-20.2%
KIRKWOOD
5
N/A
N/A
51
$345,000 $310,000
11.3% $424,000
-18.6%
28
$343,000
-0.6%
88
$333,500 $292,500
14.0% $388,250
-14.1%
NEW AUCKLAND SOUTH GLADSTONE
7
N/A
N/A
49
$268,000 $258,000
3.9% $338,500
-20.8%
TANNUM SANDS
29
$380,000
8.0%
81
$373,000 $370,000
0.8% $430,000
-13.3%
TELINA
10
$310,500
N/A
31
$290,000 $280,000
3.6% $410,000
-29.3%
WEST GLADSTONE
12
$289,500
31.6%
72
$220,000 $209,500
5.0% $270,000
-18.5%
SURROUNDS BANANA (LGA)
39
$170,000
6.6%
133
$170,000 $165,000
4
N/A
N/A
20
$447,500 $285,000
BILOELA
22
$205,000
-18.7%
70
MOURA
7
N/A
N/A
28
BANANA (LGA) ^
3.0% $239,000 -28.9% 57.0%
N/A
N/A
$225,500 $240,000
-6.0% $285,000
-20.9%
$155,000 $120,000
29.2%
N/A
N/A
RENTAL MARKET - 3 BED HOUSES POST CODE
GLADSTONE (LGA)
50
$210,000
20.0%
158
$178,200 $180,000
-1.0% $253,000
-29.6%
AGNES WATER
20
$317,500
27.0%
40
$292,500 $285,000
2.6% $275,000
6.4%
6
N/A
N/A
23
$165,000
N/A
N/A
GLADSTONE CENTRAL
N/A
N/A
$/ WEEK
DEC-19
NEW BONDS
$/ WEEK
DEC-15
NEW BONDS
$/ WEEK
NEW BONDS
GLADSTONE REGIONAL
$285
141
$240
217
$260
231
Agnes Water/Miriam Vale
$340
6
$330
20
$300
20
4680
Gladstone/Boyne Island/Clinton/New Auckland/Kin Kora/ Tannum Sands
$283
132
$240
193
$260
206
BANANA SHIRE
$275
40
$280
43
$300
47
4715
Biloela
$340
16
$305
20
$310
25
4718
Bauhinia
$240
18
$280
19
$250
20
4719
Camboon/ Cracow/ Glemoral/ Isla/ Lonesome Creek/ Theodore
N/A
1
N/A
3
N/A
1
RENTAL MARKET - 2 BED UNITS
SALES MARKET - UNITS & TOWNHOUSES SUBURB/LGA
DEC-20 LOCALITY L
4677
POST CODE
ANNUAL ANNUAL QTRLY QTRLY ANNUAL ANNUAL MEDIAN MEDIAN QTRLY 1YR 5YR NO. MEDIAN NO. MEDIAN SALE SALE CHANGE CHANGE CHANGE SALES SALE SALES SALE (1YR (5YRS AGO) AGO)
N/A
DEC-20 LOCALITY
L
$/ WEEK
DEC-19
NEW BONDS
$/ WEEK
DEC-15
NEW BONDS
$/ WEEK
NEW BONDS
GLADSTONE REGIONAL
$220
162
$180
205
$200
198
4677
Agnes Water/Miriam Vale
$270
9
$270
5
$153
10
4680
Gladstone/Boyne Island/Clinton/New Auckland/Kin Kora/ Tannum Sands
$220
153
$180
199
$200
187
BANANA SHIRE
$250
11
$265
18
$250
13
Biloela
$275
8
$270
17
$270
9
4715
RENTAL MARKET - 3 BED TOWNHOUSES POST CODE
DEC-20 LOCALITY L
GLADSTONE REGIONAL
REIQ.com
4677
Agnes Water/Miriam Vale
4680
Gladstone/Boyne Island/Clinton/New Auckland/Kin Kora/ Tannum Sands
$/ WEEK
DEC-19
NEW BONDS
$/ WEEK
DEC-15
NEW BONDS
$/ WEEK
NEW BONDS
$280
78
$240
94
$280
89
N/A
1
N/A
4
N/A
1
$280
76
$240
90
$280
88
QUEENSLAND MARKET MONITOR • MARCH 2021 | ISSUE 49 REPORTING ON THE DECEMBER QUARTER 2020 | 79
Gladstone
SALES MARKET - VACANT LAND <2400M2
SALES MARKET - HOUSES <2400m2
Rockhampton EMPLOYMENT MARKET FITZROY Unemployment Rate
5.6%
Participation Rate
68.9%
HOUSE MARKET (<2400M2)
Annual
Quarter median price
Annual median price
$287,250 $275,000 5yrs
Annual volume of sales
1,301
Annual median price 5yrs ago
$290,000
The machinations of postpandemic supply and demand combined with infrastructure projects, job opportunities and lifestyle factors have all resulted in driving the market to new heights in Rockhampton.
Rockhampton’s Riding High!
When we last spoke with REIQ Rockhampton Zone Chair Noel Livingston in the previous issue of the Queensland Market Monitor, he could barely contain his enthusiasm for Rockhampton’s real estate in the pandemic year. Back then he informed us, “2020 is the best property year we’ve had in ages… I hope 2021 is the same.” Well, it looks like Livingston got his wish. The machinations of post-pandemic supply and demand combined with infrastructure projects, job opportunities and lifestyle factors have all resulted in driving the market to new heights in Rockhampton. “A lot of jobs have been created here. A significant upgrade of the Shoalwater Bay Army Base is having had a major impact. The ring road has just started, and the first stage of the Rookwood Weir water project is about to kick off next month,” explained Livingston more recently. “We’ve also got a strong cattle market – and we’re the beef capital of the country, so we’re getting significant investment from out west as well. And, the beach has a fair bit to do with it too. We have migration to our coast here from southerners looking to resettle.” Livingston further commented that the buyer base for Rockhampton real estate was diverse and included ‘out of towners,’ local upgraders and downsizers, first homebuyers and investors. “There’s low stock in both sales and rentals right across the board at the moment.” House Market <2400m2 Rockhampton’s house market continued to strengthen in 2020 with a rise in both annual and quarterly median values. The December 2020 quarterly median house price rose 4.5% to reach $287,250 across 302 sales. For the 12-months to December 2020, houses recorded a median sale price of $275,000 – which is a 3.8% increase on the previous year – across 1,301 transactions. But while Rockhampton home values are improving, they have potential to go further based on historic results. Five years ago, the median house price sat at $290,000. That means the current house price is 5.2% lower than it was in 2015. The data also indicated while stock levels remained fairly constant throughout 2020, there was a slight increase in demand that led to less negotiation on price by sellers and lower days on the market before sale. The total number of house listings in Rockhampton for the 12 months to September 2020 was 2,110, which was a minor -1.3% drop on the previous year’s 2,138 listings. Stock on market for the period was 7.1% which was only just lower than last year’s 7.2% result. The median vendor discount for the 12 months to November 2020 was 4.9% which is less than the 6.7% outcome to November 2019. Median days on market for the 12-month period was 55 – a small fall on the previous year’s result of 66. Unit Market Attached housing in Rockhampton is relatively rare. There are a few developments, but it lacks comprehensive volume of stock so very few transactions each quarter can make the short-term stats unreliable. That said, industry sources suggest unit stock is quickly sold when it hits the market at present. But increases in values are yet to substantially filter through to the analysis. The data reveals that the 12-month median unit price dropped by -5.6% to $249,000 across 122 sales while the data also showed supply tightened, which bodes well for future price increases in attached housing. The total number of unit listings in Rockhampton for the 12 months to November 2020 was 238 – a minor -2.1% decrease on the previous 12-month period, which had 243 listings. Stock on Market for the period was 5.0% which was mildly tighter than the 5.1% result for the year to November 2019. Meanwhile, median days on market fell across the year. The 12 months to November 2020 recorded a 101-day median, while the previous year saw 135 days. The annual median vendor discount to May 2020 was -6.0%, which was substantially tighter than the previous year’s figure of -9.8%.
80 | QUEENSLAND MARKET MONITOR • MARCH 2021 | ISSUE 49 REPORTING ON THE DECEMBER QUARTER 2020
REIQ.com
Gladstone REIQ.com
QUEENSLAND MARKET MONITOR • MARCH 2021 | ISSUE 49 REPORTING ON THE DECEMBER QUARTER 2020 | 81
Rockhampton HOUSE MARKET ALL Median days on market
55 Days Median vendor discount
-4.9%
Stock on market
7.1%
Vacant Land Market Vacant land prices strengthened throughout the year, although the region isn’t really known for large-scale subdivision, so transaction numbers are limited. Despite this, anecdotal evidence is positive. Livingston highlighted a couple of smaller thirty-to-forty lot subdivisions in Rockhampton recently sold out prior to titles being issued. This indicates demand is outstripping the vacant land supply. The vacant land median of $163,500 to December 2020 was a 2.2% increase on the previous year’s result while on a quarterly measure, the $119,000 median to December 2020 is a massive -23.7% fall on the previous quarter’s median price. That said, this median was recorded across only 17 transactions and, as such, would be considered statistically unreliable. Rental Market Rising property prices have resulted in lower available rental stock and long-term investors who had rented out homes while waiting for the market to improve were now cashing in their assets. As such, there’s a shrinking supply of rental stock at a time when demand is strong. The inevitable outcome is rising rents and multiple applications when property becomes available. The vacancy rate for the December 2020 quarter was an extraordinarily tight 0.3%. This followed on from the previous quarter’s figure of 0.3%, and the quarter prior which was 0.4%. This run demonstrates how entrenched low vacancy is in Rockhampton. Median rent for a three-bedroom house in the year to December 2020 was $330 per week – up a substantial $40 on the previous year’s result, while for two-bedroom units, the annual median was $250 per week – a rise of $28 per week based on the previous year’s result. These improved conditions could, of course, stimulate further investor demand. Given the low interest rates and excellent economic prospects for Rockhampton, relatively affordable property with good rental potential could see even more demand over the coming months.
82 | QUEENSLAND MARKET MONITOR • MARCH 2021 | ISSUE 49 REPORTING ON THE DECEMBER QUARTER 2020
REIQ.com
RENTAL MARKET
ROCKHAMPTON & LIVINGSTONE HOUSE SALES Jun-20
Vacancy Rates
0.3%
Dec-20 *
339
Rockhampton
FOR RENT
Sep-20
270
254
169
House Yields
115
103
99
6.0%
68
52
<$350K
$350K+
$500k+
*Preliminary data Houses<2400m2
Unit Yields
5.2%
ROCKHAMPTON & LIVINGSTONE UNIT SALES Jun-20
Sep-20
Dec-20 *
58 51
UNIT MARKET 27
Annual
14
14
7
<$350K
6
4 $350K+
5
$500k+
*Preliminary data
Annual median price
Quarter median price
ROCKHAMPTON & LIVINGSTONE LAND SALES
$249,000
$248,000
Jun-20
Sep-20
Dec-20 *
163 141
5yrs 74
Annual volume of sales
Annual median price 5 yrs ago
122
$347,750
6 <$350k
11 $350k+
8
5
1
6
$500k+
*Preliminary data
UNIT MARKET Median days on market
101 Days Median vendor discount
-6.0%
Stock on market
5.0% REIQ.com
QUEENSLAND MARKET MONITOR • MARCH 2021 | ISSUE 49 REPORTING ON THE DECEMBER QUARTER 2020 | 83
SALES MARKET - HOUSES <2400m2 SUBURB/LGA
SALES MARKET - VACANT LAND <2400M2
Rockhampton
ANNUAL ANNUAL QTRLY QTRLY ANNUAL ANNUAL MEDIAN MEDIAN QTRLY 1YR 5YR NO. MEDIAN NO. MEDIAN SALE SALE CHANGE CHANGE CHANGE SALES SALE SALES SALE (1YR (5YRS AGO) AGO)
ROCKHAMPTON (LGA)
302
ROCKHAMPTON (LGA) ^
21
$287,250
4.5%
$380,000
3.4%
1301
$275,000 $265,000
119
$380,000 $355,000
3.8% $290,000
-5.2%
7.0% $382,500
-0.7% -8.8%
ROCKHAMPTON (LGA)
17
$119,000
-23.7%
151
$163,500 $160,000
2.2% $164,500
-0.6%
ROCKHAMPTON (LGA) ^
13
$185,000
42.3%
56
$185,000 $147,000
25.9% $202,500
-8.6%
NORMAN GARDENS
3
N/A
N/A
56
$167,500 $157,000
6.7% $170,000
-1.5%
PARKHURST
4
N/A
N/A
44
$183,400 $183,450
0.0% $165,000
11.2%
SURROUNDS
ALLENSTOWN
15
$238,000
-11.0%
54
$237,000 $210,000
12.9% $260,000
BERSERKER
35
$245,000
3.2%
130
$219,000 $185,000
18.4%
$217,500
0.7%
LIVINGSTONE (LGA)
42
$180,000
5.6%
208
$174,000 $169,750
2.5% $170,000
2.4%
DEPOT HILL
4
N/A
N/A
26
$132,500
N/A
N/A
N/A
LIVINGSTONE (LGA) ^
16
$232,500
3.3%
114
$235,000 $240,000
-2.1% $215,000
9.3%
INVERNESS ^
0
N/A
N/A
20
$255,000
N/A
N/A
LAMMERMOOR
3
N/A
N/A
33
$189,000 $182,000
3.8% $165,000
14.5%
N/A
FRENCHVILLE
27
$325,000
-0.6%
157
$325,000 $316,000
2.8% $318,000
GRACEMERE
47
$290,000
5.5%
183
$270,000 $255,000
5.9%
$311,000
N/A
N/A
N/A
4.2% $315,000
-7.1%
N/A
2.2% -13.2%
GRACEMERE ^
5
N/A
N/A
22
$455,000
KAWANA
15
$296,500
-3.3%
61
$292,750 $281,000
KOONGAL
24
$245,000
-16.9%
73
$246,500 $208,750
MOUNT MORGAN
12
$114,500
N/A
54
$112,000
NORMAN GARDENS
36
$410,000
5.1%
164
$395,000 $375,000
5.3% $389,000
1.5%
PARK AVENUE
15
$265,000
26.9%
77
$220,000 $233,500
-5.8% $253,000
-13.0%
PARKHURST
10
$443,750
25.4%
49
$445,000 $342,500
29.9%
N/A
N/A
ROCKHAMPTON CITY
8
N/A
N/A
31
$154,000 $160,000
-3.8% $215,000
-28.4%
ROCKYVIEW ^
6
N/A
N/A
28
$588,500 $508,000
15.8%
$88,000
18.1% $230,000
7.2%
27.3% $107,500
4.2%
N/A
N/A
PACIFIC HEIGHTS
N/A
N/A
5
N/A
N/A
27
$140,000 $140,000
0.0%
N/A
N/A
YEPPOON
10
$237,500
N/A
41
$184,000 $183,000
0.5% $176,950
4.0%
ZILZIE
11
$110,000
N/A
32
$107,000
N/A $159,000
-32.7%
N/A
RENTAL MARKET - 3 BED HOUSES POST CODE
DEC-20 LOCALITY L
$/ WEEK
DEC-19
NEW BONDS
$/ WEEK
DEC-15
NEW BONDS
$/ WEEK
NEW BONDS
THE RANGE
21
$336,500
-12.6%
102
$375,000 $375,000
0.0% $365,000
2.7%
ROCKHAMPTON REGIONAL
$330
182
$290
243
$290
238
WANDAL
20
$340,000
19.3%
93
$320,000 $265,000
20.8% $300,000
6.7%
8
N/A
N/A
27
$240,000 $235,000
2.1% $241,000
-0.4%
4700
Allenstown/Depot Hill/Great Keppel Is/ Rockhampton/Wandal
$325
84
$300
85
$275
81
4701
Central Qld Uni/ Frenchville/ Kalka/ Koongal/ Lakes Ck/ Nerimbera/ Nth Rockhampton/ Oasis Gardens/ Pk Avenue PO/Rockhampton
$350
89
$290
143
$300
146
4714
Mount Morgan
$220
8
$220
15
$230
10
LIVINGSTONE SHIRE
$370
79
$310
131
$300
166
4702
Ambrose/Banana/Baralaba/Gindie/Gracemere/ Jericho/Keppel Sands/SaphireStanwell/Rubyvale/ Westwood/Woorabinda/Wowan/Yaraka
$328
28
$280
55
$280
62
4703
Bayfield/Bungundarra/Byfield/Cooee Bay/ Farnborough/Kemp Bch/Kinka Bch/Lammermoor Bch/Statute Bay/Taranganba/Woodbury/Yeppoon
$380
43
$360
56
$330
81
4710
Emu park/Zilzie
$360
7
$310
19
$300
23
CENTRAL HIGHLANDS REGIONAL
$298
116
$273
156
$200
140
4717
Blackwater
$280
60
$210
70
$200
93
4720
Emerald
$350
39
$300
69
$250
32
WEST ROCKHAMPTON SURROUNDS CENTRAL HIGHLANDS (LGA)
68
CENTRAL HIGHLANDS (LGA) ^
8
N/A
N/A
58
$462,000 $497,500
-7.1% $370,000
24.9%
BLACKWATER
13
$125,000
-7.4%
67
$130,000 $130,000
0.0% $150,000
-13.3%
EMERALD
52
$295,000
-9.2%
213
$320,000 $290,000
10.3% $250,000
28.0%
EMERALD
5
N/A
N/A
35
$500,000 $535,000
-6.5% $445,000
12.4%
157
$420,000
8.5%
618
$400,000 $380,000
5.3% $382,500
4.6%
LIVINGSTONE (LGA) ^
34
$505,000
-1.0%
179
$540,000 $470,000
14.9% $473,750
14.0%
BARLOWS HILL
1
N/A
N/A
18
LIVINGSTONE (LGA)
$260,000
2.0%
305
$260,000 $237,000
N/A
9.7% $206,000
N/A
N/A
N/A
26.2%
N/A
COOEE BAY
4
N/A
N/A
27
$380,000 $355,000
7.0%
N/A
N/A
EMU PARK
9
N/A
N/A
44
$340,000 $320,000
6.3%
$361,250
-5.9%
LAMMERMOOR
15
$491,500
11.7%
69
$472,000 $425,000
11.1%
$412,500
14.4%
MULAMBIN
4
N/A
N/A
24
$431,000
N/A
N/A
N/A
N/A
PACIFIC HEIGHTS
8
N/A
N/A
29
$507,000
N/A
N/A
N/A
N/A
TARANGANBA
22
$420,000
16.3%
62
$380,000 $376,000
1.1% $426,500
-10.9%
TAROOMBALL
2
N/A
N/A
30
$459,500 $414,500
10.9%
N/A
RENTAL MARKET - 2 BED UNITS POST CODE
41
$405,000
13.8%
143
$390,000 $365,000
6.8% $380,000
2.6%
ZILZIE
27
$355,000
-2.3%
88
$345,000 $330,000
4.5% $375,000
-8.0%
ROCKHAMPTON (LGA)
ANNUAL ANNUAL QTRLY QTRLY ANNUAL ANNUAL MEDIAN MEDIAN QTRLY 1YR 5YR NO. MEDIAN NO. MEDIAN SALE SALE CHANGE CHANGE CHANGE SALES SALE SALES SALE (1YR (5YRS AGO) AGO)
32
$248,000
-0.1%
122
$249,000 $263,750
-5.6% $347,750
DEC-19
NEW BONDS
$/ WEEK
DEC-15
NEW BONDS
$/ WEEK
NEW BONDS
ROCKHAMPTON REGIONAL
$250
148
$223
138
$220
183
4700
$270
41
$245
48
$235
48
4701
Central Qld Uni/ Frenchville/ Kalka/ Koongal/ Lakes Ck/ Nerimbera/ Nth Rockhampton/ Oasis Gardens/ Pk Avenue PO/Rockhampton
$250
107
$220
88
$220
135
LIVINGSTONE SHIRE
$305
36
$300
74
$269
79
4702
Ambrose/Banana/Baralaba/Gindie/Gracemere/ Jericho/Keppel Sands/SaphireStanwell/Rubyvale/ Westwood/Woorabinda/Wowan/Yaraka
$273
6
N/A
4
$200
13
4703
Bayfield/Bungundarra/Byfield/Cooee Bay/ Farnborough/Kemp Bch/Kinka Bch/Lammermoor Bch/Statute Bay/Taranganba/Woodbury/Yeppoon
$315
28
$300
69
$300
64
CENTRAL HIGHLANDS REGIONAL
$240
62
$220
62
$175
66
SALES MARKET - UNITS & TOWNHOUSES SUBURB/LGA
$/ WEEK
Allenstown/Depot Hill/Great Keppel Is/ Rockhampton/Wandal
N/A
YEPPOON
DEC-20 LOCALITY L
-28.4%
SURROUNDS
4717
Blackwater
$198
10
$165
9
$150
12
CENTRAL HIGHLANDS (LGA)
4720
Emerald
$250
50
$220
48
$180
49
4722
Springsure
N/A
3
N/A
3
6
N/A
N/A
27
$177,500 $180,000
-1.4%
N/A
N/A
LIVINGSTONE (LGA)
39
$305,000
22.5%
115
$258,000 $212,500
21.4% $345,000
-25.2%
YEPPOON
15
$340,000
24.5%
53
$307,000 $247,500
24.0% $355,000
-13.5%
84 | QUEENSLAND MARKET MONITOR • MARCH 2021 | ISSUE 49 REPORTING ON THE DECEMBER QUARTER 2020
REIQ.com
RENTAL MARKET - 3 BED TOWNHOUSES POST CODE
REIQ.com
DEC-20 LOCALITY
L
$/ WEEK
DEC-19
NEW BONDS
$/ WEEK
DEC-15
NEW BONDS
$/ WEEK
NEW BONDS
ROCKHAMPTON REGIONAL
$375
8
$350
5
$300
9
4701
Central Qld Uni, Frenchville, Kalka, Koongal, Lakes Ck, Nerimbera, Nth Rockhampton, Oasis Gardens, Pk Avenue PO, Rockhampton
$340
7
N/A
4
$260
5
LIVINGSTONE SHIRE
$400
18
$400
22
$350
5
4702
Ambrose/Banana/Baralaba/Gindie/Gracemere/ Jericho/Keppel Sands/SaphireStanwell/Rubyvale/ Westwood/Woorabinda/Wowan/Yaraka
$450
8
$400
18
N/A
3
4703
Bayfield/Bungundarra/Byfield/Cooee Bay/ Farnborough/Kemp Bch/Kinka Bch/Lammermoor Bch/Statute Bay/Taranganba/Woodbury/Yeppoon
$385
10
N/A
3
N/A
2
CENTRAL HIGHLANDS REGIONAL
$330
15
$350
15
$250
9
4720
Emerald
$335
10
$350
13
N/A
4
QUEENSLAND MARKET MONITOR • MARCH 2021 | ISSUE 49 REPORTING ON THE DECEMBER QUARTER 2020 | 85
Mackay EMPLOYMENT MARKET MACKAY Unemployment Rate
4.3%
Participation Rate
68.9%
HOUSE MARKET (<2400M2)
Annual
Quarter median price
Annual median price
$385,000 $370,000 5yrs
Annual volume of sales
1,669
Annual median price 5yrs ago
$358,500
Mackay has continued its run of property price growth with another median house price increase recorded in the December quarter.
Mackay Musters Up More Momentum The strong market conditions in Mackay have continued in the December 2020 quarter with median house prices higher than the previous period. Over the year ending December, the region posted growth of 4.5% to push its median house price to the highest level in five years. Interestingly, an undersupply of listings is creating significant competition for stock with most properties selling within 10 days. Meanwhile, Mackay’s unit market has yet to experience any substantial uptick in conditions, but with very affordable price points that situation is likely to start changing soon while the volume of land sales has jumped more than 70% over the year. As a result, it’s created a skills shortage in the construction sector. The region’s rental market is also struggling with a critical undersupply of property, with weekly rents increasing sharply as a result. However, the good news is that Mackay’s economy continues to be in healthy shape with a very low percentage of residents on government subsidies. House Market <2400m2 Mackay has continued its run of property price growth with another median house price increase recorded in the December quarter. The Mackay median house price rose 1.6% over the quarter and was up 4.5% over the year ending December to be $370,000. After a number of years of fairly average market conditions, the Mackay median house price is now the highest it has been for five years. REIQ Mackay Zone Chair Allison Cunningham agreed, further saying that the sales market was the best it had been for many years with low stock levels a part of the equation. “There are under 1,000 properties for sale across the entire district, so it’s a very tight market. When stock does become available, it’s only there for seven to 10 days before it has a contract,” she added. According to CoreLogic, the last time Mackay had a significant undersupply of property for sale was way back in 2011. Demand for houses is being predominantly driven by local buyers, however, with most properties selling soon after listing, they’re becoming increasingly frustrated when they miss out – especially first home buyers. The Mackay market remained buoyant right up to the Christmas period and then took a breather for only a week or so before continuing with its strong market conditions. The strength of the housing market is reflected in the sales volume figures, which recorded a 30% jump over the year ending December 2020. Unit Market The strong market conditions for houses have yet to really flow through to the region’s unit sector, which is still recording soft results. Over the December quarter, the median unit price recorded a -16.2% reduction in price, but this is most likely due to more affordable unit stock selling over the same period. A more reliable barometer of the unit market is what happened over the year ending December 2020 with a small reduction of in median price of -1.3% recorded to finish the year on $221,000. The median price of units in Mackay is now one of most affordable of all major regions across the State, behind Gladstone, and is a situation that’s likely to become more attractive to local buyers and investors as the housing market continues to heat up. Meanwhile, the region’s commercial property sector is also performing strongly, especially industrial, with robust demand from buyers and tenants. Vacant Land Market It seems that local buyers were slower than many other areas across Queensland to take up the Federal Government’s HomeBuilder initiative with land sales taking a while to pick up last year. However, as available listings in the established market started to tighten, this situation started to change. That said, the number of new land estates and building approvals in the region were at low levels prior to the pandemic, meaning there wasn’t a huge supply of options instantly available. The situation has since changed with building approvals increasing significantly over recent months – albeit still well below what they were during the peak of the boom several years ago.
86 | QUEENSLAND MARKET MONITOR • MARCH 2021 | ISSUE 49 REPORTING ON THE DECEMBER QUARTER 2020
REIQ.com
The median price of vacant land in Mackay recorded a marginal increase over the year, up 0.6% to $180,000. The most telling figure in the region’s land data, though, is the sharp uptick in the volume of sales, which posted a jump of 71% compared to the year prior. This significant increase in demand has put a strain on the local construction pipeline with a shortage of qualified trades now common.
HOUSE MARKET ALL
Median days on market
41 Days Median vendor discount
Rental Market The woeful rental market conditions of a few years ago in Mackay are now a distant Mackay’s rental market started to move into undersupply territory a few years ago, so the pandemic has just added to a situation that was already under way. The region’s vacancy rate is now just 0.9% with strong weekly rent increases being recorded. Local landlords who held on to their properties during soft sales and rental market conditions are now welcoming some much-needed rent and property price growth. The stronger market conditions may see some investors offload their portfolio over coming months, keen to claw back some positive results after a very long wait.
-4.1%
The median weekly rent for a two-bedroom unit in Mackay has jumped 9.3% over the year to $295 while the median weekly rent for a three-bedroom house has increased 6.8% to $395 over the same period. These robust rises in weekly rents have resulted in gross rental yields also firming – the gross rental yield for houses increased from 5.1% in the September quarter to 5.3% in December. The result is even more pronounced for unit yields, which have soared from 6.9% to 8.1% over the same period.
Stock on market
7.2% RENTAL MARKET
FOR RENT
Vacancy Rates
0.9% House Yields
5.3% Unit Yields
8.1% REIQ.com
QUEENSLAND MARKET MONITOR • MARCH 2021 | ISSUE 49 REPORTING ON THE DECEMBER QUARTER 2020 | 87
Mackay
SALES MARKET - VACANT LAND <2400M2
UNIT MARKET Annual
Quarter median price
Annual median price
$188,500
$221,000 5yrs
MACKAY (LGA)
44
$134,000
-23.4%
295
$180,000 $179,000
0.6% $180,000
0.0%
MACKAY (LGA) ^
22
$277,500
26.1%
136
$212,500 $230,000
-7.6% $228,000
-6.8%
ANDERGROVE
0
N/A
N/A
29
$155,000 $164,900
-6.0%
N/A
BAKERS CREEK
1
N/A
N/A
14
N/A $193,000
N/A
N/A
N/A
BEACONSFIELD
4
N/A
N/A
39
$188,000
$179,495
4.7%
N/A
N/A
RICHMOND
4
N/A
N/A
43
$228,000 $217,500
4.8%
N/A
N/A
RURAL VIEW
2
N/A
N/A
28
$169,000 $160,000
5.6% $158,500
6.6%
N/A
SURROUNDS WHITSUNDAY (LGA)
28
$170,000
13.3%
138
$162,500 $150,000
8.3% $174,000
-6.6%
WHITSUNDAY (LGA) ^
13
$210,000
7.7%
73
$195,000 $228,500
-14.7% $189,000
3.2%
BOWEN
5
N/A
N/A
30
$103,500 $120,000
CANNON VALLEY
3
N/A
N/A
25
$220,000
CANNONVALE
6
N/A
N/A
26
$150,000 $160,000
-13.8%
$119,000
N/A
N/A
N/A
-6.3% $174,000
-13.8%
N/A
-13.0%
MACKAY HOUSE SALES
Annual volume of sales
Jun-20
Annual median price 5 yrs ago
224
$275,000
Sep-20
Dec-20 *
233 207
196 158
145
143 95
UNIT MARKET Median days on market
73
54
<$350K
$350K+
$500k+
*Preliminary data Houses<2400m2
61 Days
MACKAY UNIT SALES Jun-20 53
Median vendor discount
Sep-20
Dec-20 *
50
40
-5.2%
9
Stock on market
4.8%
2 <$350K
7
6
1
$350K+
1 $500k+
*Preliminary data
MACKAY LAND SALES Jun-20
Sep-20
Dec-20 *
144 121
56
4 <$350k
5 $350k+
5
4
7
5
$500k+
*Preliminary data
88 | QUEENSLAND MARKET MONITOR • MARCH 2021 | ISSUE 49 REPORTING ON THE DECEMBER QUARTER 2020
REIQ.com
SUBURB/LGA
MACKAY (LGA) MACKAY (LGA) ^
ANNUAL ANNUAL QTRLY QTRLY ANNUAL ANNUAL MEDIAN MEDIAN QTRLY 1YR 5YR NO. MEDIAN NO. MEDIAN SALE SALE CHANGE CHANGE CHANGE SALES SALE SALES SALE (1YR (5YRS AGO) AGO)
POST CODE
DEC-20 LOCALITY
L
$/ WEEK
DEC-19
NEW BONDS
$/ WEEK
Mackay
RENTAL MARKET - 3 BED HOUSES
SALES MARKET - HOUSES <2400m2
DEC-15
NEW BONDS
$/ WEEK
NEW BONDS
MACKAY REGIONAL
$395
224
$370
343
$280
432
$385,000
1.6%
1669
$370,000 $354,000
4.5% $358,500
3.2%
4737
Sarina/Sarina Beach/Armstrong Beach
$375
13
$370
27
$280
29
55
$452,000
-13.1%
254
$480,000 $478,500
0.3% $450,000
6.7%
4740
Mackay
$400
172
$370
275
$290
291
7.8%
4741
Various Islands/Clairview/Eton/Farleigh/Flaggy Rock/Gargett/Mt Christian/Mt Ossa/Oakenden/ Pinnacle/Pleystowe/Seaforth/Yalboroo
$370
8
$300
8
$250
5
4750
Bucasia/Seaview Heights/Shoal Pt
$390
15
$360
13
$290
13
4751
Palmyra/Walkerston
N/A
3
$380
5
$280
15
ISAAC REGIONAL
$320
115
$300
158
$225
125
4721
Clermont
$320
7
$275
8
$250
10
4730
Longreach /Stonehenge
$250
11
$270
21
$215
24
4742
Nebo
$260
5
$265
6
N/A
3
4744
Moranbah
$400
53
$350
94
$240
74
4745
Dysart
$250
39
$220
35
$150
25
4746
Middlemount
$375
7
$350
11
$240
13
WHITSUNDAY REGIONAL
$380
100
$360
117
$300
136
4800
Cannon Valley/Conway/Dingo Bch/Erlando Bch/ Mt Julian/Mt Marlow/Nth Gregory/Proserpine/ Riordanvale/Strathdickie/Wilson Bch
$385
12
$320
27
$300
35
$460
45
$420
45
$360
57
ANDERGROVE
41
$365,000
-1.4%
146
$361,000 $335,000
$317,500
13.7%
BEACONSFIELD
23
$364,000
-10.5%
81
$365,000 $380,000
-3.9% $350,000
4.3%
BLACKS BEACH
16
$400,000
23.1%
68
$372,500 $333,000
11.9% $365,000
2.1%
BUCASIA
24
$409,000
16.9%
88
$391,000 $375,000
4.3% $350,000
11.7%
EAST MACKAY
20
$442,000
21.9%
59
$410,000 $345,000
18.8% $408,750
0.3%
EIMEO
18
$420,500
-3.9%
58
$406,250 $355,000
14.4% $385,000
5.5%
GLENELLA
22
$489,500
3.1%
94
$481,500 $470,000
2.4% $495,000
-2.7%
MARIAN
15
$510,000
23.8%
76
$445,000 $422,500
5.3% $420,000
6.0%
MOUNT PLEASANT
24
$354,250
-17.6%
75
$366,000 $365,000
0.3% $387,500
-5.5%
NORTH MACKAY
25
$297,000
1.1%
106
$303,750 $258,000
17.7% $260,000
16.8%
OORALEA
17
$445,000
-5.3%
63
$455,000 $445,000
2.2% $420,000
8.3%
RURAL VIEW
34
$450,000
1.1%
104
$428,750 $445,000
-3.7% $384,000
11.7% 25.5%
366
SARINA
9
N/A
N/A
39
$276,000 $230,000
20.0% $220,000
SARINA ^
7
N/A
N/A
26
$527,500 $420,000
25.6%
N/A
N/A
SHOAL POINT
5
N/A
N/A
26
$487,000
N/A
N/A
N/A
SLADE POINT
14
$312,500
-9.4%
51
$300,000 $358,000
-16.2% $320,000
-6.3%
4802
Airlie Bch/Cannonvale/Jubilee/Shute Harbour/ Shutehaven/Whitsunday
SOUTH MACKAY
39
$327,500
9.5%
120
$318,000 $315,000
1.0% $288,750
10.1%
4804
Collinsville
$263
10
$250
9
N/A
3
WALKERSTON
14
$340,000
-8.7%
64
$385,000 $375,000
2.7% $370,250
4.0%
4805
Bowen
$320
33
$295
36
$250
41
WEST MACKAY
21
$380,000
7.0%
95
$355,000 $335,000
6.0% $338,000
5.0%
42
$250,000
-8.8%
204
$250,000 $200,000
25.0% $185,000
35.1%
N/A
RENTAL MARKET - 2 BED UNITS
SURROUNDS ISAAC (LGA) ISAAC (LGA) ^
3
N/A
N/A
18
N/A
N/A
N/A
N/A
N/A
POST CODE
DEC-20 LOCALITY L
$/ WEEK
DEC-19
NEW BONDS
$/ WEEK
DEC-15
NEW BONDS
$/ WEEK
NEW BONDS
23
$297,500
6.3%
120
$282,500 $235,000
20.2% $200,000
41.3%
MACKAY REGIONAL
$295
209
$270
242
$200
128
$362,000
6.9%
448
$350,000 $359,500
-2.6% $380,000
-7.9%
4737
Sarina/Sarina Beach/Armstrong Beach
$220
13
$225
12
$175
6
WHITSUNDAY (LGA) ^
26
$550,000
4.3%
111
$510,000 $490,000
4.1% $455,000
12.1%
4740
Mackay
$300
189
$270
215
$200
260
BOWEN
37
$275,000
0.0%
140
$275,000 $245,000
12.2%
CANNONVALE
33
$459,000
2.0%
110
$455,000 $428,000
6.3% $425,000
7.1%
PROSERPINE
16
$257,500
8.0%
58
$252,500 $287,500
-12.2% $250,000
1.0%
MORANBAH WHITSUNDAY (LGA)
$281,250
-2.2%
SALES MARKET - UNITS & TOWNHOUSES SUBURB/LGA
MACKAY (LGA)
ANNUAL ANNUAL QTRLY QTRLY ANNUAL ANNUAL MEDIAN MEDIAN QTRLY 1YR 5YR NO. MEDIAN NO. MEDIAN SALE SALE CHANGE CHANGE CHANGE SALES SALE SALES SALE (1YR (5YRS AGO) AGO)
57
$188,500
-16.2%
224
$221,000 $224,000
-1.3% $275,000
-19.6%
MACKAY
11
$170,000
N/A
44
$210,000 $232,000
-9.5% $310,000
-32.3%
NORTH MACKAY
5
N/A
N/A
19
N/A $192,000
SOUTH MACKAY
5
N/A
N/A
23
$185,000
WEST MACKAY
3
N/A
N/A
23
$225,000
N/A
N/A
N/A
N/A
N/A
N/A
N/A
N/A
N/A
N/A
N/A
SURROUNDS ISAAC (LGA)
4
N/A
N/A
17
N/A $160,000
N/A
N/A
N/A
WHITSUNDAY (LGA)
65
$300,000
10.6%
181
$275,000 $259,750
5.9% $286,000
-3.8%
AIRLIE BEACH
32
$309,000
-8.1%
66
$330,000 $310,000
6.5% $361,500
-8.7%
CANNONVALE
21
$215,000
-1.1%
69
$215,000 $222,500
-3.4% $269,000
-20.1%
4750
Bucasia/Seaview Heights/Shoal Pt
N/A
4
$250
9
N/A
4
4751
Greenmount/ Palmyra/ Victoria Plains/ Walkerston
N/A
3
$265
6
$210
14
ISAAC REGIONAL
$225
39
$260
38
$170
29
4721
Clermont
$223
6
N/A
3
$165
5
4744
Moranbah
$190
15
$280
25
$250
10
4746
Middlemount
$310
9
$280
5
$200
7
WHITSUNDAY REGIONAL
$300
133
$300
148
$270
144
4800
Cannon Valley/Conway/Dingo Bch/Erlando Bch/ Mt Julian/Mt Marlow/Nth Gregory/Proserpine/ Riordanvale/Strathdickie/Wilson Bch
$248
18
$220
15
$200
9
4802
Airlie Bch/Cannonvale/Jubilee/Shute Harbour/ Shutehaven/Whitsunday
$350
84
$330
100
$285
108
4805
Bowen
$280
25
$225
31
$211
22
RENTAL MARKET - 3 BED TOWNHOUSES POST CODE
4740
4744
REIQ.com
287
DEC-20 LOCALITY L
$/ WEEK
DEC-19
NEW BONDS
$/ WEEK
DEC-15
NEW BONDS
$/ WEEK
NEW BONDS
MACKAY REGIONAL
$375
21
$370
34
$290
Mackay
$375
19
$370
31
$290
53 50
ISAAC REGIONAL
$480
14
$360
23
$300
18
Moranbah
$480
14
$410
13
$280
16
WHITSUNDAY REGIONAL
$405
20
$380
15
$280
23
4802
Airlie Bch/Cannonvale/Jubilee/Shute Harbour/ Shutehaven/Whitsunday
$405
14
$380
11
$300
13
4805
Bowen
$450
5
N/A
1
N/A
4
QUEENSLAND MARKET MONITOR • MARCH 2021 | ISSUE 49 REPORTING ON THE DECEMBER QUARTER 2020 | 89
Townsville HOUSE MARKET (<2400M2)
Annual
Quarter median price
Annual median price
$340,000 $330,000 5yrs
Annual volume of sales
2,507
Annual median price 5yrs ago
$350,000
HOUSE MARKET ALL Median days on market
47 Days Median vendor discount
-5.2%
Stock on market
6.6%
The Townsville median house price increased 3.8% over the year ending December. The region’s unit market has also seen some love from buyers, with its median price up by 7.9% over the December quarter.
Townsville Prices on the Up & Up Based on the latest data, the Townsville property and rental markets are going only one way – and that’s up. Property and rental prices have been firming since the middle of last year with more demand than supply for both markets. And sales volumes for both houses and units have soared over the past year as buyers compete to secure a home or investment. The Townsville median house price increased 3.8% over the year ending December. The region’s unit market has also seen some love from buyers, with its median price up by 7.9% over the December quarter. Likewise, buyers have flocked to vacant land as well, with sales up nearly 90% compared to the year prior with holdings in affordable locations particularly popular. And just as we’re seeing elsewhere around the State, the Townsville rental market is critically undersupplied with a vacancy rate of just 1%. Rents are starting to rise rapidly which is forcing some tenants to move to more affordable locations, including rural areas. House Market <2400m2 The Townsville house market was perhaps a little slower out of the gates than other regions last year, but that situation has now changed. While the region posted a negligible result over the December quarter, achieving a 0.6% increase, its median house price grew by 3.8% over the year with the Townsville median house price at $330,000. Moreover, the quarterly percentage result is most likely a reflection of more affordable stock selling over the period, with activity and sales prices picking up even more in recent months (0.6%). REIQ Townsville Zone Chair Ben Kingsberry said an influx of interstate migrants was adding to the demand for properties, but also adding wealth to the region too. “They’re coming into town, where they’re all taking a rental or buying a property, but they're also bringing whatever money they've got with them too. The exciting part is they're also bringing a job with them, so, they're actually bringing a whole new job to the economy,” explained Kingsberry. New residents are flocking to the region due to its lifestyle factors as well as housing affordability, compared to Sydney and Melbourne in particular. The volume of house sales in Townsville has increased significantly over the past year, with 34% more sales recorded over the period. Ultimately, the region’s strong market conditions appear to only be beginning with more price growth set to take place over the coming months, given the demand versus supply imbalance. Unit Market With a median unit price of just $245,000, it was only a matter of time before this dwelling type started to experience rising market conditions as well. That has certainly been the case over the December quarter, with the median unit price increasing an impressive 7.9% over the period. Over the year ending December, 2020 its median unit price posted a modest -2.7% drop in price. The region’s unit market continues to be hampered by sky-high insurance premiums, which is a situation that stops some buyers from purchasing an attached dwelling. That said, with house prices rising rapidly, it’s likely that the lower price points and affordability of units will motivate more buyers into the unit market – even with higher than necessary insurance premiums. Over the year, the volume of unit sales increased by more than 11%. Vacant Land Market Similar to many other locations, buyers made a run on vacant land in Townsville over the second half of last year. However, the median price result shows a reduction in price over the quarter and the year, which is mostly due to more affordable land stock being sold. For example, the top three locations for vacant land sales over the year were in Bohle Plains, Burdell and Bushland Beach, with the latter two suburbs both having median land prices below the Townsville median price of $155,000. The HomeBuilder
90 | QUEENSLAND MARKET MONITOR • MARCH 2021 | ISSUE 49 REPORTING ON THE DECEMBER QUARTER 2020
REIQ.com
Townsville
EMPLOYMENT MARKET TOWNSVILLE Unemployment Rate
7.9%
Participation Rate
62.7% UNIT MARKET Annual
Quarter median price
Annual median price
$245,000 $237,500 initiative created an influx of demand from buyers, with the volume of land sales up a staggering 89% over the year. With deadlines around the purchase and construction of new properties needing to be met under the grant conditions, developers have mostly run out of land stock as well as the capacity to build more dwellings.
5yrs
Annual volume of sales
Annual median price 5 yrs ago
554
$285,000
In December 2020, the vacancy rate in Townsville was just 1.0%, with rents starting to rise sharply as a result. Unfortunately, the critical undersupply of rental properties is starting to cause problems for tenants with some people having to move to more affordable areas, including more rural areas where rent is cheaper.
UNIT MARKET Median days on market
74 Days Median vendor discount
-6.9%
Rental Market Four years ago, the Townsville vacancy rate was sitting at 6.4% with far more supply than demand from tenants. From that moment on, however, the tide started to turn with the rate edging down with each consecutive quarter until it hit more demand than supply the year before the pandemic.
The region’s rental market is also under strain from its rising population but from a lack of investment activity and new builds over recent years a well. The robust Townsville economy has also resulted in fewer people leaving the region for jobs in other parts of the State or nation, which is reducing the supply of rental properties even further. The median weekly rent for a two-bedroom unit has increased 7.1% to $300 over the year. The median weekly rent for a three-bedroom house in Townsville has jumped 6.1% to $350 over the same period. And, gross rental yields are on the rise in the district as well with 5.4 % recorded for houses and 6.4% for units in December.
Stock on market
5.5% REIQ.com
QUEENSLAND MARKET MONITOR • MARCH 2021 | ISSUE 49 REPORTING ON THE DECEMBER QUARTER 2020 | 91
SALES MARKET - HOUSES <2400m2
TOWNSVILLE HOUSE SALES Jun-20
Sep-20
Dec-20 *
456
SUBURB/LGA
Townsville
340
302
TOWNSVILLE (LGA) 246 206
173
61
<$350K
$350K+
89
93
$500k+
TOWNSVILLE UNIT SALES Jun-20
Sep-20
Dec-20 *
136 114
77
17
<$350K
14
17
11
$350K+
17
15
$500k+
*Preliminary data
TOWNSVILLE LAND SALES Jun-20
196
Sep-20
649
$340,000
0.6%
2507
$330,000 $318,000
3.8% $350,000
-5.7%
TOWNSVILLE (LGA) ^
62
$464,500
5.6%
276
$455,000 $429,000
6.1% $435,000
4.6%
AITKENVALE
12
$264,000
-4.0%
65
$265,000 $280,000
-5.4% $323,500
-18.1%
ALICE RIVER ^
8
N/A
N/A
31
$517,000 $487,500
6.1% $508,500
1.7%
ALLIGATOR CREEK
8
N/A
N/A
28
$540,000 $525,000
2.9%
N/A
N/A
33
$455,000
17.4%
131
$395,000 $400,000
-1.3% $422,000
-6.4%
ANNANDALE
*Preliminary data Houses<2400m2
Dec-20 *
188
BALGAL BEACH
7
N/A
N/A
31
$247,000 $285,000
BELGIAN GARDENS
6
N/A
N/A
19
N/A $420,000
BLUEWATER PARK ^
4
N/A
N/A
24
$388,000
BOHLE PLAINS
8
N/A
N/A
53
<$350k
6
8
$350k+
*Preliminary data
4
7 $500k+
6
N/A N/A
N/A
N/A
N/A
$375,000 $375,000
0.0% $415,000
-9.6% -12.3%
36
$348,000
-9.6%
122
$365,000 $335,000
9.0% $416,300
35
$420,000
6.5%
145
$400,000 $368,250
8.6% $390,000
2.6%
CONDON
16
$282,500
7.0%
67
$258,000 $240,000
7.5% $290,000
-11.0%
CRANBROOK
17
$285,000
N/A
62
$253,000 $264,250
-4.3% $286,250
-11.6%
CURRAJONG
13
$299,000
N/A
42
$258,500 $242,500
6.6% $298,500
-13.4%
DEERAGUN
14
$260,000
6.3%
53
$241,000 $255,000
-5.5% $323,500
-25.5%
DOUGLAS
34
$362,500
7.0%
113
$355,000 $355,500
-0.1% $390,000
-9.0%
GARBUTT
6
N/A
N/A
27
$275,000 $235,000
17.0% $275,000
0.0%
GULLIVER
12
$272,500
N/A
42
$273,000 $246,000
11.0% $281,000
-2.8%
HEATLEY
9
N/A
N/A
56
$230,000 $215,000
7.0% $253,750
-9.4%
HERMIT PARK
16
$335,000
-11.4%
63
$340,000 $277,000
22.7% $369,500
-8.0%
IDALIA
16
$489,100
6.9%
85
$430,000 $410,000
4.9% $525,000
-18.1%
KELSO
31
$260,000
3.8%
105
$242,750 $221,250
9.7% $271,000
-10.4%
KELSO ^
10
$520,000
N/A
34
$457,500
N/A
N/A $390,000
17.3%
KIRWAN
87
$317,500
-3.8%
299
$316,000 $310,000
1.9% $340,000
-7.1%
MOUNT LOUISA
43
$372,500
2.1%
161
$372,000 $339,000
9.7% $385,000
-3.4%
MOUNT LOW
20
$346,500
0.4%
65
$325,000 $330,000
-1.5% $408,000
-20.3%
MUNDINGBURRA
15
$370,000
-12.9%
45
$360,000 $330,000
9.1% $355,000
1.4%
NELLY BAY
7
N/A
N/A
29
$360,000 $352,000
2.3% $295,000
22.0%
NORTH WARD
12
$700,000
N/A
37
$720,000 $550,000
30.9% $685,000
5.1%
OONOONBA
3
N/A
N/A
24
$260,000
N/A
N/A $302,500
-14.0%
4
N/A
N/A
25
$326,000
N/A
N/A $322,000
1.2%
25
$360,000
19.2%
59
$320,000 $285,000
12.3% $345,000
-7.2%
RANGEWOOD ^
0
N/A
N/A
16
RASMUSSEN
12
$217,750
-1.0%
50
N/A
N/A
$217,500 $210,000
N/A
N/A
3.6% $384,500
N/A
-43.4%
SOUTH TOWNSVILLE
7
N/A
N/A
36
$333,000 $312,000
6.7% $350,000
-4.9%
THURINGOWA CENTRAL
7
N/A
N/A
22
$265,000 $270,000
-1.9% $300,000
-11.7%
VINCENT
8
N/A
N/A
27
$235,000
N/A
N/A $259,000
-9.3%
WEST END
20
$351,250
N/A
58
$359,000 $350,000
2.6% $377,000
-4.8%
WULGURU
9
N/A
N/A
55
$262,000 $250,000
4.8% $292,250
-10.4%
41
$195,000
14.7%
187
$175,000 $160,000
9.4% $182,000
-3.8%
6
N/A
N/A
34
$332,500
N/A
N/A $337,500
-1.5%
27
$220,000
23.9%
116
$195,000 $169,000
15.4% $195,000
0.0%
9
N/A
N/A
38
$138,329
14.3%
N/A
CHARTERS TOWERS (LGA)
23
$165,000
117.1%
78
$147,000 $187,500
-21.6% $175,000 -16.0%
5.4%
CHARTERS TOWERS (LGA) ^
13
$330,000
10.0%
57
$340,000 $340,000
0.0% $420,000 -19.0%
CHARTERS TOWERS CITY
9
N/A
N/A
31
$105,000
Unit Yields
HINCHINBROOK (LGA)
25
$180,000
2.9%
115
HINCHINBROOK (LGA) ^
6
N/A
N/A
34
$292,000 $270,000
8.1%
N/A
N/A
FORREST BEACH
8
N/A
N/A
30
$232,500
N/A
N/A
N/A
N/A
INGHAM
7
N/A
N/A
50
$145,000 $142,500
1.8%
$197,500
-26.6%
RENTAL MARKET
SURROUNDS BURDEKIN (LGA)
FOR RENT
N/A
N/A $446,500
BUSHLAND BEACH
RAILWAY ESTATE 3
N/A
-13.3%
BURDELL
PIMLICO
65
ANNUAL ANNUAL QTRLY QTRLY ANNUAL ANNUAL MEDIAN MEDIAN QTRLY 1YR 5YR NO. MEDIAN NO. MEDIAN SALE SALE CHANGE CHANGE CHANGE SALES SALE SALES SALE (1YR (5YRS AGO) AGO)
Vacancy Rates
1.0%
House Yields
6.4%
BURDEKIN (LGA) ^ AYR HOME HILL
92 | QUEENSLAND MARKET MONITOR • MARCH 2021 | ISSUE 49 REPORTING ON THE DECEMBER QUARTER 2020
$121,000
N/A
$210,000 $182,500
N/A
N/A
$152,500
-31.1%
15.1% $220,000
-4.5%
REIQ.com
SALES MARKET - UNITS & TOWNHOUSES
TOWNSVILLE (LGA)
146
$245,000
7.9%
554
$237,500 $244,000
-2.7% $285,000
-16.7%
10
$167,625
N/A
35
$157,000
$115,000
36.5% $170,000
-7.6%
KIRWAN
5
N/A
N/A
27
$245,000 $199,000
23.1% $252,500
-3.0%
NELLY BAY
9
N/A
N/A
32
$185,000 $380,000
-51.3% $125,000
48.0%
NORTH WARD
28
$300,000
-11.1%
120
$285,000 $275,000
3.6% $321,000
-11.2%
TOWNSVILLE CITY
23
$315,000
0.5%
85
$345,000 $366,875
-6.0% $417,500
-17.4%
WEST END
10
$230,000
-55.1%
38
$215,000 $216,000
-0.5% $205,000
4.9%
HERMIT PARK
DEC-20 LOCALITY
L
ANNUAL ANNUAL QTRLY QTRLY ANNUAL ANNUAL MEDIAN MEDIAN QTRLY 1YR 5YR NO. MEDIAN NO. MEDIAN SALE SALE CHANGE CHANGE CHANGE SALES SALE SALES SALE (1YR (5YRS AGO) AGO)
TOWNSVILLE (LGA)
62
$149,000
-6.9%
510
$155,000 $164,000
-5.5% $160,900
-3.7%
TOWNSVILLE (LGA) ^
18
$220,000
2.3%
85
$207,000 $239,000
-13.4% $205,000
1.0%
BOHLE PLAINS
5
N/A
N/A
60
$182,000 $169,000
7.7% $166,000
9.6%
BURDELL
2
N/A
N/A
59
$154,000
N/A
N/A $154,800
-0.5%
N/A
N/A $165,000
-16.7%
BUSHLAND BEACH
4
N/A
N/A
50
$137,500
JENSEN
3
N/A
N/A
31
$225,000 $219,000
2.7%
N/A
JULAGO
0
N/A
N/A
28
$138,000 $158,000
-12.7%
N/A
N/A
MOUNT LOUISA
1
N/A
N/A
33
$168,500
N/A
N/A $180,000
-6.4%
14
$54,000
20.0%
38
$50,500
N/A
N/A
$/ WEEK
DEC-19
NEW BONDS
$/ WEEK
DEC-15
NEW BONDS
$/ WEEK
NEW BONDS
HINCHINBROOK (LGA)
TOWNSVILLE CITY
$300
549
$280
648
$260
729
RENTAL MARKET - 3 BED HOUSES
4810
Belgian Gardens/Cape Cleveland/Castle Hill/Nth Ward/Pallarenda/Railway Estate/Rowes Bay/ Townsville/West End/Yarrawonga
$330
269
$300
289
$285
329
POST CODE
4811
Cluden/Idalia/James Cook Uni/Mt Stuart/Oak Valley/Oonoonba/Partington/Roseneath/Serene Valley/Stuart/Wulguru
$360
53
$350
60
$355
64
4812
Currajong/Gulliver/Hermit Pk/Hyde Pk/Hyde Pk Castletown/Mundingburra/Mysterton/Pilmico/ Rising Sun/Rosslea
$260
4814
Aitkenvale/Cranbrook/Douglas, Garbutt/Heatley/ Mt Elliot/Mt Louisa/Murray/Vincent
$270
58
$275
82
$260
93
4815
Condon/Kelso/Pinnacles/Rasmussen
$258
18
$290
17
$230
22
4817
Alice River/Bohle Plns/Kirwan/Rangewood/ Rupertswood/Stableford/\Thuringowa Central
$280
24
$250
33
$240
46
4818
Beach Holm/Black River/Blue Hills/Bluewater/ Bohle/Burdell/Bushland Bch/Carinya/Cordelia/ Deeragun/Innes/Jensen/Lynam/Mt Low/Purono Pk/Saunders Bch/Shaw/Toolakea/Yabulu
N/A
3
N/A
2
$240
10
4819
Arcadia/Arcadia Bay/Horseshoe Bay/Magnetic Is/ Nelly Bay/Picnis Bay
4807 4820 4850
111
$360
13
BURDEKIN SHIRE
$220
Airville
$220
CHARTERS TOWERS REGIONAL
$250
153
$230
$315
12
$300
12
22
$210
35
$200
31
19
$220
29
$210
26
$220
11
$200
22
$170
7
Richmond Hill
$220
11
$200
22
$170
7
HINCHINBROOK SHIRE
$180
28
$168
18
$200
15
Abergowrie
$180
28
$168
18
$200
15
DEC-20 LOCALITY L
TOWNSVILLE CITY
$/ WEEK
$350
DEC-19
NEW BONDS
$/ WEEK
36
$330
DEC-15
NEW BONDS
$/ WEEK
47
$300
NEW BONDS
38
4810
Belgian Gardens/Cape Cleveland/Castle Hill/Nth Ward/Pallarenda/Railway Estate/Rowes Bay/ Townsville/West End/Yarrawonga
$380
12
$480
11
$300
8
4812
Currajong/Gulliver/Hermit Pk/Hyde Pk/Hyde Pk Castletown/Mundingburra/Mysterton/Pilmico/ Rising Sun/Rosslea
$350
6
$300
15
$300
8
4814
Aitkenvale/Cranbrook/Douglas, Garbutt/Heatley/ Mt Elliot/Mt Louisa/Murray/Vincent
N/A
4
$390
5
N/A
4
4817
Alice River/Bohle Plns/Kirwan/Rangewood/ Rupertswood/Stableford/\Thuringowa Central
N/A
2
$320
7
$320
9
4818
Beach Holm/Black River/Blue Hills/Bluewater/ Bohle/Burdell/Bushland Bch/Carinya/Cordelia/ Deeragun/Innes/Jensen/Lynam/Mt Low/Purono Pk/Saunders Bch/Shaw/Toolakea/Yabulu
$330
7
$330
6
N/A
3
REIQ.com
DEC-20 LOCALITY L
$/ WEEK
DEC-19
NEW BONDS
$/ WEEK
$60,500
-16.5%
DEC-15
NEW BONDS
$/ WEEK
NEW BONDS
TOWNSVILLE CITY
$350
477
$330
695
$310
689
4810
Belgian Gardens/Cape Cleveland/Castle Hill/Nth Ward/Pallarenda/Railway Estate/Rowes Bay/ Townsville/West End/Yarrawonga
$380
35
$330
46
$340
55
4811
Cluden/Idalia/James Cook Uni/Mt Stuart/Oak Valley/Oonoonba/Partington/Roseneath/Serene Valley/Stuart/Wulguru
$400
45
$360
56
$320
35
4812
Currajong/Gulliver/Hermit Pk/Hyde Pk/Hyde Pk Castletown/Mundingburra/Mysterton/Pilmico/ Rising Sun/Rosslea
$350
37
$340
71
$330
76
4814
Aitkenvale/Cranbrook/Douglas, Garbutt/Heatley/ Mt Elliot/Mt Louisa/Murray/Vincent
$340
124
$330
184
$320
168
4815
Condon/Kelso/Pinnacles/Rasmussen
$310
77
$300
100
$290
119
4816
Alligator Ck/Dunk Is/Greenvale/Hidden Valley/ Homestead/Julago/Macrossan/Majors Ck/ Mingela/Mutarnee/Nelia/Nome/Palm Is/Paluma/ Pentland/Praire/Ravenswood/Rollingstone/ Sellheim/Toonpan/Torrens Ck/Woodstock
$308
10
$330
9
$260
10
4817
Alice River/Bohle Plns/Kirwan/Rangewood/ Rupertswood/Stableford/\Thuringowa Central
$360
84
$340
118
$320
99
4818
Beach Holm/Black River/Blue Hills/Bluewater/ Bohle/Burdell/Bushland Bch/Carinya/Cordelia/ Deeragun/Innes/Jensen/Lynam/Mt Low/Purono Pk/Saunders Bch/Shaw/Toolakea/Yabulu
$368
60
$340
100
$295
116
4819
Arcadia/Arcadia Bay/Horseshoe Bay/Magnetic Is/ Nelly Bay/Picnis Bay
$380
5
$320
11
$350
11
BURDEKIN SHIRE
$265
40
$270
55
$260
43
4806
Arkendeith
$240
10
$240
15
$250
15
4807
Airville
$270
28
$280
36
$260
26
CHARTERS TOWERS REGIONAL
$290
22
$260
36
$250
41
4820
Richmond Hill
$290
22
$260
36
$250
41
HINCHINBROOK SHIRE
$270
20
$240
27
$250
27
Abergowrie
$270
20
$240
27
$250
27
153
RENTAL MARKET - 3 BED TOWNHOUSES POST CODE
N/A
SURROUNDS
RENTAL MARKET - 2 BED UNITS POST CODE
SUBURB/LGA
4850
QUEENSLAND MARKET MONITOR • MARCH 2021 | ISSUE 49 REPORTING ON THE DECEMBER QUARTER 2020 | 93
Townsville
SUBURB/LGA
SALES MARKET - VACANT LAND <2400M2
ANNUAL ANNUAL QTRLY QTRLY ANNUAL ANNUAL MEDIAN MEDIAN QTRLY 1YR 5YR NO. MEDIAN NO. MEDIAN SALE SALE CHANGE CHANGE CHANGE SALES SALE SALES SALE (1YR (5YRS AGO) AGO)
Cairns HOUSE MARKET (<2400M2)
Annual
Quarter median price
Annual median price
$435,000
$420,000 5yrs
Annual volume of sales
2,170
Annual median price 5yrs ago
$415,000
HOUSE MARKET Median days on market
42 Days Median vendor discount
-3.9%
Stock on market
7.2%
The region’s property market has seen strengthening prices in its housing and vacant land stock over consecutive quarters, with its unit sector even showing encouraging signs of price pressure.
Cairns: The Curveball Nobody Saw Coming One of the locations that was expected to the bear the brunt of the pandemic was Cairns with its heavy reliance on tourists, especially from overseas. However, its economy and property market has performed far better over the past year than anyone could have forecast back then. The region’s property market has seen strengthening prices in its housing and vacant land stock over consecutive quarters, with its unit sector even showing encouraging signs of price pressure. While there is no question that the halting of international tourists continues to be an economic headwind for the region, the influx of domestic tourists from near and far has gone some way to fill the gap. The median house price in Cairns finished the year 1.2% higher than the year before – a result few could have predicted. Its vacant land market has skyrocketed with sales up 120% over the year and its median price soaring 22.7% over the quarter. And like elsewhere in the State, the Cairns rental market continues to be severely undersupplied with a vacancy rate of just 1.2% and rents increasing about 5% over the past year. With little investment activity over recent years, that situation is not likely to change anytime soon either. House Market <2400m2 One year on from the start of the pandemic, and the halting of all international tourism, and the Cairns median house price is higher than it was at that time. If you can believe it, the Cairns median house price actually increased 1.2% over the quarter and the year to be $420,000 at the end of 2020. REIQ Cairns Zone Chair Thomas Quaid said the market was the best he had seen it in many years. “It’s been the best 12 months I think I’ve ever had by a significant margin. There’s no way that we would have thought that would be the case,” he said. According to CoreLogic data, total property listings on the market in Cairns in February 2021 was the lowest since about 2014. The lack of stock is forcing house prices higher, with sales prices often 10% above what they could have achieved a year ago with multiple offers on listings becoming common. What’s more, most properties are selling within the first week of the sales campaign as well. This lack of supply is not a situation that’s likely to change anytime soon with many homeowners reluctant to sell, even with strong market conditions, because they’re worried about buying another property to live in. That said, investors are beginning to sell down their holdings, keen to take advantage of the price growth after a number of years of rather underwhelming results. Unit Market The Cairns unit market is showing early signs of price recovery, off the back of the strong housing market. The Cairns median unit price was flat at $220,000 over the December quarter and posted a -2.0% reduction over the year making it currently the second most affordable unit market of all major regions in State, behind Gladstone. It’s this affordability that’s likely to see the sector start to strengthen further with buyers opting to purchase a unit over a house, especially if house prices continue to grow rapidly. Some buyers may need to purchase a unit over a house simply because of the lack of supply of dwellings currently available. With investors making a return to markets more generally, and with a strong rental market in Cairns, it’s likely that units will become more popular given their affordable buy in price points and healthy yields. Vacant Land Market It appears the Federal Government’s HomeBuilder initiative has set off a price rocket in vacant land prices across the Cairns region. With the potential to secure $25,000 towards building a new dwelling from the grant, the volume of land sales has soared nearly 120% over the year ending December. On top of that sales surge, the vacant median land price increased by an impressive 22.7% over the December quarter.
94 | QUEENSLAND MARKET MONITOR • MARCH 2021 | ISSUE 49 REPORTING ON THE DECEMBER QUARTER 2020
REIQ.com
Cairns
EMPLOYMENT MARKET CAIRNS Unemployment Rate
4.8%
Participation Rate
62.9% UNIT MARKET Annual
Quarter median price
Annual median price
$220,000
$220,000
Indeed, local agents say that the price of land parcels steadily increased throughout last year, with some areas seeing sale prices strengthen from about $150,000 to more than $200,000 by the end of the year.
5yrs
Annual volume of sales
Annual median price 5 yrs ago
1,089
$225,000
UNIT MARKET Median days on market
57 Days Median vendor discount
-4.8%
Developers are reportedly selling land parcels as much as a year before they will be titled, with sale prices generally not being negotiated with buyers as well. With the deadline for the HomeBuilder program looming, sales have continued to be strong, but there isn’t a lot of supply left for buyers at any rate. However, even with the sharp jump in median price over the quarter, the median price of land still remains slightly below what it was five years ago. Rental Market The Cairns rental market continues to be critically undersupplied with a vacancy rate of just 1.2% recorded in December. The region’s vacancy rate has been in undersupply territory for a number of years now, with the pandemic just adding to a steadily worsening problem for tenants. Local agents say that of the rental stock still available, some of it is prestige properties with high weekly rents, while others are in poor condition or inferior locations. With available rental properties thin on the ground, it seen rent levels start to increase significantly. The median weekly rent for a two-bedroom unit in Cairns has increased 4.8% over the year to December to be $330 per week. Likewise, the median weekly rent for a three-bedroom house has risen by 5% to $420 per week over the same period. Gross rental yields for investors in Cairns are recording healthy returns. The gross rental yield for houses in Cairns was 5% in December, while unit investors were enjoying impressive yields of 7.8% courtesy of the affordability of units in the region.
Stock on market
7.0% REIQ.com
QUEENSLAND MARKET MONITOR • MARCH 2021 | ISSUE 49 REPORTING ON THE DECEMBER QUARTER 2020 | 95
SALES MARKET - HOUSES <2400m2
RENTAL MARKET
SUBURB/LGA
Cairns
FOR RENT
Vacancy Rates
1.2%
CAIRNS (LGA) CAIRNS (LGA) ^
House Yields
5.0% Unit Yields
7.8%
CAIRNS & DOUGLAS HOUSE SALES Jun-20
Sep-20
Dec-20 *
336
226
179
157
137
229
129
108
<$350K
$350K+
$500k+
*Preliminary data Houses<2400m2
CAIRNS & DOUGLAS UNIT SALES Jun-20
Sep-20
201
<$350K
30
17
$350K+
37
33
$500k+
*Preliminary data
CAIRNS & DOUGLAS LAND SALES Jun-20
Sep-20
1.2%
2170
$420,000 $415,000
1.2% $415,000
1.2%
$849,000
34.3%
154
$690,000 $700,000
-1.4% $700,000
-1.4%
21
$455,750
4.2%
65
$445,250 $421,000
5.8% $421,000
5.8%
BENTLEY PARK
26
$355,000
0.7%
143
$350,000 $355,000
-1.4% $355,000
-1.4%
BRINSMEAD
16
$545,000
12.4%
73
$478,750 $475,000
CARAVONICA
7
N/A
N/A
39
$470,000 $381,500
23.2%
$381,500
23.2%
CLIFTON BEACH
14
$637,500
N/A
41
$585,000 $520,000
12.5% $520,000
12.5%
EARLVILLE
7
N/A
N/A
35
$380,000 $380,000
0.0% $380,000
0.0%
EDGE HILL
15
$600,000
8.1%
56
$538,015 $545,000
-1.3% $545,000
-1.3%
EDMONTON
0.8% $475,000
0.8%
29
$345,000
2.2%
158
$340,000 $345,000
-1.4% $345,000
-1.4%
FRESHWATER
9
N/A
N/A
30
$482,000 $565,000
-14.7% $565,000
-14.7%
GORDONVALE
16
$338,000
-15.5%
89
$329,000 $320,000
2.8% $320,000
2.8%
GORDONVALE ^
2
N/A
N/A
26
$656,250 $575,000
14.1% $575,000
14.1% 11.0%
HOLLOWAYS BEACH
4
N/A
N/A
35
$435,000 $392,000
11.0% $392,000
KANIMBLA
10
$552,500
11.1%
54
$524,500 $500,000
4.9% $500,000
4.9%
KEWARRA BEACH
28
$465,000
8.9%
147
$445,000 $447,750
-0.6% $447,750
-0.6%
MANOORA
8
N/A
N/A
49
$307,000 $310,000
-1.0% $310,000
-1.0%
MANUNDA
8
N/A
N/A
37
$320,000 $350,000
-8.6% $350,000
-8.6%
MOOROOBOOL
28
$340,000
N/A
91
$372,500 $357,500
4.2% $357,500
4.2%
MOUNT SHERIDAN
20
$390,000
5.7%
133
$380,000 $370,000
2.7% $370,000
2.7%
PALM COVE
17
$745,000
11.2%
46
$675,000 $605,000
11.6% $605,000
11.6%
7
N/A
N/A
34
$433,500 $400,000
REDLYNCH
37
$470,000
-7.8%
146
$490,000 $491,500
-0.3%
$491,500
-0.3%
SMITHFIELD
28
$476,250
5.8%
102
$435,000 $438,750
-0.9% $438,750
-0.9%
TRINITY BEACH
19
$440,000
-10.2%
113
$450,000 $480,000
-6.3% $480,000
-6.3%
TRINITY PARK
19
$450,000
2.4%
93
$445,000 $439,000
1.4% $439,000
1.4%
WESTCOURT
7
N/A
N/A
18
N/A $350,000
N/A $350,000
N/A
WHITE ROCK
14
$342,500
N/A
51
$330,000 $305,000
8.2% $305,000
8.2%
8.4% $400,000
8.4%
WHITFIELD
15
$509,500
-9.6%
65
$563,500 $525,000
7.3% $525,000
7.3%
WOREE
16
$382,500
N/A
40
$340,000 $304,500
11.7% $304,500
11.7%
YORKEYS KNOB
3
N/A
N/A
22
$414,250 $385,000
7.6% $385,000
7.6%
CARPENTARIA (LGA) ^
244
42
$435,000
25
SURROUNDS
Dec-20 *
324
27
487
BAYVIEW HEIGHTS
PARRAMATTA PARK 214
ANNUAL ANNUAL QTRLY QTRLY ANNUAL ANNUAL MEDIAN MEDIAN QTRLY 1YR 5YR NO. MEDIAN NO. MEDIAN SALE SALE CHANGE CHANGE CHANGE SALES SALE SALES SALE (1YR (5YRS AGO) AGO)
Dec-20 *
251
0
N/A
N/A
0
CASSOWARY COAST (LGA)
73
$250,000
11.1%
281
CASSOWARY COAST (LGA) ^
26
$375,000
9.6%
DOUGLAS (LGA)
51
$497,000
1.4%
DOUGLAS(LGA) ^
16
$472,500
PORT DOUGLAS
19
MAREEBA (LGA)
N/A
$-
N/A
$-
N/A
$230,000 $255,000
-9.8% $255,000
-9.8%
105
$350,000 $312,500
12.0% $312,500
12.0%
150
$435,000 $450,000
-3.3% $450,000
-3.3%
-26.7%
54
$522,500 $500,000
4.5% $500,000
4.5%
$670,000
-16.5%
50
$700,000 $628,000
11.5% $628,000
11.5%
22
$290,000
-0.9%
126
$290,000 $295,000
-1.7% $295,000
-1.7% 5.3%
MAREEBA (LGA) ^
35
$495,000
11.2%
157
$484,408 $460,000
5.3% $460,000
KURANDA ^
16
$521,000
N/A
50
$499,000 $480,000
4.0% $480,000
4.0%
MAREEBA
20
$290,000
10.7%
105
$290,000 $305,000
-4.9% $305,000
-4.9%
MAREEBA ^
10
$464,375
N/A
43
$463,750 $460,000
0.8% $460,000
0.8%
TABLELANDS (LGA)
60
$322,000
17.4%
233
$290,000 $300,000
-3.3% $300,000
-3.3%
TABLELANDS (LGA) ^
48
$437,500
-1.1%
212
$423,500 $432,000
-2.0% $432,000
-2.0%
ATHERTON
25
$346,000
19.3%
114
$295,000 $318,500
-7.4%
-7.4%
MILLSTREAM ^
8
N/A
N/A
29
$260,000 $255,000
2.0% $255,000
2.0%
TOLGA ^
5
N/A
N/A
37
$465,000 $467,500
-0.5% $467,500
-0.5%
$318,500
168
56 7 <$350k
21 $350k+
10
2
7
6
$500k+
*Preliminary data
96 | QUEENSLAND MARKET MONITOR • MARCH 2021 | ISSUE 49 REPORTING ON THE DECEMBER QUARTER 2020
REIQ.com
RENTAL MARKET - 3 BED HOUSES
SUBURB/LGA
ANNUAL ANNUAL QTRLY QTRLY ANNUAL ANNUAL MEDIAN MEDIAN QTRLY 1YR 5YR NO. MEDIAN NO. MEDIAN SALE SALE CHANGE CHANGE CHANGE SALES SALE SALES SALE (1YR (5YRS AGO) AGO)
CAIRNS (LGA)
269
$220,000
2.3%
1089
$220,000 $224,500
-2.0% $225,000
-2.2%
BUNGALOW
7
N/A
N/A
32
$150,000 $154,000
-2.6% $187,500
-20.0%
CAIRNS CITY
23
$485,000
14.1%
79
$400,000 $332,500
20.3% $370,000
8.1%
CAIRNS NORTH
41
$210,000
-4.5%
144
$212,500 $240,000
-11.5% $238,500
-10.9%
CLIFTON BEACH
12
$252,000
N/A
48
$235,000 $260,000
-9.6%
N/A
N/A
EARLVILLE
7
N/A
N/A
34
$208,000 $226,000
-8.0% $218,500
-4.8%
POST CODE
DEC-20 LOCALITY L
$/ WEEK
DEC-19
NEW BONDS
$/ WEEK
DEC-15
NEW BONDS
$/ WEEK
NEW BONDS
CAIRNS REGIONAL
$420
266
$400
434
$365
390
4865
Gordonvale
$400
9
$350
10
$330
12
4868
Mt Sheridan/Bayview Hts/Tarrawarra/White Rock/Woree
$400
58
$380
96
$350
72
4869
Centenary Hts/Centenary Pk/Edmonton/Tamarind Gardens
$370
25
$370
65
$340
55
4870
Cairns & suburbs of Cairns
$420
96
$400
141
$375
137
4878
Caravonica/Holloways Bch/Lake Placid/Machans Bch/McGregor/Smithfield/Smithfield Hts/ Yorkeys Knob
$445
28
$430
44
$390
47
4879
Buchan Pt/Clifton Bch/Ellis Bch/Kewarra Bch/Palm Cove/Trinity Bch/Trinity Pk
$450
50
$450
74
$395
63
$380
34
$350
29 26
EDGE HILL
7
N/A
N/A
26
$158,750 $205,000
-22.6% $187,000
-15.1%
FRESHWATER
9
N/A
N/A
31
$280,000 $238,750
17.3% $315,000
-11.1%
HOLLOWAYS BEACH
3
N/A
N/A
16
N/A $127,750
N/A $180,000
N/A
MANOORA
17
$160,000
-5.6%
88
$159,000 $158,000
0.6% $169,500
-6.2%
DOUGLAS SHIRE
$400
31
MANUNDA
14
$132,250
2.5%
59
$137,500 $145,000
-5.2% $143,000
-3.8%
4873
$350
16
$350
23
$340
MOOROOBOOL
5
N/A
N/A
30
$202,500 $195,000
3.8% $213,000
-4.9%
Mossman/Cooya Beach/Cow Bay/Miallo/Newell/ Wonga
27
$308,500
46.9%
102
$306,000 $265,000
15.5% $271,750
12.6%
4877
Port Douglas/Craiglie/Mowbray/Oak Beach
$475
15
$450
11
N/A
3
CASSOWARY COAST REGIONAL
$320
57
$300
87
$285
84
PALM COVE PARRAMATTA PARK
8
N/A
N/A
24
$251,900 $230,000
9.5% $242,500
3.9%
REDLYNCH
7
N/A
N/A
37
$235,000 $234,000
0.4% $231,000
1.7%
TRINITY BEACH
18
$270,000
-14.3%
82
$279,944 $275,000
1.8% $259,500
7.9%
WESTCOURT
7
N/A
N/A
45
$218,250 $235,000
-7.1% $222,000
-1.7%
WHITE ROCK
4
N/A
N/A
23
$240,000 $220,000
9.1% $243,500
-1.4%
WOREE
17
$140,000
29.6%
52
$135,000 $142,750
-5.4% $125,000
8.0%
YORKEYS KNOB
14
$205,000
8.2%
53
$212,000 $228,250
-7.1% $215,000
-1.4%
SURROUNDS CASSOWARY COAST (LGA)
4849
Cardwell
N/A
1
$265
8
$290
7
4852
Bingil Bay
$410
13
$370
19
$320
13
4854
Bilyana
$300
18
$300
19
$290
11
4858
Comoon Loop
N/A
2
$285
6
$300
6
4860
Bamboo Creek
$305
20
$298
28
$280
41
TABLELANDS REGIONAL
$330
61
$320
79
$280
86
4872
Dimbulah/Kairi/Mt Garnett/Tinaroo/Walkamin
N/A
3
$308
6
$310
9
4882
Tolga
N/A
4
$360
7
$305
6 31
7
N/A
N/A
49
$235,000 $206,550
13.8% $130,000
80.8%
4883
Atherton/Upper Baron
$340
26
$325
38
$290
DOUGLAS (LGA)
44
$260,000
-11.1%
188
$262,500 $235,500
11.5% $215,000
22.1%
4884
Yungaburra/Lake Eacham
N/A
4
$330
7
$300
9
PORT DOUGLAS
38
$256,000
-12.5%
166
$265,000 $235,500
12.5% $215,250
23.1%
4885
Malanda/Tarzali/Jaggan
$340
10
$320
7
$280
17
9
N/A
N/A
33
$215,500 $284,000
-24.1% $206,000
4.6%
TABLELANDS (LGA)
SALES MARKET - VACANT LAND <2400M2
4887
Herberton/Wondecla
4888
Ravenshoe/Evelyn/Millstream
N/A
1
N/A
3
$280
6
$295
11
$275
10
$250
8
MAREEBA SHIRE
$360
46
$320
51
$300
45
51
$235,000
22.7%
504
$207,500 $225,500
-8.0% $212,500
-2.4%
4880
Mareeba/Biboohra
$360
37
$320
42
$300
41
CAIRNS (LGA) ^
4
N/A
N/A
53
$240,000 $253,750
-5.4% $280,000
-14.3%
4881
Kuranda/Koah/Speewah
$475
9
$430
9
N/A
4
BENTLEY PARK
7
N/A
N/A
48
$178,000 $160,000
11.3% $169,000
5.3%
EDMONTON
3
N/A
N/A
59
$168,000
N/A $154,950
8.4%
GOLDSBOROUGH ^
0
N/A
N/A
25
$220,000 $216,000
1.9%
N/A
N/A
GORDONVALE
3
N/A
N/A
53
$159,000
N/A $140,500
13.2%
CAIRNS (LGA)
N/A
N/A
KEWARRA BEACH
4
N/A
N/A
34
$192,250
N/A
PALM COVE
6
N/A
N/A
25
$399,000 $359,000
N/A $262,500 11.1%
-26.8%
N/A
0
N/A
N/A
48
$281,000 $268,500
4.7% $242,000
16.1%
SMITHFIELD
1
N/A
N/A
34
$217,500 $210,000
3.6% $225,000
-3.3%
SURROUNDS 23
$135,000
106.1%
90
$90,000 $105,000
CASSOWARY COAST (LGA) ^
16
$180,000
71.4%
73
$140,000 $152,500
DOUGLAS (LGA)
13
$145,750
N/A
33
$150,000
DOUGLAS (LGA) ^
4
N/A
N/A
MAREEBA (LGA)
7
N/A
13
$142,500
MAREEBA (LGA) ^ MAREEBA
$88,000
2.3%
-8.2% $128,500
8.9%
N/A
N/A $124,500
20.5%
21
$110,000 $107,500
2.3% $170,000
-35.3%
N/A
50
$114,000 $114,250
1.8%
81
$147,500 $137,500
-0.2%
19.1%
7.3% $210,000
-29.8%
5
N/A
N/A
44
$95,750
19.3%
21
$114,000
-10.2%
109
$115,000 $111,500
3.1% $102,500
12.2%
TABLELANDS (LGA) ^
18
$365,000
135.5%
79
$187,000 $175,000
6.9% $185,000
1.1%
8
N/A
N/A
43
N/A
$95,750
TABLELANDS (LGA)
ATHERTON
$114,250
-14.3%
$118,000
N/A
N/A
N/A $100,000
18.0%
RENTAL MARKET - 3 BED TOWNHOUSES POST CODE
DEC-20 LOCALITY L
CAIRNS REGIONAL 4870 4877
$/ WEEK
$380
DEC-19
NEW BONDS
15
$/ WEEK
$/ WEEK
$390
20
$350
NEW BONDS
LOCALITY
$/ WEEK
DEC-19
NEW BONDS
$/ WEEK
DEC-15
NEW BONDS
$/ WEEK
NEW BONDS
CAIRNS REGIONAL
$330
594
$315
726
$290
840
4868
$290
59
$275
65
$265
88
4869
Centenary Hts/Centenary Pk/Edmonton/Tamarind Gardens
$285
15
$280
14
$250
21
4870
Cairns & suburbs of Cairns
$330
371
$310
478
$290
522
4878
Caravonica/Holloways Bch/Lake Placid/Machans Bch/McGregor/Smithfield/Smithfield Hts/ Yorkeys Knob
$340
57
$340
76
$290
92
4879
Buchan Pt/Clifton Bch/Ellis Bch/Kewarra Bch/Palm Cove/Trinity Bch/Trinity Pk
$358
86
$340
84
$310
112
DOUGLAS SHIRE
$305
51
$328
68
$290
52
4873
Mossman/Cooya Beach/Cow Bay/Miallo/Newell/ Wonga
$268
10
$250
13
$215
8
4877
Port Douglas/Craiglie/Mowbray/Oak Beach
$320
41
$330
55
$290
44
CASSOWARY COAST REGIONAL
$250
57
$240
93
$200
79 12
4849
Cardwell
N/A
3
$205
8
$210
4852
Bingil Bay
$270
17
$260
27
$215
19
4854
Bilyana
$250
15
$225
12
$140
20
4860
Bamboo Creek
$250
21
$220
46
$190
27
TABLELANDS REGIONAL
$260
25
$240
28
$220
30
4880
Atherton/Upper Baron
$260
18
$250
21
$230
21
MAREEBA SHIRE
$280
27
$250
41
$250
31
Mareeba/Biboohra
$270
23
$248
36
$250
30
21
Cairns & suburbs of Cairns
$385
7
$378
10
$340
8
DOUGLAS SHIRE
$410
10
$460
7
$400
17
Port Douglas/Craiglie/Mowbray/Oak Beach
$450
9
$460
7
$400
17
REIQ.com
DEC-20 L
Mt Sheridan/Bayview Hts/Tarrawarra/White Rock/Woree
4883
DEC-15
NEW BONDS
POST CODE
N/A
REDLYNCH
CASSOWARY COAST (LGA)
RENTAL MARKET - 2 BED UNITS
QUEENSLAND MARKET MONITOR • MARCH 2021 | ISSUE 49 REPORTING ON THE DECEMBER QUARTER 2020 | 97
Cairns
SALES MARKET - UNITS & TOWNHOUSES
Other Regional RENTAL MARKET - 2 BED UNITS
SALES MARKET - HOUSES <2400m2 SUBURB/LGA
ANNUAL ANNUAL QTRLY QTRLY ANNUAL ANNUAL MEDIAN MEDIAN QTRLY 1YR 5YR NO. MEDIAN NO. MEDIAN SALE SALE CHANGE CHANGE CHANGE SALES SALE SALES SALE (1YR (5YRS AGO) AGO)
POST CODE
BALONNE SHIRE
BALONNE (LGA)
9
N/A
N/A
26
$183,500 $195,000
-5.9% $195,000
-5.9%
BALONNE (LGA) ^
0
N/A
N/A
8
N/A
$-
N/A
$-
N/A
MURWEIH (LGA)
9
N/A
N/A
43
$88,000
$67,500
30.4%
$67,500
30.4%
MURWEIH (LGA) ^
1
N/A
N/A
11
N/A
$-
N/A
$-
N/A
21
$203,750
14.0%
101
$195,000 $217,500
MARANOA (LGA) ^
5
N/A
N/A
26
$385,000 $329,000
17.0% $329,000
17.0%
ROMA
13
$277,500
32.1%
80
$240,000 $236,250
1.6% $236,250
1.6%
CHARLEVILLE
6
N/A
N/A
34
$100,000
$75,000
-10.3% $217,500 -10.3%
33.3%
$75,000
33.3%
$/ WEEK
DEC-19
NEW BONDS
$/ WEEK
DEC-15
NEW BONDS
$/ WEEK
NEW BONDS
SOUTH WEST
SOUTH WEST
MARANOA (LGA)
DEC-20 LOCALITY L
4487 4455
$170
6
N/A
3
$180
N/A
4
N/A
3
$180
6
MARANOA REGIONAL
$175
14
$174
19
$185
26
Roma
$175
14
$182
18
$200
24
CLONCURRY SHIRE
$250
5
$278
10
$280
5
Cloncurry
$250
5
$278
10
$280
5
MOUNT ISA CITY
$255
54
$220
72
$250
65
Alexandria
$255
54
$220
72
$250
65
COOK SHIRE
N/A
3
$240
5
$200
13
Bloomfield
N/A
2
N/A
2
$280
5
St George
7
NORTH WEST 4824 4825
FAR NORTH PAROO (LGA) ^
2
N/A
N/A
5
N/A
$-
N/A
$-
N/A
QUILPIE (LGA) ^
0
N/A
N/A
2
N/A
$-
N/A
$-
N/A
BARCALDINE (LGA)
7
N/A
N/A
24
$88,500
$85,000
4.1%
$85,000
4.1%
BARCALDINE (LGA) ^
2
N/A
N/A
15
N/A
$70,000
N/A
$70,000
N/A
BLACKALL TAMBO (LGA) ^
0
N/A
N/A
7
N/A
$-
N/A
$-
N/A
LONGREACH (LGA)
9
N/A
N/A
35
CENTRAL-WEST
LONGREACH (LGA) ^
0
N/A
N/A
6
$135,000 $157,500 N/A
$-
CLONCURRY (LGA) ^
N/A
$-
N/A
10
$180,000
N/A
31
5
N/A
N/A
15
$150,000 $110,100 N/A
$-
36.2% $110,100
36.2%
N/A
$-
N/A
FLINDERS (LGA) ^
1
N/A
N/A
5
N/A
$-
N/A
$-
N/A
0
N/A
N/A
2
N/A
$-
N/A
$-
N/A
43
$310,275
33.5%
206
6.3% $240,000
6.3%
1
N/A
N/A
10
MOUNT ISA (LGA) ^
POST CODE
$255,000 $240,000 N/A
$-
N/A
$-
N/A
DEC-20 LOCALITY L
$/ WEEK
DEC-19
NEW BONDS
$/ WEEK
DEC-15
NEW BONDS
$/ WEEK
NEW BONDS
SOUTH WEST 4487 4455
MCKINLAY (LGA) ^ MOUNT ISA (LGA)
RENTAL MARKET - 3 BED HOUSES
-14.3% $157,500 -14.3%
NORTH-WEST CLONCURRY (LGA)
4895
4470
BALONNE SHIRE
$250
15
$245
12
$220
St George
$260
11
$250
11
$220
12 10
MARANOA REGIONAL
$260
42
$250
55
$250
53
Roma
$280
33
$250
47
$250
46
MURWEH SHIRE
$230
15
$220
18
$210
18
Charleville
$235
13
$220
17
$230
17
CENTRAL WEST 4730 4472
LONGREACH REGIONAL
$250
11
$270
21
$215
25
Brixton
$250
11
$270
21
$215
24
BLACKALL-TAMBO REGIONAL
$250
5
$175
10
$150
5
N/A
3
$190
7
$150
5 19
Blackwall
NORTH WEST FAR NORTH BARCALDINE (LGA) ^
2
N/A
N/A
15
WEIPA (LGA)
5
N/A
N/A
31
WEIPA (LGA) ^
0
N/A
N/A
0
N/A
$70,000
$475,000 $460,000 N/A
$-
N/A
$70,000
3.3% $460,000 N/A
$-
N/A 3.3% N/A
4824 4825
CLONCURRY SHIRE
$305
20
$320
23
$300
Cloncurry
$305
20
$320
23
$300
19
MOUNT ISA CITY
$425
71
$390
119
$400
91
Alexandria
$425
71
$390
119
$400
91
FAR NORTH COOK SHIRE
$320
19
$375
15
$270
23
4871
Almaden
$280
14
$293
6
$250
15
4895
Bloomfield
$350
5
$400
9
$270
8
Queensland Market Monitor is published by The Real Estate Institute of Queensland (REIQ). ABN 49 009 661 287
Sales data obtained from Core Logic RP Data (www.corelogic.com.au) and median weekly rental data from the Residential Tenancies Authority (www.rta.qld.gov.au). Enquiries about the reproduction of part or all of the information should be directed to the Corporate Affairs Division, REIQ. ©The State of Queensland (Department of Environment and Resource Management) 2019. Based on data provided with the permission of the Department of Natural Resources and Mines: [QVAS 2019]. The Department of Environment and Resource Management makes no representations or warranties about accuracy, reliability, completeness or suitability of the data for any particular purpose and disclaims all responsibility and all liability (including without limitation, liability in negligence) for all expenses, losses and damages (including indirect or consequential damage) and costs which might be incurred as a result of the data being inaccurate or incomplete in any way and for any reason. Disclaimer: The information contained in this publication, while based on information believed reliable, is not guaranteed. Nor is any of it tendered by way of investment advice; instead, it is intended only to inform and illustrate. No reader should act on the basis of any matter contained in this publication without considering and if necessary taking appropriate professional advice with regards to their own particular circumstances. The publisher and editor give no representations and
make no warranties, express or implied, with respect to the accuracy or completeness of any of the material (including statistics, advertisements and advertising features) contained in this publication. The publisher and editor expressly disclaim any and all liability to the reader, whether a purchaser of this publication or not, in respect of anything and the consequences of anything done or omitted to be done by any such person in reliance, whether whole or partial, upon the whole or any part of the contents of this publication. The publisher, editor or contributors will enter into no correspondence in relation to this publication. The mention of the company, organisation, person, investment strategy or technique does not imply endorsement by the publisher. The publisher has not vetted advertisers and their products/services. The inclusion of advertisements or special advertising features in this publication does not imply endorsement of the advertiser/s or their products/services by the publisher. Articles are published in reliance upon the representations and warranties of the authors of the articles and without knowledge of any infringement of any third party’s copyright. Copyright: This publication is protected under the Commonwealth Copyrights Act 1968 and may not, in whole or part, be lent, copied, photocopied, reproduced, translated or reduced to any electronic medium or machine-readable format without the express permission of the publisher. For permissions or reprints, contact the Corporate Affairs Division on phone 07 3249 7347. Despite the preceding, you may distribute copies of this publication to your clients but you may not earn revenue from the publication or publish the publication on any website.
98 | QUEENSLAND MARKET MONITOR • MARCH 2021 | ISSUE 49 REPORTING ON THE DECEMBER QUARTER 2020
REIQ.com
Are you getting the most out of your REIQ membership?
8
reiq membership benefits:
1
FREE LEGAL ADVICE
2
FREE RESOURCES
3
4
5
Do you have a question about an agreement, a contract or behaviour of a client or competitor? We are here to answer your questions. Receive free access to articles, webinars, podcasts and toolkits such as the ‘Coronavirus Toolkit’ and the ‘Disaster Relief Toolkit’.
6
7
REALWORKS DISCOUNTS
Receive discounts on real estate forms, contracts and agreements. Agencies save up to $480 per year!
COURSE DISCOUNTS
Join 60,000+ REIQ graduates! Save money on high quality training and courses including the full licence upgrade.
EVENT DISCOUNTS
Save money, gain CPD points and network with hundred of real estate professionals during our webinars and in-person events including ‘Women in Real Estate’ and the annual ‘REIQ Awards for Excellence’.
8
ADVOCACY
The REIQ advocates on behalf of the Queensland real estate industry to influence important political, economic and social issues as well as industry working conditions. As a member, it’s important your voice is heard.
LEVERAGE THE REIQ BRAND
Promote your business with the REIQ brand. With a history of over 100 years, the REIQ represents trust, credibility and integrity in the real estate industry.
BE RECOGNISED
Be recognised as a top performer with eligibility in the REIQ’s annual Awards for Excellence.
VISIT THE MEMBERSHIP PORTAL
REIQ.com
Subscribe to
Queensland Market Monitor
Visit REIQ.com/QMM and never miss an issue 1
TH
ANNIVERSARY