
6 minute read
NKY Atlas to give leaders new insight to region


BY KENTON HORNBECK | LINK nky REPORTER
No part of this publication may be used without permission of the publisher. Every effort is made to avoid errors, misspellings, and omissions. If, however, an error comes to your attention, please let us know and accept our sincere apologies in advance.
On The Cover
Beechwood starts to celebrate in the fourth quarter as the final clock approaches zero at the KHSAA Class 2A state championship game at Kroger Field in Lexington. Brandon Wheeler | LINK nky contributor
Speaking at the newly renovated Turfway Park in Florence, Northern Kentucky Tri-ED CEO Lee Crume was anxious to reveal the region’s newest resource in its battle for increased economic prosperity.
Crume, along with TriED research director David McAleese and Florida State University economics professor Dr. Jerry Parrish, unveiled the Northern Kentucky Atlas, a data dashboard for the region. The tool features over 200 unique data sets for Kenton, Campbell and Boone counties, including statistics on access to high speed internet, food insecurity, per capita income and travel time to work.
Parrish and McAleese explained to a crowd of regional business leaders how the free visual resource works, why it’s important and how it can be utilized to further contextualize the intricacies of the Northern Kentucky market.
Tri-ED partnered with Chicago-based analytics startup Metopio to create the Atlas by curating publicly available information and statistics.
“The Northern Kentucky Atlas provides an open and interactive source for data on wide ranging topics pertinent to our region,” McAleese said. “The platform enables us to collect, analyze and disseminate data to the community while also putting the power in the hands of individual use.”
The region’s economy has evolved to include more workers, diverse industries and connected infrastructure.
Previously an agriculture-focused economy with swathes of land owned by generational farmers, the region now boasts 21st century industries like the logistics hub at the Cincinnati/Northern Kentucky International Airport and a quickly growing life sciences sector.
While the modernization of the economy has materially changed the lives of those in this region, this change has brought about new challenges.
Leaders are worried about an aging and retiring workforce, and the region’s educational and training opportunities to close the trade skills gap. They are looking for answers on the unemployment rate, and how to move disengaged workers into a meaningful economic role.
The data provided in the Atlas is designed to help leaders and individual businesses pinpoint specific variables related to these issues and to help identify data points that may have been overlooked.
The Northern Kentucky economy is doing well, according to Crume. It has a high labor force participation rate at 68%, the highest number of college graduates in the region’s history and high speed internet access across all three counties, even stretching down into rural areas.
“We’re a prosperous community. Sixty-eight percent labor participation rate is a fantastic number. It is well above the Kentucky average, above the Ohio average and above the US average. That is something we should really feel good about,” said Tri-ED CEO Lee Crume. “The median income of this community is a really good number. If you look at these other numbers, we might then start to say, ‘How do we make sure we stay on this prosperous track?’”
The Atlas aims to drill beneath the surface and highlight where there are economic disparities. Data measurements can be seen at the county, city, zip code and census levels. When researchers get to the zip code level, the economic disparities become more identifiable, McAleese said.
“We are on the lower end of the poverty rate. We’re on the lower rate of housing cost burden. I could go on,” said McAleese. “However, as you start to drill down below the region’s surface getting down to smaller geographies, you start to see that, yes, there is some of that disparity. There are areas in our region where particularly childhood poverty, poverty rate of those under the age of 18, are fairly high. When you start to look at zip codes, there are certain areas where we definitely are at risk of leaving them behind.”

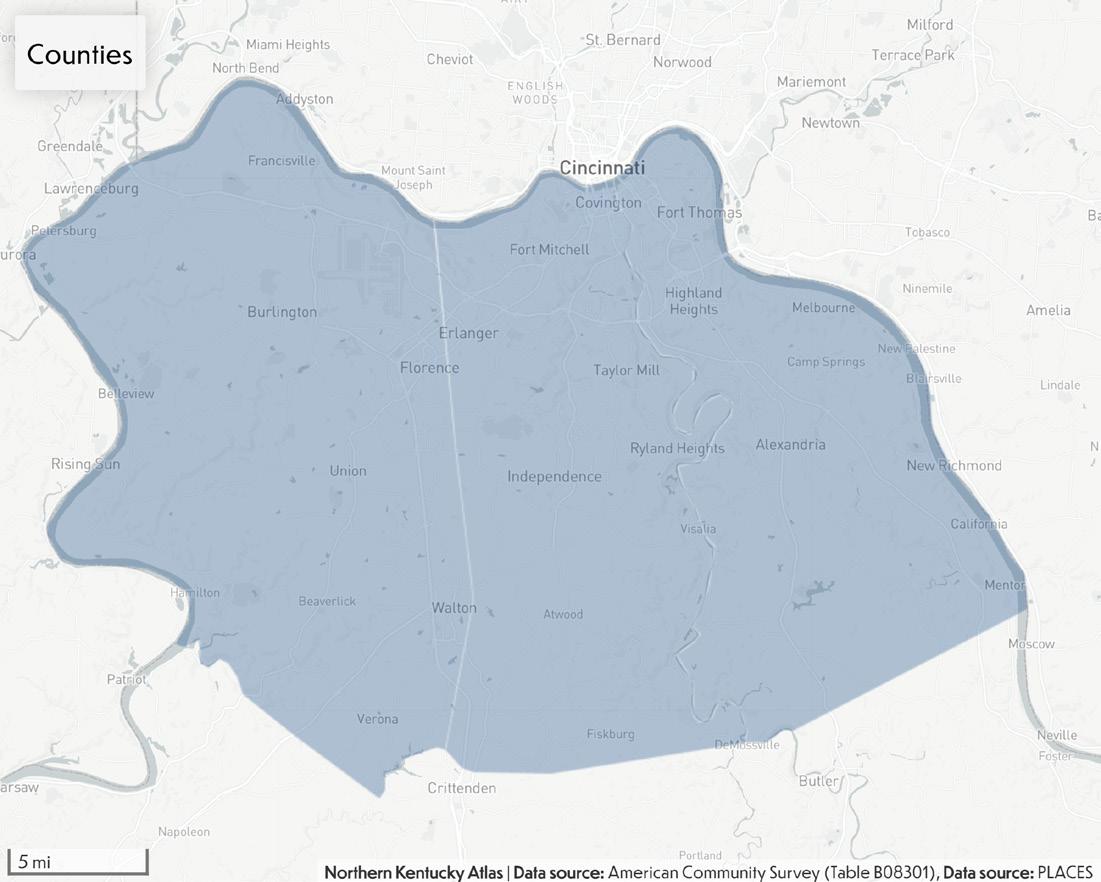
This phenomenon is highlighted by the map feature of the Atlas which can show an overview of the counties segmented by zip codes. The Atlas provides the user with visuals to show the economic disparities among Northern Kentucky’s population areas.
It shows 5.54% of Fort Thomas families in the 41075 zip code live in poverty, which is below the 10% average poverty rate for Northern Kentucky, according to Tri-ED data.
In contrast, the zip code next door which includes Newport, Woodlawn, parts of Southgate and Wilder, has one of the highest poverty rates in the region. Atlas data shows 24.11% of these residents with a 41071 zip code are living in poverty. The Atlas will allow leaders and the public to see these bordering zip codes, their differing poverty levels and the factors that contribute to them, like urban density, cost of living, median earnings for workers, and education levels.
Economic disparities between urban, suburban and rural areas can also be viewed. A good way to measure this is to utilize the Atlas’ Hardship Index and filter the search down to zip codes.
The Hardship Index is a composite score reflecting hardship in the community. The score incorporates unemployment, age dependency, education, per capita income, crowded housing, and poverty into a single score that allows comparison between geographies.
Rural zip codes such as 41063 in Kenton County have a 46.4 score on the Hardship Index, compared to urban zip codes, like 41014 in Covington, which has a 76.6 score. Urban zip codes typically score the highest on the Index, followed by some rural areas. Suburban zip codes, like those in Edgewood, Lakeside Park and Crestview Hills, have the lowest Hardship Index scores –the Atlas shows a 15.7 score for those three communities.
“This not intended to discourage but rather to get us thinking about where we can lean in on some of these challenges, how we can explore these issues with the help of the Atlas to understand what the data is telling us and to use the collective leadership in this room to brainstorm around how we can enhance or refine our strategies,” McAleese said at the Tri-ED forum.
Crume and McAleese both told LINK nky that the Atlas will continue to add meaningful metrics, like library card usage and cargo and passenger data from CVG. There’s also potential for the Atlas to include data from the surrounding rural counties of Pendleton, Grant and Gallatin in the future.
Complex problems require data-driven solutions. As Northern Kentucky continues to evolve socially, economically, politically and educationally, resources like Atlas will be an important key to solving the region’s issues of tomorrow.

How to use the Atlas
The Atlas is available to the public for free at atlas.northernkentuckyuse.com.
On the site is information about how and where the data was collected, comparable markets to Northern Kentucky, and a 4-minute instructional video on how to use the Atlas. For each datapoint, the Atlas shows users the resource the information was originally extracted from as well.
Users can search by topic, use a quick search tool, or view the user guide to see an in-depth look at what the Atlas can do.
Under the topics menu are eight categories the data is organized into: demographic, infrastructure, quality of life, education, economic, health, housing, and workforce. Under each of those topics are subcategories. For example, listed under quality of life, users can see data on crime, food access, depression, land, and pollution.
The data is whittled down further into groups. If one wants to see crime, they can select whether they want to see data on burglaries, aggravated assaults, homicide, and several other key words. Likewise, if someone wanted to see what access to the internet is like across the region, each county, city, or zip code, they can look under the infrastructure tab in technology, where access to internet is the first selection.
Once users find the data, it can be viewed on the map of the three-county region. It can also be viewed as a bar graph and both views can be downloaded into an image. In the same menu, the item can be viewed by rank, giving users a look at the same piece of data across the three-county region.
They can see the data source, and are given the option to download the raw data. Most of the data is from surveys, so users will also see a confidence interval.


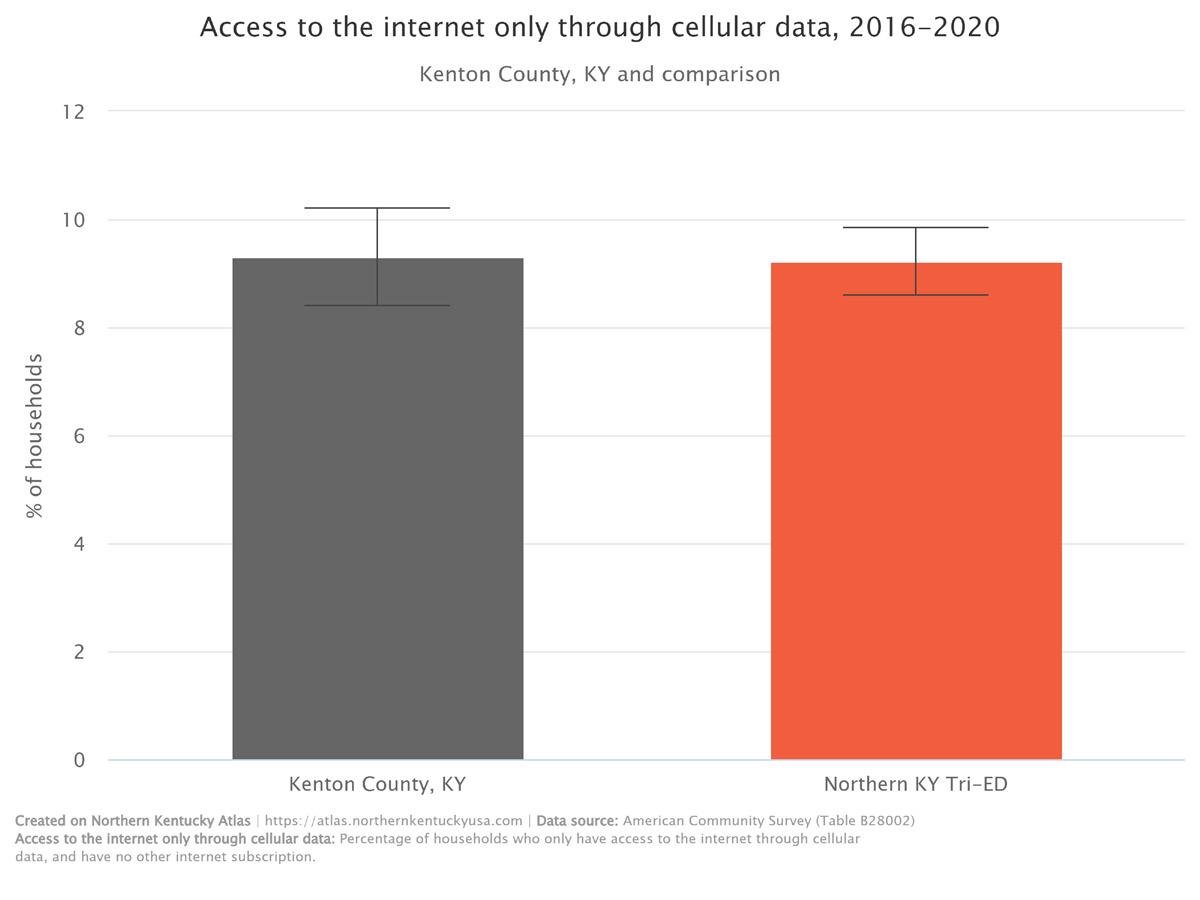
When viewing access to internet in Kenton County, the Atlas shows around 9.3% of households can only access the internet through cellular data rather than a broadband connection. When viewed by rank, the data shows 7.6% of homes in Boone County only have access to cell data, and 11.4% of homes in Campbell County only have cell data – ranking Campbell County third in the region for access to the internet. The confidence interval for this data category shows that Campbell County’s 11.4% datapoint could be off by 1.23%.
The Atlas also allows users to customize their search by adding map layers, changing the topic, adjusting the year the data was collected and by adding filters by keyword to create a heat map using multiple variables. The map settings can also be customized to increase visibility, and same options are available for the chart view.
Users can compare the data to other markets from the list provided by the Atlas by typing the market from the list into the places tab.
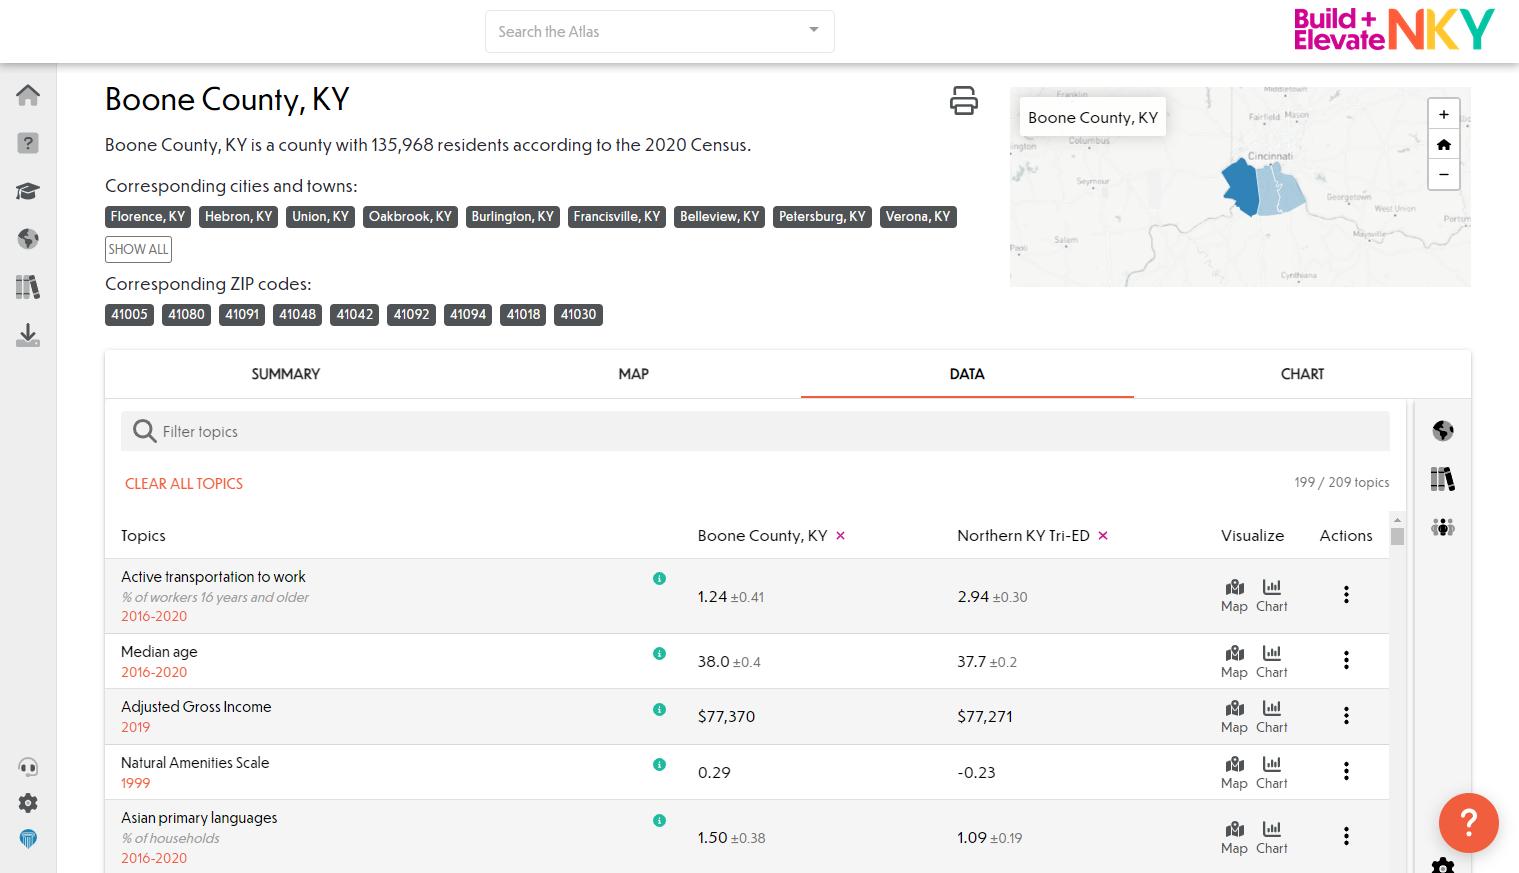
If a user isn’t looking for something specific, they can select a county to view under places and a new option will appear. A data tab shows information for all 200-plus topics available for each county.