9 minute read
Cover Story

Using Results from the National Turfgrass Evaluation Program ( NTEP )
By Dave Han, Ph.D. Auburn University and Alabama Extension
Advertisement
The National Turfgrass Evaluation Program (NTEP) is a fantastic source for information on newly-released and upcoming turfgrass varieties. Since 1983, NTEP has been evaluating turfgrass varieties and making data from those variety trials available for free to the public. A survey of turfgrass managers published in 2019 determined that 87% of the 306 respondents to the survey had heard of the NTEP program. At the same time, over half of the respondents (52%) said they visited the NTEP (www.ntep.org) website to look at trial results either never or less than once per year (Yue et al., 2019).
Could NTEP be used more? I think so. I personally use their data many times per year, but along the way I have developed some tricks and tools to help me get the most out of what sometimes seems to be an overwhelming mountain of numbers. So let’s take a quick tour of NTEP, what it is and how it works, and how to find what you need from their data reports.
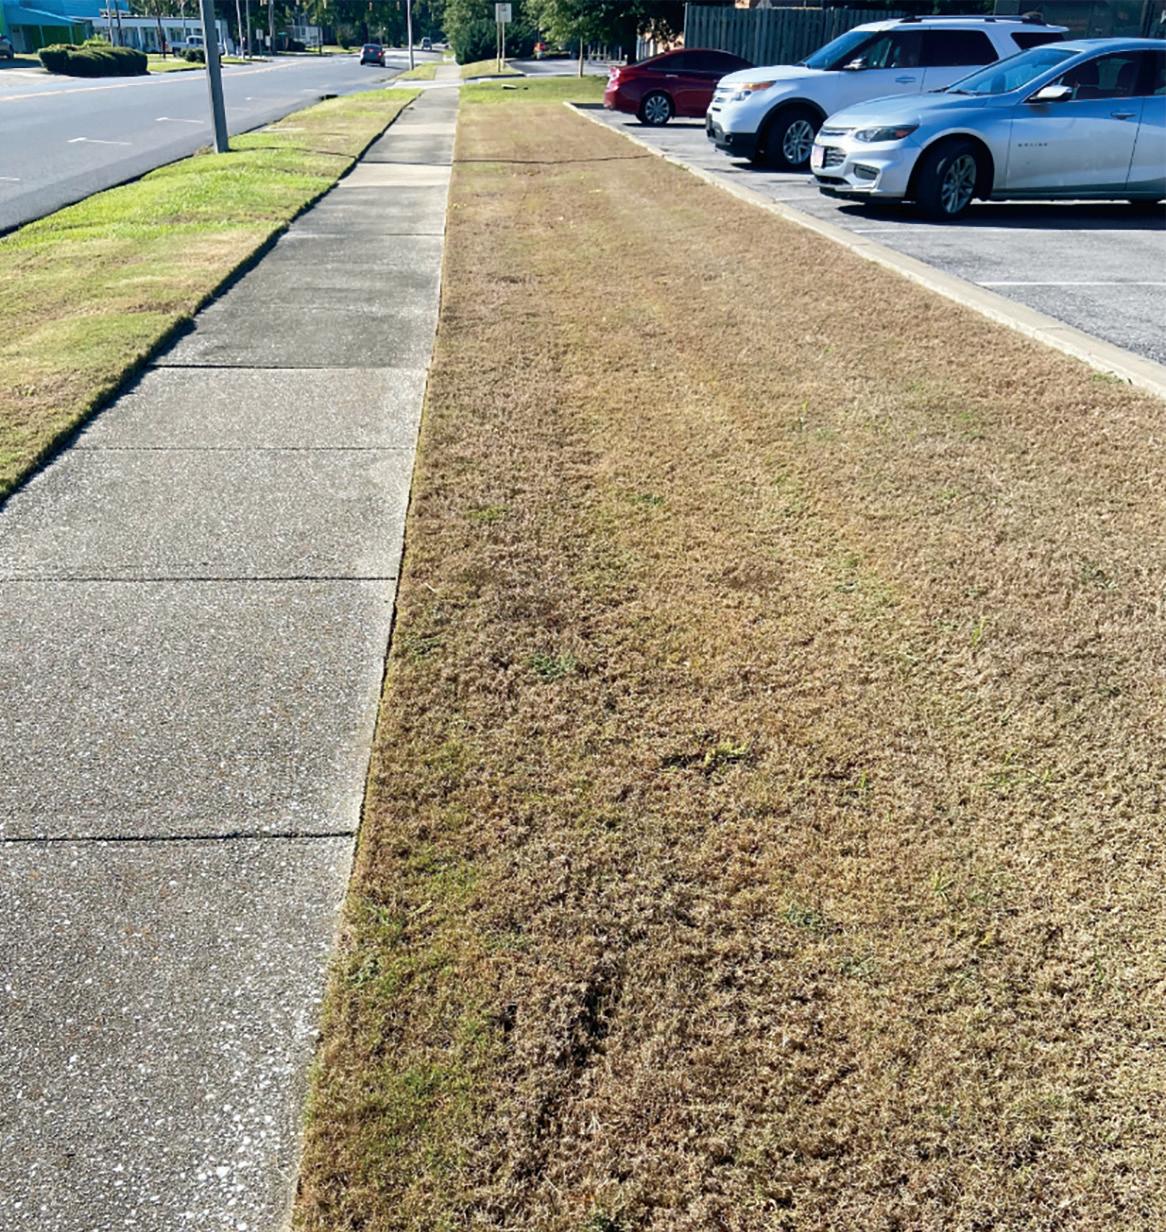
Ryegrass fairway overseed NTEP Test Eufaula CC

Auburn University Turf Unit Zoysia NTEP
How NTEP works
NTEP is a non-profit cooperative effort between the U.S. Department of Agriculture, state universities, and turfgrass industry groups. The variety trials that NTEP sponsors, cover the most commonly-used turfgrasses (both cool season and warm season, see Table 1) in the United States. Trials typically run for five years, and are called by the year they were established. For example, the 2013 National Bermudagrass Test was planted in 2013 and contains data from the 2013–2017 growing seasons. The currently-running bermudagrass trial is the 2019 National Bermudagrass Test, which was established in 2019.
Tests are established at many sites throughout the regions where a particular species will grow. Typically, there are around 10 – 15 sites, though this varies with each test. The sites are usually associated with research universities – for example, at our main research facility in Auburn, Auburn University has the current bermudagrass and zoysiagrass NTEP trials. We also had the just-finished 2016 St. Augustinegrass trail and established a bentgrass trial this fall. In the past, we have also run NTEP tests at outlying research units, such as a tall fescue trial at the Sand Mountain Research and Extension Center in northeastern Alabama. Occasionally, NTEP will place tests on-site, especially for tests on putting greens. NTEP also ran a perennial ryegrass overseed trial, with locations on golf course fairways. For on-site tests, the golf course maintains the tests day-to-day, and university researchers typically evaluate the tests the same way they do on-campus ones.
Because NTEP places trials in as many places as it can where a species will grow, they are able to collect data from many different environments. This is good, but it can also trip up an end user. For example, the current bermudagrass NTEP has locations including Riverside, CA, Ft. Lauderdale FL, Wichita, KS, and West Lafayette, IN. While it is very helpful for a plant breeder at a university or a seed company to know how their new bermudagrass performs in environments as different as these, if you are a sod farmer, landscaper, sports field manager, or other end user, you probably are interested only in how the grass performs in your own environment. More on this later.
TABLE 1. NTEP tests data are available for these species
COOL SEASON
Creeping bentgrass (putting greens)
Creeping bentgrass (fairways/tees)
Fineleaf fescues
Tall fescue
••••••••••
Bermudagrass
WARM SEASON
Buffalograss
Zoysiagrass
St. Augustinegrass
Seashore paspalum
••••••••••
What are NTEP ratings?
There is a lot of information available from NTEP tests, but the bread and butter is the visual quality rating. There have been attempts over the years to determine whether equipment such as handheld optical sensors can provide more consistent, better, or faster ratings, but a trained observer still functions as well as equipment and has the advantage of being cheaper and more universally available. Still, the fact that different people evaluate ratings at each site is important to remember when looking at the data.
NTEP publishes guidelines on how to rate their tests on the web (https://ntep.org/pdf/ratings.pdf). Quality ratings are taken on a scale of 1 – 9, where 1 is the poorest possible rating (no turf at all) and 9 the best. A rating of 6 or above indicates acceptable turf quality. This means that a rating of “6” has a different meaning when evaluating a bentgrass putting green versus a tall fescue lawn. Quality ratings take into account the density, texture, color, and effects of pests or environmental stress on the turf. Often these individual factors are broken out and rated separately, too.
Sometimes, a location will focus on a specific factor – for example, locations in arid environments often focus on rating drought or salinity tolerance. Sometimes, a particular site will put extra stress on a test – traffic being the main examples. Only some sites in any given test will do this. Finally, some sites may let disease or insect damage go to a certain point in order to see differences in varieties’ susceptibility – but not let plots die completely. Most sites control diseases and insects to ensure that the trial can run for the full five years.
Many of the varieties in the tests have names already and are commercially available, but some are not. Often, companies and/or universities will place varieties in the NTEP studies under their own internal code numbers, and the ones that do well will get names and be released in the future. NTEP tests also include standard varieties for comparison. These are wellestablished, popular varieties such as Tifway bermudagrass or Penn A-1 creeping bentgrass.
How do I use NTEP ratings?
Figure 1 shows the final NTEP report for the entire five years of the 2013 bermudagrass test. The first thing I always do when looking at NTEP data is to skip the overall rating mean that NTEP provides in the rightmost column (highlighted in red). Why do this? That column is the average of ratings for each variety over the entire test. But, the entire test includes sites with radically different environments. Of course, everyone wants a variety that does well in all environments (that’s what the overall average or mean rating will tell you).

FIGURE 1. A sample NTEP summary table. Although the varieties are ranked by their mean (average) quality rating over all of the sites in the test (highlighted in red), it is advisable to begin by looking at ratings from individual sites with environments that most closely match the area where an individual will grow the grass. For example, in this bermudagrass test, data from sites with environments similar to that found in Birmingham, Alabama are highlighted in green.
I prefer to look at individual sites first and start with ones in environments similar to where I would grow the grass. For example, many readers of the Alabama Turf Times might be more interested in how a variety performs in Auburn, AL, Griffin, GA and Starkville, MS (highlighted in green) than in Indiana or Missouri. But if I were interested in a grass for the transition zone, then sites like West Lafayette, IN or Columbia, MO would be much more interesting to me.
Sometimes there is a variety that does really well in one part of the country and not another. This may drag down its average rating, but in the environments where it is suited, it could be a real star. You also want to avoid varieties that may do well in most environments (so they have a good overall rating) but might be weak in your particular one.
In recent years, NTEP has sorted out results by region for some tests, publishing separate data table for sites with similar environments. This is great. I hope that it continues with future tests.
The other extremely important thing to know about NTEP data is the LSD value. LSD stands for Least Significant Difference, and it’s a measure of how likely results are to be true differences in variety performance, and not just random chance. Figure 2 shows an example of this from a bermudagrass test. Any difference between two varieties’ ratings that is smaller than the LSD value can’t really be attributed to an actual difference between the varieties. His means that there is usually a group of varieties at the top of the ratings that statistically all performed the same. It’s almost impossible to use NTEP data to find the “ONE TRUE BEST VARIETY!” But what NTEP does very well is give you a list of top-performing varieties you can choose from. It also tells which varieties did not perform as well as others.

FIGURE 2. The LSD value given in the data table (highlighted in red) is critical for separating cultivar ratings. Any difference between ratings that is less than this value is not statistically significant. In this table, all of the varieties highlighted in yellow cannot be separated because the difference between them is less than the LSD of 0.3.
Future plans for NTEP are to provide data in graphical form, which should make it easier to read than tables of numbers. Online tables with ratings sortable by location would be on the top of my personal wishlist for new data presentation formats. But still, I think that the NTEP data are underused and many more people can benefit from all of the work that the researchers put into running the tests.
REFERENCES
Bell, G. E., Martin, D. L., Koh, K., & Han, H. R. (2009). Comparison of Turfgrass Visual Quality Ratings with Ratings Determined Using a Handheld Optical Sensor, HortTechnology 19: 309-316.
Krans, J.V. and Morris, K. (2007), Determining a Profile of Protocols and Standards used in the Visual Field Assessment of Turfgrasses: A Survey of National Turfgrass Evaluation Program-Sponsored University Scientists. Applied Turfgrass Science, 4: 1-6. https://doi.org/10.1094/ ATS-2007-1130-01-TT
Morris, K.N. and Shearman, R.C. NTEP Turfgrass Evaluation Guidelines. (Undated) https://ntep.org/pdf/ratings.pdf
Yue, C., Wang, J., Watkins, E., Xie, Y., Shekhar, S., Bonos, S. A., Patton, A., Morris, K., & Moncada, K. (2019). User Preferences for Accessing Publically Available Turfgrass Cultivar Performance Data, HortTechnology 29:, 599-610.