01 — MARKET LANDSCAPE /INVESTOR BRIEF · 2026 → 2030
The Global EV Charging Market
Sizing the build-out behind the global electric-mobility shift — what investors, operators, operators, and B2B buyers should price into the next five years.
GLOBAL MARKET SIZE
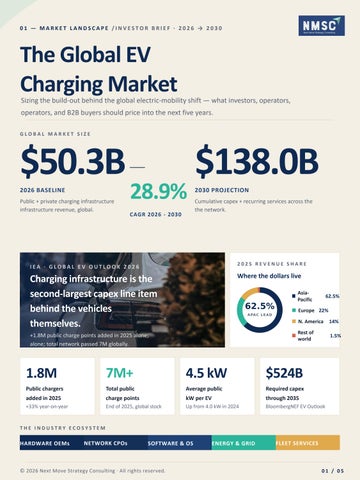
$50.3B 2026 BASELINE Public + private charging infrastructure infrastructure revenue, global.
28.9% CAGR 2026 - 2030
$138.0B 2030 PROJECTION Cumulative capex + recurring services across the the network.
2025 REVENUE SHARE
Where the dollars live
Charging infrastructure is the second-largest capex line item behind the vehicles themselves.
AsiaPacific
62.5%
Europe 22% N. America
14%
Rest of world
1.5%
1.8M
7M+
4.5 kW
$524B
Public chargers
Total public
Average public
Required capex
added in 2025
charge points
kW per EV
through 2035
+33% year-on-year
End of 2025, global stock
Up from 4.0 kW in 2024
BloombergNEF EV Outlook
THE INDUSTRY ECOSYSTEM
HARDWARE OEMs
NETWORK CPOs
SOFTWARE & OS
© 2026 Next Move Strategy Consulting · All rights reserved.
ENERGY & GRID
FLEET SERVICES
01 / 05
02/DRIVERS & OPPORTUNITY/DEMAND × GROWTH × REGION
Growth Drivers & Opportunities Four demand drivers, three segment frontiers, and four regional runways — pitched for capital capital allocation, not policy defence.
DRIVER · 01
DRIVER · 02
EV adoption accelerating
Policy & mandate tailwinds
DRIVER · 03
DRIVER · 04
Running-cost economics are decisive decisive
Fleet & heavy-duty tipping over
SEGMENT FRONTIERS
REGIONAL RUNWAYS
Where the next dollar lands
Where the next dollar comes from
Level 2 AC — workplace, fleet
52%
Asia-Pacific
+30%
CAGR · ~62% share High unit volume — the network’s workhorse layer.
DC fast (50–150 kW)
28%
Europe
+20%
CAGR · AFIR corridor coverage Corridors & ride-hail — ~34% CAGR through 2030.
DC ultra-fast (>250 kW)
14%
North America
+24%
CAGR · private capex filling gap 8× build by mid-2030s per BloombergNEF.
Megawatt HDV & depot
6%
MEA · LATAM
+20-22%
Highest % growth; under-penetrated New frontier — BYD / Huawei 1+ MW pilots live.
© 2026 Next Move Strategy Consulting · All rights reserved.
02 / 05
03 — COMPETITIVE FIELD /PLAYERS · POSITIONING · MOVES
Competitive Scenario Eight players are setting the tempo and four moves define who compounds capital versus who defends who defends share. POSITIONING MATRIX
TOP NETWORK PLAYERS
Eight players, two axes
Scale & focus
P U B L IC × S O FT W A RE
P U B L IC × A S S E T
Network + recurring SaaS
CapEx-heavy corridors
ChargePoint Tesla
Star Charge APAC #1, expanding to EU
NYSE: CHPT
NACS-led integrated
bp pulse Oil-major entry
ChargePoint
Tesla Supercharger NASDAQ: TSLA
NA network + SaaS flywheel flywheel
ABB E-mobility Industrial DC fast
ABB E-mobility
D IS T RIB UTE D × A S S E T
D IS T RIB UTE D × S O FT W A RE
Hardware OEM & B2B
Residential & bi-di
Schneider Electric
NYSE: ABB
EVgo
Industrial & commercial OS
US DC fast specialist
Star Charge Private · China ALSO TO WATCH
EVgo · Wallbox · Ionity
Wallbox · V2H pilots Residential chargers
Three operators rounding out the the field.
SOFTWARE-LED ← CAPEX MODEL → ASSET-LED FOUR MOVES DEFINING THE NEXT LEG
Strategic playbook MOVE · 02
MOVE · 03
MOVE · 04
Standards unify the TAM
Software is the moat
Ultra-fast & vertical vertical scale
Capital flood & M&A M&A
85%
60%+
8×
6+
MOVE · 01
© 2026 Next Move Strategy Consulting · All rights reserved.
03 / 05
04/INVESTMENT OUTLOOK/THESES · RISKS · HORIZONS
Where to place capital Five theses for the 2026–2030 capex window and three risks that sharpen each one.
TH ESI S 0 1
TH ESI S 0 2
TH ESI S 0 3
THESI S 0 4
THESI S 0 5
25%+
60%+
8×
$30B+
V2G
gross margin in
DC ultra-fast build by
HDV-charging TAM,
bidirectional arbitrage
charging SaaS
mid-2030s
greenfield-led
option
Software is the moat; hardware is the ticket.
>250 kW is the new ceiling per port.
utilization breaks public-network math
Margin is set by utilization, not unit unit price.
Corridor + depot — one flywheel.
Cars as dispatchable assets.
RISKS & COUNTER-CONSIDERATIONS
RISK · 01
RISK · 02
RISK · 03
Grid bottleneck & interconnection
Utilization shortfall
Policy whiplash
MITIGATE · prioritize corridors and fleet anchors.
MITIGATE · underwrite on selfsustaining economics.
MITIGATE · partner with utilities; build build BTM storage.
WHERE WE WOULD START
Three horizons, sequenced for capital conservation HORIZON 1 · 0–12 MONTHS
HORIZON 2 · 12–24 MONTHS
Software & services anchor
Ultra-fast corridor rollout
White-label SaaS, energy mgmt, depot depot retrofits.
HORIZON 3 · 24–48 MONTHS
HDV + V2G pilots 2nd-tier metros and fleet-anchored sites.
© 2026 Next Move Strategy Consulting · All rights reserved.
Megawatt hubs and bidirectional bidirectional hardware.
04 / 05
05 — CLOSING /NEXT STEPS & DIRECT CHANNELS
Thank you. Let’s talk about what this means for your portfolio, your corridor rollout, or your next bid response.
THE NETWORK AT A GLANCE Public + private charge points are are scaling at a record +33% clip.
DIRECT CHANNELS
clip.
Reach the analyst team CALL US
WRITE TO US
VISIT
+1 857 758 5017
info@nextmsc.com
nextmsc.com
Monday–Friday · 9am to 6pm ET
Briefs, RFPs, custom research
250+ live market reports
THE FULL REPORT
→
Global EV Charging Market — full investor brief
FOLLOW THE TEAM
Five places we publish & answer questions
X / Twitter
YouTube
Company page
Updates + live
Real-time
Long-form
Visual
+ briefings
event coverage
commentary
briefings
briefings
linkedin.com/compan
facebook.com/
twitter.com/nextmsc
youtube.com/channel
instagram.com/nextm
any/
Next-Move-Strategy-
c
nel/
tmsc
next-move-strategy-
Consulting
consulting
© 2026 Next Move Strategy Consulting · All rights reserved.
UCJuVRxfBo-
Dsog7BgDE4uPQ
05 / 05