
15 minute read
6. RESULTS


6. RESULTS
The tests were performed from June to August 2020, in the Laboratory Library. The windows were kept open during measurements in order to maintain the indoor CO2 concentration around 450 ppm. The concentration was constantly monitored, with temperature, humidity and air velocity. 8 adults were selected, differing in age, sex, physical condition and respiratory characteristics. Each person repeated the test three times for all types of devices and in the two conditions of use. In total, 350 tests were performed with and without devices, as well as 105 thermographic photos.
6.1 Respiratory acts, volumes and exhaled composition
Table 1 report respiratory acts, air volumes and composition of the breath. Table 2 report the minimum, average and maximum values. Same results are represented in Figure 6.
Table 1. Breathing rate, volume and air concentrations (Test n)
Test 1 Test 2 Test 3 Test 4 Test 5 Test 6 Test 7 Test 8
breathing rate nr/min 16,7 6,0 3,3 9,3 5,3 10,8 7,0 11,3
exhaled air volume in one minute L 20,5 7,6 4,9 7,5 8,3 17,1 18,3 8,9
exhaled air volume per breath L 1,2 1,3 1,4 0,8 1,6 1,6 2,6 0,8
O2 Vol% 16,1 16,6 17,4 18,2 15,5 18,4 18,7 17,6
CO2 ppm 43000 43000 38000 34000 48400 32000 27600 39200
Table 2. Exhaled air: oxygen and CO2 concentration
exhaled air unit Minimum value Mean value Maximum value
O2
CO2 Vol% 15,5
ppm 27600 17,3
38130 18,7
48400
Figure 6
Figure 7 shows the CO2 concentration of exhaled air measured.
Figure 7. exhaled air: CO2 concentration (ppm)
Note:
During the tests, in the two conditions, the person could breathe in their usual way. Even though the person was not asked to keep under control, in order to stay as close as possible to the real conditions of use of the device, we still observed some variables that significantly influenced the result: - breathing frequency - head tilt - adhesion of the device to the face - air velocity near the nose-mouth, even with the device. The effect and presence of these elements that are difficult to control also allow us to have see the variability of real scenarios.
6.2 Influence of air velocity
The test was performed in two conditions:
1. Sitting - still air 2. Sitting - air velocity of 0.5-1.0 m/s on the face (Figure 3).
It was observed that both with and without the device, with a slight movement of air (0.5-1.0 m/s equal to a slow walk, in the case of the full-face helmet the speed was 10 m/s) CO2 concentration measured is significantly lower than when the air is still.
The tests carried out on the manikin (Figure 8 and Figure 9) explain the main reason for these values. In still air conditions, the exhaled air partially returns to the face and then it is re-inhaled. In moving air conditions, the exhaled air is quickly removed from the face, even with the device on. To have a further example of the role of air speed on the device, a test was also carried out with a full-face helmet.

Figure 8. Mannequin exhalation, still air. Figure 9. Mannequin inhalation, still air.
Figure 10. Influence of air velocity without the device
Figure 10 represents the concentration of CO2 (inhaled air) without the devices, in a sitting position and still air (in blue) and in a sitting position with air movement (with a speed between 0.5 and 1.0 m/s - in orange in the graph). Test 1 - 8 are the eight tested people. The variability of the results depends on the different breathing modes of people, who under the same conditions exhale and inhale air in different ways. The concentrations with air movement are lower for all eight people as compared to the case of absence of air movement.
Figure 11. Influence of air velocity with device
Figure 11 shows CO2 concentration (inhaled air) with devices: in red in conditions of still air, in blue with air moving with a speed between 0.5 and 1.0 m/s (for the helmet the speed was on average 10 m/s). Similar to the tests without the devices, the concentrations with air movement are lower than the case of absence of air movement.
6.3 Measurements with and without devices
The results of the tests with the devices are represented below. When the CO2 concentration is measured in the re-inhaled air, the “net” contribution was estimated by subtracting the ambient concentration of 450 ppm from the absolute concentration measured by the instrument. This is henceforth specified as the “net CO2 concentration” in this report. Each graph shows the minimum, average and maximum net CO2 concentration of the series of measurements.
Sitting and step: CO2 concentration
Figure 12. Sitting. Inspired CO2 Concentration net of ambient CO2
Figure 12 shows the results of the CO2 concentration measurements in ppm for the inhaled air net of that of the environment during the seated tests.
Figure 13. Step. Inspired CO2 Concentration net of ambient CO2
Figure 13 shows the results of the CO2 concentration measurements in ppm for the inhaled air net of that of the environment during the step tests.
Figure 14. Sitting. Inspired CO2 Concentration net of ambient CO2
Figure 15. Step. Inspired CO2 Concentration net of ambient CO2
Figures 14 and 15 show the same data as in Figures 12 and 13 without exhaled air.
Percentage of re-inhaled CO2 in seated and step conditions
Figure 16. Sitting. Net re-inhaled CO2 concentration
Figure 16 shows the ratio, in percentage, between the inspired and expired CO2 in the seated tests. This is called re-inhaled CO2.
Figure 17. Step. Net re-inhaled CO2 concentration
Figure 17 shows the ratio, in percentage, between the inspired and expired CO2 in the step tests. This is called re-inhaled CO2.
sitting
step
Table 3. Inspired CO2 concentration net of ambient CO2
Test 1 Test 2 Test 3 Test 4 Test 5 Test 6 Test 7 Test 8 mean value without CO2 ppm 700 450 250 350 150 2250 550 50 590 FFP2-KN95 CO2 ppm 4140 2520 2450 1220 2380 8080 5350 4650 3850 surgical CO2 ppm 3760 980 2320 950 4020 4880 4580 5320 3350 neck warmer CO2 ppm 5730 3320 4920 3080 2080 5800 10280 1480 4590 visor CO2 ppm 1310 480 2120 480 1620 950 1450 1520 1240 handcrafted CO2 ppm 4830 1180 5920 1120 4850 5850 6520 6280 4570
Test 1 Test 2 Test 3 Test 4 Test 5 Test 6 Test 7 Test 8 mean value without CO2 ppm 280 50 50 350 50 1250 150 50 280 FFP2-KN95 CO2 ppm 4890 2620 3780 3050 2750 3380 6350 5250 4010 surgical CO2 ppm 4820 1620 3520 1620 2850 3220 6050 4850 3570 neck warmer CO2 ppm 6140 3350 3920 3850 1150 6140 8820 3020 4550 visor CO2 ppm 1360 780 1050 780 1620 1720 1980 1450 1340 handcrafted CO2 ppm 6130 1850 4650 3850 3580 6150 8480 7150 5230
Table 4. Percentage of re-inhaled CO2 compared to exhaled
sitting
step
min mean max
without 0,2% 1,6% 4,6% FFP2-KN95 4,4% 10,1% 16,7% surgical 3,4% 8,8% 11,0% neck warmer 5,4% 12,0% 21,2% visor 1,8% 3,3% 4,4% handcrafted 4,0% 12,0% 13,5%
min mean max
without 0,2% 0,7% 2,6% FFP2-KN95 9,5% 10,5% 13,1% surgical 5,9% 9,4% 12,5% neck warmer 4,2% 11,9% 18,2% visor 2,8% 3,5% 4,1% handcrafted 6,7% 13,7% 17,5%
The percentages reported in Table 4 represents the re-inhaled part with respect to the exhaled air. These results are shown in the graph of Figure 18. For example, for the FFP2KN95 devices, an average value of re-inhaled CO2 of 10.1% in the seated case and 10.5% in the tests with the step was measured.
Comparison of devices in seated and step conditions
Figure 18. Inspired CO2 Concentration net of ambient CO2. Mean values
Figure 19. Net re-inhaled CO2 concentration. Mean values
Figures 18 and 19 show the average values of CO2 concentrations of inspired and re-inhaled for the various devices analyzed, respectively for the seated and step tests.
Tables 5 and 6 shows a comparison of the CO2 concentrations in everyday situations and the relative guide values.
Table 5. CO2 concentrations for comparison: guide value (first line) and typical concentrations (APPA Bolzano)
Guide value for indoor environments CO2 ppm School classroom
CO2 ppm Single bedroom - doors and windows closed CO2 ppm Train
CO2 ppm
Bus Car (1 person) Pizzeria-restaurant
CO2 ppm CO2 ppm CO2 ppm
1000 800-6000 800-3000 1500-2500 1000-2000 1000 800-2000
Table 6. Indoor CO2 concentration values in Ad-hoc AG IRK/AOLG, 2008
CO2 concentration (ppm) Hygienic evaluation Advice
< 1000
Hygienically not relevant • No intervention 1000-2000 Hygienically relevant • increase air changes • Check and improve ventilation habits >2000 Hygienically unacceptable • Check the ventilation system of the room • Check for further ventilation improvements
Note: various ISO-EN standards report reference values for CO2 in indoor environments, in particular UNI EN 16798-1 and ISO 17772-1 are specific for the design of ventilation systems and are used in public buildings. For the purposes of this study we prefer to report the guiding values proposed by the German Ministry of the Environment Ad-hoc AG IRK/AOLG, 2008", which are more easily understood, as these are very similar to the ISOEN standards.
Comments to the measurements
Tests show that CO2 concentration of re-inhaled air varies considerably for different nose and mouth covering devices. The highest values were obtained with FFP2/KN95, neck warmer and handcrafted mask. Slightly lower are the values of the surgical mask while with the visor, CO2 concentration is just above what is breathed without wearing any device. The differences in concentration between the minimum and maximum values are mainly due to the person's respiratory rate, the inclination of the head, the adhesion of the device to the face and the speed of the air near the nose-mouth. There are no significant differences between the two conditions examined: sitting and step; this is because the greater production of CO2 under stress is balanced by the greater energy with which it is expelled and the slight movement of air that is created by going up and down the step. Under intense exertion, gas concentrations and breathing conditions would certainly change, but this scenario is out of the scope of this study. The percentage of re-inhaled CO2 varies from a minimum value of 3.3% obtained with the visor to a maximum of 13.7% obtained with the handmade mask (Figure 19). The remaining inhaled air obviously comes from the environment. The measurements were made in an environment with low CO2 concentration (about 450 ppm). This value in the data analysis was subtracted from the inspired CO2. In fact, in a real situation, the concentration of the environment must be added to the re-inhaled concentration, which is often much greater than 450 ppm. It is also observed that even without wearing a device, in a sitting condition, with still air, tested people re-inhaled 1.6% of their CO2 while on the step, therefore under light effort and movement of air, the value was 0.7%. CO2 concentration in the breath varies from a minimum of 1240 ppm measured with the visor to a maximum of 5230 ppm measured with the handmade mask. In this regard it must be underline what the guidelines of the German environment ministry report (Ad-hoc AG IRK / AOLG, 2008): for indoor environment CO2 concentration in the range 1000-2000 ppm it is necessary to increase the ventilation of the environment, while above 2000 ppm it is not hygienically acceptable, and an intervention is necessary to improve indoor air. Comparing the IRK guide values with the results of the tests, it appears that only with the visor worn the CO2 breathed can remain below 2000 ppm, while with the other devices the air breathed would not be hygienically acceptable. Observing Table 5, however, it appears that in various conditions of daily life, in indoor environments, the value of 1000 ppm is exceeded for long periods. In particular, inside the classrooms, where students and teachers stay for most of the day, CO2 over 1000 ppm of are often exceeded, reaching values even higher than 5000 ppm. The results obtained demonstrate the importance that the environment, inside which the mask must be worn, should have optimal ventilation characteristics, so that the CO2 concentration is kept below 1000 ppm. This is a requirement that must be pursued even in the absence of the devices, but becomes more important when such devices are used.
6.4 Face surface temperature analysis
The results of the surface temperature measured with an infrared camera are represented below.
Figure 20. Variation of face surface temperature
Figure 21 Figure 22
Figure 20 shows the minimum, average (in blue) and maximum (extremes of black bars) values of the temperature variations for each device. Measurements were carried out in seated and step positions and were then averaged for all eight test subjects. The two thermal images were both taken without the device, Figure 21 before wearing it and Figure 22 after wearing it. The lighter the color, the higher the surface temperature. Figure 22 shows that the area covered by the device is the hottest.
The thermographic analysis (Figure 21 and Figure 22) shows that, in the portion of the face covered by the device, the surface temperature of the skin is 1.5-2.1 degrees higher than the portion of the face not covered; this data does not refer to the visor, in which there is an average temperature variation of 0.3°C only. For neck warmers, the temperature increase is not concentrated in the mouth-nose area, but extends to all the area covered by the device. The difference in temperature causes a slight sweating. Temperature variations and sweating are immediately perceived with discomfort by the person wearing the device. Under more intense efforts the temperature difference between the covered and uncovered parts is greater with a consequent increase in perceived discomfort. The subjective analyzes reported in paragraph 6.6 confirms the face surface temperature analysis.
6.5 Moisture absorbed by the device
The test was performed by wearing the device continuously for 1.5 hours, with various activities, sitting and in light movement. Every 30 minutes the weight of the device was recorded and the variation due to the possible absorption of moisture emitted by the person was evaluated.
unit Start 30 min 60 min 90 min KN95 g 5,34 5,35 5,34 5,34 surgical g 3,11 3,12 3,12 3,00 neck warmer g 27,81 27,93 28,84 27,87 handcrafted g 18,96 19,00 19,01 18,84
Tested devices have minimal weight variations, the damp sensation perceived by the person is almost exclusively caused by sweating of the part of the face covered by the device.
6.6 Subjective analysis
Subjective analysis performed on all the people who participated was aimed to evaluate, using a 5-point judgment scale (Likert scale), the comfort, difficulty in breathing and speaking and any psychological effects induced by the use of devices. The 5 questions were the following:
• it is uncomfortable • it makes me lose breath • it makes me claustrophobic • it makes me dizzy • It is difficult to speak.
The results showed a considerable variability of responses for all devices with the exception of screens. In addition, there is a marked dissatisfaction in the use of neck warmers, probably partly linked to the summer season and the temperatures during the tests. Figure 23 shows the questionnaire. The rating scale ranged from 1 to 5: the higher the value, the higher the discomfort.
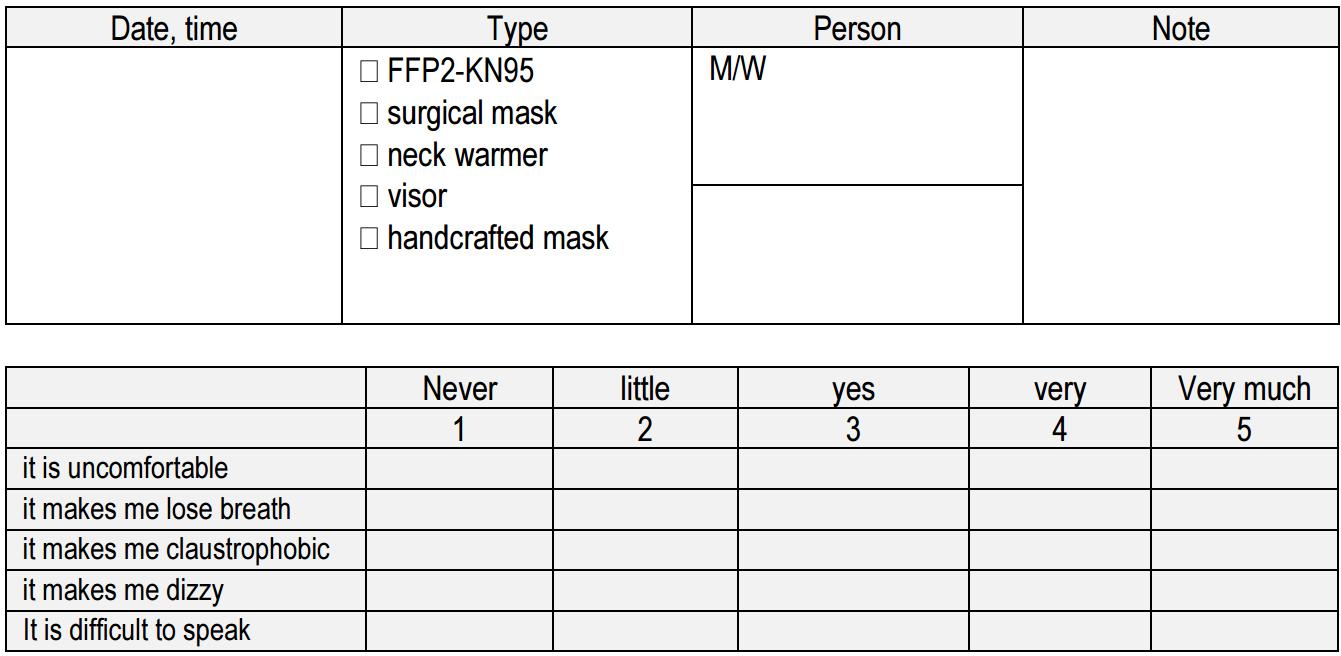
Figure 23. Questionnaire
Figure 24. Results of the subjective analysis (per device type)
Figure 25. Results of the subjective analysis (per question)
In order to determine an indicator that summarizes the perception that the interviewees had, the average of the values of the five questions was calculated.
Questionnaires results (mean value)
FFP2-KN95 2,1
Surgical mask 2,0 neck warmer 2,5 visor 1,1 Handcrafted mask 1,7
The subjective analysis underlined that: • The visor has the lowest score, i.e. greater comfort and less dissatisfaction. Participants unanimously declared that this device does not modify speech and it has no influence on the breathing pattern. • The device with the highest rating, that is the one that creates the most discomfort is the neck warmer. • There is no difference between FFP2-KN95 and surgical masks, while on average the perception of respondents is better for handcrafted mask.
6.7 Data summary
Integrating measured data (CO2 concentration, surface temperature variation) and those obtained from the questionnaires, the graph in Figure 26 is obtained.
Figure 26. Summary of the measured and subjective data: inhaled (seated) CO2 concentration, changes in face temperature and averages of the questionnaires
By superimposing the CO2 concentration data with thermographic and subjective analyzes, it can be undelined that: • CO2 concentrations, average temperatures and satisfaction have similar trends; • The visor is the device with an average inhaled CO2 concentration lower than the other devices; • There is no clear difference between FFP2-KN95 and surgical masks, both in terms of CO2 concentration, surface temperature and satisfaction.
6.7 Device analysis
Tests were carried out by inserting the device, before use, inside a glass cylinder with the two ends open: on one end an activated carbon filter was placed, on the other the air filtered by the activated carbon, exposed to the device and sent to the analytical system.
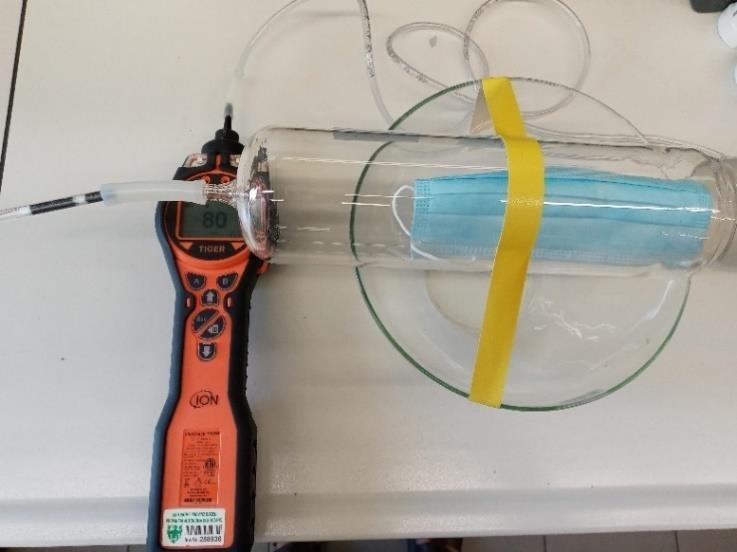
Figure 27. Device analysis
In these conditions the concentrations of formaldehyde and volatile organic compounds released by the devices were determined. For all devices, except one, the substances detected were very low in concentrations. For the surgical mask, shown above in Figure 27 (without CE certification), concentrations of hydrocarbons of about 2300 µg/m³ were detected as soon as it was removed from the plastic wrapping that contained it. After a few hours of exposure of the mask to the air, the concentrations dropped to an acceptable levels. Once washed, hand-made neck warmers and masks do not emit significant concentrations of polluting compounds.
Device type
A KN95 Table 7. Device emissions analysis
When opening the package TVOC ppb
4 hours after opening the package TVOC ppb When opening the package Formaldehyd ppb
< 10 <5
B Surgical mask - certified a
C
Surgical mask without certification D Surgical mask - certified a < 10
2300
< 10 < 10 <5
5
<5
a device certified according to EN 14683:2019
Table 8. TVOC composition of Device C right after opening the package
Parameter Results [µg/m3] Linear and branched HC 1343 2,4-dimethyl heptane 271 n-decan 187 N, N-Dimethyl acetamide 133 4 methyl octane 116 Toluene 56 4 methyl undecane 36 2,3,5 trimethyl hexane 34 n-dodecane 28 4 methyl heptane 25 2,3 dimethyl heptane 21 4.6 dimethyl dodecane 18 Ethanol 17
Sum without HC Sum 940 2283

