Supported by:
Organised by:
SHOWGUIDE Sponsored by:
#modellingworld
MODELLING TOMORROW’S SUSTAINABLE TRANSPORT SOLUTIONS TODAY
SYSTRA has been at the forefront of transport modelling for over 50 years developing innovative tools that meet the demands for transport and environmental appraisal throughout the world. We use the best tools on the market to ensure our clients achieve their transport planning aims and objectives.
Our key areas of exper琀se cover:
Working with our clients, SYSTRA can focus transport modelling on their speci昀c needs and provide approaches and tools that are proportionate, evidence based and ‘昀t for purpose’.
Demand & Behavioural Change
We utilise Innovative Data Visualisation techniques to ensure that complex model outputs can be fully understood and interrogated by all stakeholders irrespective of their transport modelling knowledge.
Cycle & Pedestrian
www.systra.co.uk
Climate Emergency Public Transport
Local and Strategic Highway Business Cases
MODELLING WORLD 2022 SHOWGUIDE
Welcome to Modelling World 2022 - and to two new sessions Models are simplified representations of reality, and because of their simplification, they allow us to estimate the consequences of assumptions we make. These could be about how people behave, about the state of the transport system in future, or about how our area of interest in general may, or should, develop. But there is a risk of an overreliance on models and their convenient simplifications, ignoring the messiness of what we can already observe in today’s real-life world. Plus, advances in sensing and monitoring enable us to gain better insights than what was possible even 10 years ago. My Institute for Transport Studies colleague Robin Lovelace at the University of Leeds said in a recent article something that struck a chord. “Many traditional transport planning tools focus on motor(ised) traffic, often at low levels of geographic resolution. Tools for twenty-first century transport planning need to tackle very different questions, such as: What are the barriers preventing people from switching to more sustainable modes of transport, and where are these barriers located? How are transport behaviours
likely to shift in the future, in response to technological changes including autonomous vehicles and the continued rise of online working? And how can citizens be engaged in transport decisions? Tools that can help answer these questions are becoming an increasingly important part of the transport planner’s cabinet”. (Open source tools for geographic analysis in transport planning, https://bit.ly/39W2gpv) I recommend you read it – it’s open access as well, so free to download. Robin’s work points us as modellers towards a more open-minded approach to data and models: to observe and understand before trying to simplify into mathematics and to allow modelling to be more than the application of commercial packages. My VLC colleague Ali Inayathusein says something similar: “The benefit of open source is that you can build upon the work of others, saving time and effort. You can customise to your needs, often without restriction and give back to the wider community allowing bright minds across organisations and geographic boundaries to collaborate to
produce creative solutions.” I have been interested in the realworld opportunity for open source software solutions for quite a while. They have become more robust over time, partly because of what Ali observes above. As expert practitioners we should allow ourselves to make up our own minds whether and when data driven tools, rather than mathematical models, are more appropriate to provide evidence, and if open source solutions can lead the way in reflecting the modes and the challenges that are less well covered by our traditional approaches and tools. The two sessions at Modelling World this year should provide ample opportunity to explore and learn. We hope you enjoy these new sessions on June 8, plus a full day of expert presentations on June 9, as usual exploring all that’s innovative in the data and modelling sector. n Tom van Vuren, Chair of Modelling
World, Regional Director UK & Europe at Veitch Lister Consulting and a Visiting Professor at the University of Leeds
Contents Modelling an emotive topic – dealing with induced demand Tom van Vuren, Regional Director, UK & Europe, Veitch Lister Consulting
4
Data capture: an innovative video-analytical solution Nick Mather, Business Development Director & Group Marketing Lead, Tracsis
6
The future isn’t (all) electric Duncan Irons, Corporate Marketing Director, SYSTRA
7
Modelling World 2022 Delegate Information
99
A new initiative from Modelling World: Exploring Open Source Software Dustin Carlino, Research Associate, The Alan Turing Institute & Cartographer, A/B Street and Ali Inayathusein, Executive Director (Modelling and Analytics) at Veitch Lister Consulting
21
The benefits of commercial transport modelling software Devrim Kara, Director, PTV UK
22
Editorial offices
Managing Director
Design / Production
© Landor LINKS Ltd 2022
Apollo House 359 Kennington Lane London SE11 5QY
Rod Fletcher rod.fletcher@landor.co.uk
Natalie Clarke natalie@landor.co.uk
www.landor.co.uk
Commercial Director
Printers
Daniel Simpson daniel@landor.co.uk
PrintedEasy, 1 Meredews, Works Road, Letchworth Garden City, Hertfordshire SG6 1WH
Editor Juliana O’Rourke juliana.orourke@landor.co.uk
3
Images: Highways England
MODELLING WORLD 2022 SHOWGUIDE
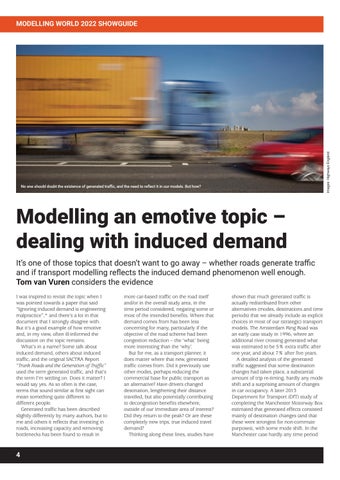
No one should doubt the existence of generated traffic, and the need to reflect it in our models. But how?
Modelling an emotive topic – dealing with induced demand It’s one of those topics that doesn’t want to go away – whether roads generate traffic and if transport modelling reflects the induced demand phenomenon well enough. Tom van Vuren considers the evidence I was inspired to revisit the topic when I was pointed towards a paper that said “Ignoring induced demand is engineering malpractice”,* and there’s a lot in that document that I strongly disagree with. But it’s a good example of how emotive and, in my view, often ill-informed the discussion on the topic remains. What’s in a name? Some talk about induced demand, others about induced traffic, and the original SACTRA Report “Trunk Roads and the Generation of Traffic” used the term generated traffic, and that’s the term I’m settling on. Does it matter? I would say yes. As so often is the case, terms that sound similar at first sight can mean something quite different to different people. Generated traffic has been described slightly differently by many authors, but to me and others it reflects that investing in roads, increasing capacity and removing bottlenecks has been found to result in
4
more car-based traffic on the road itself and/or in the overall study area, in the time period considered, negating some or most of the intended benefits. Where that demand comes from has been less concerning for many, particularly if the objective of the road scheme had been congestion reduction – the ‘what’ being more interesting than the ‘why’. But for me, as a transport planner, it does matter where that new, generated traffic comes from. Did it previously use other modes, perhaps reducing the commercial base for public transport as an alternative? Have drivers changed destination, lengthening their distance travelled, but also potentially contributing to decongestion benefits elsewhere, outside of our immediate area of interest? Did they return to the peak? Or are these completely new trips, true induced travel demand? Thinking along these lines, studies have
shown that much generated traffic is actually redistributed from other alternatives (modes, destinations and time periods) that we already include as explicit choices in most of our (strategic) transport models. The Amsterdam Ring Road was an early case study in 1996, where an additional river crossing generated what was estimated to be 5% extra traffic after one year, and about 7% after five years. A detailed analysis of the generated traffic suggested that some destination changes had taken place, a substantial amount of trip re-timing, hardly any mode shift and a surprising amount of changes in car occupancy. A later 2013 Department for Transport (DfT) study of completing the Manchester Motorway Box estimated that generated effects consisted mainly of destination changes (and that these were strongest for non-commute purposes), with some mode shift. In the Manchester case hardly any time period
MODELLING WORLD 2022 SHOWGUIDE shifting occurred. The actually induced demand – that is wholly new trips – was found to be small in both studies. And that’s why language is important. An extensive recent review for DfT by WSP and RAND Europe finds that “state level road networks in the US and the national Dutch network indicate an elasticity of around 0.2 across the whole road network, i.e. a 10% increase in road capacity could lead to 2% induced demand on the network”. Does that mean that approaching generated traffic through a more simplistic elasticity approach will suffice? I don’t think so – apart from the practical problem of reflecting road capacity changes in our models as discrete variables – I prefer to relate generated traffic to what the model calculates as generalised cost changes as experienced by travellers. Reflecting it through distributive processes enables us to do two things: l It allows us to model and value the full
impacts of the redistribution of travel demand l It is much better at reflecting the local
conditions that to a large extent determine the amount of traffic that is expected to be generated (as a function of the attractiveness of alternative modes, destinations and time periods). A good example of this latter argument is the finding of the paper “Disappearing traffic? The story so far”, published by Cairns, Atkins and Goodwin in 2002, describing the opposite effect. The authors find for 70 case studies that, following a road-space reduction measure, the average drop in traffic flow (in the study area or crossing a cordon) is around 22%, but the figure ranges between studies from a more than 100% reduction to increases of 25%. To me that suggests that local conditions, and particularly the quality of alternatives, are of paramount importance for both generated and disappearing traffic, which can only be reflected in distributive model approaches that reflect all relevant choices explicitly. Induced demand, generated traffic, does not have to be an emotive subject. The transport modelling and appraisal profession has responded to the recommendation of the 1994 SACTRA Report: “… that variable demand methods should now become the normal basis of trunk road traffic forecasts, and that these forecasts must be carried through into the
The 2019 National Highways POPE report states that less than 60% of 85 road schemes opened between 2002 and 2014 accurately forecast postscheme traffic volumes (accurate meaning volumes within +/- 15%). To increase the trust that planners have in our modelled forecasts we must point not just to the model mechanisms that are included, but also critically assess their past effectiveness in forecasting generated traffic
operational, economic and environmental evaluation of schemes in a systematic way”. If you have designed and built your transport model aligned with TAG guidance (particularly Unit M2.1 – Variable Demand Modelling), you should already have considered and allowed for the responses that lead to the generation of traffic. We have the modelling mechanisms, but we can do better. Reports that have looked at how well we have forecast generated traffic are “Beyond Transport Infrastructure” by Transport for Quality of Life and “The end of the road? Challenging the road-building consensus” by the Campaign to Protect Rural England. Some of the examples in these reports probably predate TAG. But they make it clear that one effect that is generally not well allowed for is location choice. Generally only reflected in complex and quite data-hungry land use transport interaction models that are often poorly understood by end users, and normally applied as an optional add-on to transport models, it’s time to embrace location choice as an explicit choice into our 4, 5 or even 6 stage modelling framework. Using recent advances in spatial computable generalised equilibrium framework, my VLC colleagues in Australia managed to represent location choice in a simpler way, faster and less data hungry than current practice. And it’s worthwhile. They calculated for a heavy rail scheme in Melbourne, using our in-house SPATIAL location choice model, a shift of population and employments closer to rail
stations, and added scheme benefits, mainly due to decongestion, of 20%. I’d expect that the opposite would happen when testing a major road scheme. No one should doubt the existence of generated traffic, and the need to reflect it in our models. And we generally do. How to improve? It all comes down to monitoring. The 2019 National Highways POPE report “Evaluation Insight Paper: Post Opening Project Evaluation of Major Schemes” states that less than 60% of 85 road schemes opened between 2002 and 2014 accurately forecast post-scheme traffic volumes (accurate meaning volumes within +/- 15%). There are many possible reasons for that discrepancy, but to increase the trust that planners have in our modelled forecasts we must point not just to the model mechanisms that are included but also critically assess their past effectiveness in forecasting generated traffic, and be willing to make changes. If you want to read up further on the subject, the WSP/RAND Europe report has a good list of references. Names outside of the UK to look out for are Todd Litman, Robert Noland, Peter Naess and Greg Erhardt. *https://www.strongtowns.org/journal/20 22/4/4/ignoring-induced-demand-isengineering-malpractice n Tom van Vuren is Chairman, Modelling World & Regional Director, UK & Europe, Veitch Lister Consulting www.veitchlister.com
5
MODELLING WORLD 2022 SHOWGUIDE
Data capture: an innovative video-analytical solution Tracsis, in partnership with Vivacity Labs, has developed a new video-analytical solution for capturing both volume and speed utilising AI technology. By Nick Mather By utilising the same AI technology seen in a permanently fixed AI road sensor and applying it to post-processing of video footage from temporary and ad hoc installations, Tracsis has a new offer that could tackle a gap in the data market as well as address potential limitations to standard data capture. Video footage of any site can be postprocessed through the system and accurately capture the volume and speed of all vehicle classes as well as pedestrians and cyclists. The solution has been benchmarked to within acceptable thresholds against temporary radar installations and pneumatic tube detection devices installed on the road. Nick Mather, Business Development Director and Group Marketing Lead at Tracsis says: ‘The AI software that the method uses, detects, classifies and tracks road users seen in the video. Using the AI portal, two speed lines are drawn across the image of the road environment to define the area of speed measurement. ‘The software uses the real-world distance between the two lines and the width of the road. This information allows the software to calculate a perspective transformation to map an object’s detected locations into a real-world coordinate frame. From this, it is possible to calculate the speed of each individual object. The system was in development for six months with rigorous testing before being made live in June 2021. ‘We have carried out a range of tests on sites in a mix of environments, including residential roads, trunk roads and rural roads. We have found the AI Portal to be within 5% accuracy in comparison with a pneumatic tube counter.’ Says Claire Stephens, Associate Director at VLC and a modeller herself: Traffic counts and journey times are key inputs to base year model validation. I remember my graduate days of counting vehicles in the freezing rain – we’ve certainly come a long way since then. ‘With an increasing focus on active modes, we must also find better ways to
6
obtain similar data on cyclists and pedestrians, and also emerging modes, such as e-scooters.’ A trial in a busy residential 20mph road in central London compared the system against a radar classifier, as well as the tube counter. Carried out on 21 January 2021, when conditions were dry, the trial observed a strong correlation between the ATC tubing, radar and the Tracsis AI Portal. While the profiles of speed match across the 24hr period, there was a marginal difference in average speeds, with the tube reporting around 20mph, radar 23mph and AI Portal 19mph across the full survey period. Mather argues that Tracsis’ method is safer than installing tubing, which can also break and provide a safety hazard in themselves, and can be used where tube installation is not possible such as on high speed roads. There is no requirement to enter the live carriageway as the camera can be installed from a roadside position. A camera also potentially provides greater flexibility for installation points than a radar installation and can be used over bridges or other areas where the cost of other traffic management
solutions could outweigh the cost-benefit ratio of a project. This method offers extended classifications over tube counters in the case of cycles and pedestrians, and the footage can be used to inspect spurious or anomalous data. For instance, if a van was parked on the road for a long time, the pneumatic tube system would have no way of knowing what had caused the anomaly in the data, whereas with the camera footage can be inspected to check such unexpected results. Mather explains how the solution was developed: ‘The software platform is essentially the same as the one we would use in a hard wired sensor but a hardwired sensor is a long-term investment, only really deployed for long-term solutions. ‘A lot of clients told us they wanted a temporary solution; for instance, they just needed to survey 50 locations for a week. With the video analytical solution, we can install the cameras quickly, say 10 minutes per camera, and then start putting the data through the system. ‘A week’s data usually requires a fiveday turnaround for our report, but the actual processing takes minutes.’ The solution can also be used to postprocess existing footage from previous projects and more insights are possible using the AI Portal, including path traces. These elements could be used in combination with Tracsis’ Conduit Data Hub, which collects, stores, and presents data to help solve common reporting challenges. After launching a historic data hub during the COVID lockdowns to help with traffic analysis for ongoing projects, Tracsis now provides a continual data hub service for data processing, retrieval and interrogation. n Nick Mather is Business Development Director & Group Marketing Lead, Tracis www.tracsistraffic.com
MODELLING WORLD 2022 SHOWGUIDE
The future isn’t (all) electric Local authorities need more ammunition to support traffic decarbonisation schemes, says SYSTRA’s Duncan Irons What large-scale interventions offer the best hope for reducing carbon emissions from transport? It’s a question that every local authority around the UK – and beyond – is asking themselves, as net zero carbon deadlines loom large. The urgency could be even greater than some appreciate: Intergovernmental Panel on Climate Change (IPCC) reports tell us that carbon emissions must peak in 2025 if the UK is to meet the steep downward carbon trajectory required to limit global warming. Local authorities need measures that can be implemented now; and they also need evidence to demonstrate how those measures will perform and play out with the public. One answer is a new generation of toolkits which provide a basket of measures, tested against regional and local models. These models must be ‘next generation’, with a more nuanced approach to reflect changes of behaviour over time and the differences between demographic groups – especially in the face of tougher interventions.
Trouble with transport carbon emissions In 2019, transport was responsible for around 27% of all the UK’s carbon emissions. And while our total domestic carbon emissions have fallen by 44% since 1990, transport emissions have only fallen by 5% over that period, becoming the largest emitting sector in 20161. Unfortunately, reducing those emissions calls for more than a surge in electric vehicle use and biofuels, active travel schemes and better public transport. There must be painful interventions too: moves such as reducing parking in town centres, charging for workplace parking or road user charging schemes that will incentivise a reduction in travel overall, and especially the use of fossil-fuel burning vehicles. Recognising this problem, regional and sub-national transport authorities are looking to gather ammunition to support local authorities in taking these difficult decisions. Those with toolkits planned or
In 2019, transport was responsible for around 27% of all the UK’s carbon emissions. And while our total domestic carbon emissions have fallen by 44% since 1990, transport emissions have only fallen by 5% over that period, becoming the largest emitting sector in 2016
under development include Transport for the North, Transport for Greater Manchester, Transport for Scotland and Midlands Connect, for whom SYSTRA is working with Atkins preparing a toolkit of decarbonisation measures with an associated evidence base. This work builds on a significant study that SYSTRA conducted for the Department of Transport in Ireland, mapping out what transport demand management measures would have the biggest decarbonisation impacts in Ireland’s five busiest cities (see box). The foundation of the study was an analysis of a large range of best-practice case studies from around the world, selecting potential interventions based on effectiveness, value for money, and whether they were equitable, technically feasible and – crucially – deliverable today. The solutions were refined through
consultation with stakeholders and quantitative fleet modelling, with larger scale interventions tested on regional multi-modal transport models to give an indication of which would give the biggest carbon bang for their buck. The next phase of this work is already underway with individual measures being piloted in each of the cities. Findings from the ‘Five Cities Study’ fed into the Irish Government’s Climate Action Plan 2021, with SYSTRA appointed to provide the evidence base for the transport component of the plan. One of the challenges was how to account for new hybrid vehicles, electric vehicles, and the impact of biofuels. To do this, SYSTRA created new decarbonisation pathway tools and a detailed representation of Ireland’s private car market. A later phase of work sees SYSTRA looking at how to enable equity and
7
MODELLING WORLD 2022 SHOWGUIDE
Whose emissions? One of the biggest challenges for local authorities in reducing their carbon emissions from transport is working out exactly who is responsible for what. Journeys, by their very nature, cross boundaries. And it could be that the local authority where most carbon is emitted has no control over that journey at all.
A reluctance to return to public transport post-pandemic is significant enough that current modelling assumptions need to be updated
Ireland’s Five Cities Study A major study for Ireland’s Department of Transport, conducted by SYSTRA, looked at potential Transport Demand Management (TDM) measures in the cities of Dublin, Cork, Galway, Limerick and Waterford. The aim is to change travel demand patterns and encourage switches to more sustainable forms of transport. The study examined best practice across 16 countries and over 40 case studies. SYSTRA identified three TDM measures to be implemented everywhere and a basket of other measures to be considered by the authorities in the different cities. Priority TDMs: l Develop 15-minute
neighbourhoods, where everything needed daily is within an easy walk or cycle, through national and local plan strategies l Enhance delivery of the National
Planning Framework which sets out Ireland’s planning policy to 2040. Targets include 40% of new housing within existing urban footprints, 50% of this in the five cities l Develop or enhance city centre
parking controls and parking measures
8
fairness when transitioning to low carbon travel. Disadvantaged groups can be disproportionately impacted by measures to reduce the use of cars, for instance.
Modelling new behaviours In modelling how proposed measures will play out in different locations, it is important to take behavioural impacts into account: how different generations or demographics will respond; how behaviour might change over time; and how to influence behaviour when unpalatable changes are introduced. While long-established and tested models are vital to inform this type of study, transport modellers must add new dimensions to factor in changing behaviours. Work that SYSTRA’s behaviour change and research team conducted throughout the Covid-19 pandemic illustrates this point: the last of three surveys, conducted in the Summer of 2021, showed that there was a reluctance to return to public transport, as we emerged from the pandemic, which was significant enough that current modelling assumptions would need to be updated. Behavioural insights research is also proving useful in providing evidence of the value of switching to more active travel, something which has been historically difficult to quantify. SYSTRA has been working on behaviour research findings to understand the likelihood of different groups of people to switch to bikes, providing more robust data for local authorities assessing active travel schemes. What modelling for toolkits and other projects has demonstrated is that the scale
Current tools for apportioning emissions are blunt. Transport Users Benefit Analysis (TUBA), for instance, accounts for varying speeds by assigning an average speed for a whole journey, and thus misses the impact of the journey being a combination of slow congested bits and fast free-flow inter-urban bits, so the average speed is typically close to the speed which minimises emissions and therefore underestimates the actual emissions produced. To tackle this issue, SYSTRA’s Chris Robinson has developed the Carbon Skimming Tool which will be presented at Modelling World and uses standard demand and routing patterns and fleet mix predictions and environmental factors from our inhouse ENEVAL (Environmental Evaluation Model) tool. This can reveal information such as what vehicles or journeys are the biggest emitters, allowing strategies to be deployed accordingly.
of change required in car use is huge. To achieve that unprecedented reduction in car journeys will require measures that are unpopular, and which may have negative impacts as well as positive ones. This is a tough message to convey to politicians or the public. The faster and more effectively that message can be communicated, the more likely the UK is to finally start reducing transport carbon emissions. n
Duncan Irons is Market Director, SYSTRA www.systra.co.uk
MODELLING WORLD 2022 SHOWGUIDE
8 - 9 June 2022 Organised by:
Edgbaston Stadium, Birmingham
Sponsored by:
Supported by:
DELEGATE INFORMATION #modellingworld 9
SPEAKERS A-Z
David Aspital
Vincent Benezech
Helen Bowkett
Paul Byron
Pedro Camargo
Transport Planner, PTV Group
Principal Consultant (Transport Advisory), Veitch Lister Consulting
Traffic and Economics Lead, Lower Thames Crossing
Technical Director, WSP
Transportation Scientist & Open Source Developer
Dustin Carlino
Gerry Casey
Laurence Chittock
Nicholas Cohn
Mike Costello
Research Associate, The Alan Turing Institute and Cartographer, A/B Street
Leader, City Modelling Lab, Arup
Associate, PTV Group
Head of Product, Teralytics
Associate, Steer
Wei Cui
Rebecca Davies
Stuart Donovan
Luis Pérez Echevarría
Rosa Felix
Principal Analyst, Transport for the North
Analysis Manager, Transport for the North
Executive Consultant (Policy & Planning) & Market Leader (New Zealand), Veitch Lister Consulting
Principal Transport Modeller, Transport for London
Researcher, Instituto Superior Técnico, University of Lisbon
Richard Fernandes
Steve Ferris
Mark Fletcher
Patrizia Franco
Tim Gent
Managing Consultant, Atkins
Marketing Manager, Agilysis
Principal Analyst, Transport for the North
Principal Demand Modeller and Technical Lead, Connected Places Catapult
Technical Director, Atkins
SPEAKERS A-Z
Douglas Gilmour
Elena Golovenko
Sales Manager UK & Ireland, TomTom
Technical Director, Transport Modelling, Jacobs
Carles Illera
Stephen Joseph
Regional Head of Professional Services, Aimsun
Author, Foundation for Integrated Transport
Benjamin Loreille Associate, Systra
Alberto Martín González-Zaera
Rhiannon Hedingham
Bob Hickish
Technical Director, UK, WSP
Senior Transport Planning Consultant, City Science
Devrim Kara
James Key
Jon Little
Director, PTV UK / Vice President Mobility Northern Europe, PTV Group
Senior Transport Modeller, Aimsun
Developer, Beta Streets
Martin Lucas-Smith
Nadia Lyubimova
Mingfei Ma
Webmaster, Cycle Streets
Director of Transport Modelling, Stantec
Principal Consultant, Steer
Thomas MacLenachan
Nick Mather
David Milner
Sandhya Nagaraju
Malcolm Neil
Laurence Oakes-Ash
Business Development Director & Group Marketing Lead, Tracsis
Deputy Director, Create Streets
Senior Transport Modeller, Connected Places Catapult
Regional Market Director for Scotland (Modelling), Systra
CEO, City Science
Transport Modeller, Connected Places Catapult
Senior Policy Advisor, Infrastructure Net Zero, Portfolio & Project Delivery Directorate, DfT
SPEAKERS A-Z
Michael Oliver
Philippe Perret
Chris Robinson
Charlene Rohr
Chris Rowland
Technical Director, PTV Group
Head of Analytics, Citi Logik
Associate, Systra
Technical Principal, Mott MacDonald
Managing Director, MDS Transmodal
Nila Sari
Dan Saunders
Anne Shaw
Craig Smith
Paul Speirs
Principal Transport Modeller, Department for Transport
Head of Products, Basemap
Executive Director, Transport for West Midlands
Data Scientist, Agilysis
Consultant, Old Chase Consulting
Leon Suijs
Ben Taylor
Keeley Taylor
Collins Teye
Tom van Vuren
Traffic Management Consultant, Goudappel
Data Analyst, Transport for the North
Assistant Engineer, WSP
Principal Modeller, Transport for London
Regional Director, UK & Europe, Veitch Lister Consulting
To view the complete speaker biographies, visit:
www.modelling-world.com Peter Vovsha
Luis Willumsen
Chris Wright
Principal Scientist, Bentley Systems
Managing Partner, Nommon Solutions and Technologies
Technical Director, MDS Transmodal
The selection of speaker details listed here was correct at time of going to press
PROGRAMME Wednesday 8 June 2022 14.00
West Suite
Open Source Software in transport modelling For Modelling World 2022, we’re delighted to convene a session of experts to explore this key topic. Led by Dustin Carlino, Research Associate, The Alan Turing Institute and cartographer at A/B Street, this session will feature short case studies followed by a facilitated discussion. Dustin is a software engineer, formerly with Google, who is now working to make transport planning tools more widely accessible. Panel: l Rosa Felix, Researcher, Instituto Superior Técnico, University of Lisbon
l Devrim Kara, Managing Director PTV UK / Vice President Mobility Northern Europe PTV Group
l Ben Taylor, Data Analyst,Transport for the North
l Shaleen Srivastava, CEO, Goleyo
l Pedro Camargo, transportation scientist & Open Source developer
l James Hulse, Data Scientist, Leeds Institute for Data Analytics
l Gerry Casey, leader, City Modelling Lab, Arup
15.30
Banqueting Suite Refreshments served
16.00
West Suite
Innovation showcase ‘No model’ assessments: active travel, shared mobility and decarbonisation tools Emerging transport technologies ask increasingly complicated questions of the models that are used to assess them, and to support design and decisions. Is the only answer making existing modelling tools even more complex? Can the uncertainties surrounding the operation and impacts of these futures change our way of thinking about their assessment? Over the past few years – in reaction to new travel trends embedded during the pandemic, and now in the quest for to decarbonise transport – Government has been increasingly supportive of active travel, shared mobility and a range of other place-based carbon reduction initiatives. Innovators from academia, public and private sectors have developed a range of toolkits and platforms enabling the rapid analysis, planning and testing of new scenarios, street infrastructure and design interventions. Others have developed place-based carbon calculators that support more accurate predictions of transport carbon emissions. Data inputs range from AI-driven video sensing to GIS and more traditional metrics such as transport stops, isochrones, PTALs and census data. For the first time in 2022, Modelling World is organising a showcase of these innovative tools. Delegates will able to see short talks, live demos and network with the creators and users of these tools. Chair: Tom van Vuren, Regional Director, UK & Europe, Veitch Lister Consulting Presenters include: l Dustin Carlino, Research Associate, The Alan Turing Institute and Cartographer, A/B Street l Jon Little, Developer, Beta Streets l Craig Smith and Steve Ferris, Active Streets Assessment Tool, Agilysis
18.00
Comfort break
l Martin Lucas-Smith, Cycle Streets LTN tool l Dan Saunders, Head of Products, Basemap l Nick Mather, Business Development Director, Tracsis, with Vivacity Labs l Greta Timaite, Leeds Institute for Data Analytics
PROGRAMME Wednesday 8 June 2022 18.00
1882 Lounge
Networking Drinks Reception 18.45
Sponsored by:
1882 Lounge
Pre-Dinner Welcome Anne Shaw, Executive Director, Transport for West Midlands
18.50
1882 Lounge
Networking Dinner 20.30
Day 1 Close
PROGRAMME Thursday 9 June 2022 08.30
Banqueting Suite Registration opens: Morning networking and refreshments served
09.30
West Suite
Morning Plenary: It wasn’t the computer that said road This plenary session at Modelling World will hear from David Milner, the author of the ‘Computer Says Road’ report, about his concerns around the role of modelling in current land use planning. A panel of modelling experts will respond, and the conference chair will facilitate a discussion about how the modelling profession can respond positively to this challenge, for example by: l Removing unconscious bias from the models? l Revisiting the valuation principles in appraisal? l Scenario planning? l Educating end users? Chaired by: Tom van Vuren, Regional Director, UK & Europe, Veitch Lister Panellists include: l David Milner, Deputy Director, Create Streets l Stephen Joseph, Author, Foundation for Integrated Transport l Charlene Rohr, Technical Director, Mott MacDonald l Paul Speirs, Consultant, Old Chase Consulting
PROGRAMME Thursday 9 June 2022 11.00
Banqueting Suite Morning Break: Refreshments served in the exhibition area
11.30
West Suite
1882 Lounge
Chairman’s Lounge
Decarbonisation
Innovation
Freight
Chair: Liz Jacobs, Deputy Director, Transport Appraisal and Strategic Modelling, Department for Transport
Chair: Elena Golovenko, Technical Director, Transport Modelling, Jacobs
Chair: Nadia Lyubimova, Director of Transport Modelling, Stantec
Confidence without Convergence Malcolm Neil, Regional Market Director for Scotland (Modelling), SYSTRA
City Science’s National Freight Model – addressing the freight data gap Bob Hickish, Senior Transport Planning Consultant, City Science
Strategic Digital Carbon Architecture programme Thomas MacLenachan, Senior Policy Advisor, Infrastructure Net Zero, Portfolio & Project Delivery Directorate, Department for Transport Transport carbon emissions and their relationships with travel patterns Keeley Taylor, Assistant Engineer, WSP The TfN Electric Vehicle Charging Infrastructure model Adam Goodchild, Decarbonisation technical lead / Assistant Analyst, Transport for the North Understanding Transport Carbon Emissions Chris Robinson, Associate, SYSTRA Representing Electric Vehicles in Transport Models Laurence Chittock, Associate, PTV
13.00
Real-time: An accessible city by pro-active traffic management Leon Suijs, Traffic management Consultant, Goudappel Modelling choices towards shared autonomous vehicles Alberto Gonzalez Zaera, Transport Modeller, Connected Places Catapult & Sandhya Nagaraju, Senior Transport Modeller, Connected Places Catapult Dynamic use of big data in the Abu Dhabi modelling framework James Key, Senior Transport Modeller & Carles Illera, Regional Head of Professional Services, Aimsun Exploring alternative hierarchical demand model structures for NoRMS Mark Fletcher, Principal Analyst, Transport for the North & Neil Raha, Technical Director, SYSTRA
Banqueting Suite
Networking Lunch Refreshments served in the exhibition area
Programme as at time of going to press
Sponsored by:
Measuring Warehouse Accessibility – modelling the impact of different warehousing strategies Rafe Whitehead, Senior Data Analyst, Transport for the North and Wei Cui, Principal Analyst, Transport for the North Decarbonising Last Mile Road Freight using integrated agentbased and emissions models for place-based policy interventions Patrizia Franco, Principal Demand Modeller and Technical Lead, Connected Places Catapult Decarbonising large HGVs: using the MDS Transmodal Great Britain Freight Model (GBFM) Chris Rowland, Managing Director, and Chris Wright, Technical Director, MDS Transmodal
PROGRAMME Thursday 9 June 2022 14.00
West Suite
1882 Lounge
Chairman’s Lounge
Increasing the richness of models
Active & shared modes
New uses for big data
Chair: Charlene Rohr, Technical Principal, Mott MacDonald
Chair: Helen Bowkett, Traffic and Economics Lead, Lower Thames Crossing
Chair: Nila Sari, Principal Transport Modeller, Department for Transport Reconciling the behavioural richness of Activity-Based Models (ABMs) with the rigorous requirements of economic appraisal Peter Vovsha, Principal Scientist, Bentley Systems Validating the employment elasticity of a Land Use and Transport Interaction model – an application for the Northern Economy and Land-Use Model Rebecca Davies, Analysis Manager, Transport for the North, Mike Costello, Associate, Steer & Mingfei Ma, Principal Consultant, Steer Application of an Activity Based Model to distance-based road pricing in London Collins Teye, Principal Modeller, Transport for London Electric vehicle uptake model – an application in Sydney Vincent Benezech, Principal Consultant & Stuart Donovan, Executive Consultant, VLC
15.30
Modelling idealised network and cycling behaviour in strategy development Benjamin Loreille, Associate, SYSTRA Mesoscopic modelling of pedestrians David Aspital, Transport Planner, PTV and William Heubner, Principal Consultant, Momentum Transport Consultancy Transport for London: Innovation in operational modelling, emerging modes and travel trends Luis Pérez Echevarría, Principal Transport Modeller, Transport for London and Michael Oliver, Technical Director, PTV
Post-COVID travel patterns: what does the data tell us? Short talks and discussion; panellists include: l Nick Mather, Business Development Director, Tracsis l Luis Willumsen, Managing Partner, Nommon Solutions and Technologies l Nicholas Cohn, Head of Product, Teralytics l Douglas Gilmour, Customer Program Manager, TomTom l Philippe Perret, Technical Director, CitiLogik
Using Google API to extend use of transport model outputs in analysing active mode policies: a Cambridgeshire case study Paul Byron, Technical Director, WSP
Banqueting Suite Afternoon Break: Refreshments served in the exhibition area
16.00
West Suite
The future of modelling This interactive session will explore the future of modelling from three perspectives: l Real-work challenges – problems faced by current end users of modelling l Real-world challenge – future questions that models will need to answer l Innovation opportunity – emerging technological improvements that may make modelling better or faster Chair: Tim Gent, Technical Director, Atkins Speakers: l Mark Clements, Chief Analyst, National Highways l Liz Jacobs, Deputy Director, Transport Appraisal and Strategic Modelling, Department for Transport l Nadia Lyubimova, Director of Transport Modelling, Stantec l Rhiannon Hedingham, Technical Director, WSP in the UK l Laurence Oakes-Ash, CEO, City Science
PROGRAMME Thursday 9 June 2022 17.30
Room with a view
Networking Drinks 18.00
Room with a view
18.30
Event Close
Sponsored by:
EXHIBITION FLOORPLAN
Catering Conference Room
E1 E2 A1
A2 A3 A4 A5 A6
B2
C1 C3
B4
Catering
D3
D4
A7 A8
Catering Terrace
F
C2 C4
D5 Main Entrance
Correct at time of going to press
EXHIBITORS Shown in stand order A3
A4 & A5
A6
A7 & A8
B2
B4
C1
C2
C4
E1
E2
F
Transport Data Intelligent monitoring for local authorities, transport bodies and consultancies Funding worth £200 million announced for new walking and cycling schemes across England. Tracsis can offer the complete package to monitor, report and add insights into active travel movements.
Live data technology
Automated analytics
Path tracing
Social distancing insights
Trascis have the tools to assist you with the data collection for planning, design, and reallocation of road space and implementation of active travel schemes. Contact us to discuss your requirements tracsistraffic.com
tads@tracsis.com
+44 (0)1937 833 933
Technology Makes It Possible, People Make It Happen
MODELLING WORLD 2022 SHOWGUIDE
Exploring Open Source Software For Modelling World 2022, we’re delighted to convene a session of experts to explore this key topic, led by Dustin Carlino The open source community makes some grand promises – people create software, then release the source code for free. Anybody who wants to improve or modify can do so. There are many open source success stories – Linux, Wordpress, Blender, Firefox – but what about in the transport modelling world? SUMO, MATSim, A/B Street, AequilibraE, and Streetmix are a few examples, along with travel demand models like NorMITs, Soundcast and ActivitySim. Many of these projects have been running for years with a modest team; so how are they able to sustain themselves without selling licences or charging consulting fees? Relatedly, many GIS departments have been releasing LIDAR data, parking studies, pavement audits and other datasets under licences with few restrictions.
The star of open data in transportation is OpenStreetMap: a worldwide, volunteerproduced database. Open source and commercial software alike make heavy use of these common resources. Open source transportation software has recently been trending towards public engagement, requiring less technical background for users to explore possible changes. There’s potential to use this software to educate people about controversial or confusing changes, but also a danger to mislead people with results that require expertise to interpret. Achieving environmentally sustainable transport systems is an urgent and monumental task, and one that must happen all around the world. For cities without the resources to licence commercial software and invest in
training their employees to use it, how can open software and data help – and what pitfalls must they be wary of? Join the open source session at Modelling World to hear from leaders in the open source transport space debate these questions, explain why they’ve chosen to release their projects for free, about challenges they’ve faced operating this way, and about new opportunities for collaboration. n
Dustin Carlino is a Research Associate at the Alan Turing Institute and Cartographer at A/B Street https://a-b-street.github.io/ docs/index.html
Ali Inayathusein, Executive Director (Modelling and Analytics) at Veitch Lister Consulting says open source is not an alternative to commercial packages, but complementary…. We are heavy users of open source software.The case for its use across different areas is nuanced; there are pros and cons. The benefit is that you can build upon the work of others, saving time and effort versus developing from scratch. You can customise to your needs, often without restriction, and give back to the wider community allowing bright minds across organisations and geographic boundaries to collaborate to produce creative solutions. The load of problem-solving can be shared amongst a large group, avoiding the need for large investments from a single organisation. Where software is used widely, you have a wide pool of users to support troubleshooting, maintaining, improving and upgrading code. At VLC we, as many others, are strong users of GIS packages such as QGIS. We also use open source web mapping platforms such as Mapbox which provide crucial building blocks for further work. The use and availability of such frameworks has been enormously helpful in the development of our Planwisely and Sitewisely web-based visualisation platforms.
In the transport modelling space, we also use several open source software solutions including MATSim and ActivitySim for agent and activity-based modelling. MATSim especially is used heavily in academia with a number of practical applications across the world too. This means that new add-ons and features are constantly developed. The ActivitySim framework is worthy of mention because it has allowed a number of US transport agencies to pool funding to develop a customisable activity-based modelling framework. At VLC, as part of our ongoing research activity in the open source space, we have also been able to add to the codebase to fix existing bugs in some areas as we came across them; a good example of how a win-win is created. In this case, VLC is getting use of an advanced modelling framework without having to pay for its use or development from scratch, whilst leaving the software in a better state for future users. However, open source is not a silver bullet. The flip side of all this is that there is often little support and agency in the development pathway. Without
commercial agreements, support can drop off at any time and there may be no help on hand when bugs are found; typically at time critical points during project delivery! There is no guarantee in coding or performance standards and no organisation responsible that you can seek support from as a default. This is where commercial software providers play an important role. They act to pool funding through a commercial model, seeking to pay for innovation and support through license and maintenance fees. In the end it is a case of horses for courses, and there is no universally desirable or optimal operating model. At VLC we do all three: we write our own proprietary code, use opensource and subscribe to commercial software packages depending on our needs. Open source is not an alternative to commercial packages, but complementary. n Ali Inayathusein is Executive Director (Modelling and Analytics) at VLC www.veitchlister.com
21
MODELLING WORLD 2022 SHOWGUIDE
The benefits of commercial transport modelling software A combination of commercial and open source software can help make the more complex transport models fit for purpose, but commercial software will always have its uses, says Devrim Kara Transport models offer a virtual environment for testing transport schemes and scenarios which would be more costly – or unsafe – to test in the real world. Commercial off-the-shelf transport modelling software (commercial software) tools provide a structured and proven method of developing transport models. They drive industry innovation, and offer many benefits in comparison to using project based bespoke approaches. Even though their code is not open source, most of the commercial software methods have been developed through scientific research, often at universities. Over the years, collaboration between the modellers who use commercial software, authorities and software vendors has helped increase the sophistication as well as the applicability of these complex tools. It is really a team effort that everyone benefits from. Authorities develop the guidelines for transport appraisal which the commercial software needs to adhere to. Users put the software in use in reallife and provide feedback on requirements, usability and functionality. The vendors continuously update the software to follow the guidelines and incorporate the learnings from the user application of the software. Authorities are reassured that guidelines are adhered to with structured approaches, and users benefit from professionally developed and maintained software. Having such software available off the shelf offers many benefits, including lower cost through economies of scale and quicker model development. Commercial software incorporates foundational technologies used by thousands of other users, transparency
22
and consistency in sharing of results (whether explicitly or inexplicitly through technical support and use of shared technology). Its regular use and acceptance within the industry enables transferability of skills within user communities, support and maintenance of a body of knowledge from a professional maintenance and training team. In collaboration with the community of users, the vendors offer continuous development of new methods and ideas, adherence to changing guidelines, and many more benefits. The warranty it offers, in case something goes wrong, is one of the most important benefits of commercial software. Vendors not only have a systematic process of maintaining the software and resolving known issues, but also offer support in resolving software related issues encountered in specific projects. While commercial software is not immune to bugs and issues, especially when new software code and industry
ideas are being introduced, the warranty provided by the vendors provides reassurance and supports innovation. Sometimes bespoke or open source software may offer the same level of warranty as commercial software; but often it offers limited or no warranty by design. Another very important benefit is the wide acceptance and use of commercial software which allows an easier and quicker transferability of skills between individuals and teams of users. Commercial software communities can grow rather large and, as they do, they develop their own body of knowledge and vernacular, which leads to efficiencies in problem solving, project delivery, and business agility. Training courses and tutorials organised by the vendors provide additional support in transferring the know how and skills and ensuring there is a constant replenishment of experts who can correctly operate the software. This can be a higher effort for open source
MODELLING WORLD 2022 SHOWGUIDE
Let’s not forget that any software, whether commercial or open source, is only the tool. The quality of the data and the skill of the modeller are key requirements for the success of a transport model
software since the interests of the software developer may not be new user training, especially if the software is quite complex or not well documented. The structured approach of the commercial software can also become a limitation and this is where the combination of commercial software with bespoke scripting applications often makes a transport model fit for purpose. Such a combination is being increasingly practiced in our industry with good results on a project by project basis, but perhaps with less success in the areas of documentation, transparency, and transferability of skills. This happens mainly because the bespoke scripts are either developed on a commercial basis, or because project budgets do not afford much in the way of documentation and transferability. In addition to documented and structured approaches, PTV software allows for bespoke extensions via user defined data layers and attributes, and interfaces with powerful external programming software such as Python. This PTV philosophy provides the advantages of specialist off-the-shelf transport modelling software while maximising flexibility with powerful interfaces with open source software and programming tools, especially in the Python data science ecosystem. At PTV we have realised the benefits of publishing scripts to users of our software via well-known open source methods. For
example, a script was recently published by PTV UK’s David Aspital that utilises PTV Visum’s Python integration to allow for highway assignment procedures for multiple time periods to be carried out in parallel rather than in series. This was originally developed for an individual client to deliver a speedup of their existing model by over 40%, and was then generalised to work with all models of a similar structure. This was then made available publicly through GitHub with extensive documentation and, more recently, updates to ensure that the tool is compatible with the latest version of PTV Visum. This approach is not unique to PTV UK, with tools and models made available on GitHub particularly in the US, where the Southern Oregon Activity Based Model (SOABM) has been made publicly available in its entirety. The interest in and adoption of this tool by the community validates such an approach, with over 400 views of the article posted on LinkedIn linking to the tool translating to over 50 downloads of the scripts in the first week of its publication. This interest has remained high in the year since its publication, with 24 views between 17 unique visitors in the 2 weeks prior to the time of writing. We are currently aware of multiple live projects where the tool has been adopted, including where it has been adapted to work with public transport assignments. Commercial software provides many
advantages and is targeted at providing enough features to meet the requirements of most transport modelling projects. It strives to strike the right balance between specificity and scalability required to support a community of thousands of users. It is constantly developed by the vendors to capture the evolving trends in data, behaviour, guidance and computation technology. For the more ‘out of box’ projects, the combination of commercial with open source software offers a powerful solution. Let’s not forget that any software, whether commercial or open source, is only the tool. The quality of the data and the skill of the modeller are key requirements for the success of a transport model, and this is where the community components – documentation, training, sharing insights, transparency and academic training – are so important as well. While a combination of commercial and open source software can help make the more complex transport models fit for purpose, commercial software has its uses and this is why it has been invented, and will continue being used by transport modellers across the industry. n Devrim Kara is Director, PTV UK www.ptvgroup.com
23
Tomorrow‘s cities rely on sustainability in mobility. For 40 years, PTV Group provides software solutions for transport planning and logistics optimisation The PTV Transport Planning Software Suite consists of The following products: • PTV Visum for transportation planning • PTV Vissim for traffic simulation • PTV Viswalk for pedestrian simulation Our software helps over 2,500 cities model, simulate, plan, analyse, and predict traffic and transport to optimize the flow of movement. Join the Conversation at www.ptvgroup.com or contact us at info.uk@ptvgroup.com