3 minute read
Tab. 6: Lighting hours, power and energy in the cabinets

For calculation of the power, different electric consumptions were made, because the actual consumption is higher than the nominal value of the bulb: one was based on the power of the lamps (nominal Watts, 0 % more power consumption), one with 6 % more power consumption and one for 10 % more power consumption. The power was higher for the measured values than for the simulated ones.
Tab. 6: Lighting hours, power and energy in the cabinets.
Treatment Hours Power Energy Energy/m2
h W kWh kWh/m2
HPS 150 W/m² Measured values 1.730 216 18.668 373 Simulated values 0 % more power consumption (nominal) 1.888 150 14.159 283 6 % more power consumption 1.888 159 15.008 300 10 % more power consumption 1.888 165 15.575 311 HPS 100 W/m² Measured values 1.698 145 12.311 246 Simulated values 0 % more power consumption (nominal) 1.888 100 9.439 189 6 % more power consumption 1.888 106 10.006 200 10 % more power consumption 1.888 110 10.383 208
4.4.2 Energy prices
Since the application of the electricity law 65/2003 in 2005, the cost for electricity has been split between the monopolist access to utilities, transmission and distribution and the competitive part, the electricity itself. Most growers are, due to their location, mandatory customers of RARIK, the distribution system operator (DSO) for most of Iceland except in the Southwest and Westfjords (Eggertsson, 2009).
RARIK offers basically three types of tariffs:
a) energy tariffs, for smaller customers, that only pay fixed price per kWh,
b) “time dependent” tariffs (tímaháður taxti, Orkutaxti TT000) with high prices during the day (09.00-20.00) at working days (Monday to Friday) but much lower during the night and weekends and summer, and
c) demand based tariffs (afltaxti AT000), for larger users, who pay according to the maximum power demand.
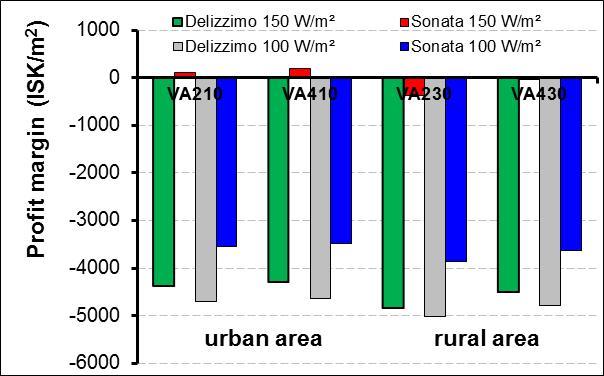
In the report, only afltaxti is used as the two other types of tariffs are not economic. Since 2009, RARIK has offered special high voltage tariffs (“VA410” and “VA430”) for
large users, that must either be located close to substation of the transmission system operator (TSO) or able to pay considerable upfront fee for the connection.
Costs for distribution are divided into an annual fee and costs for the consumption based on used energy (kWh) and maximum power demand (kW) respectively the costs at special times of usage. The annual fee is pretty low for “VA210” and “VA230” when subdivided to the growing area and is therefore not included into the calculation. However, the annual fee for “VA410” and “VA430” is much higher. Growers in an urban area in “RARIK areas” can choose between different tariffs. In
the report only the possibly most used tariffs “VA210” and “VA410” in urban areas and “VA230” and “VA430” in rural areas are considered.
The government subsidises the distribution cost of growers that comply to certain criteria’s. Currently 64,8 % (before 87 %) and 69,2 % (before 92 %) of variable cost of distribution for urban and rural areas respectively. This amount can be expected to change in the future.
Based on this percentage of subsidy and the lighting hours (Tab. 6), for the cabinets the energy costs per m2 during the time of the experiment for the growers were calculated (Tab. 7).
The energy costs per kWh are for distribution after subsides 1,77-1,85 ISK/kWh for „VA210“ and 2,99-3,12 for „VA230“, 1,53-1,63 ISK/kWh for „VA410“ and
2,13-2,34 ISK/kWh for „VA430“. The energy costs for sale are for „Afltaxti“ 6,09-6,29 ISK/kWh and for „Orkutaxti“ 7,99-8,16 ISK/kWh.
Cost of electricity was lower for the calculated values (Tab. 7). In general, tariffs for large users rendered lower cost.