1 minute read
2.4 Bicycle Facilities


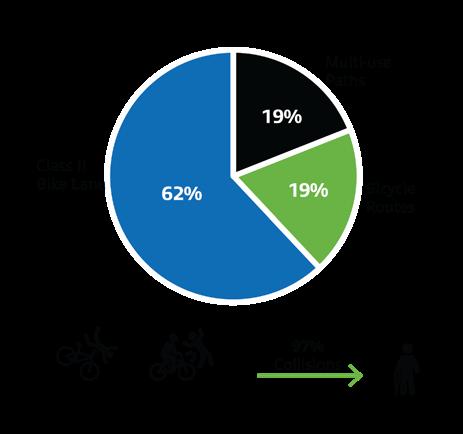
The existing bicycle facility network throughout the Omnitrans’ service area consists of multi-use paths, bicycle lanes, and bicycle routes making up 640 miles of existing bikeways (Figure 2-11). For a description of bikeway classifications please see section 4.2.3. Nineteen percent of existing bicycle facilities are multi-use paths, 62 percent are class II bike lanes, and the remaining 19 percent are bicycle routes.
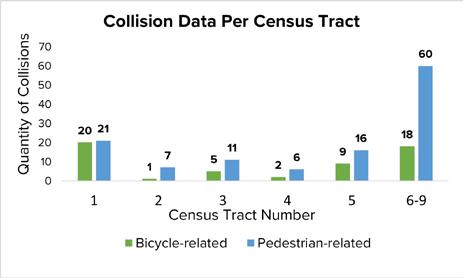
Bicycle and pedestrian collision data were obtained from SWITRS collision dataset managed by the CHP, which captures reported bicycle-vehicle, pedestrian-vehicle, and bicycle-pedestrian collisions that resulted in injury or property damage throughout the county of San Bernardino in the five-year period of 2014 through 2018. Collision density and location data are displayed in Figure 2-2.
Advertisement
There were 842 reported bicycle-related collisions and 1,317 pedestrian-related collisions that occurred in the Omnitrans’ service area. Of those collisions, 142 resulted in fatalities. Nearly all reported collisions resulted in injury (97 percent). In the same dataset, most of the pedestrian-related collisions and bicycle-related collisions, occurred during daylight hours (1,150 injured and 22 fatal). It is important to note that collisions involving bicyclists and pedestrians are known to be under-reported, and therefore such collisions are likely under-represented in this analysis, especially those that did not result in an injury or fatality. Some of the under-reporting of serious injuries can also occur when those involved don’t realize how serious their injuries are until they are fully examined.