
2
2
6
CITY OF LA VERNE
2
2
6
CITY OF LA VERNE
ADOPTED MARCH 2026

La Verne City Council
Tim Hepburn Mayor
Meshal “Kash” Kashifalghita Mayor Pro Tem
Steven F. Johnson Council Member
Rick Crosby Council Member
Wendy M. Lau Council Member
Parks and Recreation Commission
William Aguirre Chair
Salvatore DeGrassi Vice Chair
Gary Gonzales Commissioner
Johanna Clemens Commissioner
Mike Riggs Commissioner
Public Works
Danny Wu Director of Public Works
Nicole Houston Senior Management Analyst
Ramiro Nunez Manager of Maintenance
Richard Casados Parks/Facilities Supervisor
Parks and Recreation
Yvonne Duran Director of Parks and Recreation
Chad Peterson Parks and Recreation Supervisor


A special thank you the community members who have given their time to share ideas and energy to this Plan through our surveys, workshops, and pop-up events. Together, we will create a parks and recreation system that will continue to foster La Verne’s quality of Life.
KTUA
Joe Punsalan Principal
Jacob Leon Senior Associate
Nicole Rogge Senior Planner
Amanda Herbst Senior Planner
110%
Farrell Buller Principal
Matt David Operations and Marketing Manager
Alexis Rankey Project Consultant and Data Analyst
PROS Consulting
Michael Svetz Principal
RRC
Kailyn Haskovec Research Manager




The City of La Verne’s 2025 General Plan centers the City’s vision around the appreciation and preservation of its unique, small town charm and character. The vision also identifies the City as a safe and supportive hub for existing residents and emerging youth. This vision was central to the development of this Parks and Recreation Master Plan Update (Plan).
La Verne’s Parks and Recreation Department Vision includes the following:
» Provide safe, well-designed, and maintained facilities
» Provide broad-based programs/services and maximize community resources
» Focus on what is important and never compromise integrity
» Recognize the need to explore new innovative ideas and procedures to better meet the community’s changing needs and trends
The Plan’s Guiding Principles listed below are consistent with the City’s General Plan and were informed by the community feedback received during the development of this Park and Recreation Master Plan.
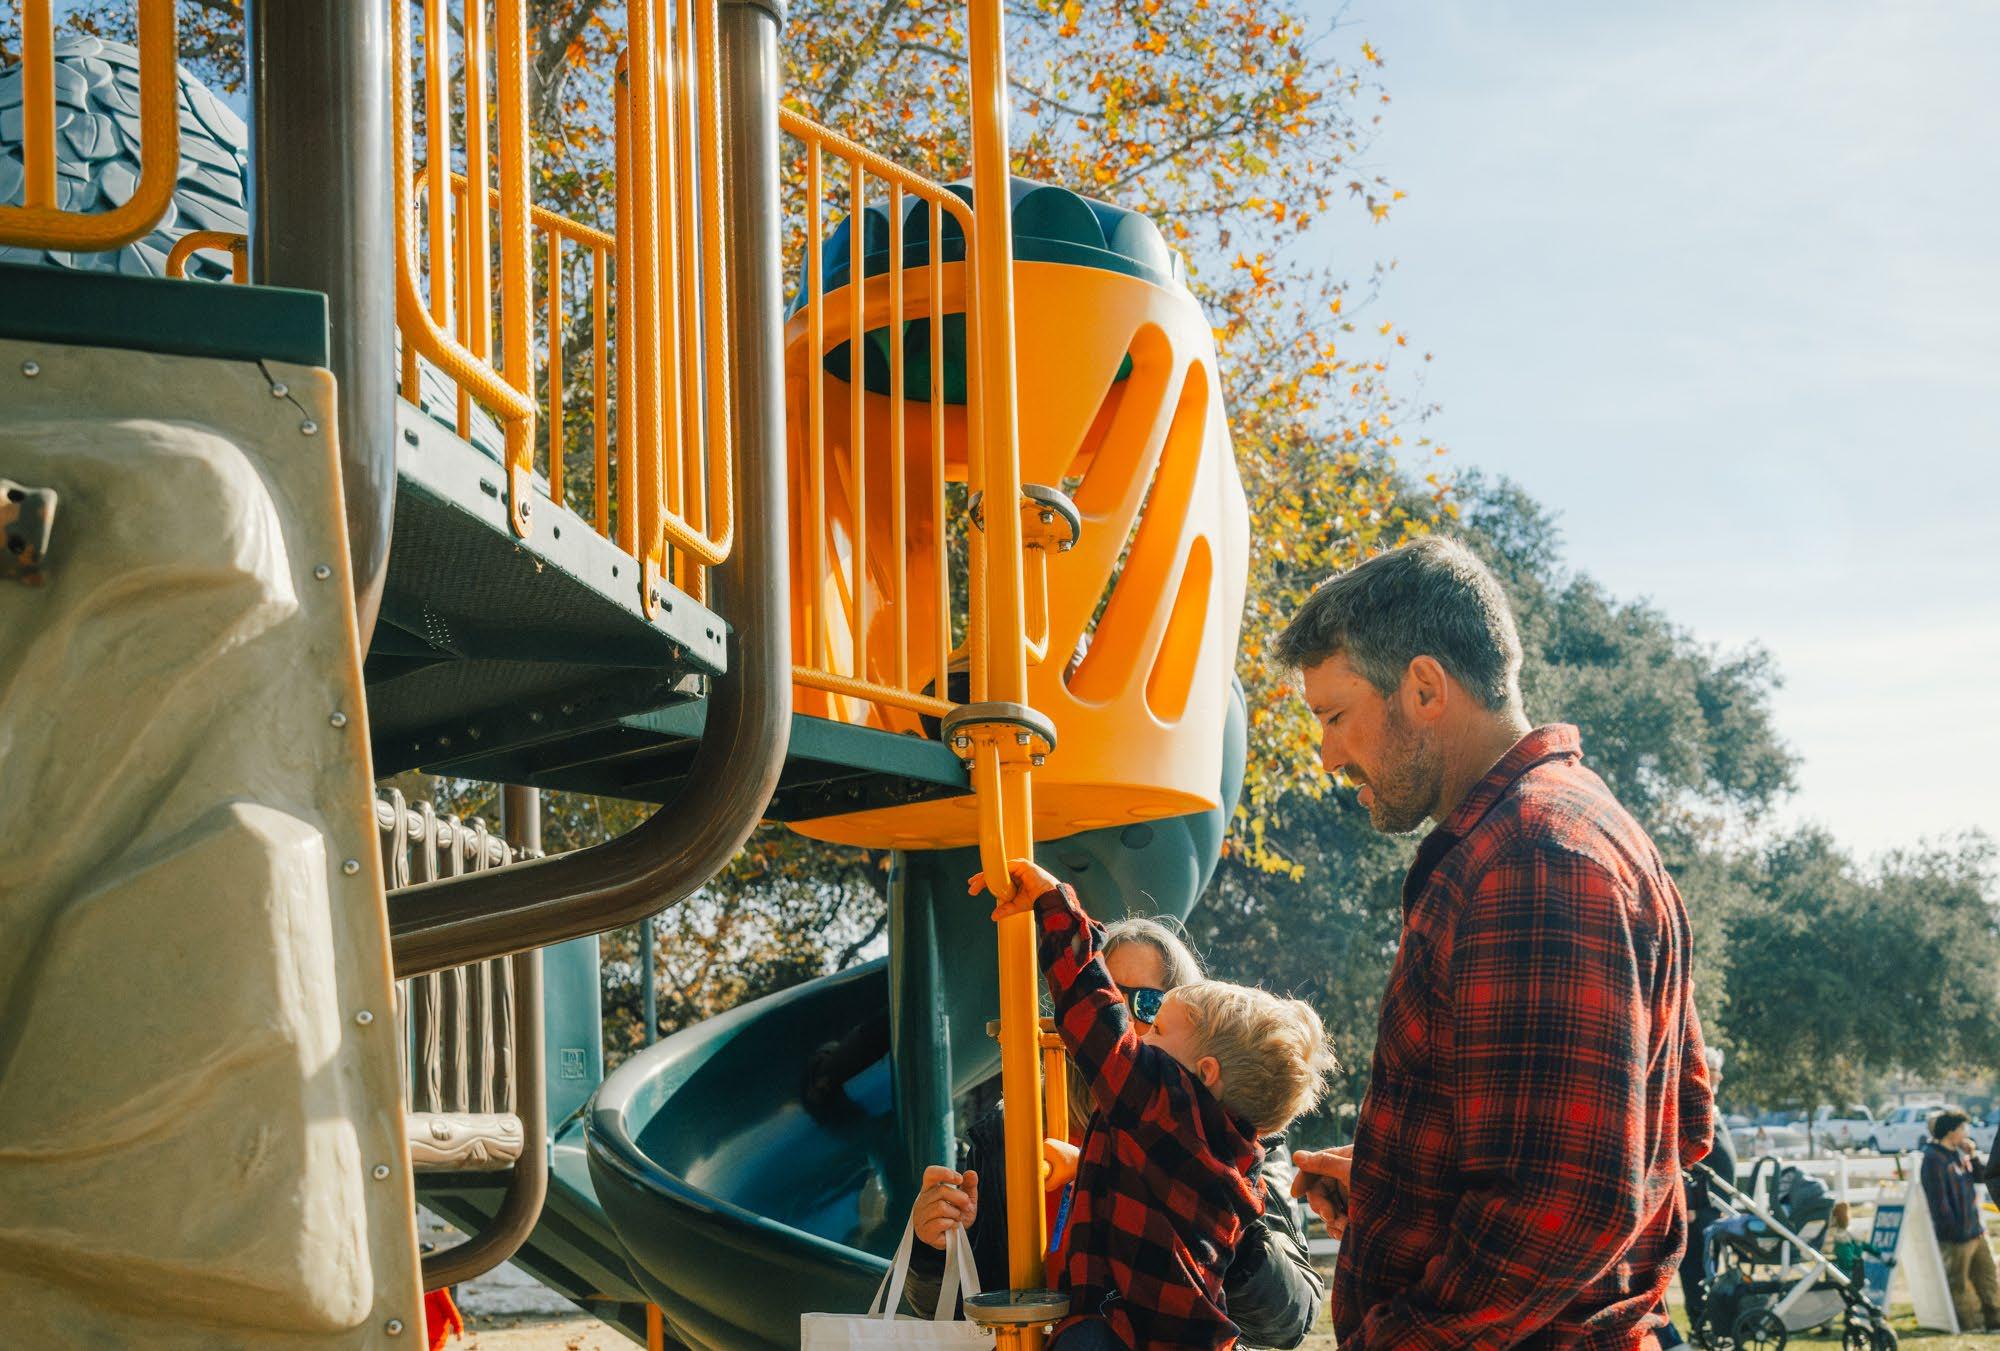





A Parks and Recreation Master Plan Update is a comprehensive report that outlines a jurisdiction’s existing parks and recreation services and amenities, often including an analysis of existing services as well as recommendations and suggestions for improvements. A Parks and Recreation Plan is typically informed by pre-existing City and County data, quantitative and qualitative data collected at the time of the report, and qualitative data collected from community members through various community engagement efforts such as workshops, surveys, and specialized committees.
This Parks and Recreation Master Plan Serves as an Update to the 2006 Parks and Community Services Update. These types of Plans should ideally be updated every 10 years to keep up with the City’s evolving demograpics, land use changes, and parks and recreation trends.
This Plan is divided into six chapters: Introduction, Analysis, Programming and Staffing, Maintenance Operations, Community Outreach, and Recommendations. An Appendix of referenced documents, surveys, and studies can be found at the end of the Plan.
Chapter 1 - Introduction: Provides the context and framework for the document as a whole.
Chapter 2 - Analysis: Provides an inventory of existing parks, as well as initial assessments and analysis on park conditions and levels of service within the community.
Chapter 3 - Recreation Services, Staffing, and Finances: Analyzes programs and services the departments offer, as well as recreation and maintenance staffing and finances to better understand how taxpayer dollars are being utilized.
Chapter 4 - Maintenance Operations Assessment: Assesses existing parks maintenance operations and how they contribute to the overall success of the City’s parks and recreation system.
Chapter 5 - Community Outreach: Identifies community engagement efforts and provides a detailed description of feedback received at engagement events.
Chapter 6 - Recommendations: Provides recommendations for park amenity improvements, opportunities for development, and funding sources for the City to utilize. Winter 2024 - Spring 2025 Summer 2025

Americans with Disabilities Act (ADA): Legislation enacted in 1990 that prohibits discrimination on the basis of disability. In parks and recreation, this means that public parks and recreation facilities must be accessible to individuals with disabilities.
Amenity: A physical element that accommodates a recreational activity or sport.
Demographics: Statistical data relating to a population; typically includes measures such as race, income level, age, gender, ethnicity, education, etc.
Equity: The principle of fairness that takes into account existing inequalities among a variety of individuals and communities.
Guiding Principles: Values that inform a framework that then influences goals and decisions made.
Geographic Information Systems (GIS): A tool utilized by urban planning professionals to gather and visually portray spatially-related data, usually in the form of maps.
Infill: The development of vacant or underutilized land.
Park and Recreation Master Plan: A long-term, comprehensive document that guides and informs the future planning and development for topics relating to parks and recreation.
Stakeholder: Individuals, groups, and organizations affected by the specific decisions, operations, or outcomes.
Statistically Valid Survey: A survey reflecting a statistically accurate sample of the population with a small margin of error.
NRPA: The National Recreation and Park Association (NRPA) is a leading non-profit organization in the park and recreation world. NRPA provides many park and recreation standards and best practices utilized in Park and Recreation Master Plans across the country.
The City of La Verne’s Parks and Recreation Department is responsible for the provision of various leisure and recreation services. The Department manages recreation programming, sports, youth activities, and senior citizen activities, in addition to a number of other community services.
The Department, previously called the Community Services Department, has transitioned its name to the Parks and Recreation Department in an effort to more accurately reflect its functions and responsibilities. The Department manages the City’s community center, the Aquatic Center, Veterans Hall, and the Oak Mesa Facility, public recreation spaces, and recreation programs.
The Department, in collaboration with the Public Works Department, maintains the quality of amenities and facilities, and coordinates efforts to fund infrastructure projects, park maintenance, and amenity enhancements.
The City of La Verne’s Public Works Department plays a key role in managing the essential services that allow the City to operate smoothly. The Department’s mission is to:
“....plan, develop, and deliver quality public infrastructure and services that enhance the daily lives of La Verne residents and businesses...”
The Department is responsible for the development and implementation of the City’s Capital Improvement Program, as well as the maintenance and operations of everyday infrastructure, which includes asset management, regulatory compliance, and critical systems management. The Public Works Department is home to four divisions: the Administration & Environmental Services Division, the Fleet & Equipment Services Division, the Parks Division, and the Utilities Division.
Within the Department, the Maintenance Services Divisions is responsible for the care and upkeep of the City’s public streets, facilities, parks, open spaces, and landscaping within public right-of-way.
This comprehensive, guiding document will serve as a reference point for the future development of projects and programs in La Verne.Summaries of previously published planning documents have been included in sections below.
The City of La Verne’s General Plan (2025) is a long-range planning document created to guide the planning and implementation of land uses within City boundaries through 2045. The document outlines a central vision that establishes La Verne as a safe, enjoyable, and thriving place to be for all ages. The City establishes itself as a family friendly community, focused on providing the highest quality of life for the youth of La Verne.
The recently published report includes in depth detail on the goals and action items of several elements including Land Use, Economic Development, Mobility, Resource Management, Public Safety, Community Services, Community Design, Fiscal Sustainability, Health and Wellness, and Housing (published in a separate document).
Within the updated Resources Management Element of the General Plan, several Goals and Policies are listed that directly inform the development of this Parks and Recreation Master Plan, including the following:
Goal RM-1: A community featuring an attractive, safe, and accessible parks and recreation system that is sufficiently funded and properly maintained.
» RM-1.1: Park Types. Provide a range of open spaces, parks, trails and recreation facilities to meet the active and passive recreational needs of all La Verne residents, regardless of age, ability, or income.
» RM-1.2: Park Standard. Maintain at least four acres of open space, park land and recreational facilities for every 1,000 residents.
» RM-1.3: Access Standard. Provide open space, parks or recreation facilities within one-half mile radii of all City residents and prioritize acquisition and development of new facilities in under-served areas. Physical barriers (i.e., roadways, railroad lines, topography) should also be considered when evaluating service area and access.
» RM-1.4: Park Design. Uphold design, construction, implementation, and maintenance standards to ensure safe high-quality facilities, programs, and services that cater to a variety of ages and abilities and reflect local and historic cultural elements.
In 2018, the City of La Verne produced an Existing Conditions report, a document outlining the physical, environmental, economic, and demographic status of La Verne. The report was created with the intention of informing the 2025 General Plan Update. While all elements within the Existing Conditions Report were reviewed, those summarized below proved to be the most salient to the development of this Parks and Recreation Master Plan.
Within the City of La Verne, the majority of all land use, 56 percent, is evenly split between single family residential homes and open space (inclusive of parks and recreation services). Most of the open space sits in the north as the County-owned and operated Marshall Canyon Open Space. Additionally, it is important to note the 16 Specific Plans that further influence land use guidance and development in La Verne.
There are 21 City-owned parks within La Verne, ranging in size from mini parks (0.5 acres) up to community parks (> 10 acres) (Table 2-1). Adherence to National Park and Recreation Association (NRPA) guidelines for individual park categories has proven difficult in La Verne since City parks typically serve several purposes regardless of the prescribed category.
The City of La Verne recognizes the positive influence recreation access has on physical activity. Physical activity limits for adults is below County and State averages, per 2012 and 2014 data. Assessments of neighborhood walkability determined that the southern and northern portions of the City have generally lower walkability scores, indicating that these regions are better suited for auto travel. Though some residential areas located near commercial centers may be more conducive to pedestrian traffic than others, they are typically found to have the highest walkability scores, indicating easier and more accessible opportunities to walk among pedestrians.
The 2006 Parks and Community Services Master Plan was created to serve as an update to the City’s original 1989 Park and Recreation Facilities Master Development Program. The document provides an extensive, updated community analysis of existing facilities, programs, and resources in the City, a needs assessment of park facilities informed by community and City input, recommendations on parks, facilities, and programming, and park improvement funding information. This Master Plan also addresses the City’s decision to adopt and alter the NRPA’s park category standards to better suit the City’s needs. This Report serves as an update to this Master Plan.
In 2016, the Los Angeles County Parks and Recreation Department produced a comprehensive Parks Needs Assessment (PNA) documenting the “scope, scale, and location of park need in Los Angeles County”. The report was created with the intention of informing future funding opportunities, as priority projects were identified within the process.
In 2022, the County produced an expanded report, the Parks Needs Assessment +, that built upon the existing 2016 report by providing additional data tailored to regional parks, rural parks, and open spaces. The report emphasized conservation and restoration measures, with a specific focus on the County’s “30 x 30” goal, an effort to conserve 30 percent of lands and coastal water by 2030.
The Study Area Profile for the City of La Verne inventoried existing parks and their respective amenities, including the conditions of each amenity. La Verne was ranked as having 25 percent ‘Moderate’ park need, 72 percent ‘Low’ park need, and 2 percent ‘Very Low Park Need’. However, within the greater context of the LA County Parks Needs Assessment, La Verne was deemed a ‘Very Low’ park need area.
The City of La Verne is located at the foothills of the San Gabriel Mountains in eastern Los Angeles County and is defined as an area of just over eight square miles. Originally occupied by the Tongva tribe over 8,500 years ago, the land was colonized by Spanish settlers throughout the 1700s and early 1800s, eventually developing in the mid1800s during the height of railroad expansion. The City, officially incorporated in 1906, was known for its citrus production and small town charm, themes that still reign true to the essence of the city today.
Race and Ethnicity
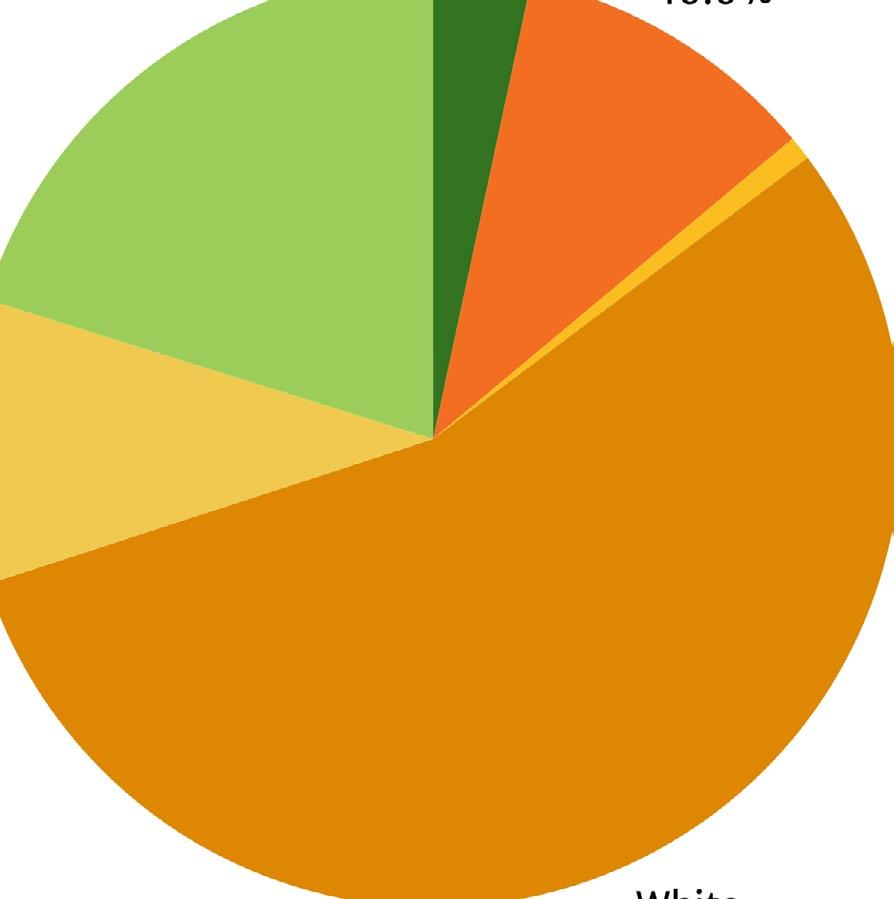
The racial and ethnic makeup in La Verne is 55.2 percent White, 20.2 percent two or more races, 10.6 percent Asian, 9.8 percent other race, 3.4 percent Black or African Amercian, and 0.8 percent American Indian or Alaskan Native.
The median age in La Verne is 46.9, which is higher than the median ages of Los Angeles County (38.6) and California (37.6).
» 19.4 percent of the is under the age of 18, on par with data at the County (20 percent) and State (21.7 percent) levels.
» 24.1 percent of the population is over the age of 65, above the County (15.7 percent) and the State (16.7 percent).
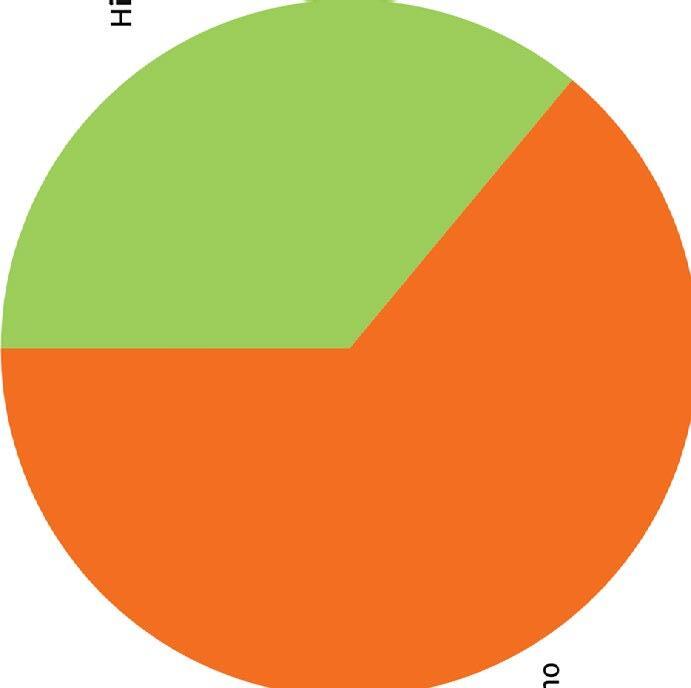
The population of La Verne is evenly split among the sexes, with males making up 48.6 percent of the population, and females making up 51.4 percent. These figures are similar to County and State levels.
The median household income for La Verne is $104,565, a figure higher than the averages at the County (87,760) and the State ($96,334)
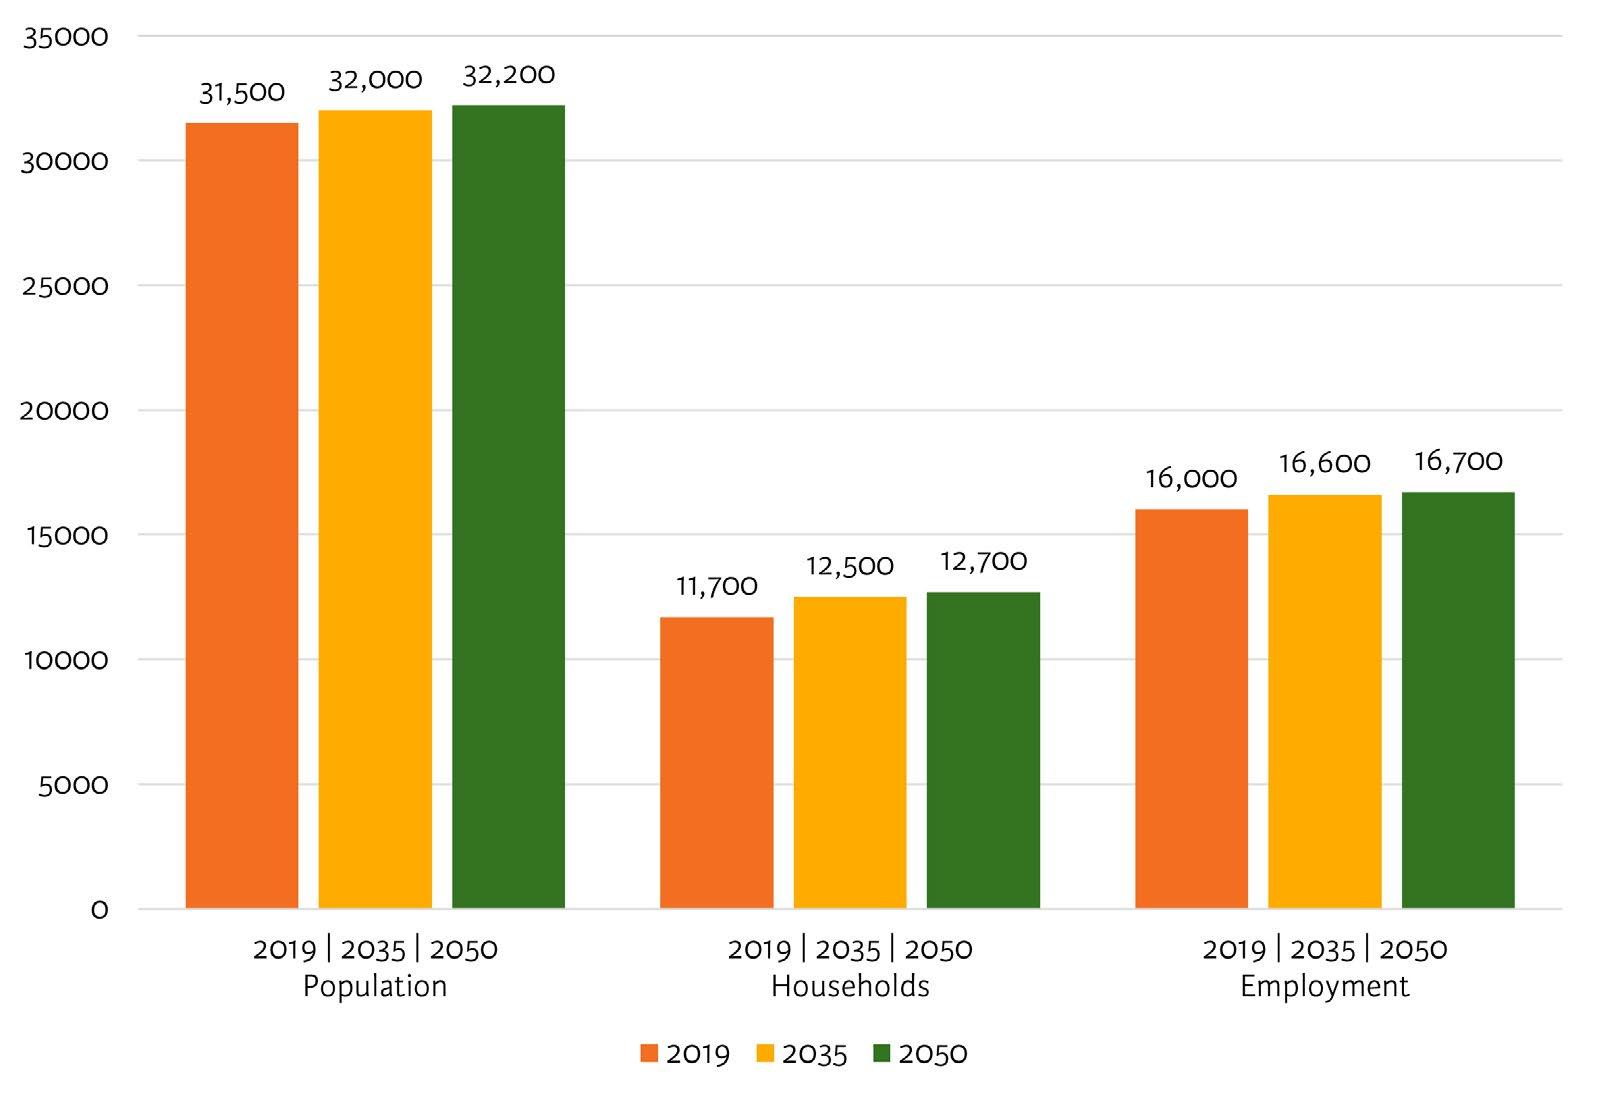
The Southern California Association of Governments (SCAG) projects that by 2050, La Verne’s population will rise by 2.2 percent, up to 32,200 residents. Additionally, the number of households in the City is expected to increase by 8.5 percent, from 11,700 households in 2019, to 12,700 households in 2050. The projected growth estimates are displayed in Figure 1-1. The data used in this analysis is based on existing and projected 2019, 2035, and 2050 data from the Southern California Association of Governments.
8.4 SQUARE MILES
31,334 2020 POPULATION
$104,565
MEDIAN HOUSEHOLD INCOME
12,036 HOUSING UNITS
46.9
MEDIAN AGE
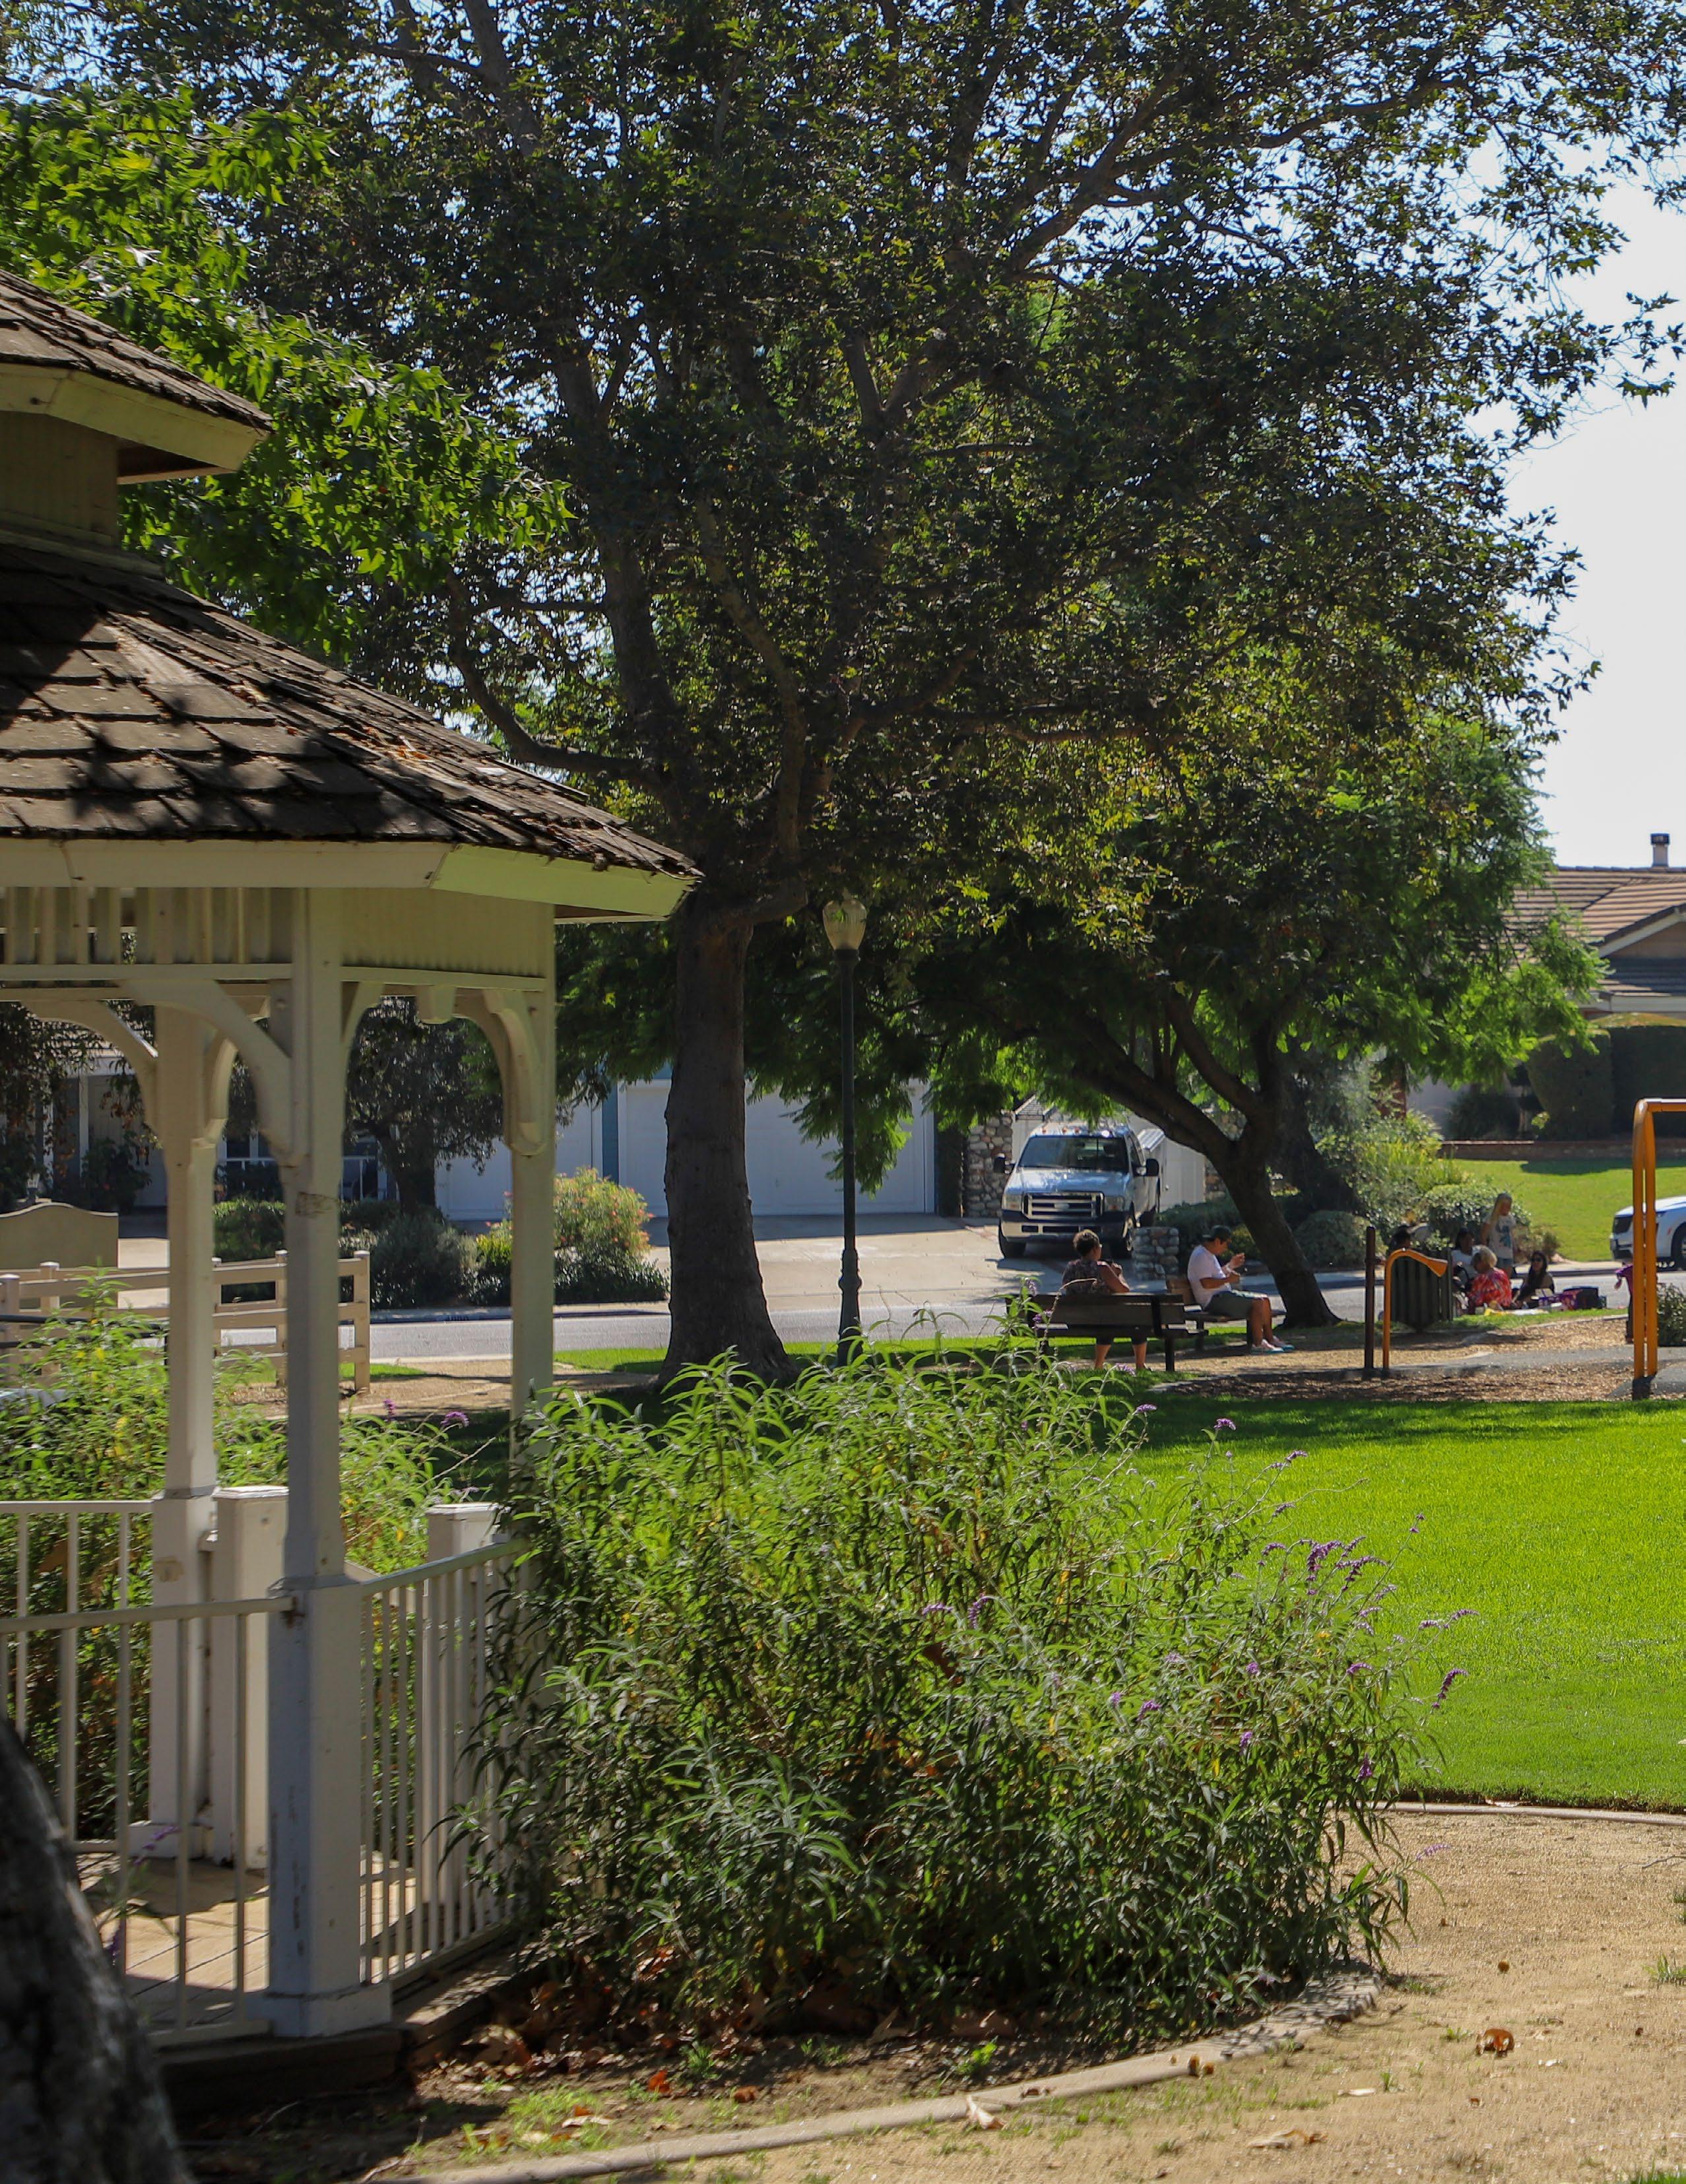
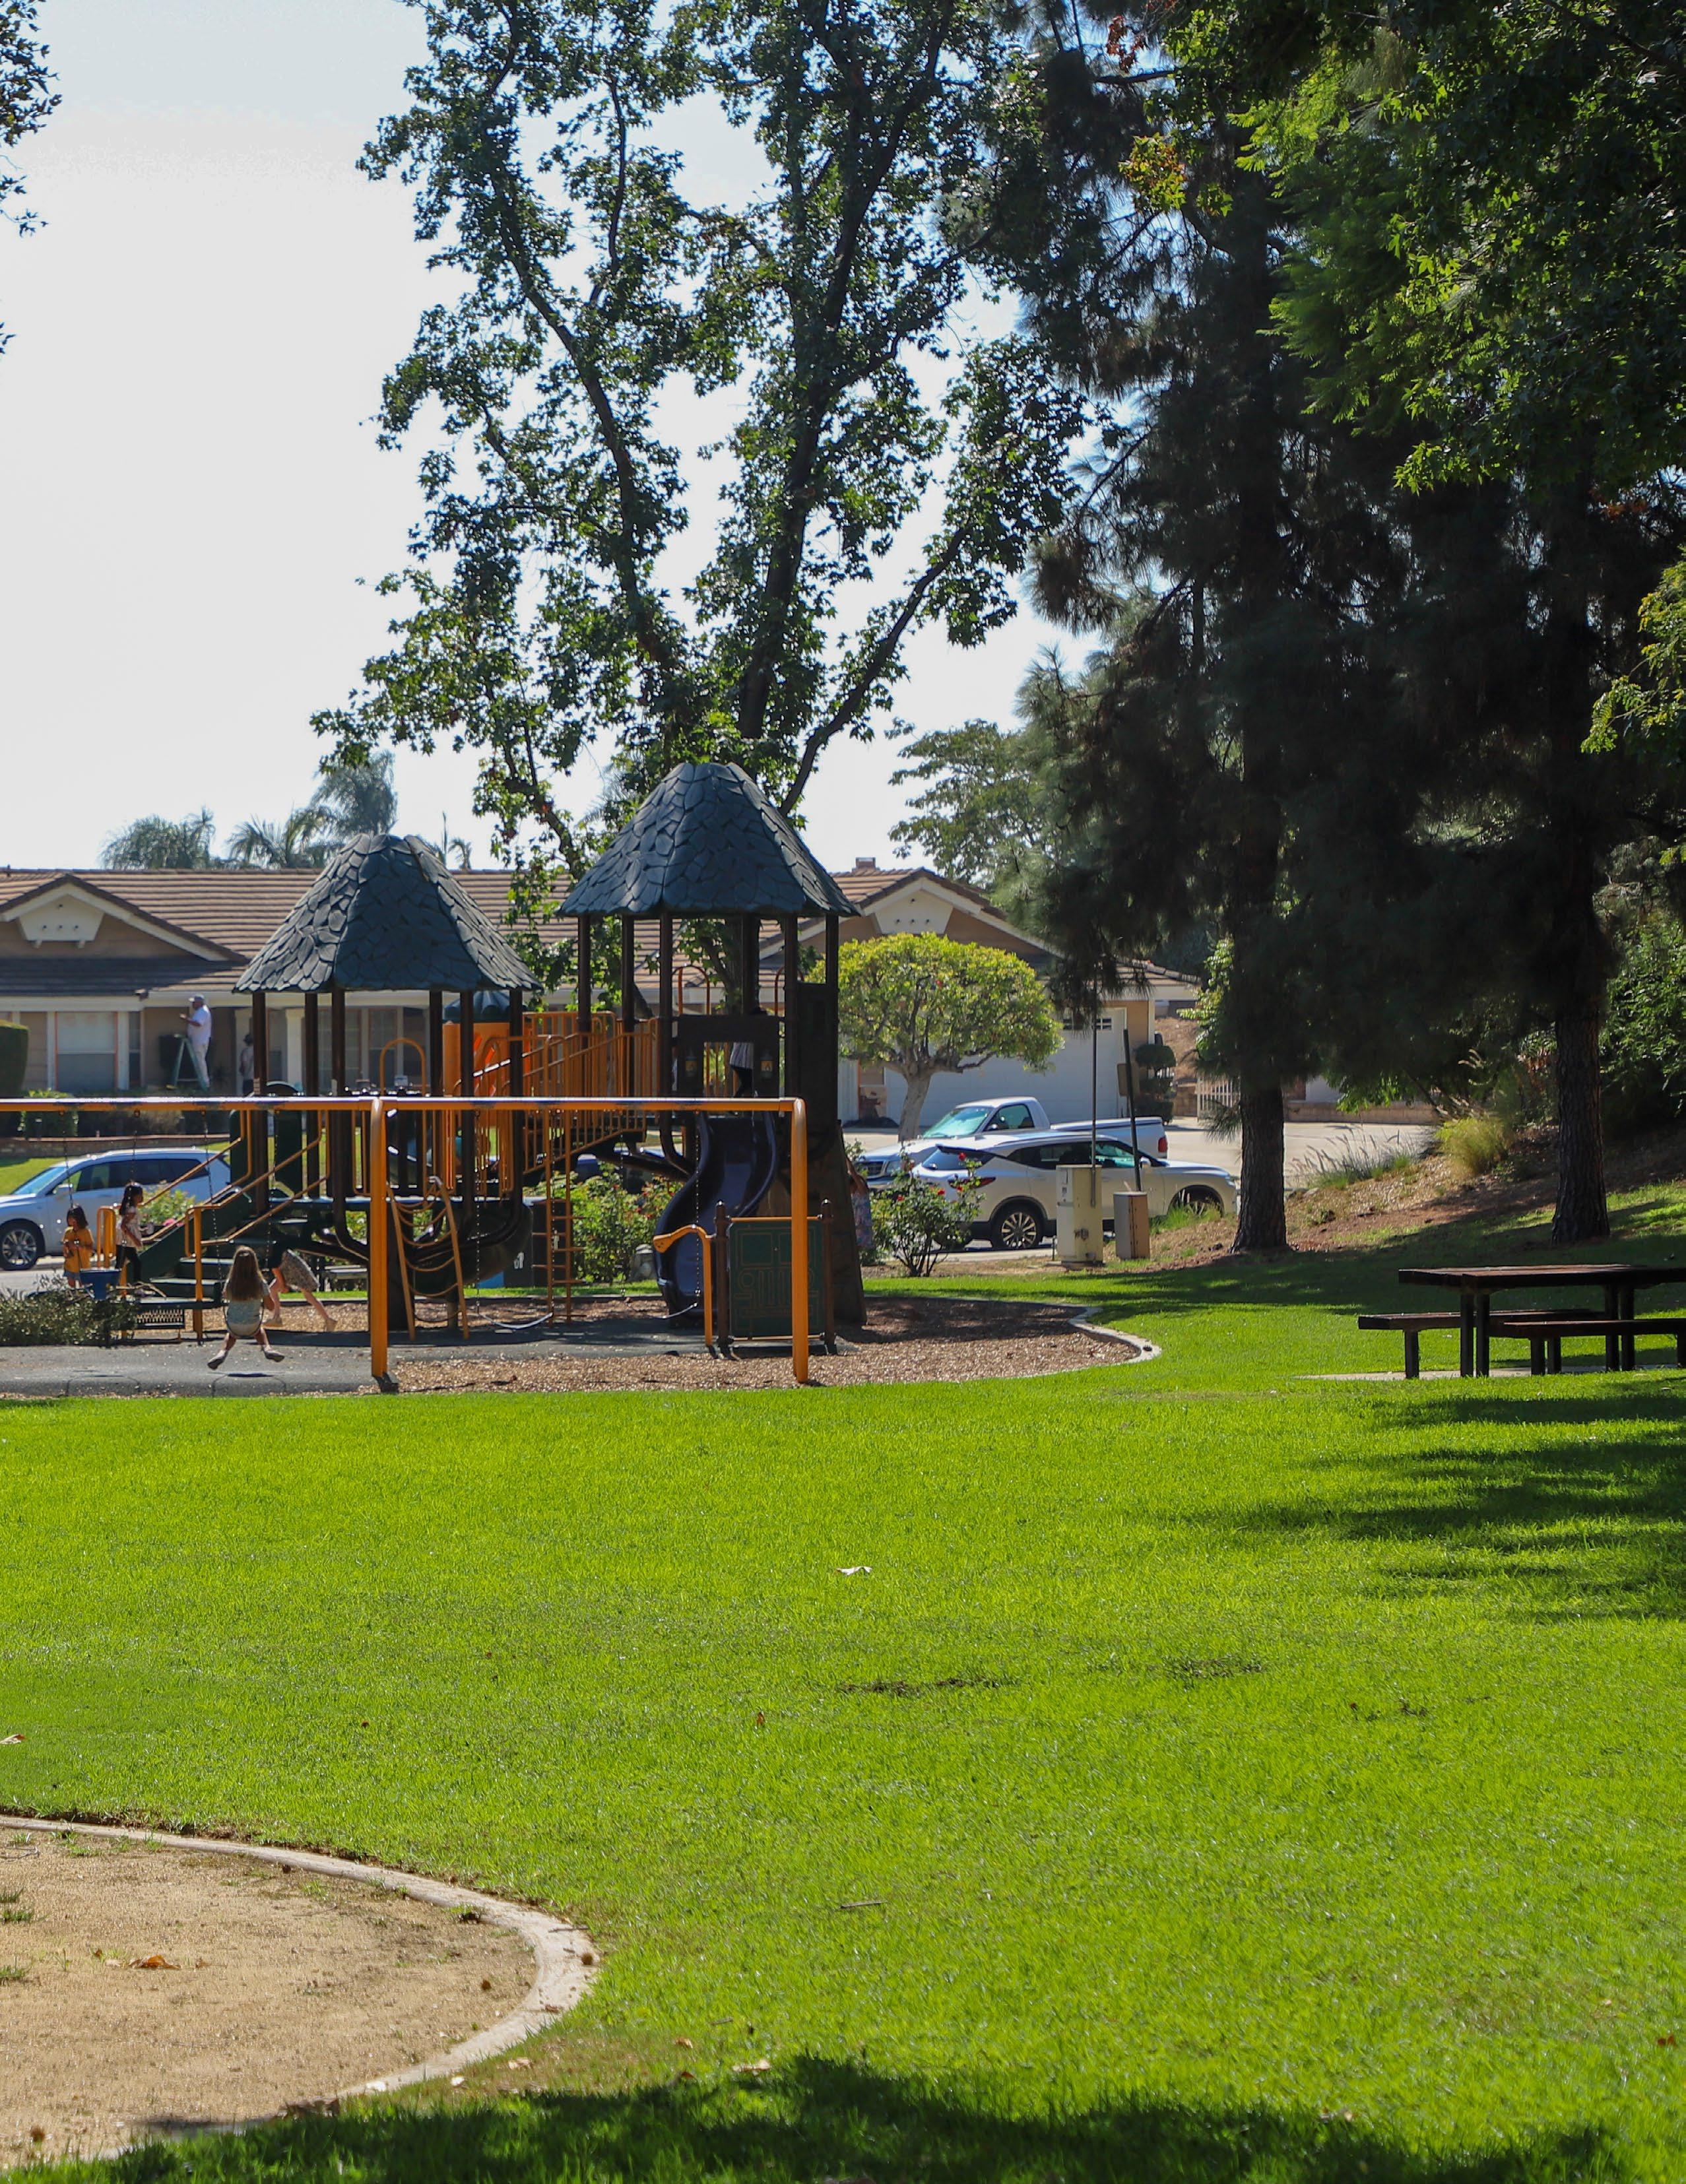
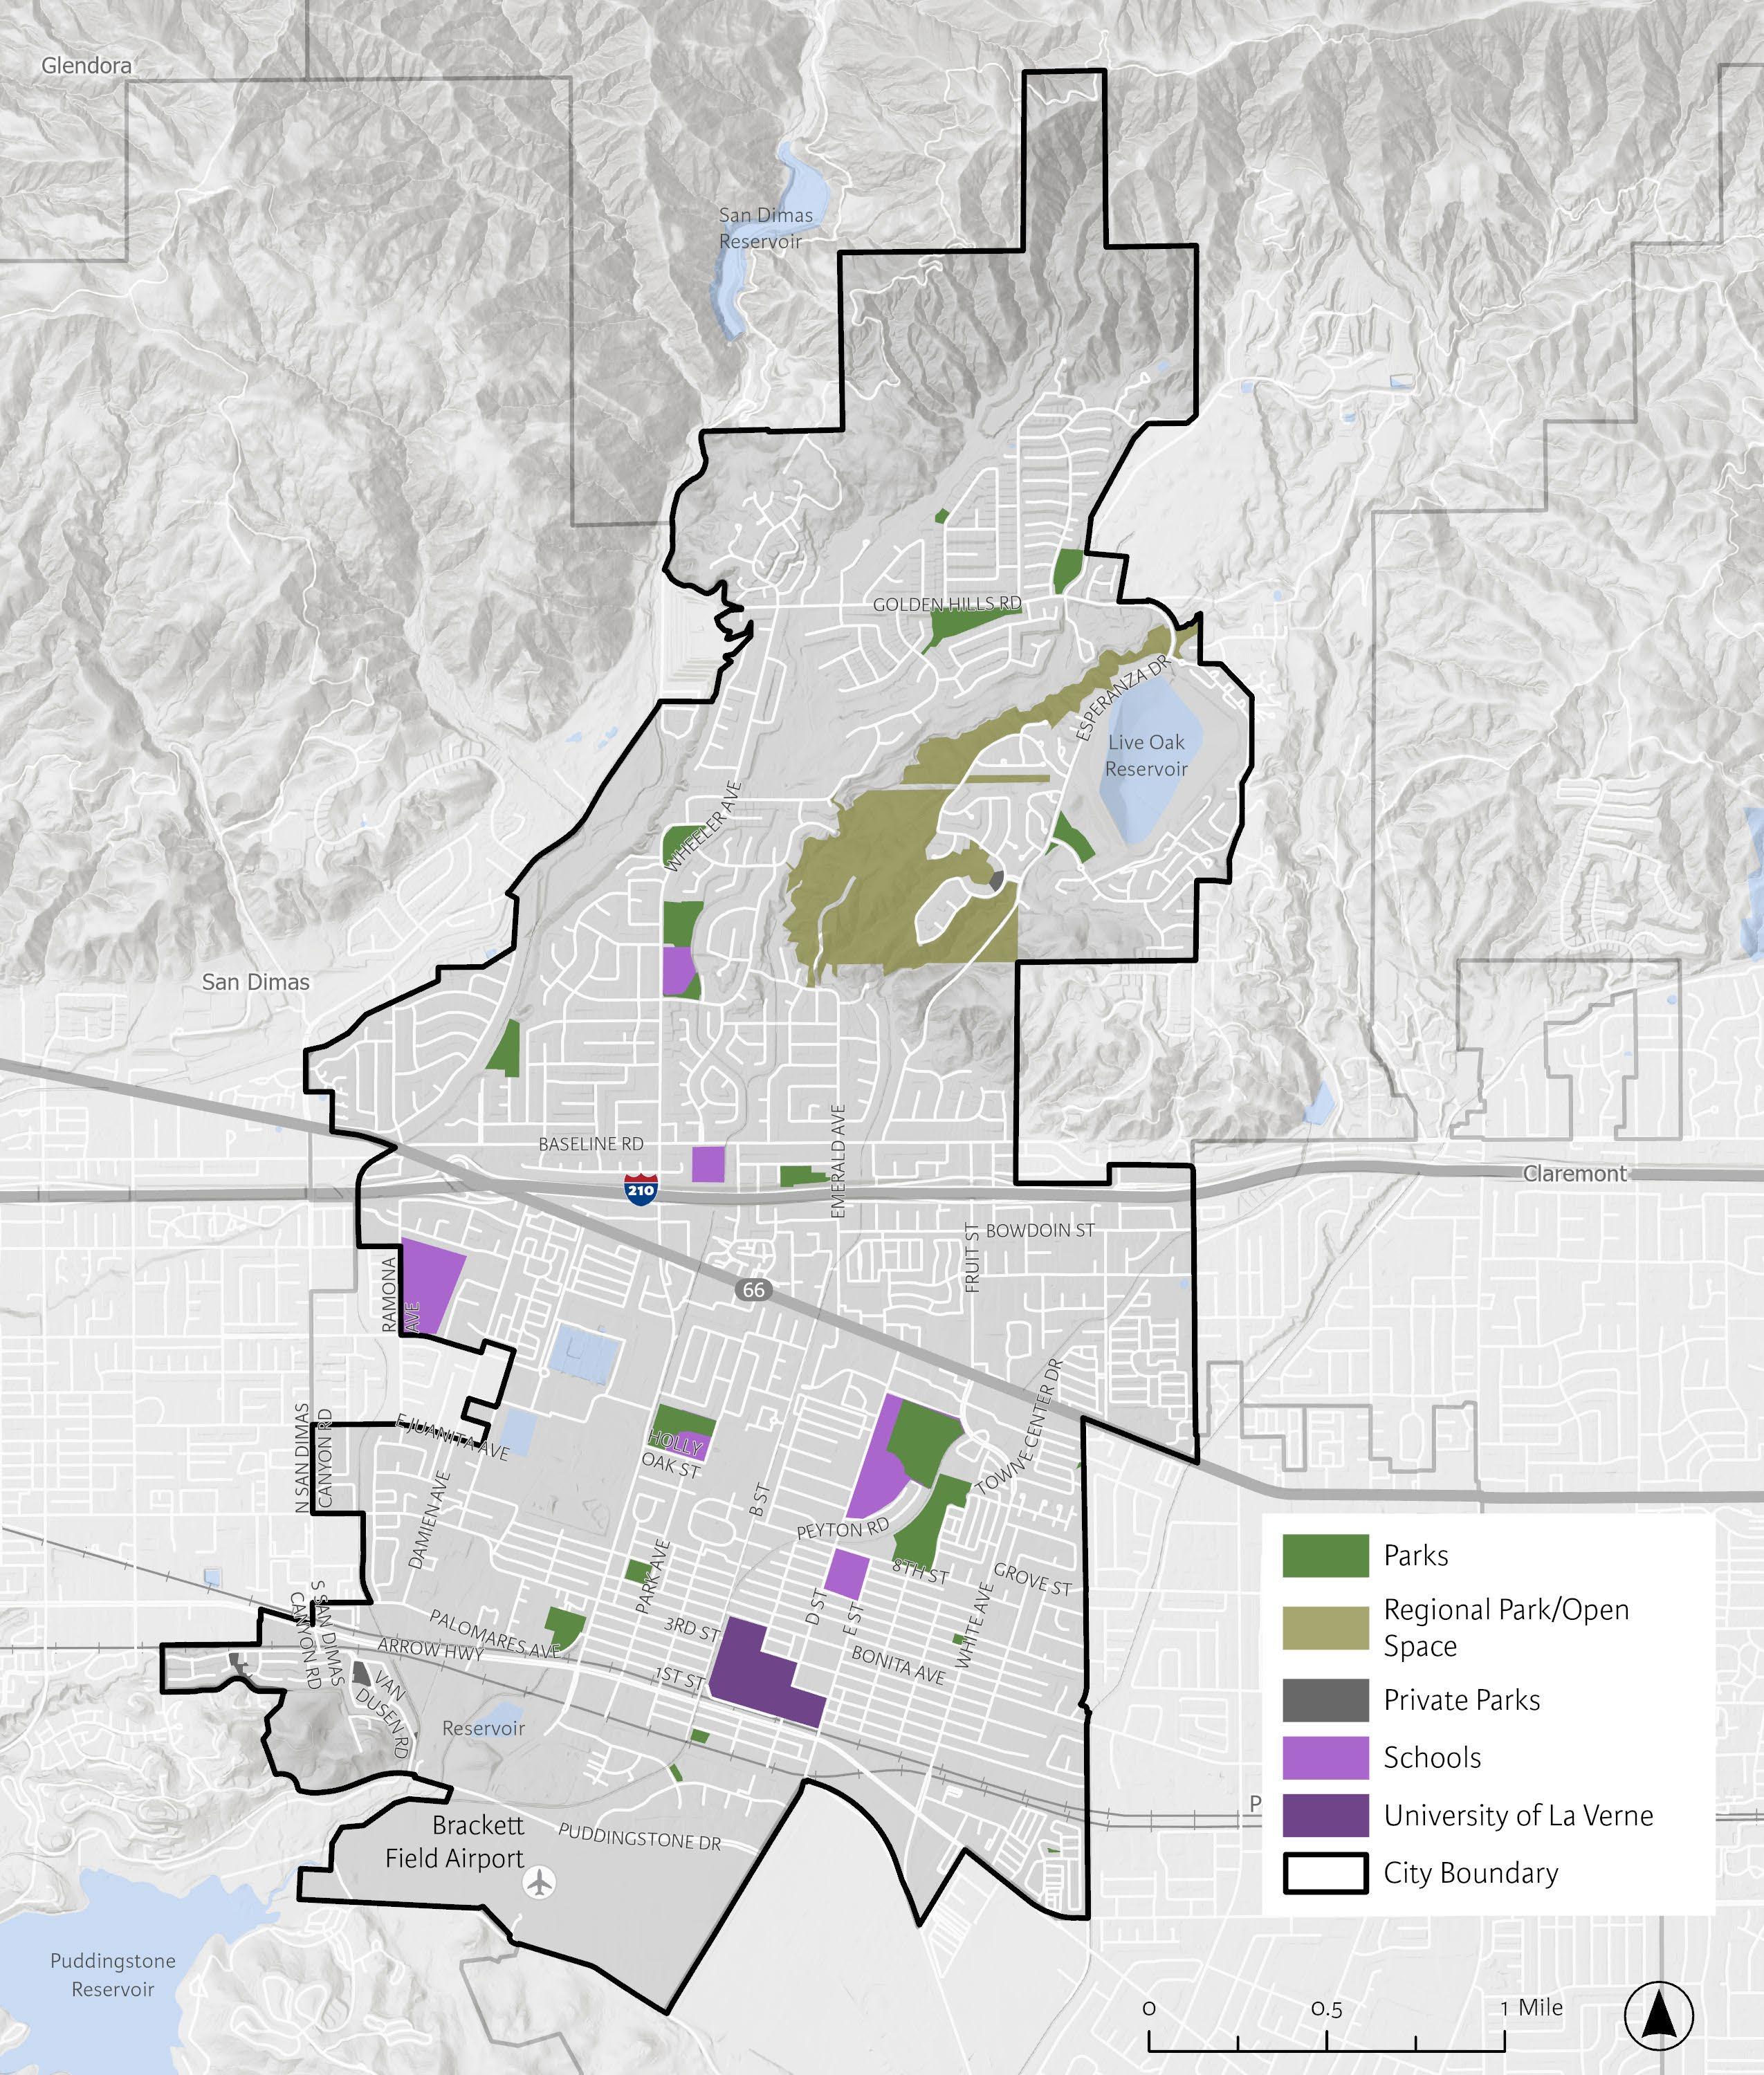
This Plan categorizes the City’s parks into four types: Mini Parks, Neighborhood Parks, Community Parks, and Regional Parks. These categories are consistent with those identified in the City’s 2025 General Plan. The existing acreage of each park type is listed in Table 2-4. La Verne is also home to several private parks, which are not maintained by the City.
The park classifications outlined by the City may not always fit neatly into the categories defined below, since each park varies slightly in the unique amenities and uses it offers.
The icons below represent the typical amenities found within each park type, though amenities may vary by park, regardless of classification.




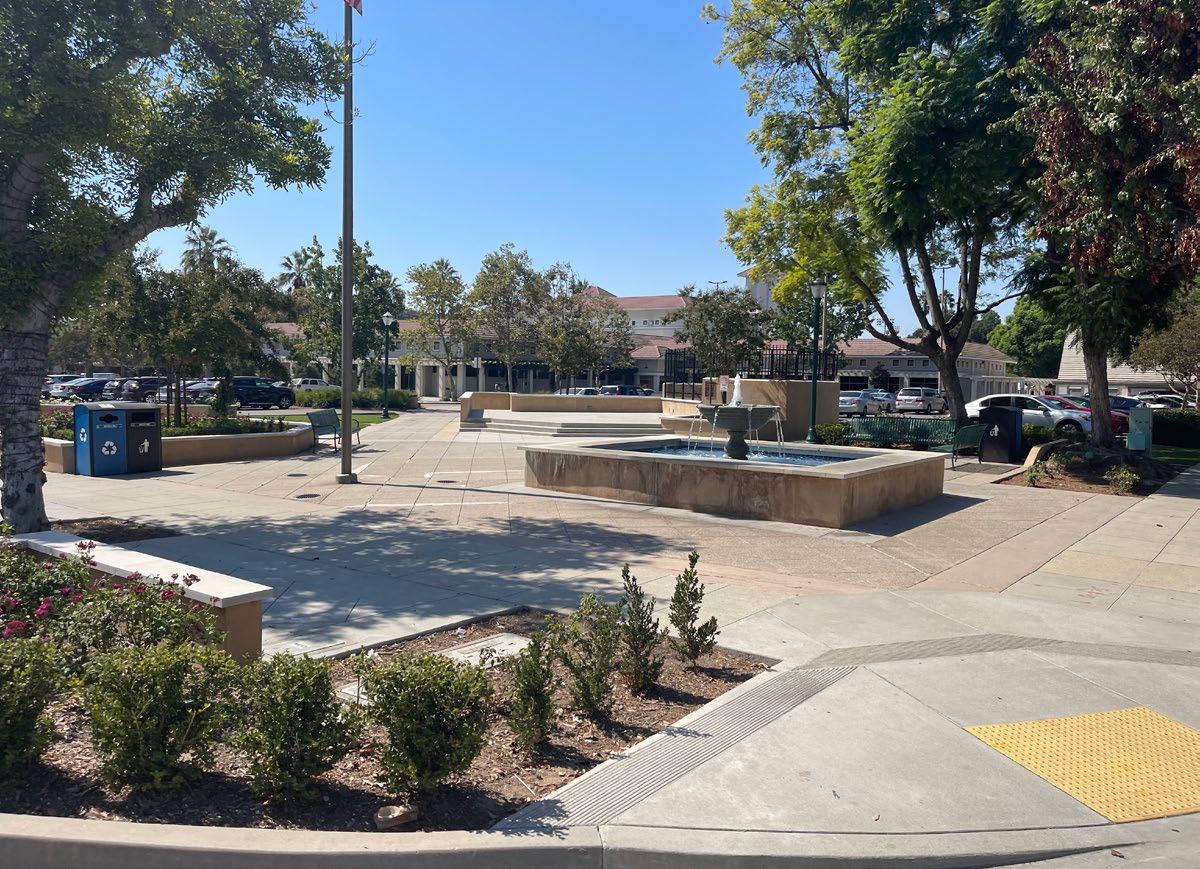
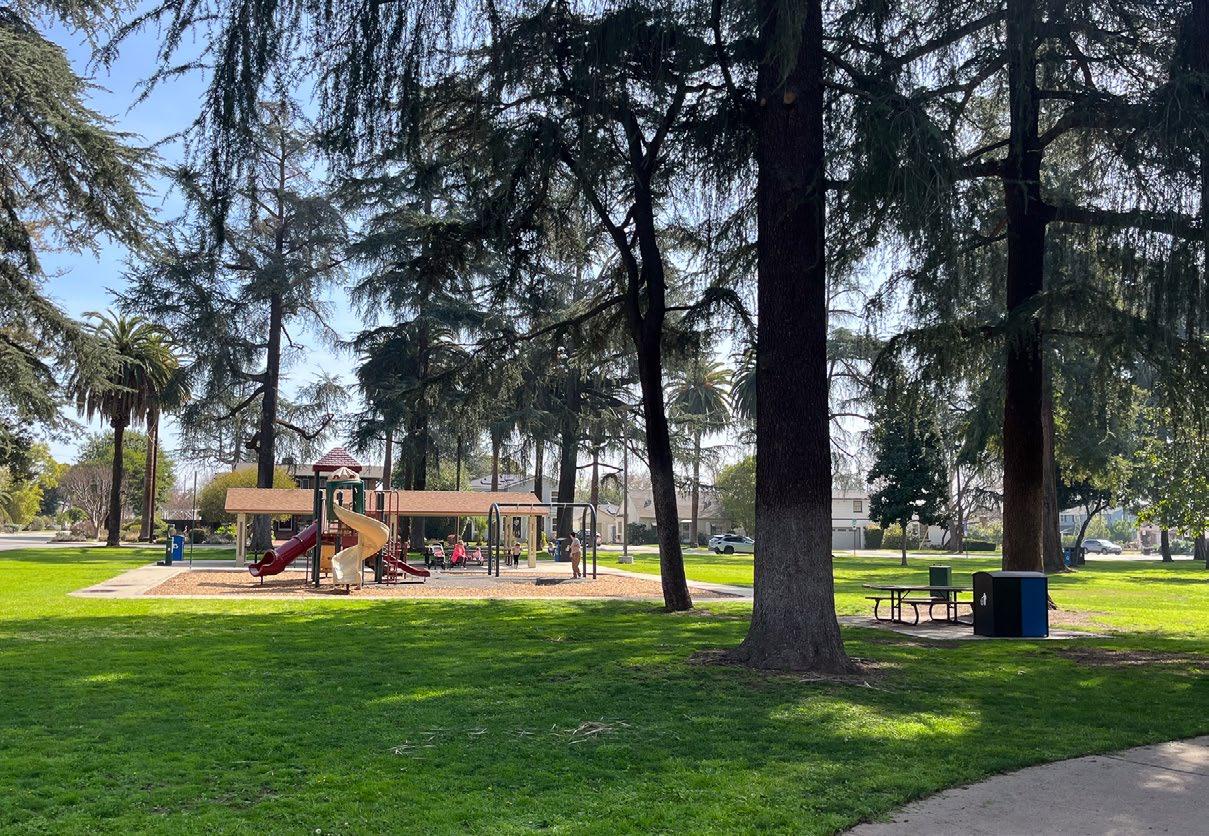




Mini Parks are generally smaller parks that provide passive recreation opportunities and access to nature. Although they are smaller in size and focus on passive recreation, they play an important role in providing outdoor access for high density neighborhoods. These parks are typically less than one acre in size and serve residents within a half mile radius. Open grassy areas, picnic tables, short walking paths, and playgrounds are typical park amenities.
Neighborhood parks are medium-sized green spaces offering both passive and active recreation. Typically ranging from one to 10 acres, they often feature amenities such as playgrounds, picnic areas, walking paths, and occasionally sports courts or practice fields. These parks are designed to serve local residents within a half mile radius, and should be centered around safe biking and walking access.
TYPICAL SIZE: 10-25 ACRES
TYPICAL AMENITIES:
Community Parks are designed to serve the daily recreation needs of the larger community. They are generally between 10 and 25 acres in size and serve community members within a one to two mile radius. They typically contain amenities found in neighborhood parks but also larger park amenities such as sports fields, multiple sport courts, restrooms, and dedicated parking. Community centers and recreation centers are also often located within Community Parks
TYPICAL SIZE: 25+ ACRES
TYPICAL AMENITIES:
Regional parks and open space cater to both city-wide recreational needs and the broader local community. Typically 25 acres or larger, they feature a variety of amenities, including sports facilities capable of hosting regional tournaments. Nature-focused regional parks may also include designated natural areas and trails. Restroom facilities and dedicated parking are usually provided to users.
*Note: Regional Parks are sometimes nature-oriented and will not contain sports facilities, sports courts, or play areas.
2-1:
*Marshall Canyon Conservation Corridor is recorded at 25% of the












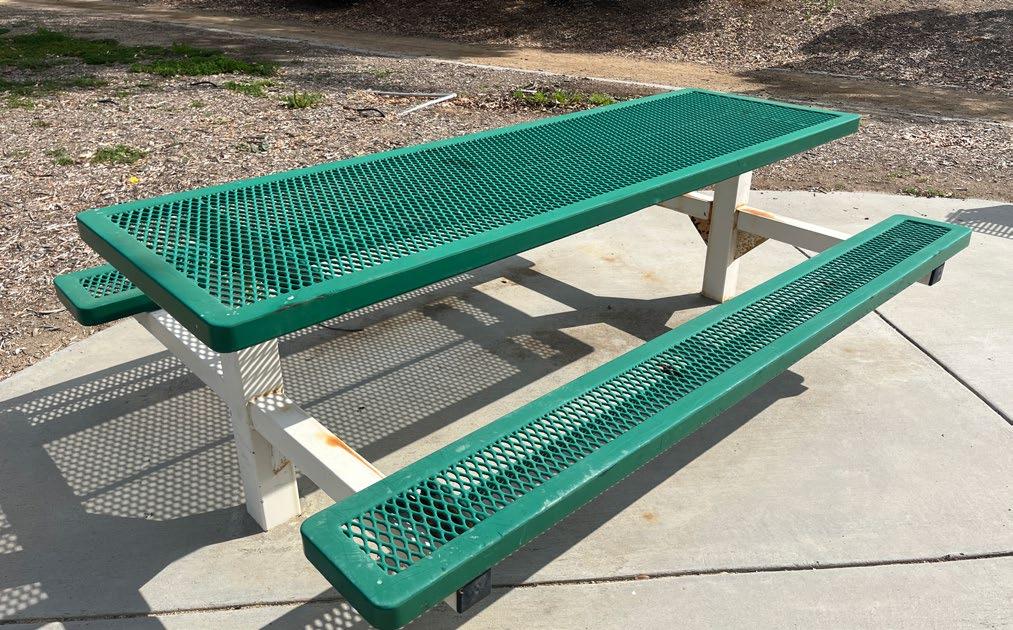
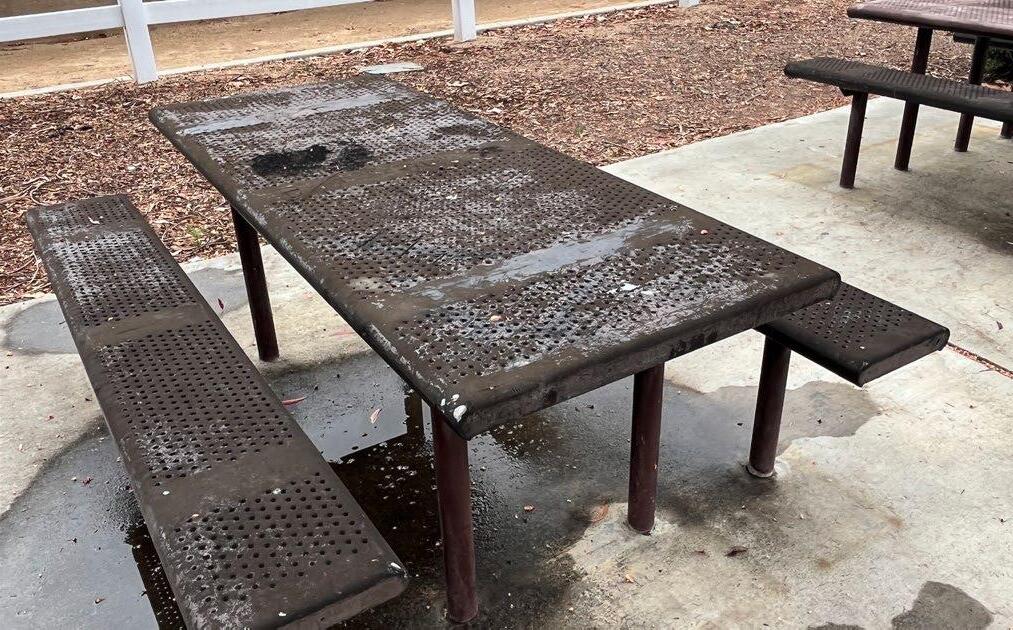
A qualitative asset and amenity assessment was conducted to review the quality of park features and amenities. Data was collected by the planning team during fieldwork using an ESRI-based data collection system called “Fieldmaps”. The condition of each asset and amenity falls into one of four categories: Excellent, Good, Fair, or Poor. The condition of each amenity at a given park was averaged to determine the overall condition of that park, as shown in Table 2-2. This is a useful tool to determine which parks will require additional resource allocation to replace amenities in the future and was used to determine maintenance needs and park recommendations.
The majority of La Verne’s parks have assets and amenities that are in good overall condition, indicating that most parks are functioning as intended and are providing a quality park experience for park users.
4 = EXCELLENT (Near perfect condition)
2 = FAIR
(Significant wear and tear, minor functional issues)
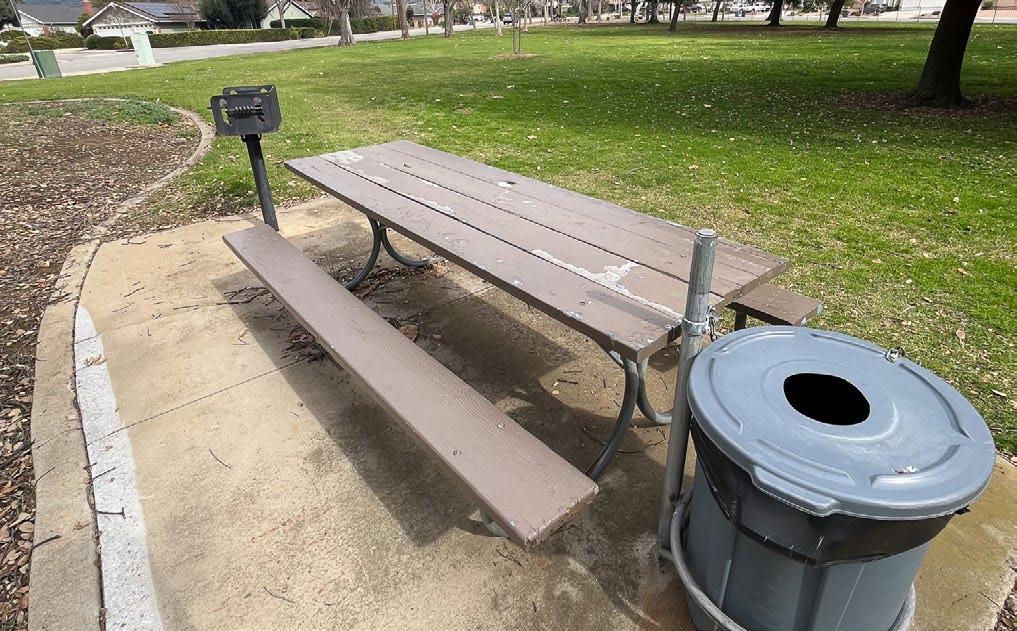
The average asset and amenity assessment score each park receives can be explained through the individual scores each asset and amenity receives that exists within that park. So while a park may receive an overall grade of ‘Good’ on their feature, it does not equate to meaning that all of the park’s assets and amenities are in ‘Good’ condition, but rather, that all asset and amenity scores lead to an average score of ‘Good’.
Amenities with “Fair” scores should be monitored and replaced as needed. The findings of this qualitative assessment of park assets and amenities were used alongside other metrics to develop into the “Park Grades” displayed in the following section.
3 = GOOD (Minor wear and tear, still functionally sound)
1 = POOR (Major functional issues, replacement or repair needed)
Along with snapshots of information, each park was graded according to pre-determined categories and subsequently given a ‘report-card’ style grade. The four pre-determined categories included: (1) Amenity Condition, (2) Connectivity and Accessibility, (3) Comfort and Identity, and (4) Activation. The park grades, which are included in the “Park Profiles” in the following section, were used to develop recommendations and to identify parks in greatest need of improvements.
Not every category and item is graded for each park type. For example, mini parks are not evaluated for Activation due to their typical small size and inability to accommodate certain activities and amenities. See Table 2-3 to review which items are and are not evaluated for each category.
AExcellent Satisfies 76-100% of the metrics
BGood Satisfies 51-75% of the metrics
Table 2-3: Park Report Card Framework
CFair Satisfies 26-50% of the metrics
DPoor Satisfies 0-25% of the metrics
Category 1: Amenity Condition (Completed after fieldwork)
Based on the overall amenity condition assessment score.
Category 2: Connectivity and Accessibility
Park has a full walking loop
Park amenities are accessible by wheelchair or other mobility aidX
Park has a nearby transit stop (revisit after fieldwork)
Park has multiple access points
Category 3: Comfort and Identity
Park has entry signage
Park has placemaking elements
Park has adequate lighting for night activities
Park has controlled access (clear entry and exit points)
Category 4: Activation
Park amenities that facilitate social gatherings
Park as organized programming activities
Community events occur at the park
Park has both active and passive amenities
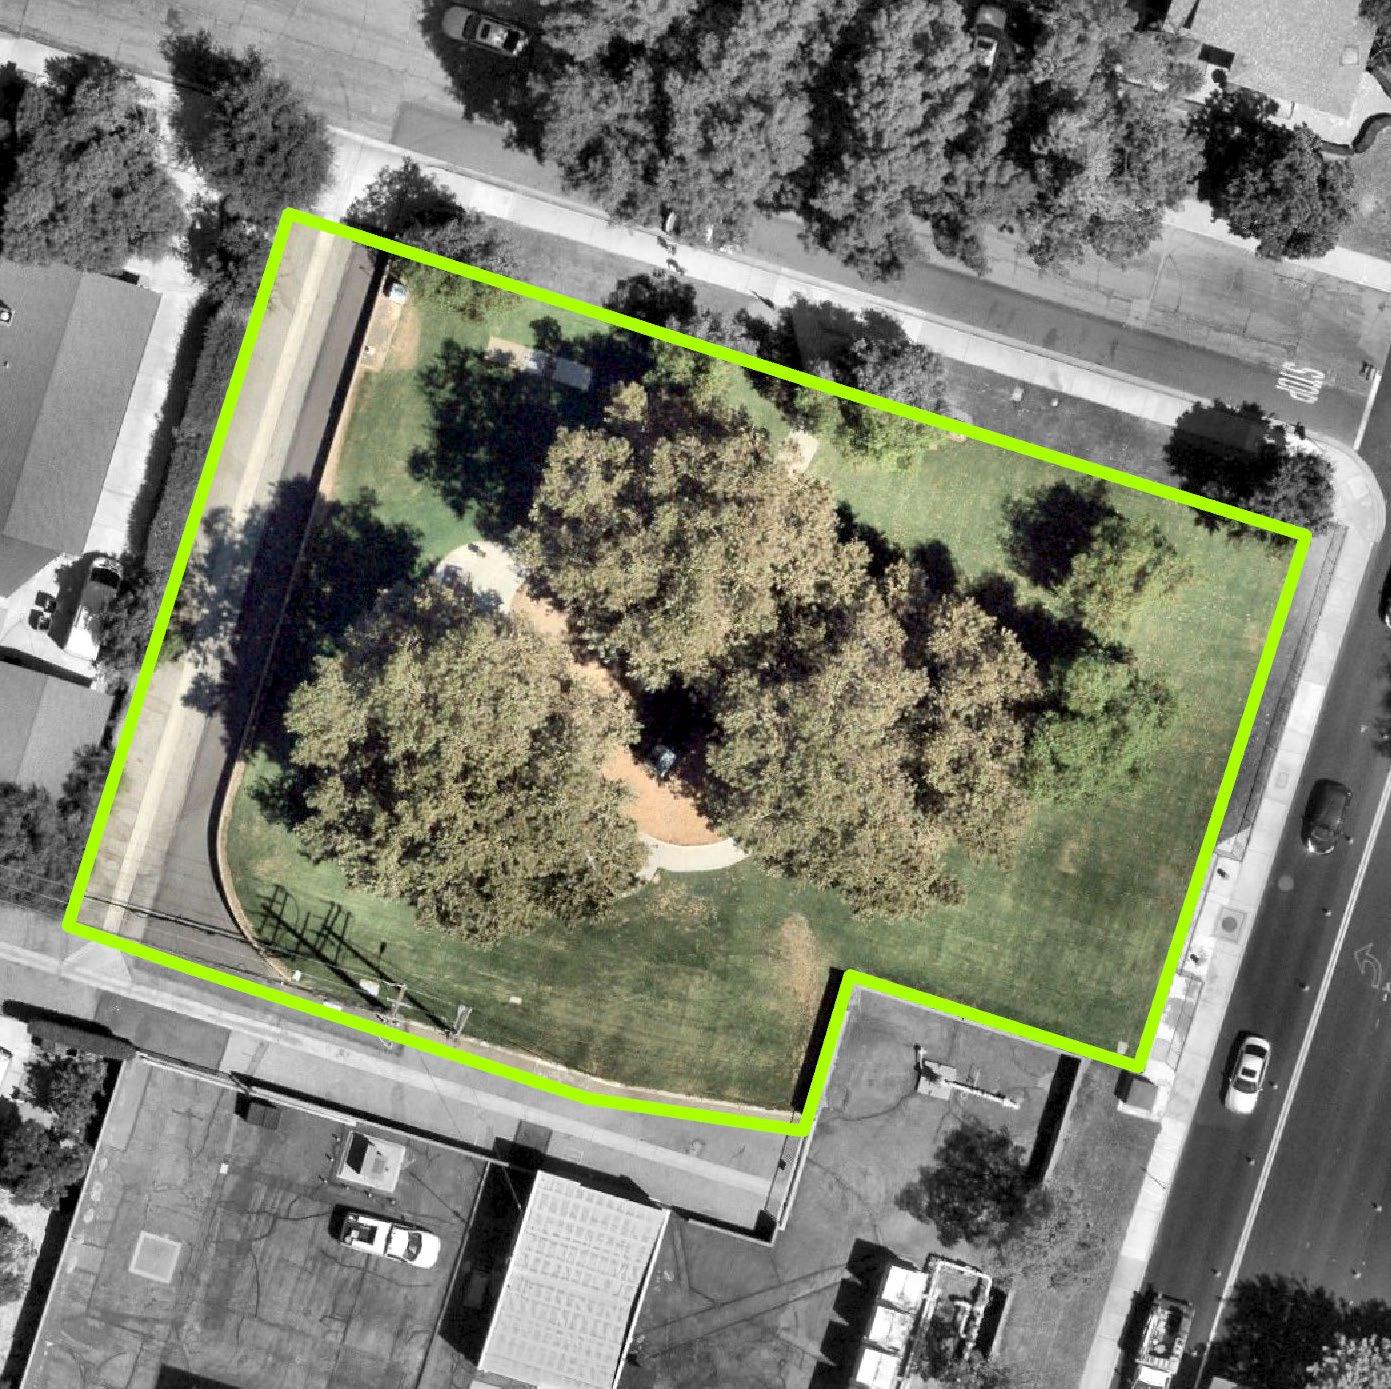
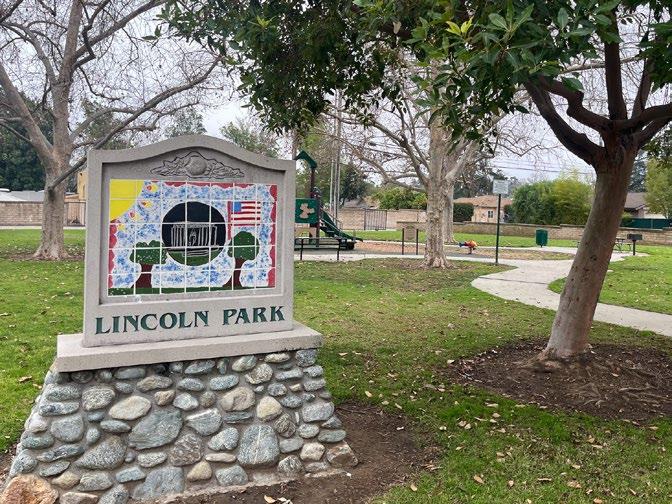
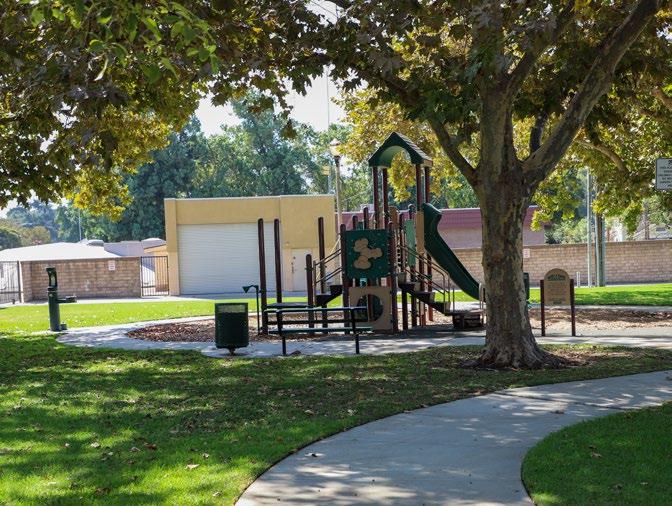
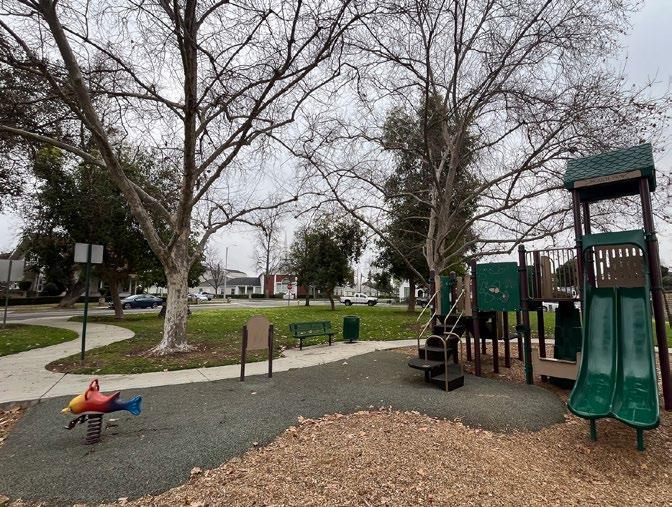
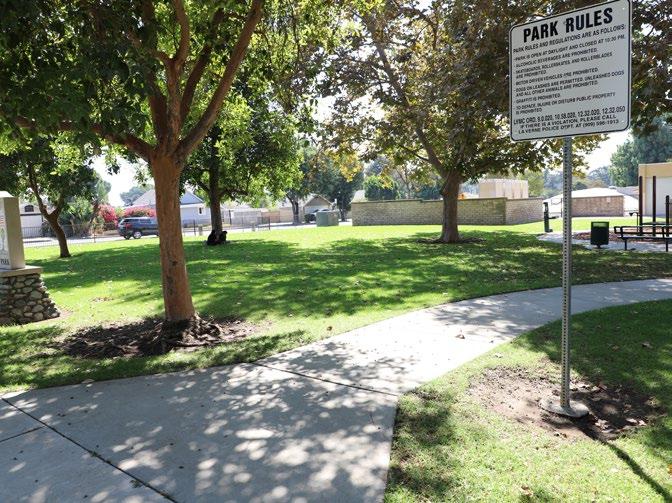
Park Type: Mini Park
Acres: 0.60
Address: 2525 N White Ave
Description: Lincoln Park is a mini park located in the south eastern portion of the city. The park includes a playground for 5-12 year olds and picnic tables.
Amenities:


Based on the overall asset condition assessment score
Park has a full walking loop
Park amenities are accessible by wheelchair or other mobility aid device
Park has a nearby transit stop
Park has multiple access points
Park has entry signage
Park has placemaking elements
Park has adequate lighting for night activities
Park has controlled access
Activation
Park amenities that facilitate social gatherings
Park has City organized programming activities
Community events occur at the park
Park has both active and passive amenities
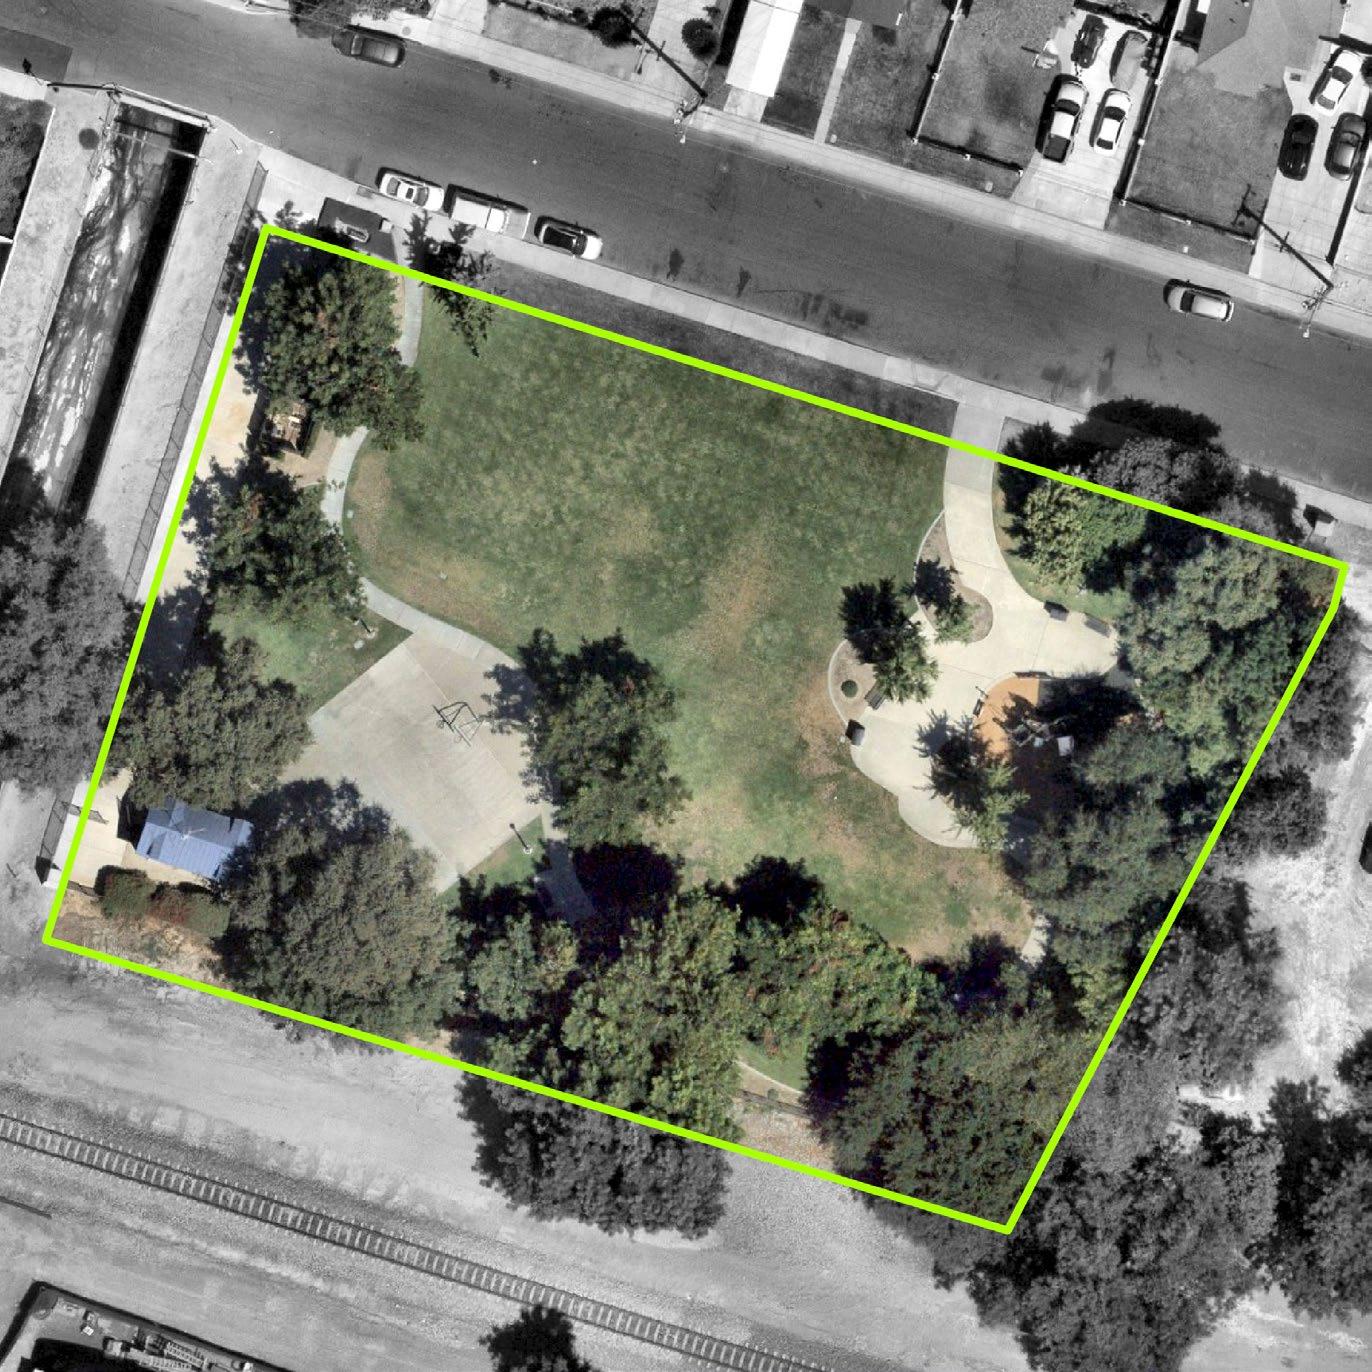
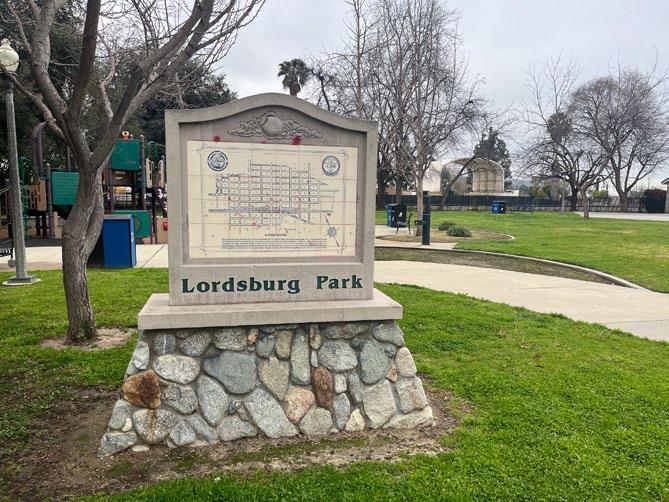
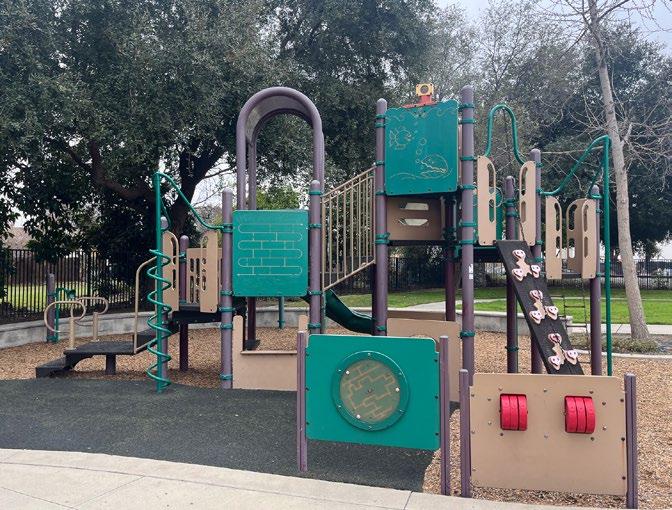
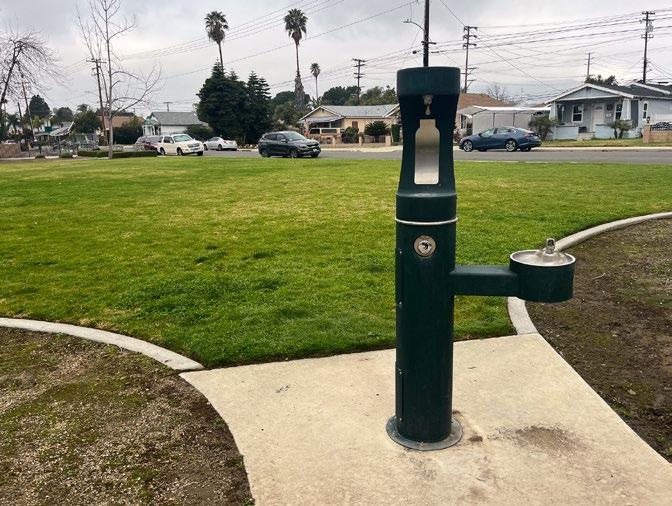
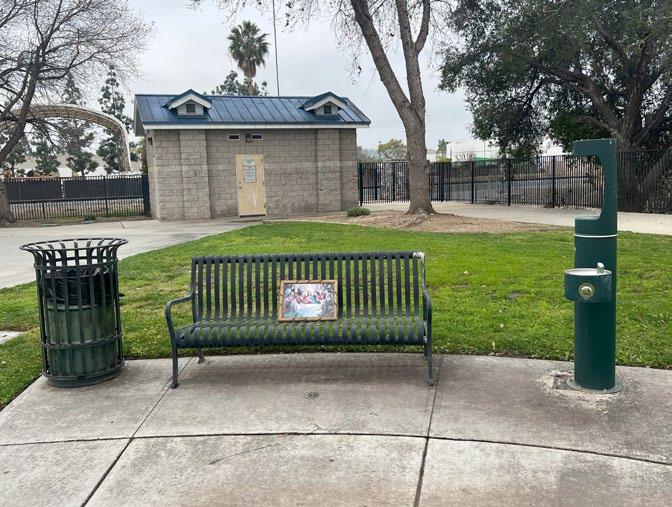
Park Type: Mini Park
Acres: 0.94 acres
Address: 1922 Walnut Street
Description: Lordsburg Park is a mini park located in the southern area of the city, south of La Verne’s downtown. The park includes a playground and a half-court basketball court.
Amenities:


x x B B x x B N/A
Based on the overall asset condition assessment score
Park has a full walking loop
Park amenities are accessible by wheelchair or other mobility aid device
Park has a nearby transit stop
Park has multiple access points
Park has entry signage
Park has placemaking elements
Park has adequate lighting for night activities
Park has controlled access
Park amenities that facilitate social gatherings
Park has City organized programming activities
Community events occur at the park
Park has both active and passive amenities
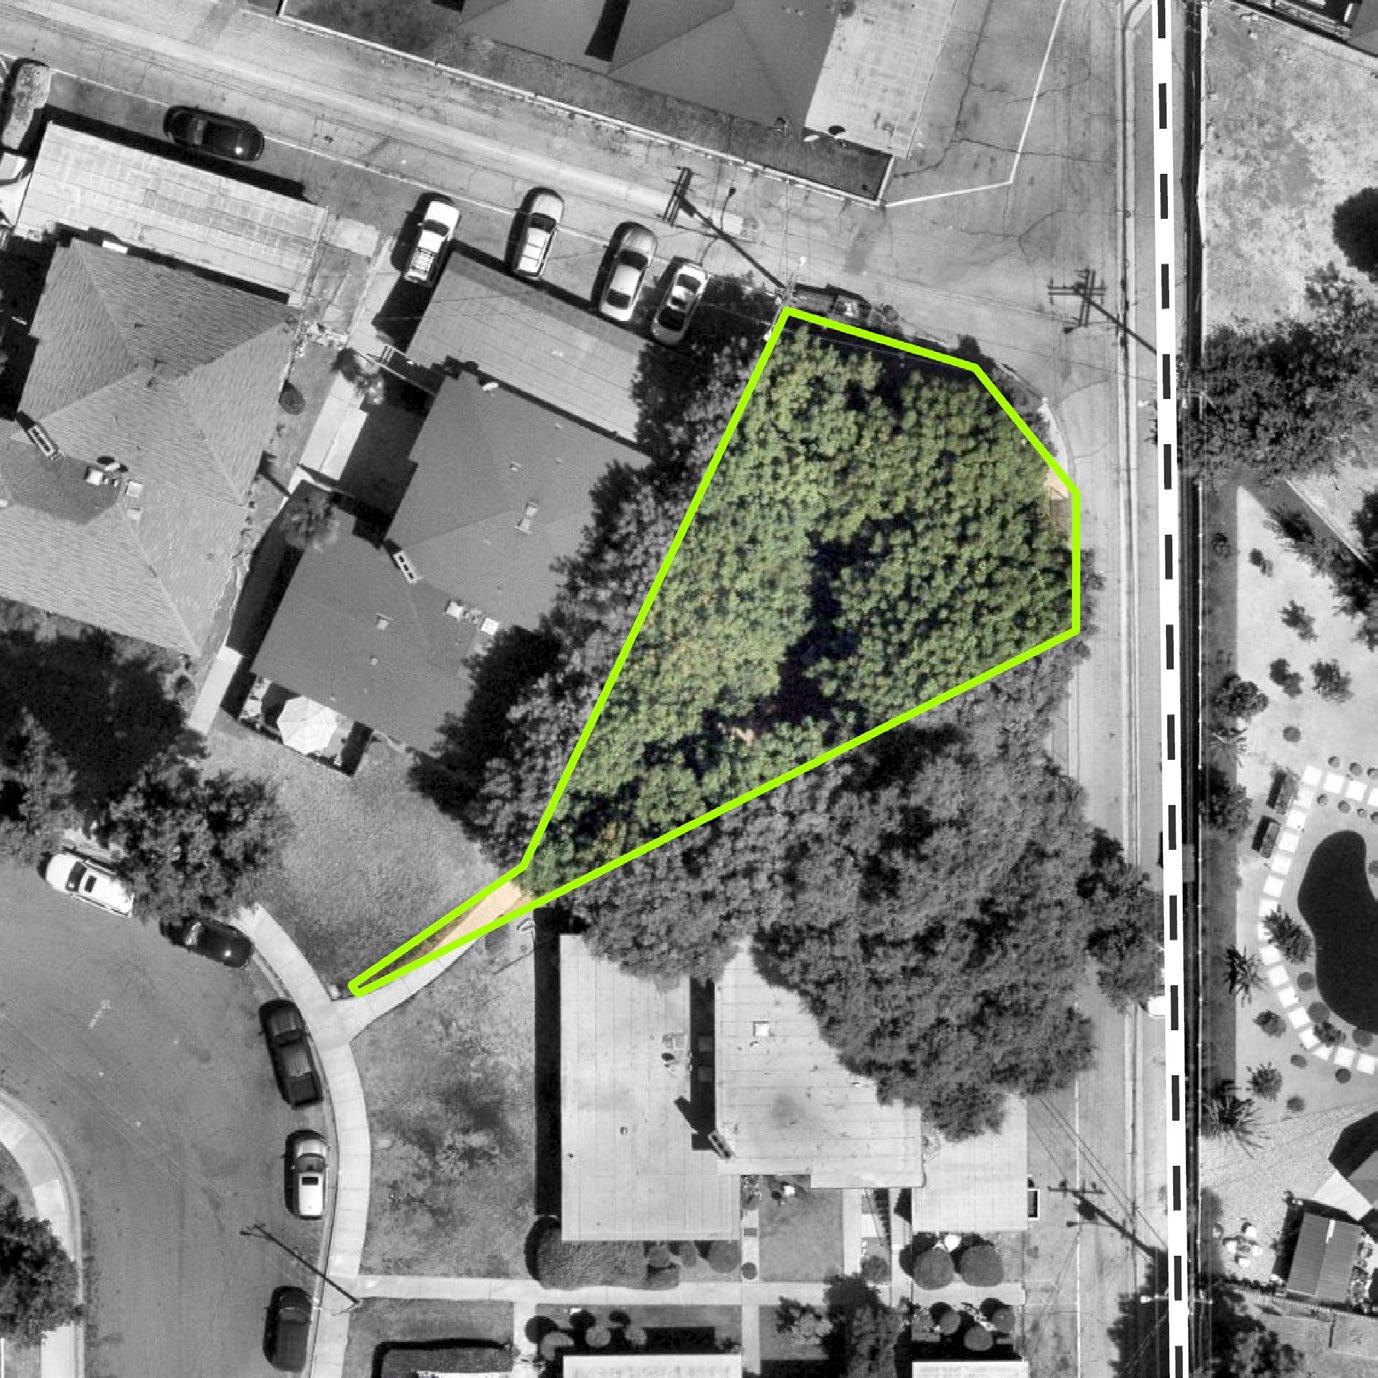
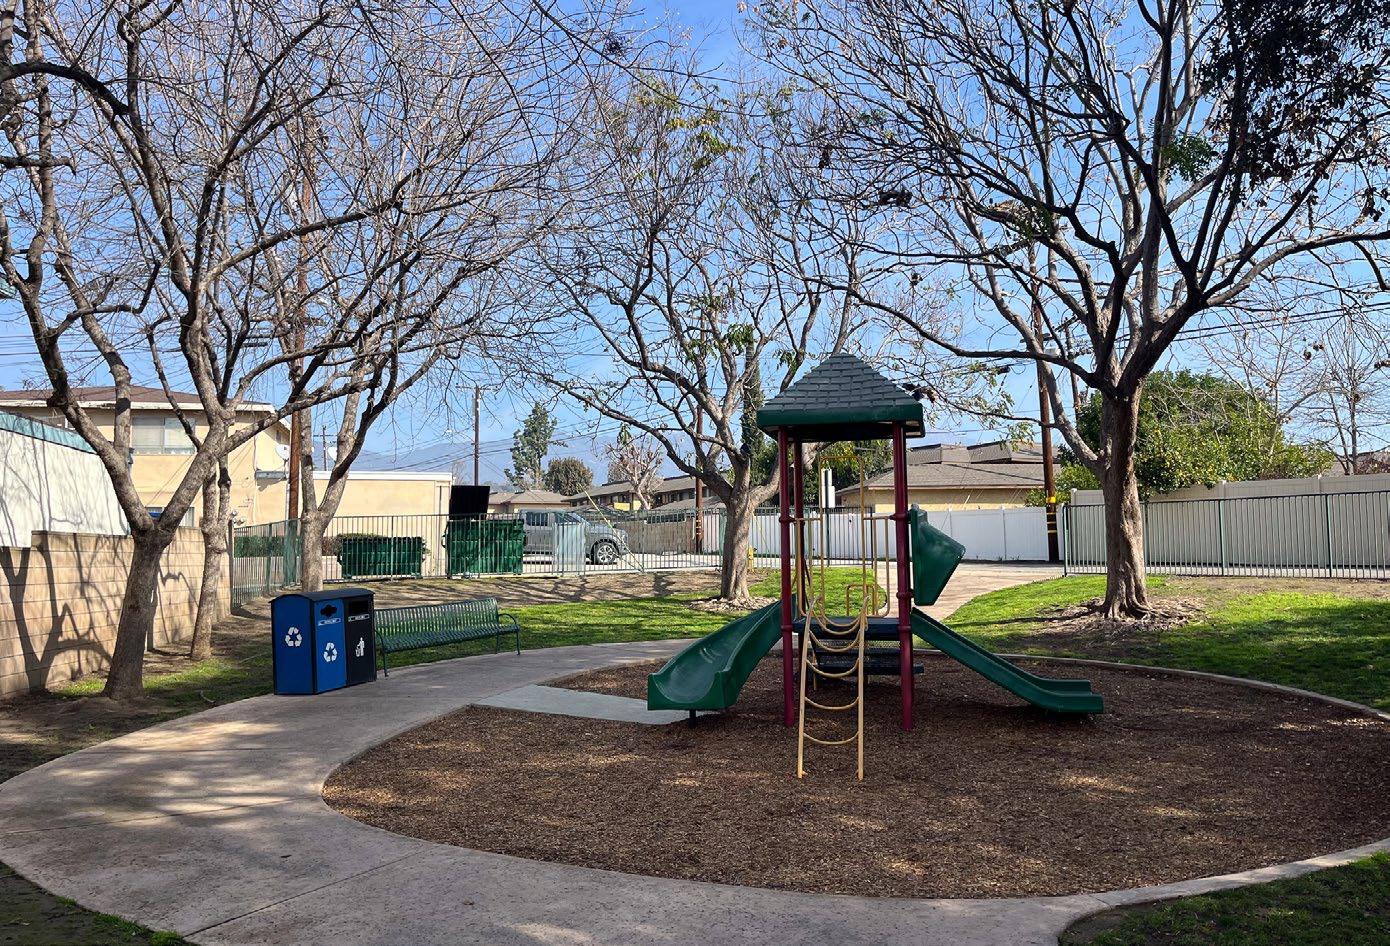
Park Type: Mini Park
Acres: 0.11
Address: Price Drive and Columbia Drive
Description: Price-Hayes Park is a minipark located in a residential neighborhood in central-east La Verne. The park includes a tot-lot.
Amenities:
x B A x x x B N/A
Based on the overall asset condition assessment score
Park has a full walking loop
Park amenities are accessible by wheelchair or other mobility aid device
Park has a nearby transit stop
Park has multiple access points
Park has entry signage
Park has placemaking elements
Park has adequate lighting for night activities
Park has controlled access
Park amenities that facilitate social gatherings
Park has City organized programming activities
Community events occur at the park
Park has both active and passive amenities
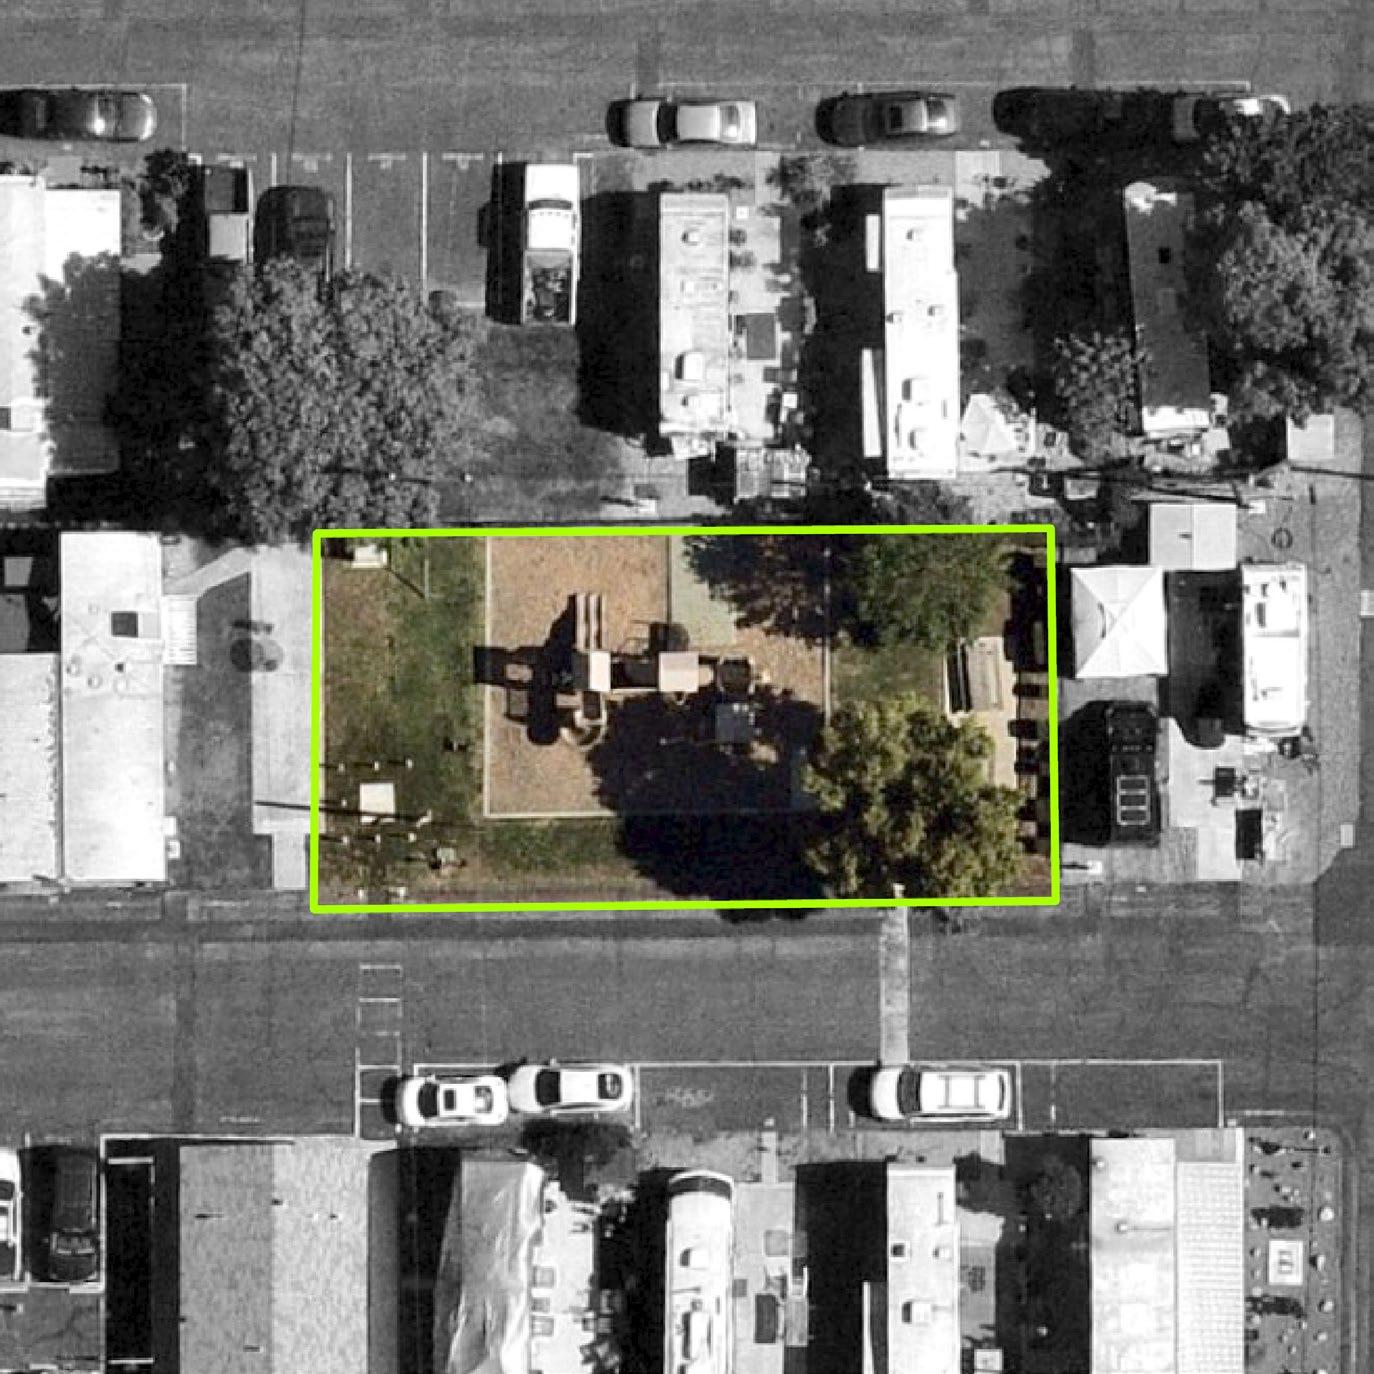
Park Type: Mini Park
Acres: 0.17
Address: 2909 Arrow Highway
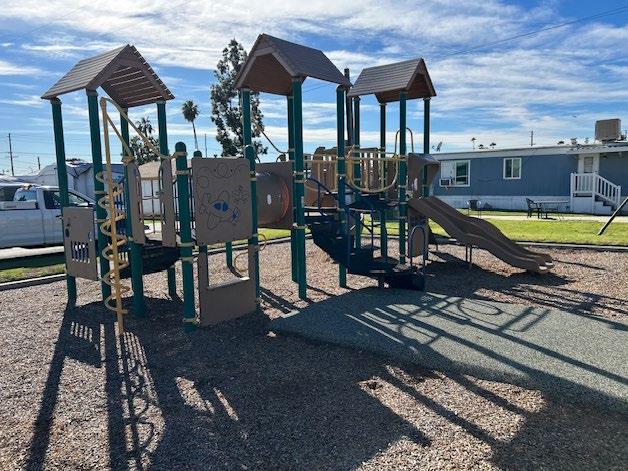
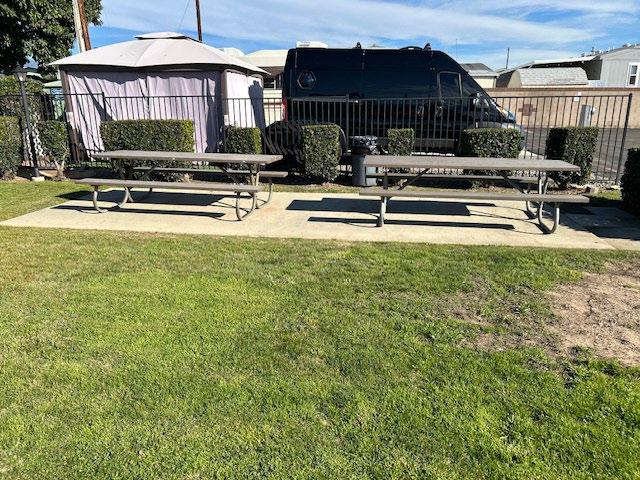
Description: Valley Rancho Park is a mini park located within the Cityowned Valley Rancho Mobile Park. The park includes a tot lot, small grassy area, and picnic tables.
Amenities:
B x N/A
D D
Based on the overall asset condition assessment score
Park has a full walking loop
Park amenities are accessible by wheelchair or other mobility aid device
Park has a nearby transit stop
Park has multiple access points
Park has entry signage
Park has placemaking elements
Park has adequate lighting for night activities
Park has controlled access
Park amenities that facilitate social gatherings
Park has City organized programming activities
Community events occur at the park
Park has both active and passive amenities
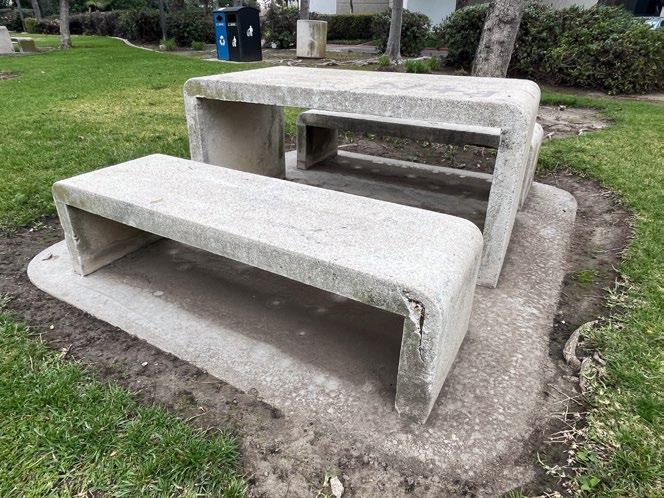
Park Type: Mini Park
Acres: 0.60
Address: 1909 Wright Avenue
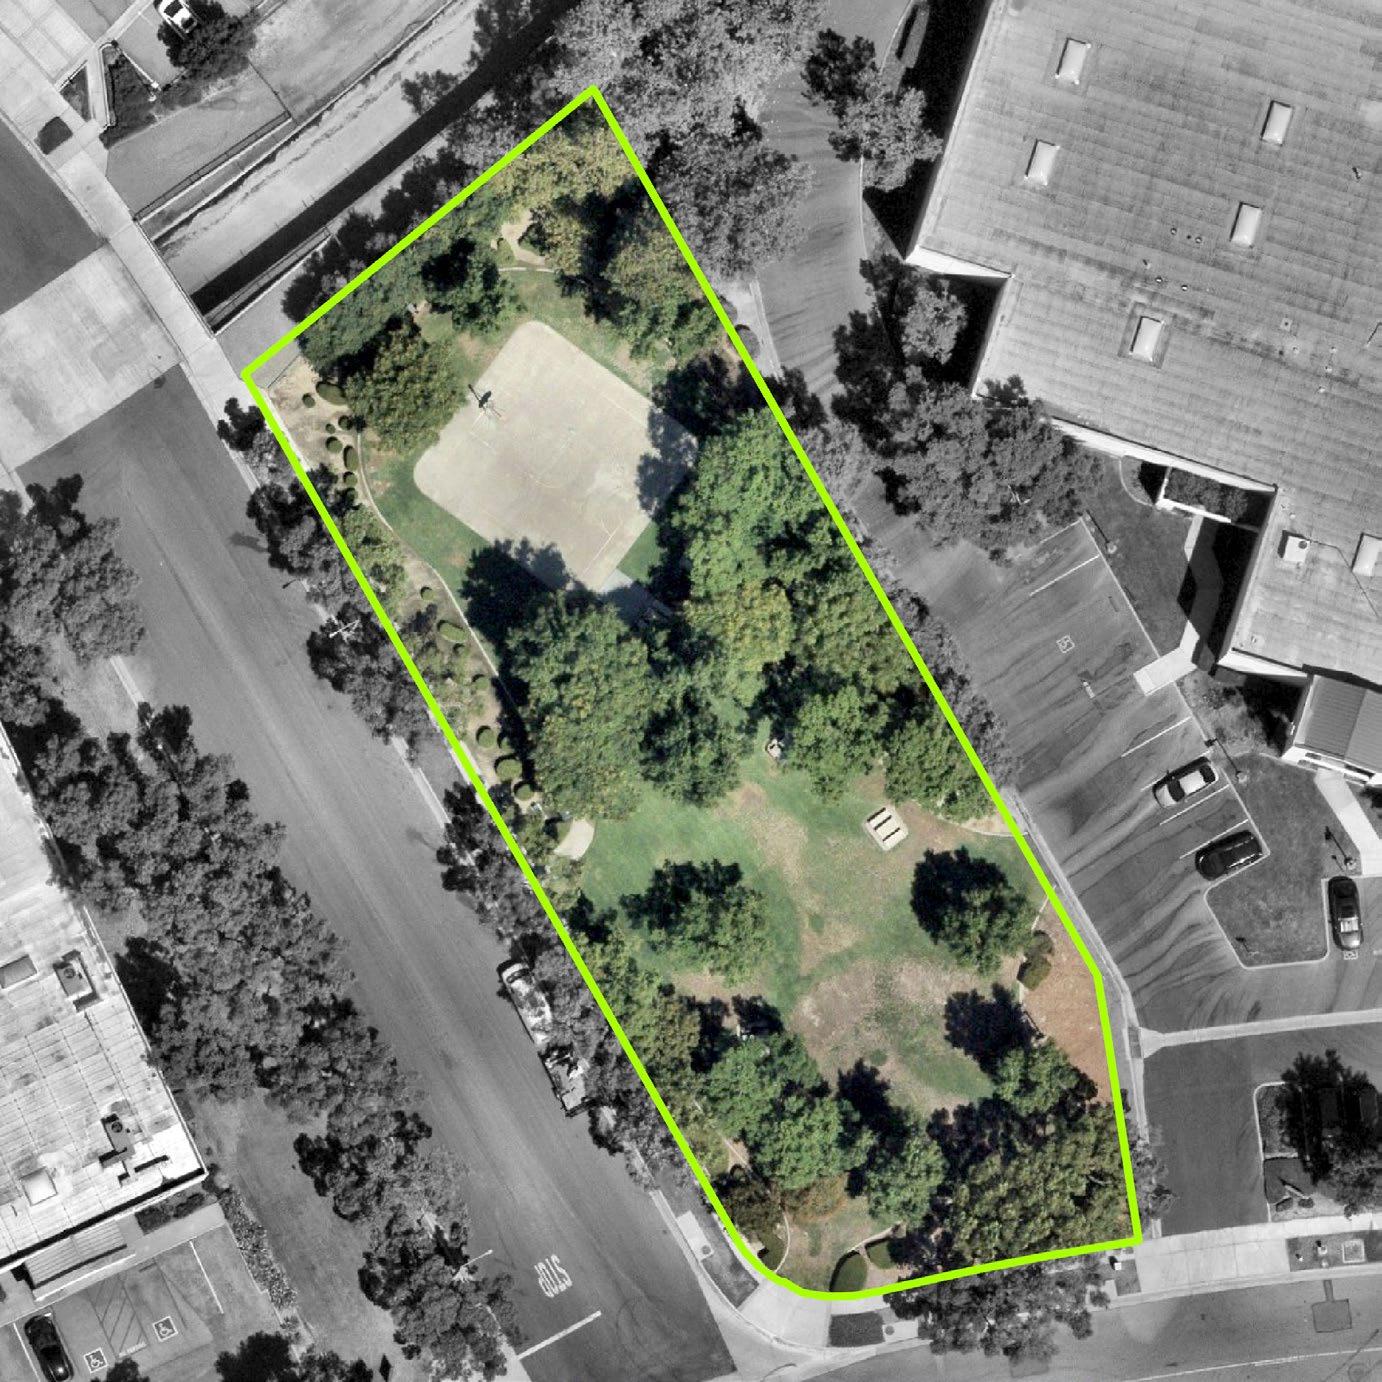
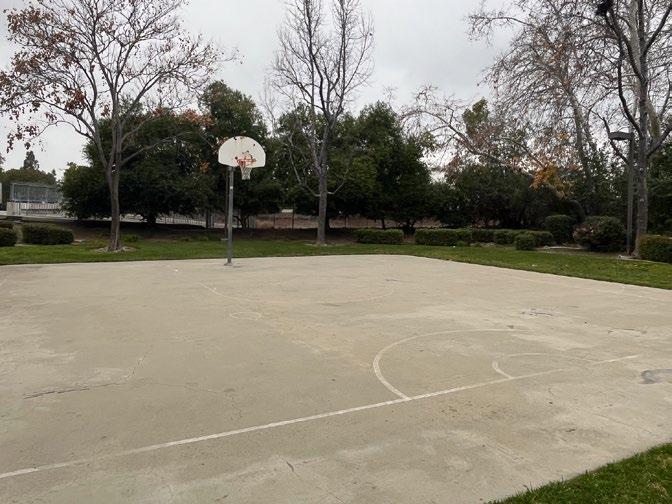
Description: Challenger Park is a minipark located in a the southern area of La Verne. The park includes picnic tables and a half court basketball court.
Amenities:
B x x x x B A N/A
Based on the overall asset condition assessment score
Park has a full walking loop
Park amenities are accessible by wheelchair or other mobility aid device
Park has a nearby transit stop
Park has multiple access points
Park has entry signage
Park has placemaking elements
Park has adequate lighting for night activities
Park has controlled access
Activation
Park amenities that facilitate social gatherings
Park has City organized programming activities
Community events occur at the park
Park has both active and passive amenities
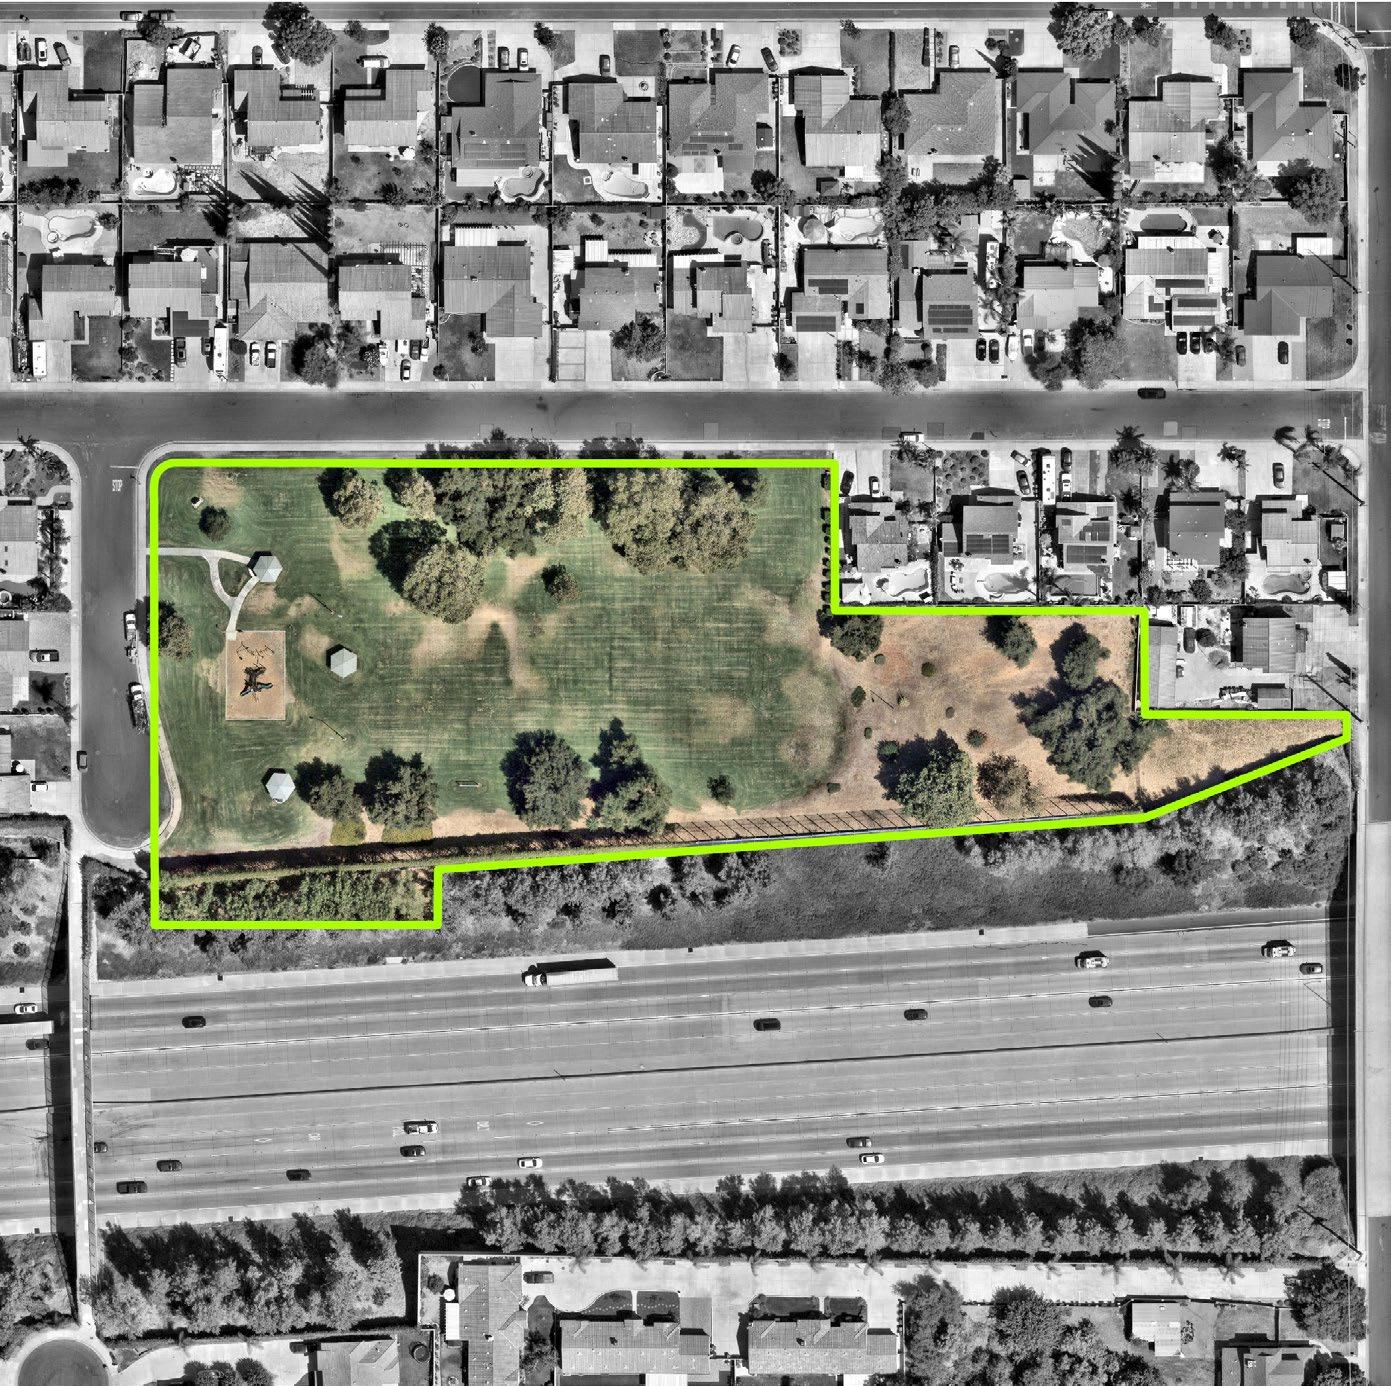

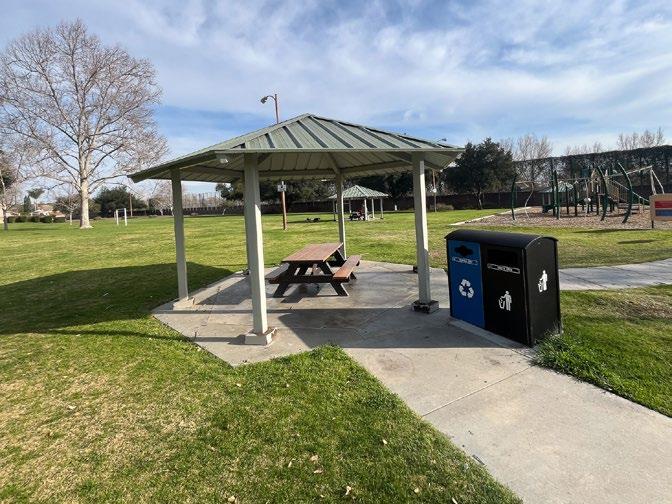
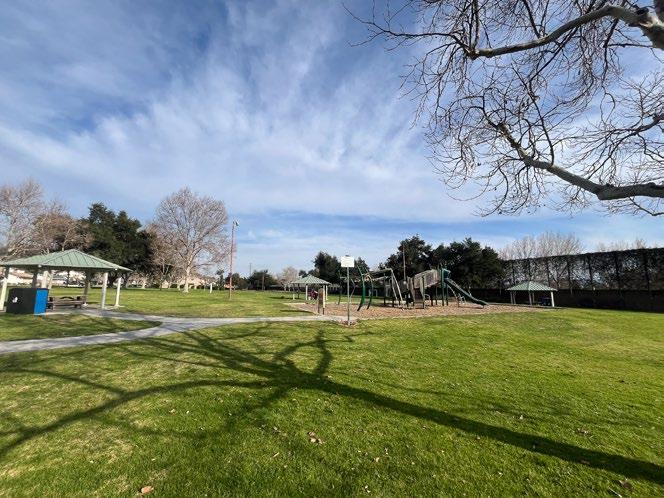
Park Type: Neighborhood Park
Acres: 3.88
Address: 1900 Genesee Avenue
Description: Emerald Park is a neighborhood park located in central La Verne, north of Interstate 210. The park includes covered picnic areas with barbecues, a playground, and an open grassy field for soccer.
Amenities:

D C C
Based on the overall asset condition assessment score
Park has a full walking loop
Park amenities are accessible by wheelchair or other mobility aid device
Park has a nearby transit stop
Park has multiple access points
Park has entry signage
Park has placemaking elements
Park has adequate lighting for night activities
Park has controlled access
Park amenities that facilitate social gatherings
Park has City organized programming activities
Community events occur at the park
Park has both active and passive amenities
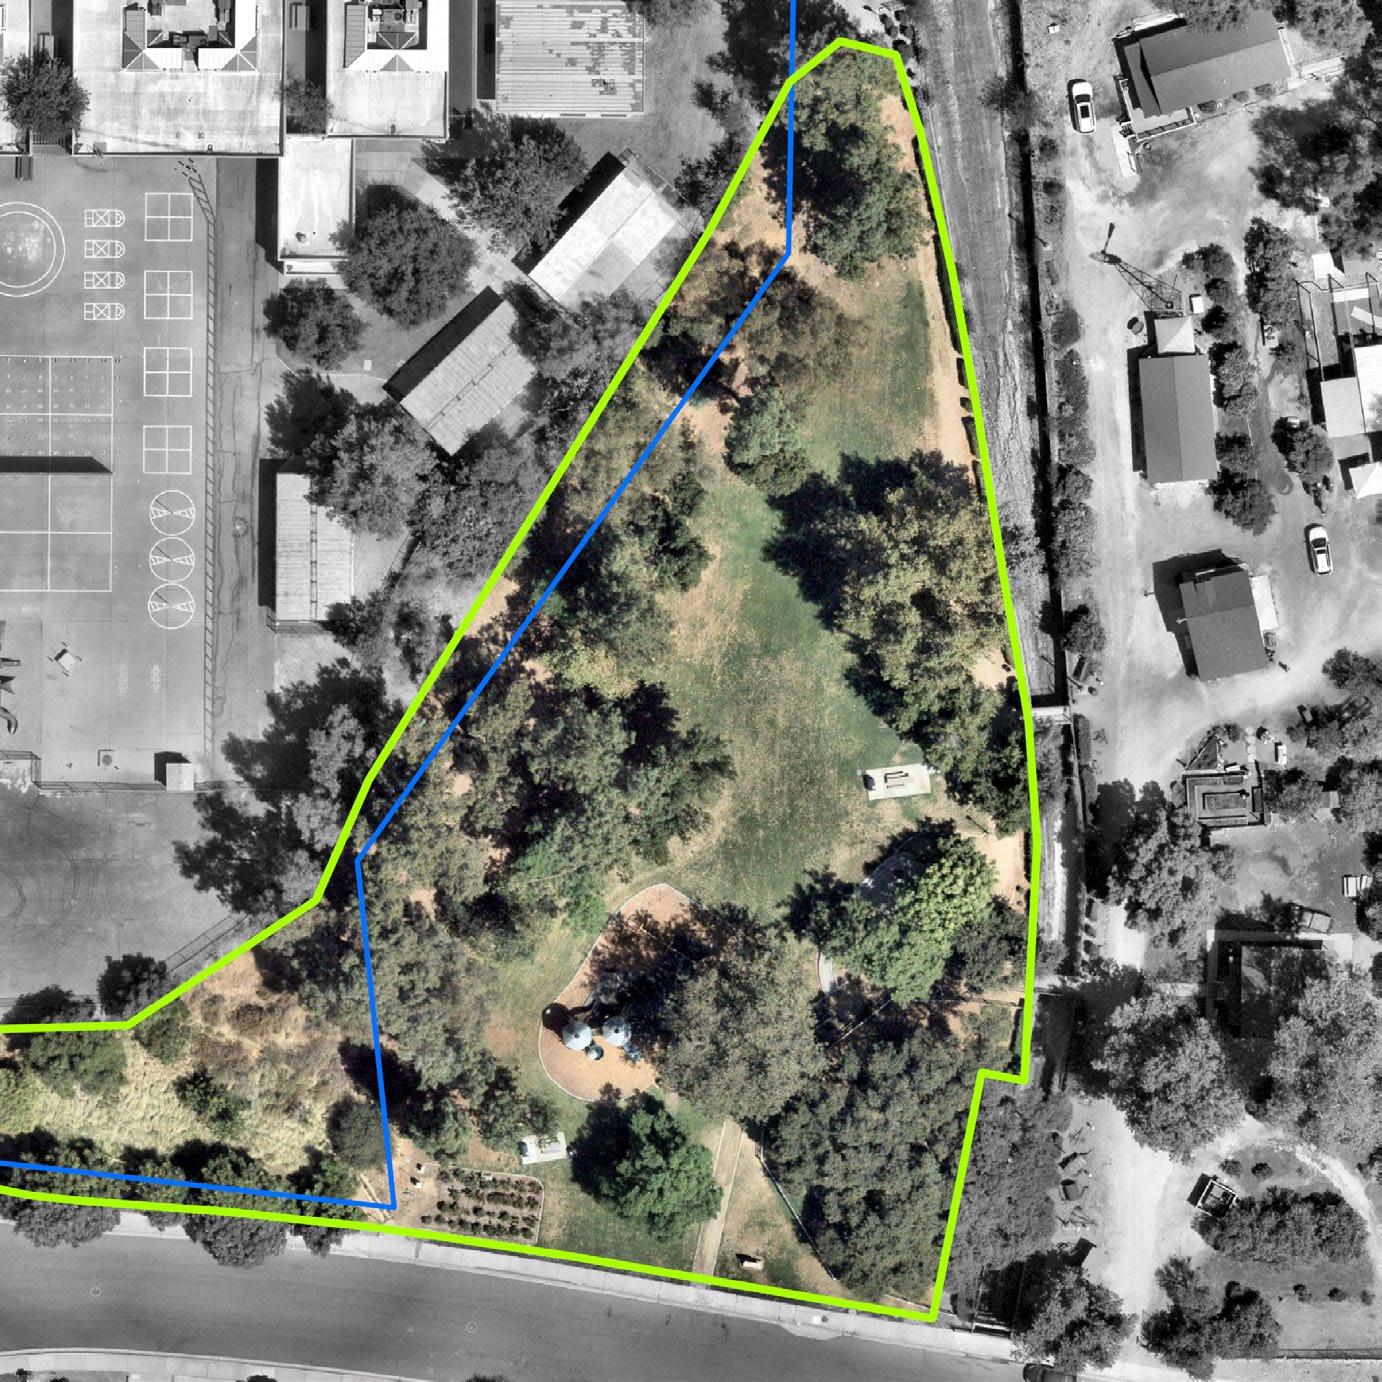
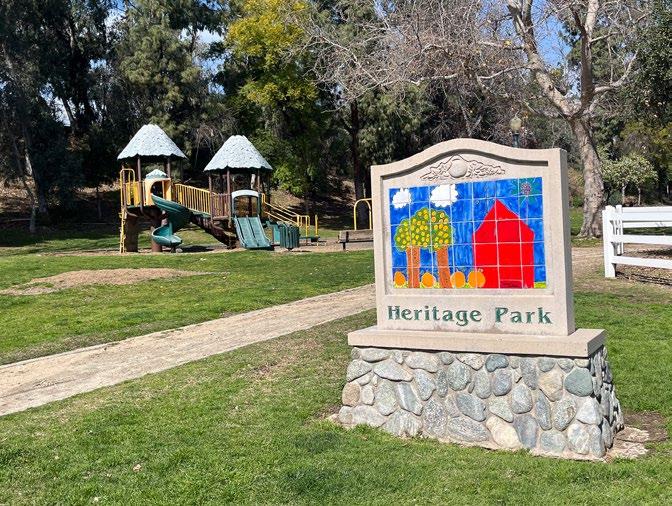
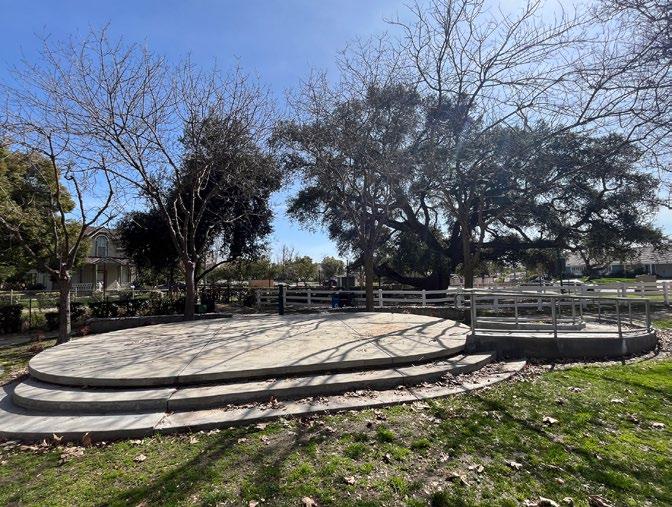
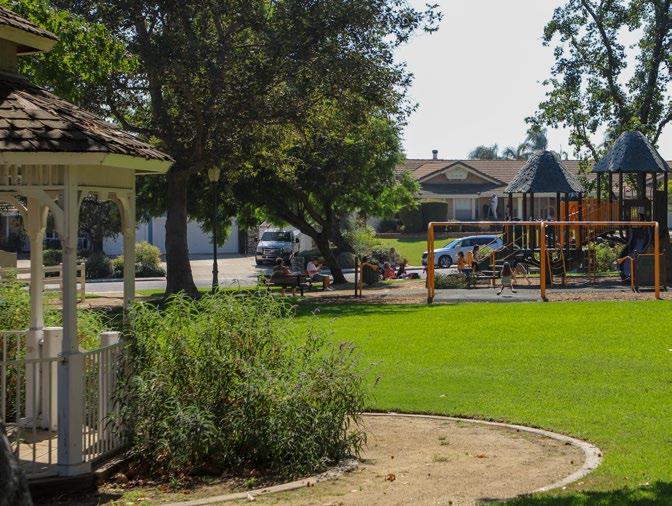
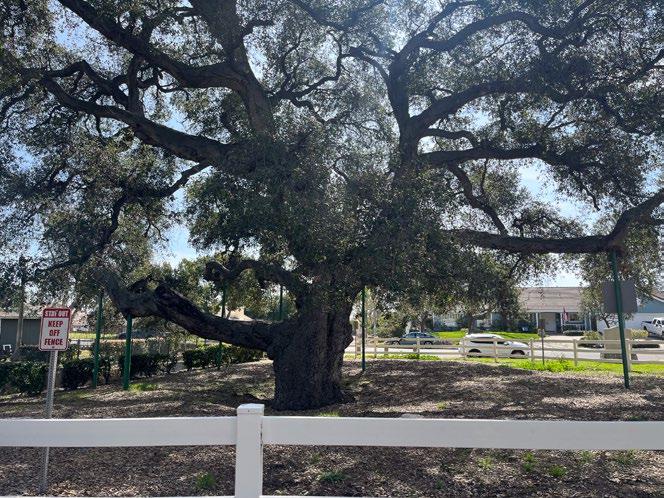
Park Type: Neighborhood Park
Acres: 1.81
Address: 5001 Via De Mansion
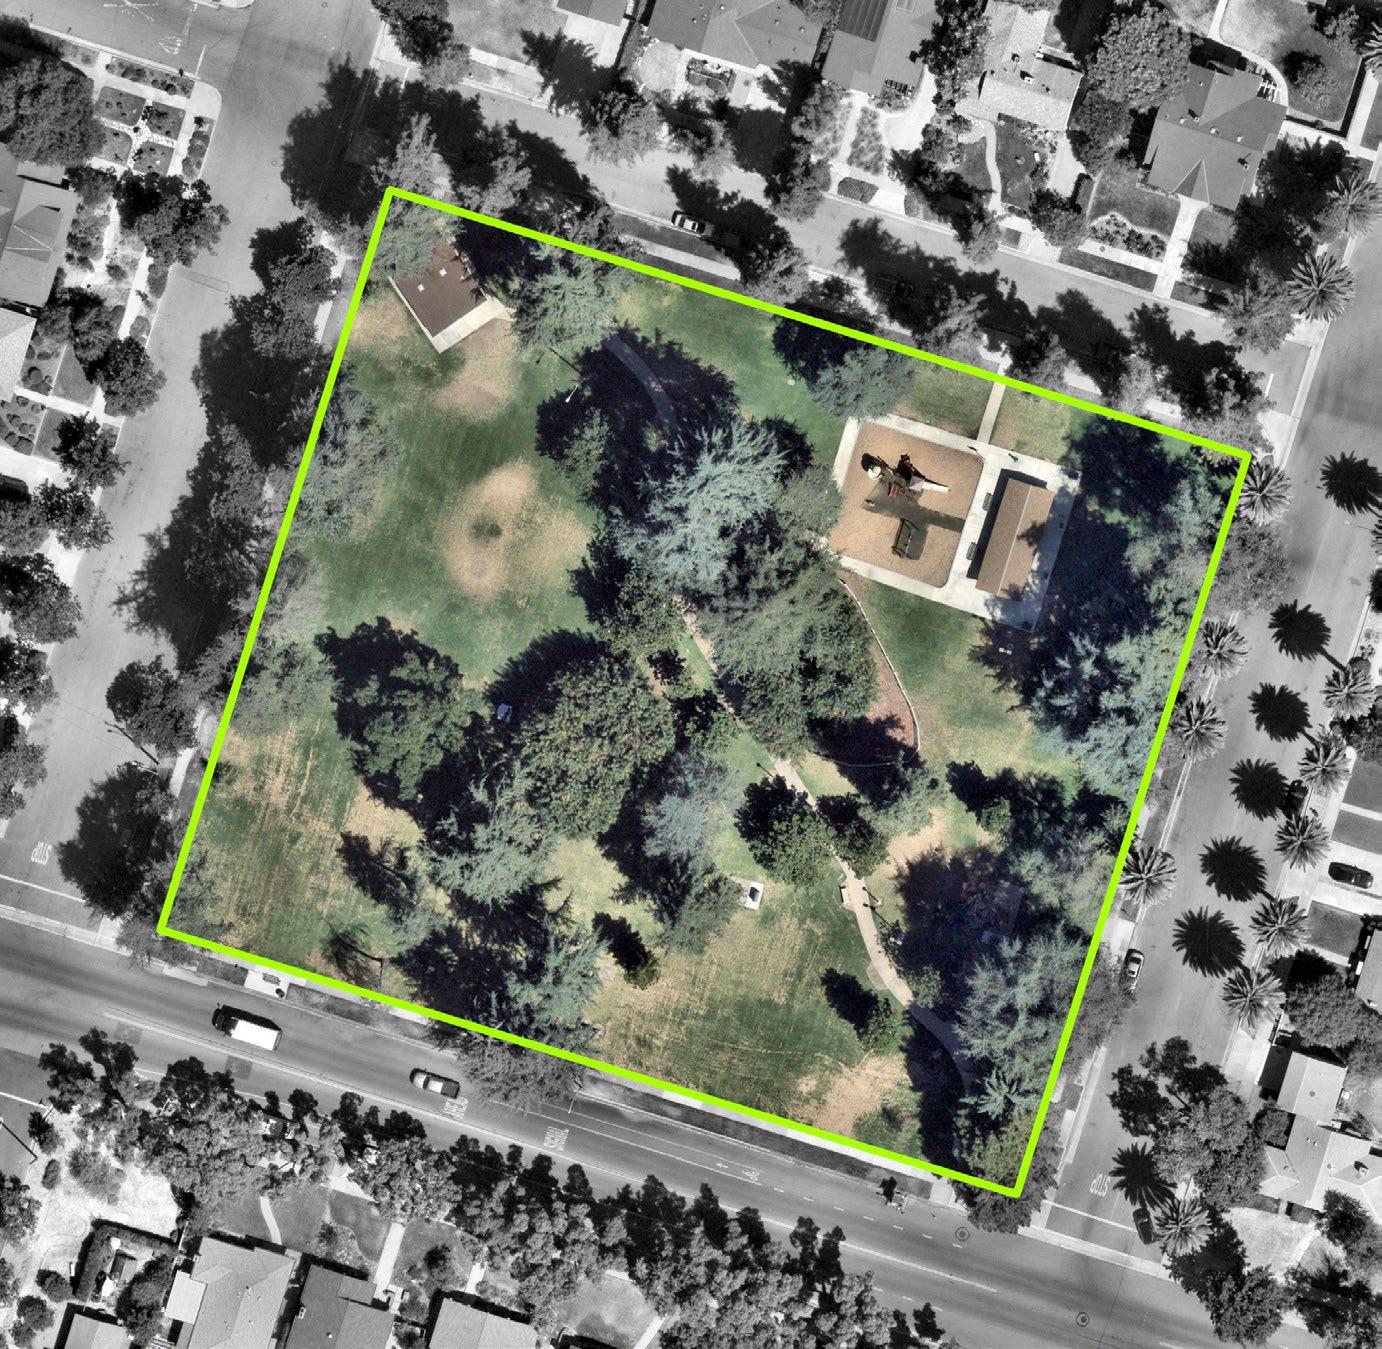
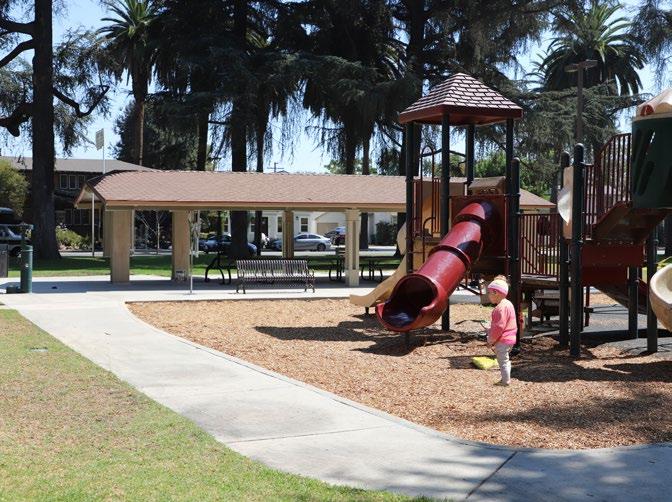
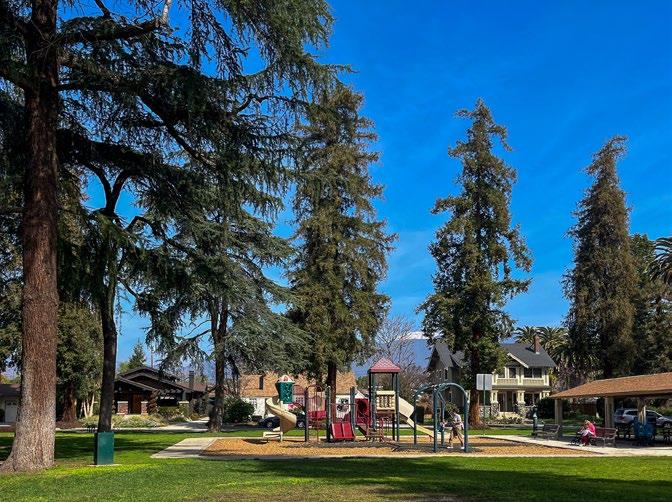
Description: Heritage Park is a neighborhood park located in central La Verne, adjacent to Oak Mesa Elementary School. The park includes picnic tables, a gazebo, an outdoor stage, and a playground.
Amenities:

B
C B A
Based on the overall asset condition assessment score
Park has a full walking loop
Park amenities are accessible by wheelchair or other mobility aid device
Park has a nearby transit stop
Park has multiple access points
Park has entry signage
Park has placemaking elements
Park has adequate lighting for night activities
Park has controlled access
Activation
Park amenities that facilitate social gatherings
Park has City organized programming activities
Community events occur at the park
Park has both active and passive amenities
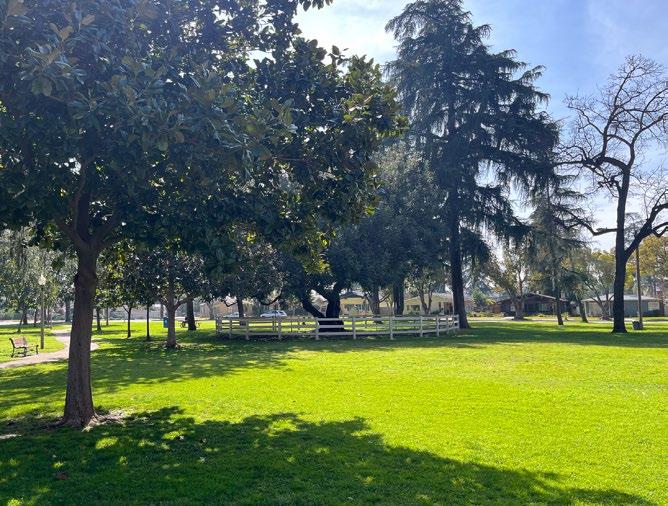
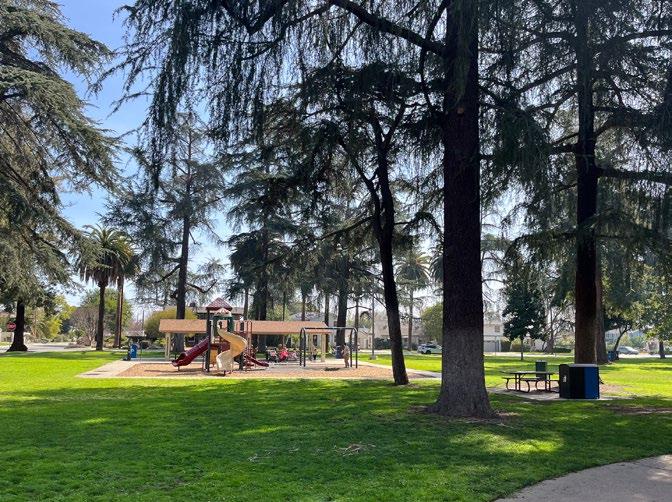
Park Type: Neighborhood Park
Acres: 2.36
Address: 1600 Bonita Avenue
Description: Kuns Park is a neighborhood park located in the southern area of the city, west of La Verne’s downtown area. The park includes a picnic area, picnic tables, restroom facilities, and a playground.
Amenities:

B A A
Based on the overall asset condition assessment score
Park has a full walking loop
Park amenities are accessible by wheelchair or other mobility aid device
Park has a nearby transit stop
Park has multiple access points
Comfort and Identity
Park has entry signage
Park has placemaking elements
Park has adequate lighting for night activities
Park has controlled access
Activation
Park amenities that facilitate social gatherings
Park has City organized programming activities
Community events occur at the park
Park has both active and passive amenities
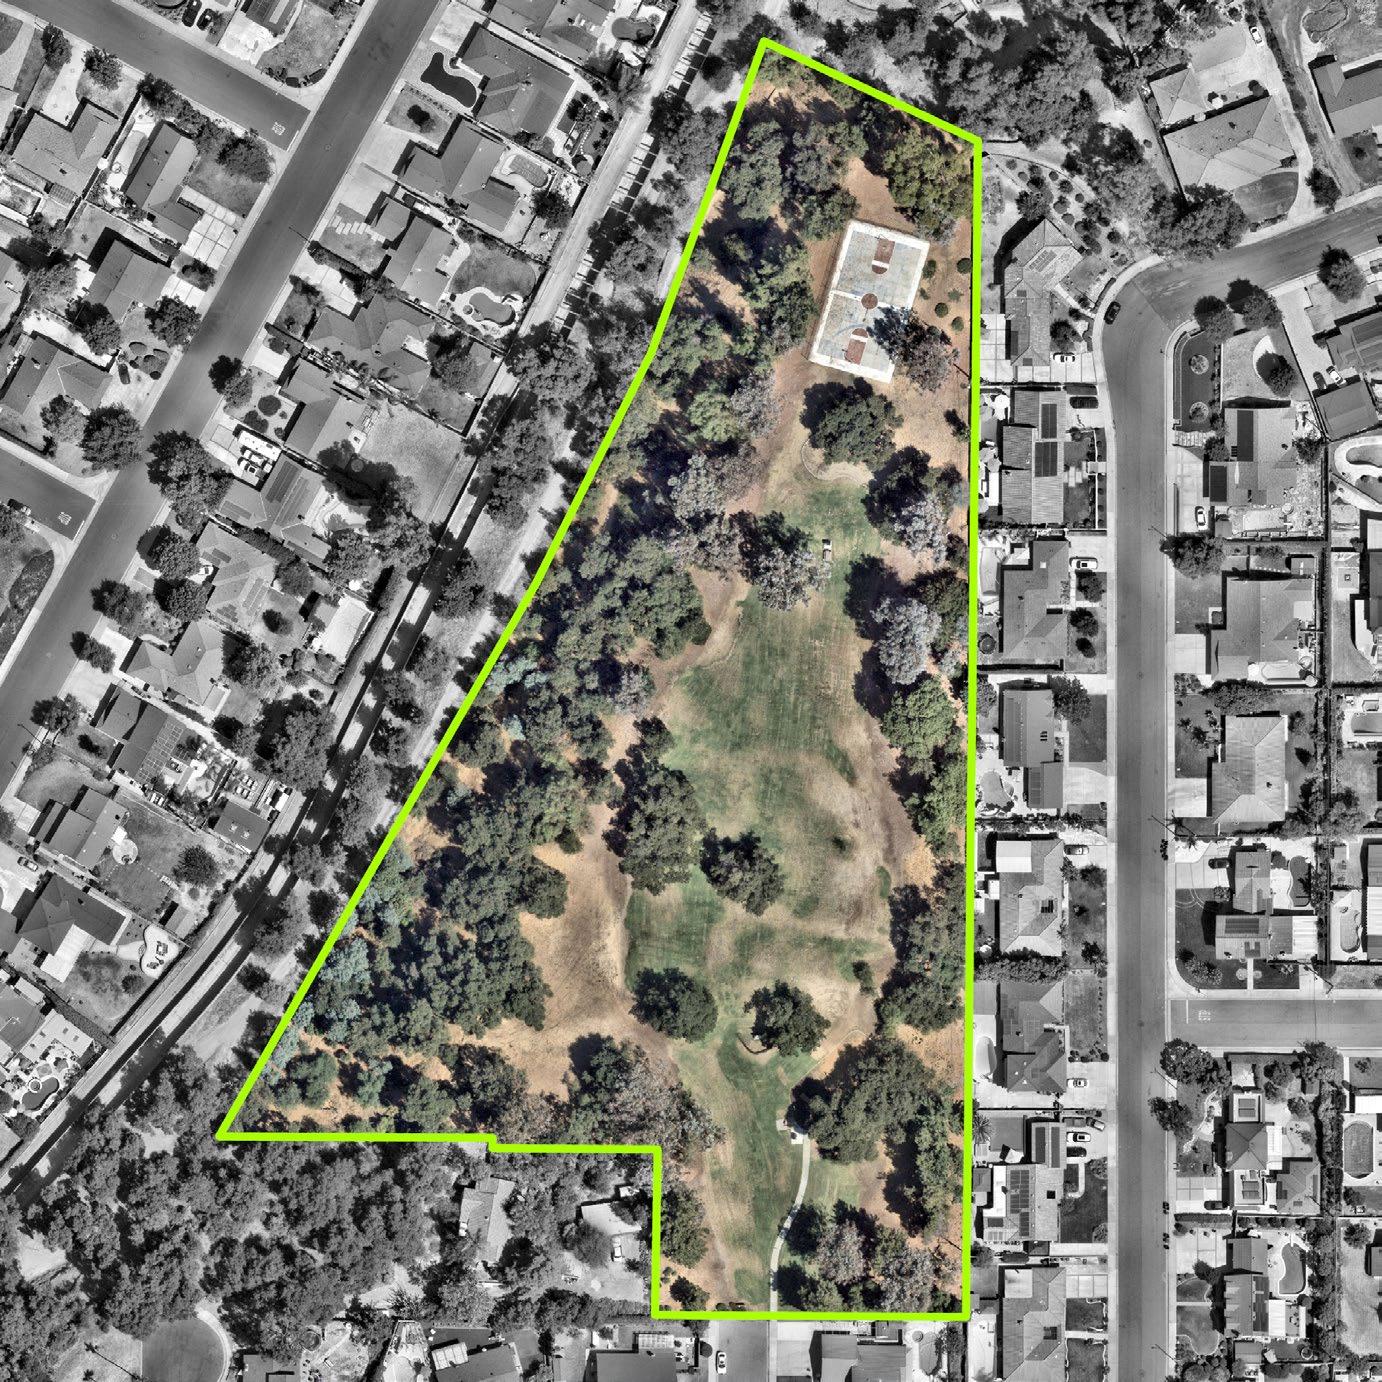
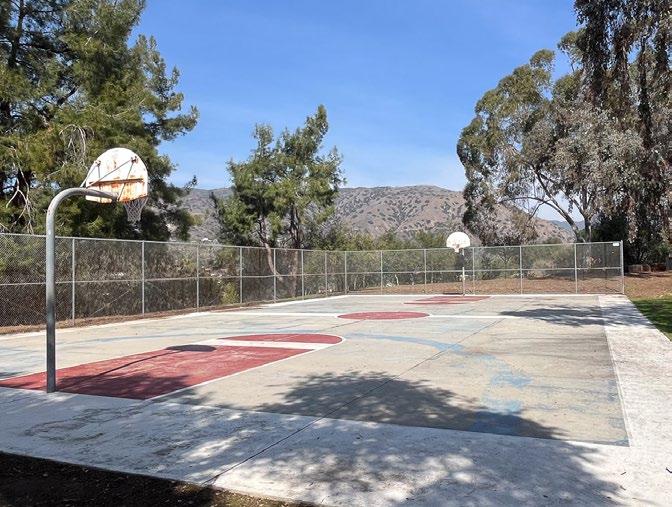
Park Type: Neighborhood Park
Acres: 5.94
Address: 1101 Aldersgate Drive
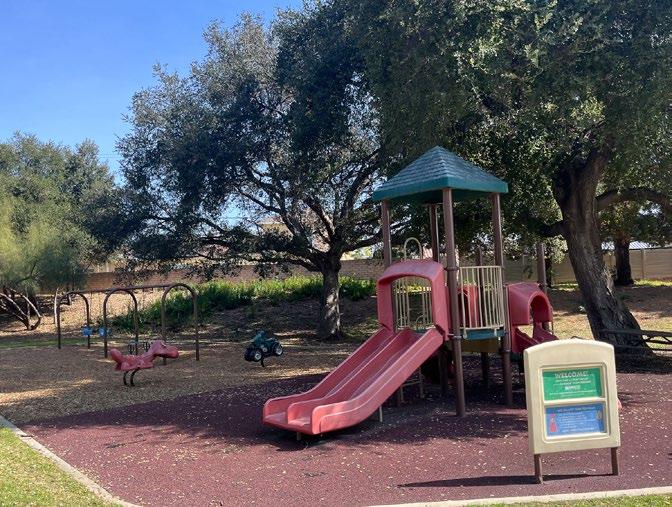
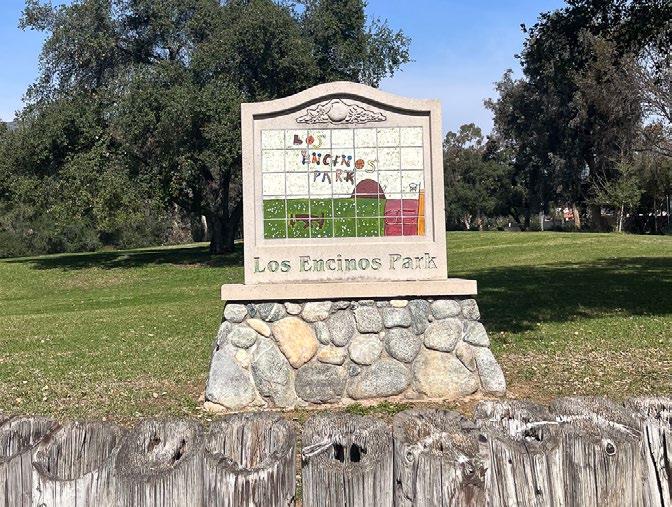
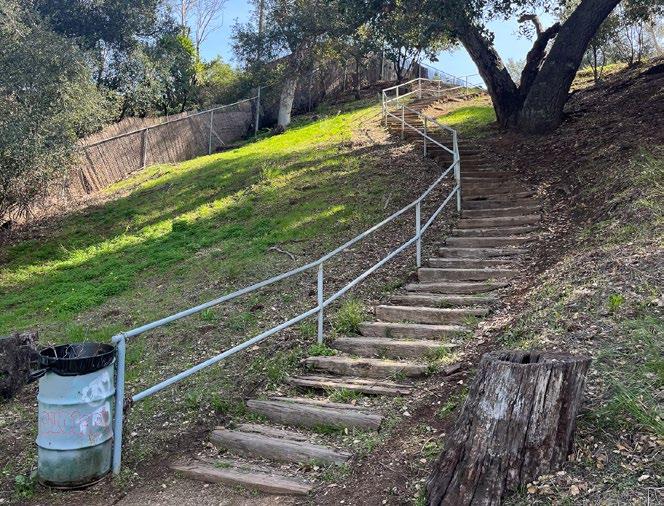
Description: Los Encinos Park is a neighborhood park located in the western area of the city, adjacent to the Puddingstone Channel. The park includes picnic areas, a basketball court, and a playground.
Amenities:
B
C C C
Based on the overall asset condition assessment score
Park has a full walking loop
Park amenities are accessible by wheelchair or other mobility aid device
Park has a nearby transit stop
Park has multiple access points
Park has entry signage
Park has placemaking elements
Park has adequate lighting for night activities
Park has controlled access
Activation
Park amenities that facilitate social gatherings
Park has City organized programming activities
Community events occur at the park
Park has both active and passive amenities


Park Type: Neighborhood Park
Acres: 4.61
Address: 7201 Stephens Ranch Road
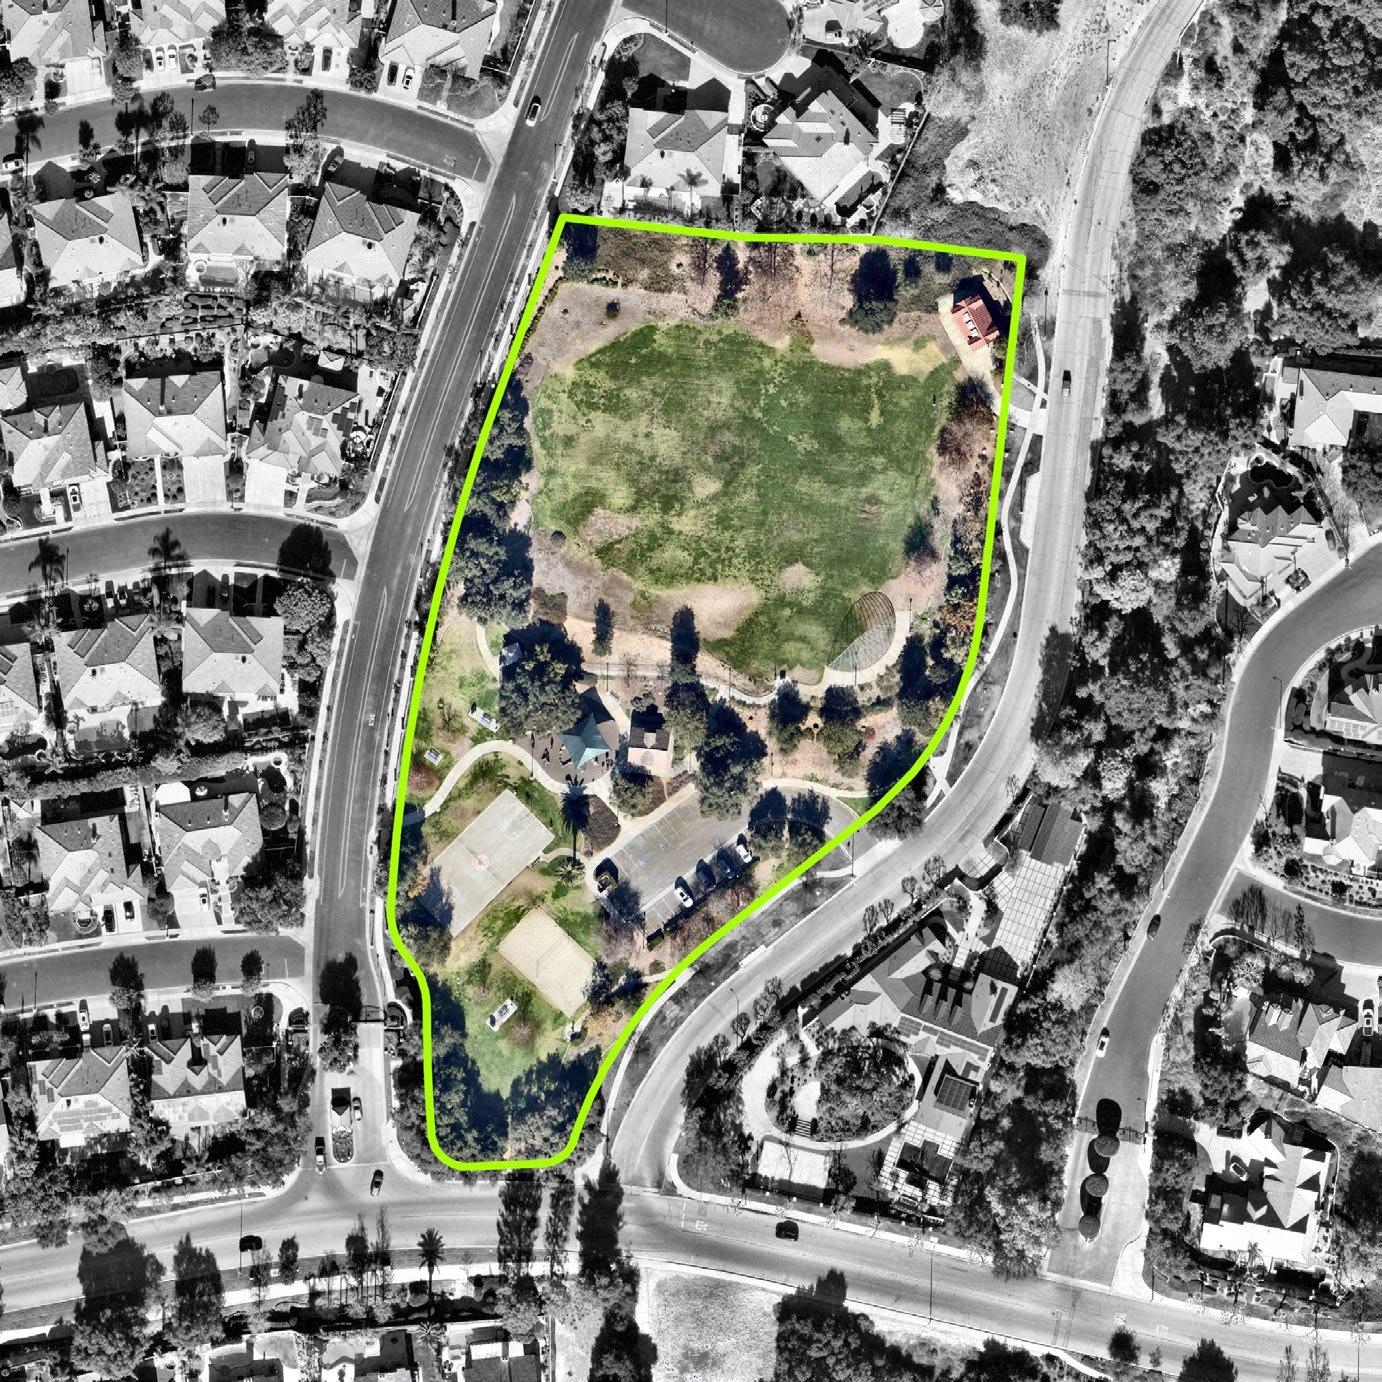
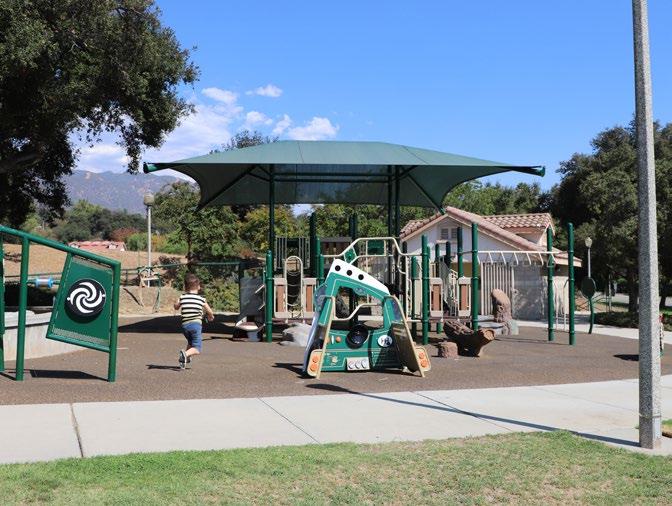
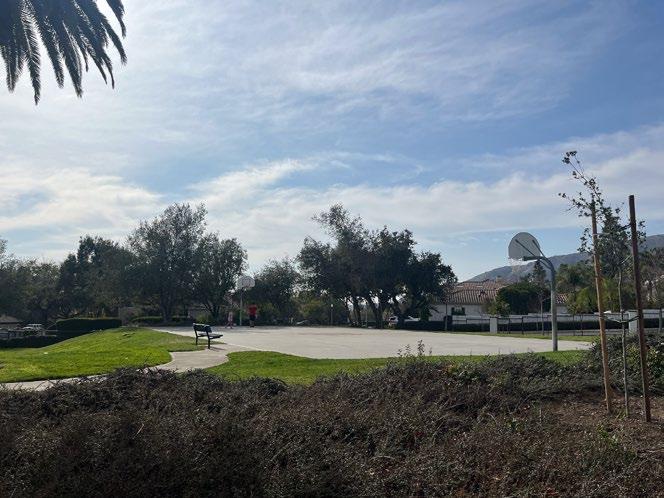
Description: Lowell Brandt Park is a neighborhood park located in the north eastern area of the city. The park includes picnic tables, a sand volleyball court, a soccer field/multi-purpose diamond field, a playground, and restroom facilities.
Based on the overall asset condition assessment score
Park has a full walking loop
Park amenities are accessible by wheelchair or other mobility aid device
Park has a nearby transit stop
Park has multiple access points
Park has entry signage
Park has placemaking elements
Park has adequate lighting for night activities
Park has controlled access
Park amenities that facilitate social gatherings
Park has City organized programming activities
Community events occur at the park
Park has both active and passive amenities
Park Type: Neighborhood Park
Acres: 7.00
Address: 5601 Wheeler Avenue
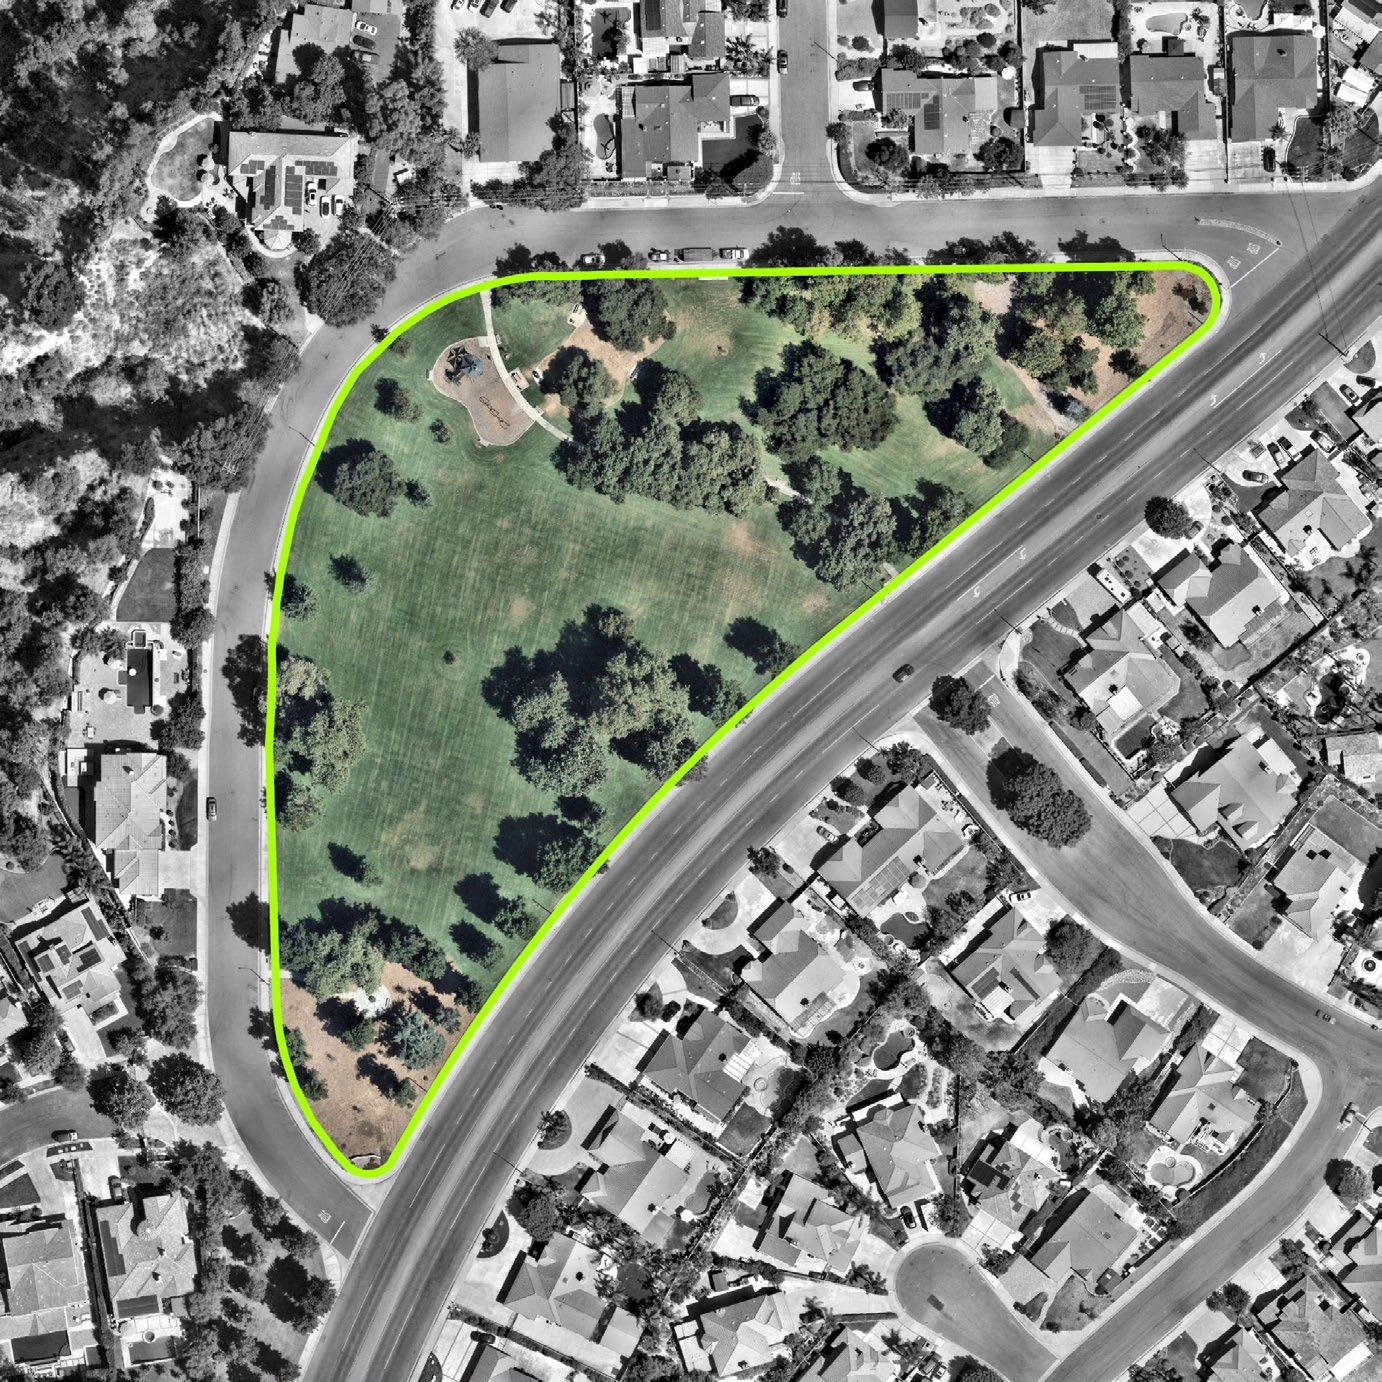
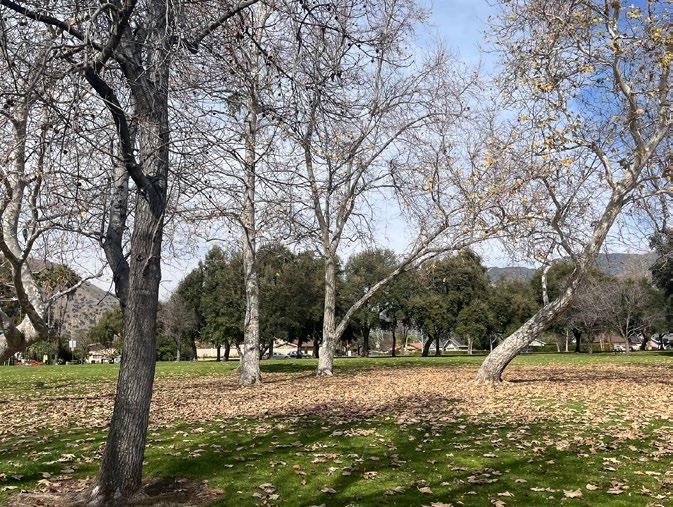
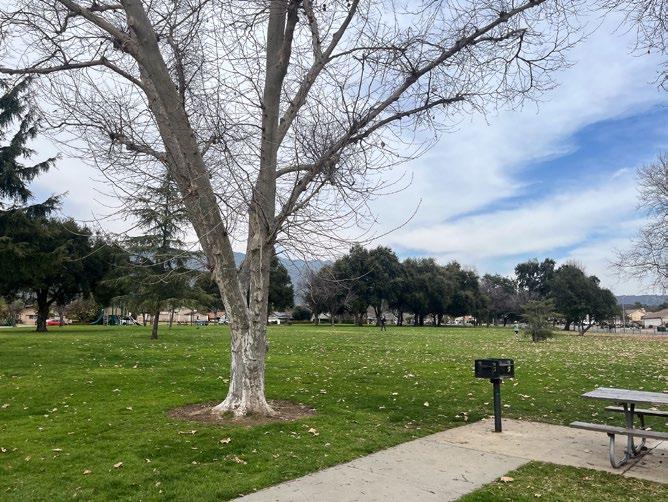
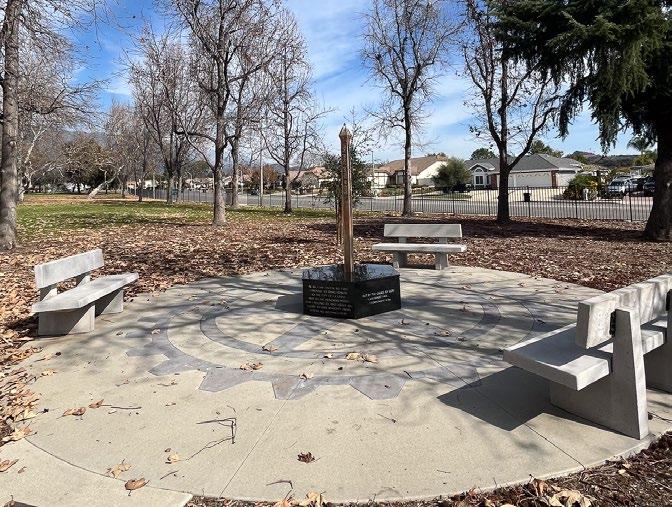
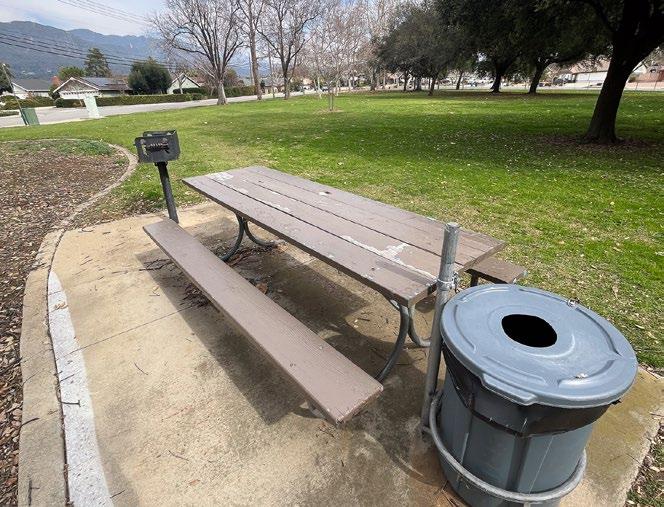
Description: Mills Parks is a neighborhood park located in the north western area of the city. The park includes picnic areas with barbecues, a walking path, an open grassy field, and a playground.
Amenities:
B
B C B
Based on the overall asset condition assessment score
Park has a full walking loop
Park amenities are accessible by wheelchair or other mobility aid device
Park has a nearby transit stop
Park has multiple access points
Park has entry signage
Park has placemaking elements
Park has adequate lighting for night activities
Park has controlled access
Activation
Park amenities that facilitate social gatherings
Park has City organized programming activities
Community events occur at the park
Park has both active and passive amenities
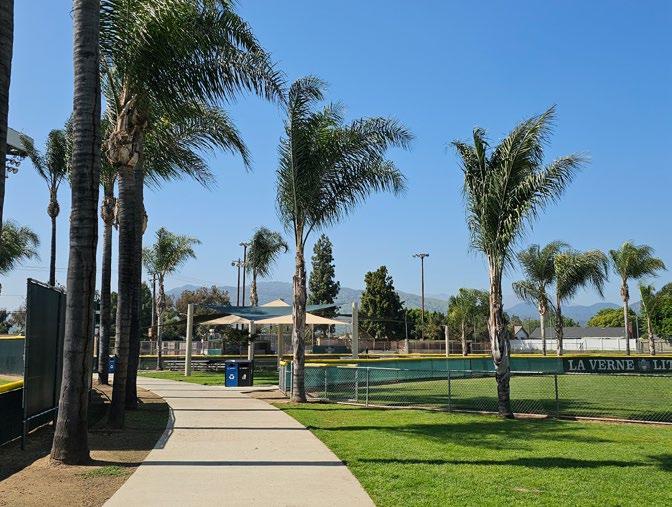
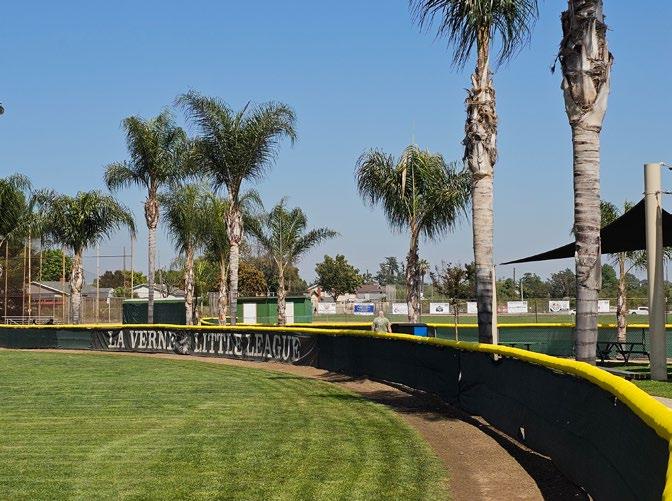
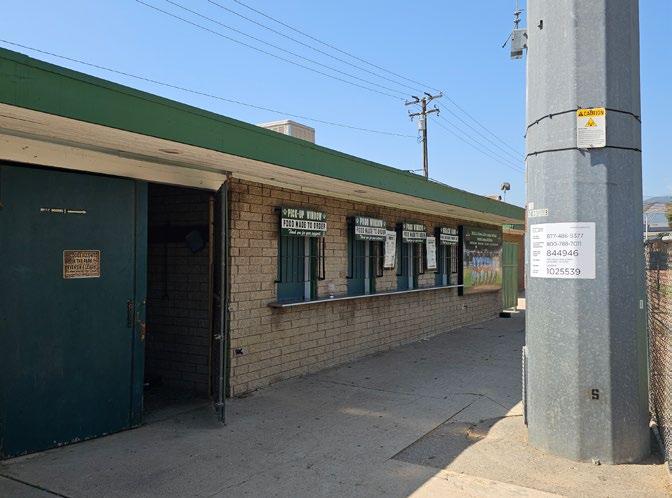
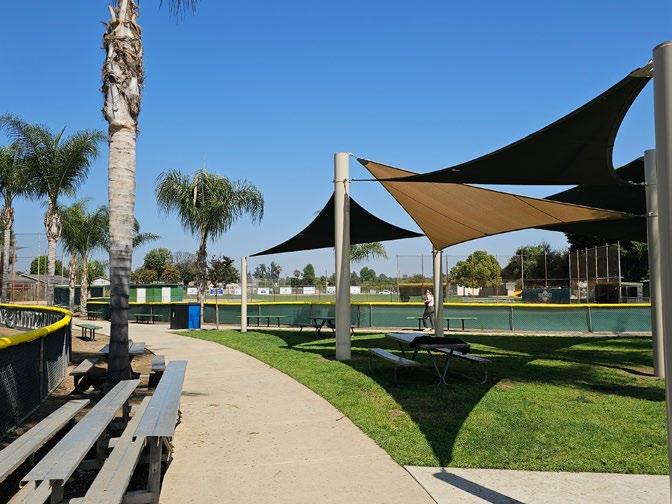
Park Type: Community Park
Acres: 8.08
Address: 1505 Holly Oak Street
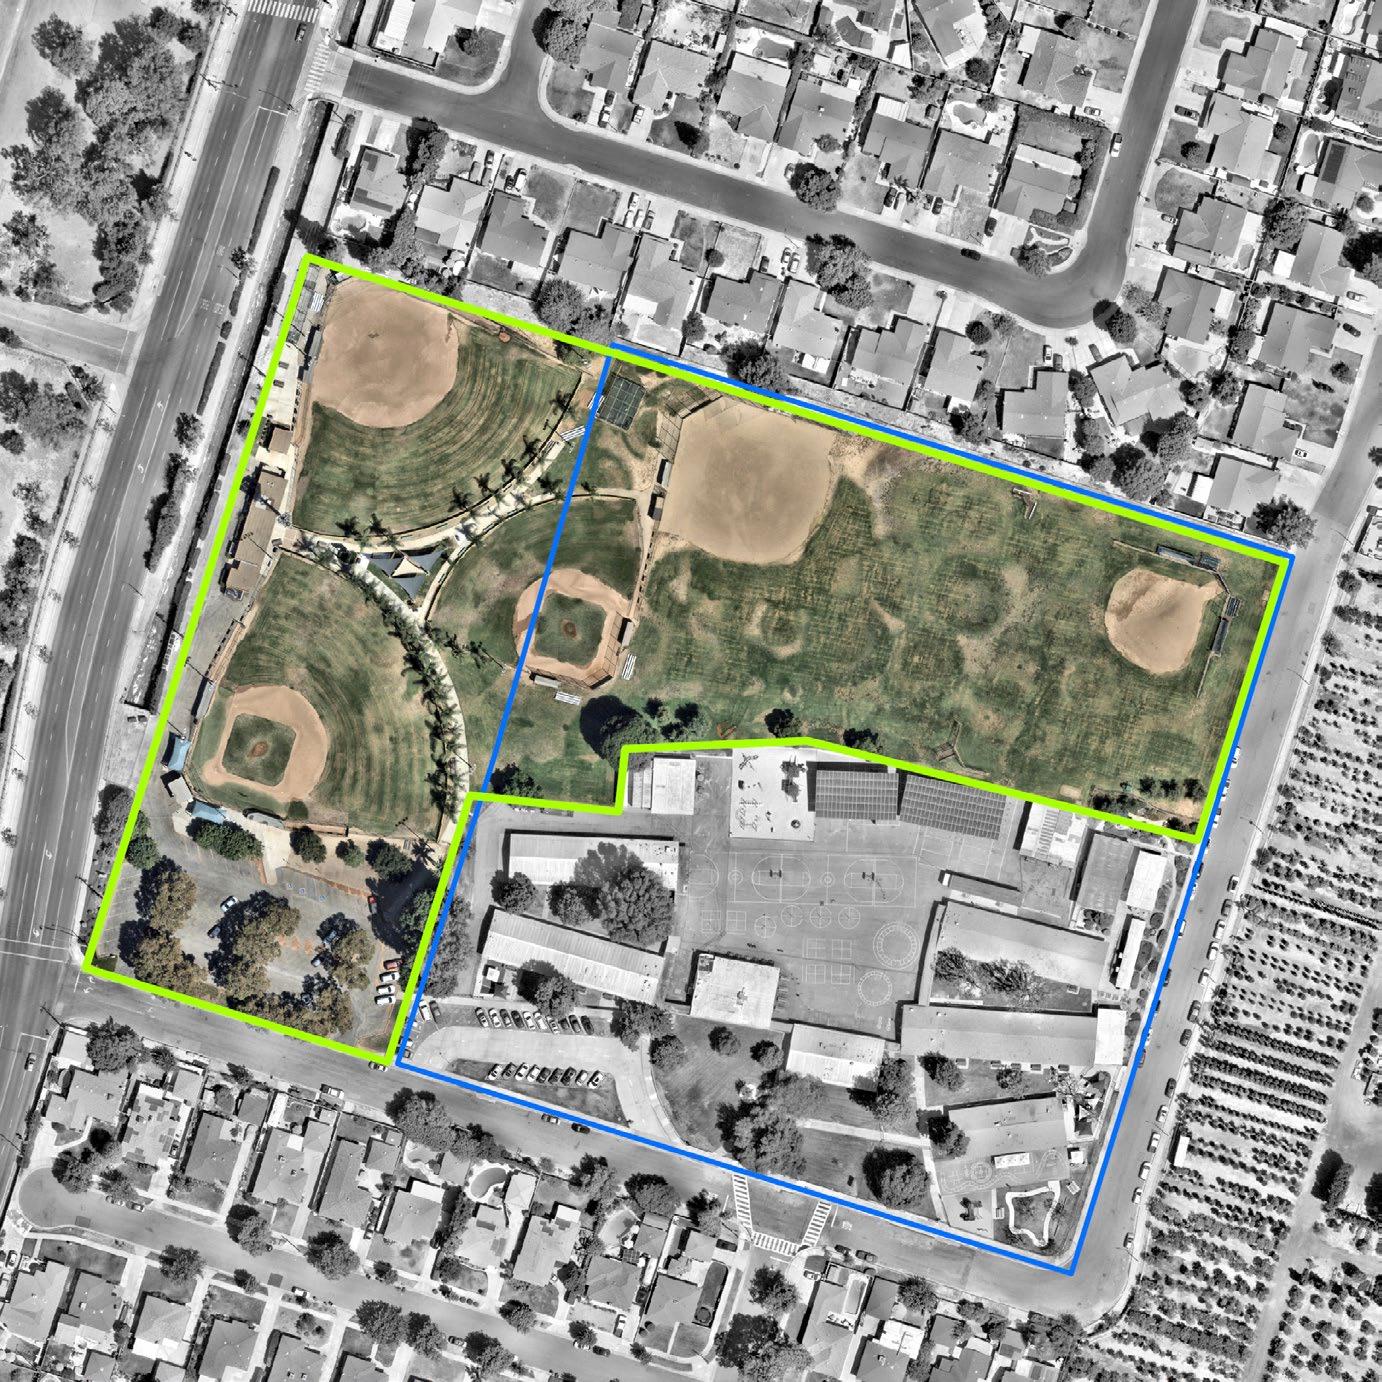
Description: Pelota Park is a community park located in the south central area of the city, adjacent to Grace Miller Elementary School. The park includes picnic tables, restrooms, diamond fields, and a concession stand.
Amenities:

Based on the overall asset condition assessment score
Park has a full walking loop
Park amenities are accessible by wheelchair or other mobility aid device
Park has a nearby transit stop
Park has multiple access points
Park has entry signage
Park has placemaking elements
Park has adequate lighting for night activities
Park has controlled access
Park amenities that facilitate social gatherings
Park has City organized programming activities
Community events occur at the park
Park has both active and passive amenities
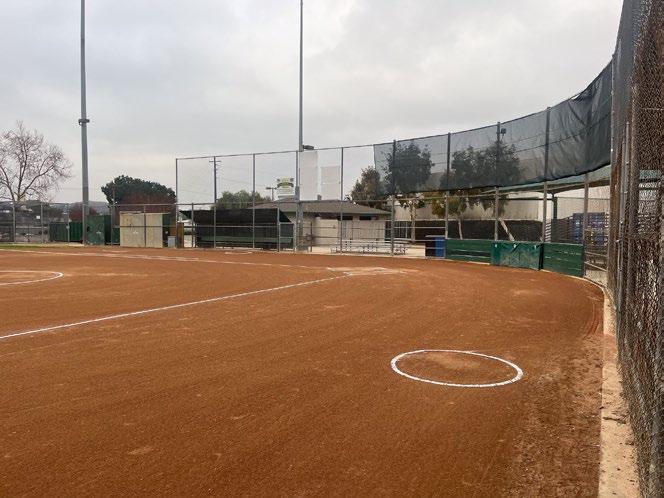
Park Type: Neighborhood Park
Acres: 6.02
Address: 1499 Palomares Avenue
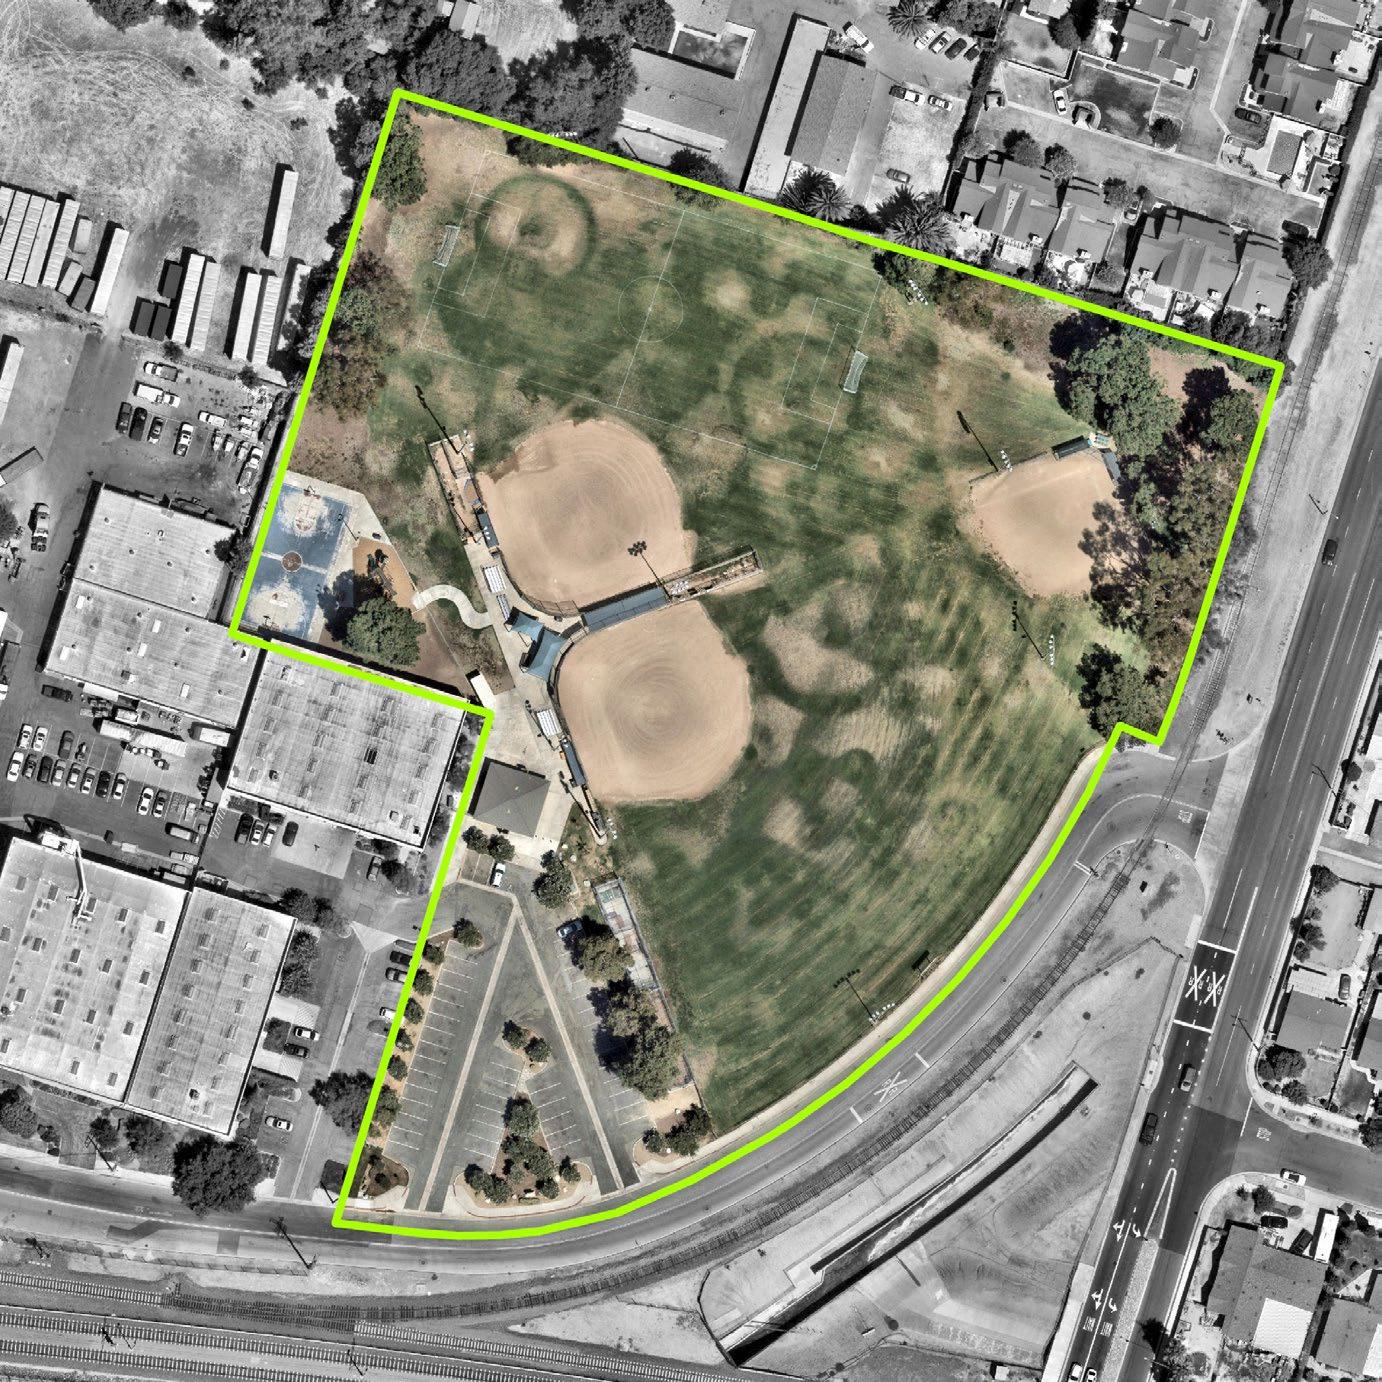
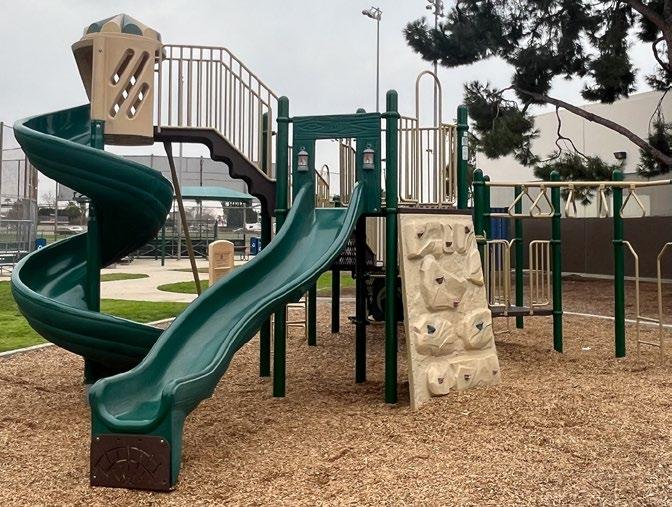
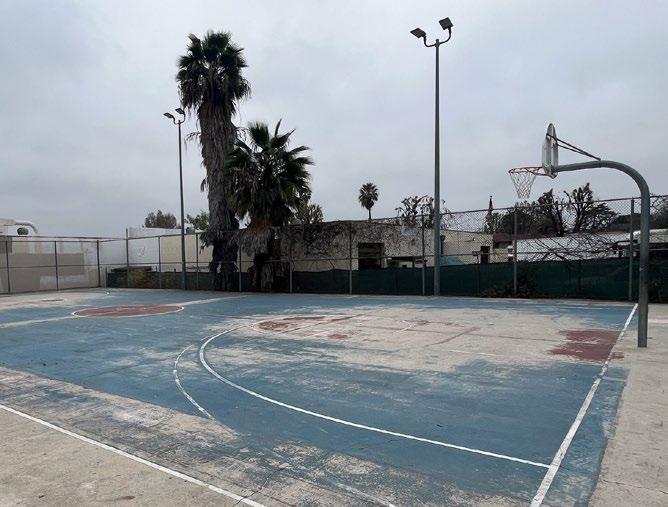
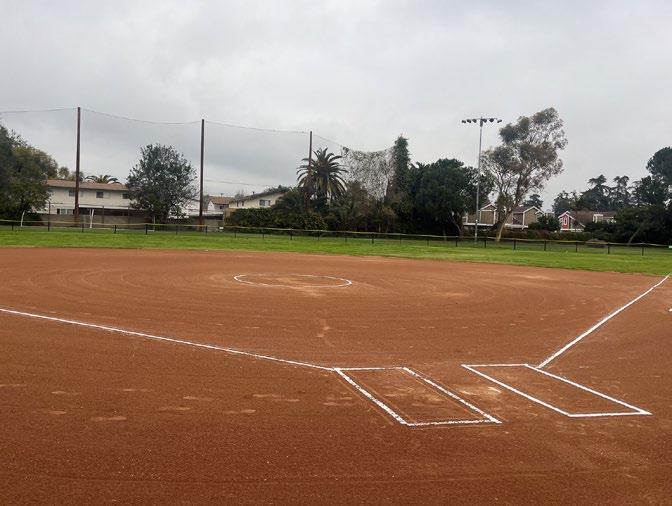
Description: Wheeler Avenue Park is a neighborhood park located in the southern area of La Verne and west of the University of La Verne. The park includes three diamond fields, a basketball court, a concession stand, a playground, and restroom facilities.
Amenities:
B
B C B
Based on the overall asset condition assessment score
Park has a full walking loop
Park amenities are accessible by wheelchair or other mobility aid device
Park has a nearby transit stop
Park has multiple access points
Park has entry signage
Park has placemaking elements
Park has adequate lighting for night activities
Park has controlled access
Activation
Park amenities that facilitate social gatherings
Park has City organized programming activities
Community events occur at the park
Park has both active and passive amenities
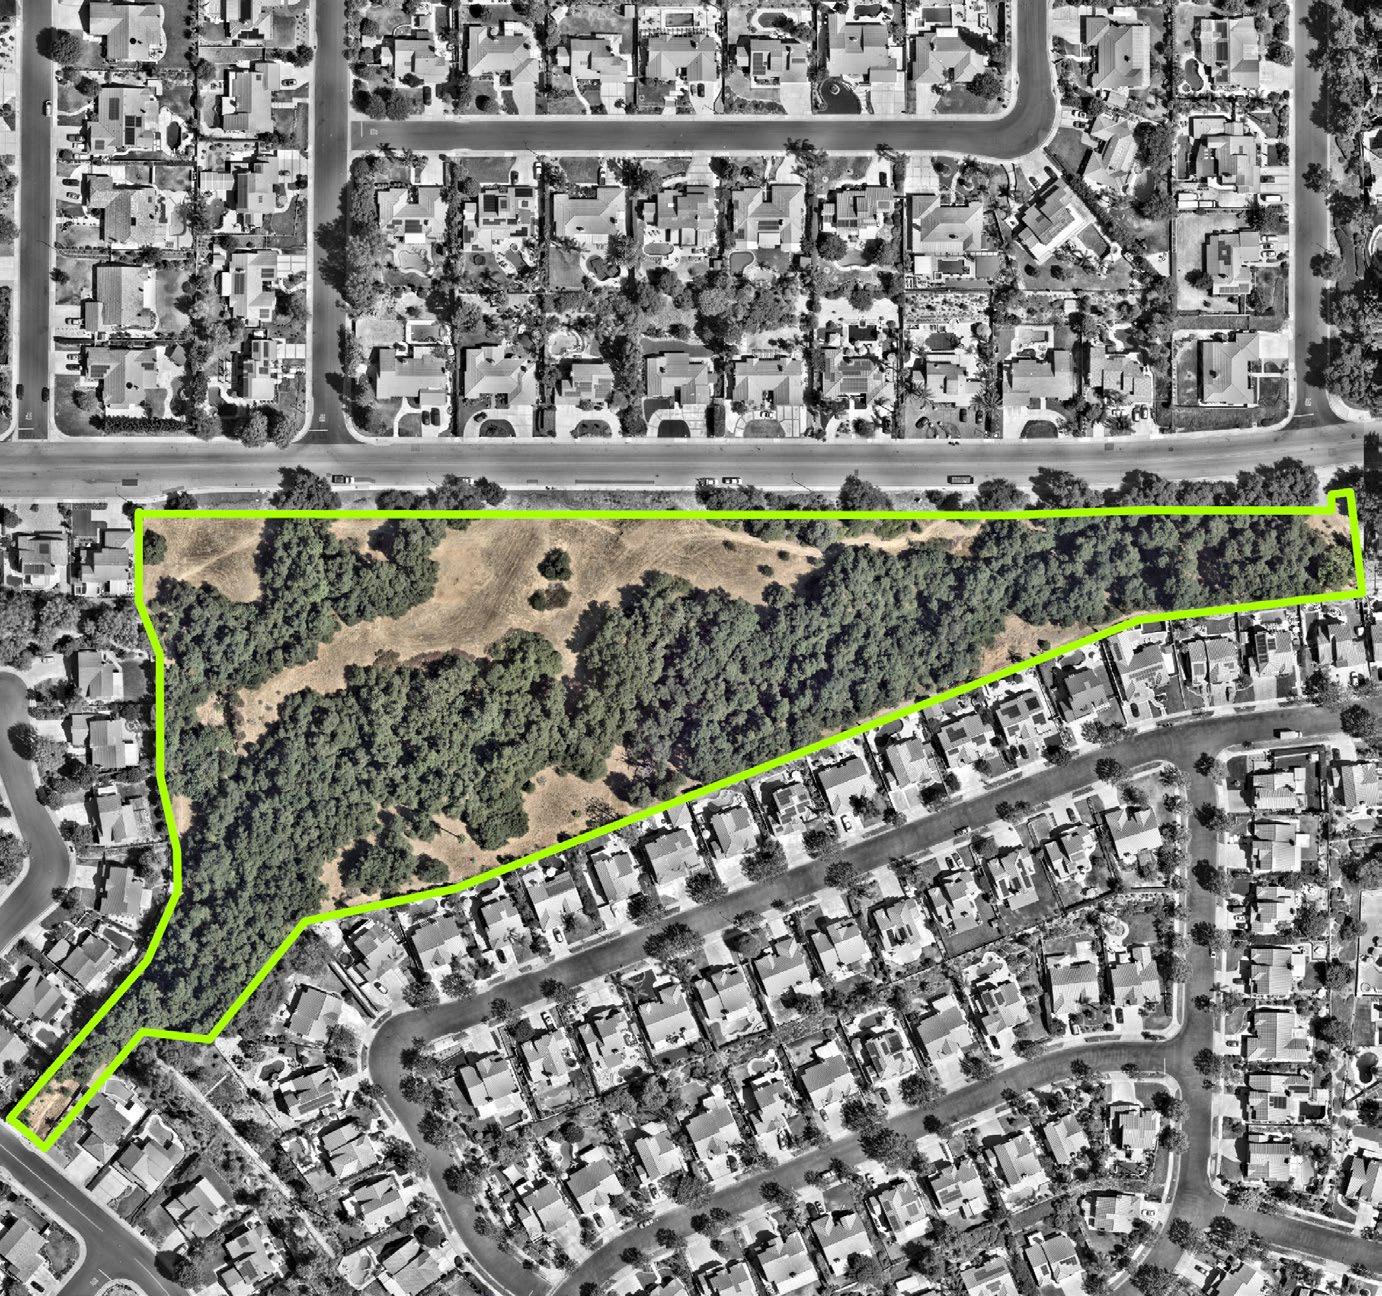
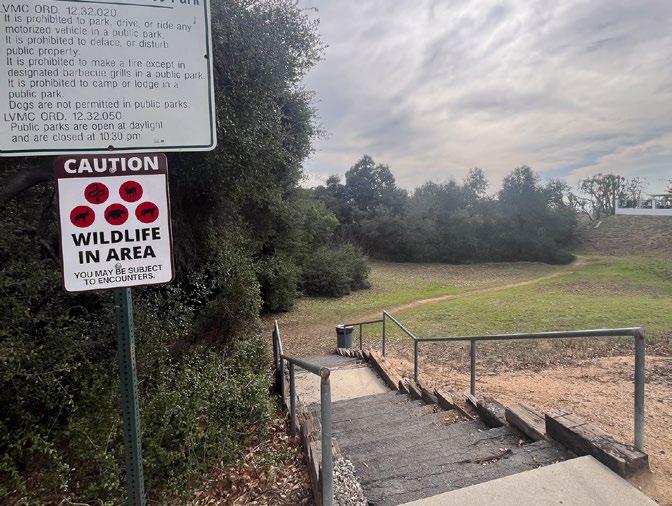
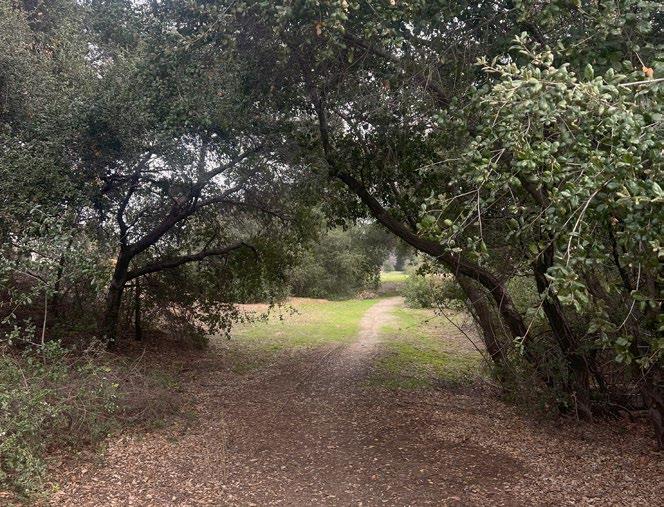
Park Type: Neighborhood Park
Acres: 9.30
Address: 2300 Golden Hills Road
Description: Golden Hill Wilderness Park is a neighborhood park located at the northwestern corner of La Verne, west of the Live Oak Reservoir. The park includes nature trails and picnic tables.
Amenities:

B
C
Based on the overall asset condition assessment score
Park has a full walking loop
Park amenities are accessible by wheelchair or other mobility aid device
Park has a nearby transit stop
Park has multiple access points
B
Comfort and Identity
Park has entry signage
Park has placemaking elements
Park has adequate lighting for night activities
Park has controlled access
D
Activation
Park amenities that facilitate social gatherings
Park has City organized programming activities
Community events occur at the park
Park has both active and passive amenities
(Joint Use Park)
Bonita High School
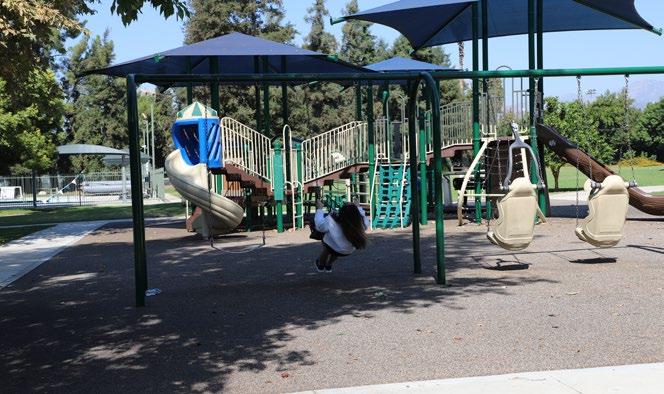


Park Type: Community Park
Acres: 16.34
Address: 3175 Bolling Avenue
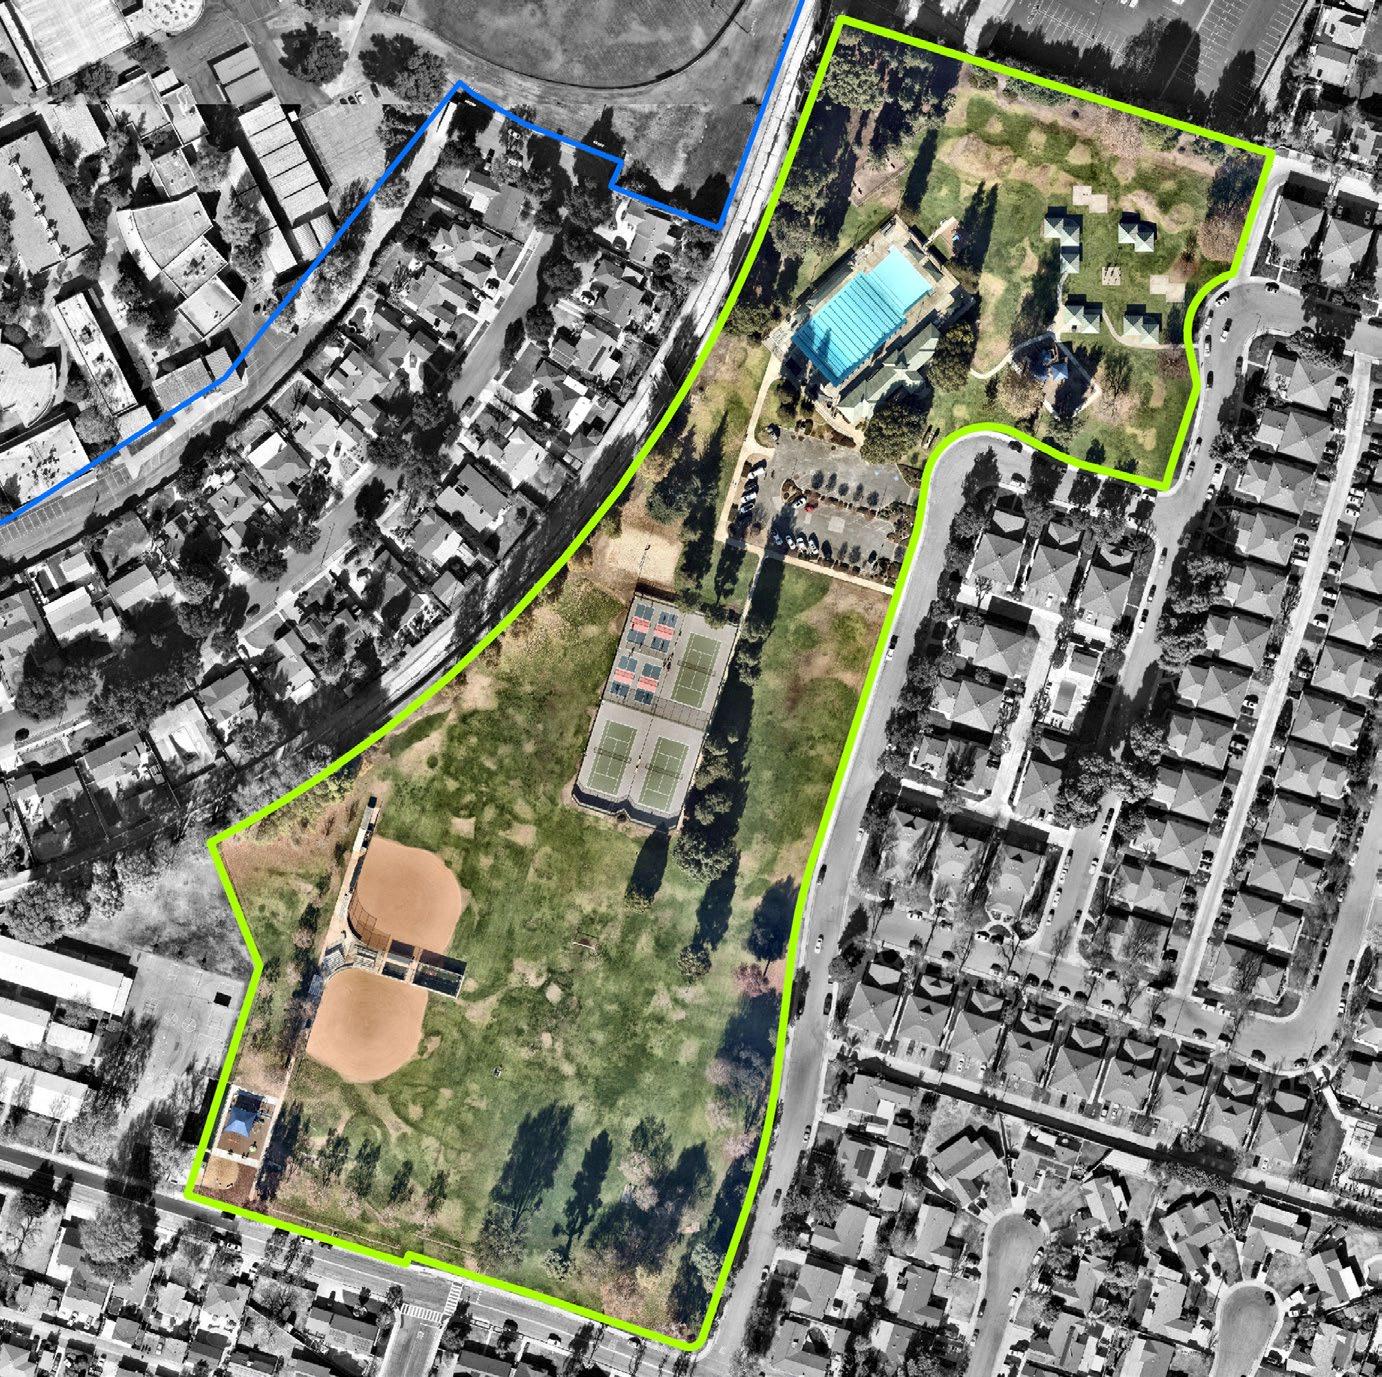
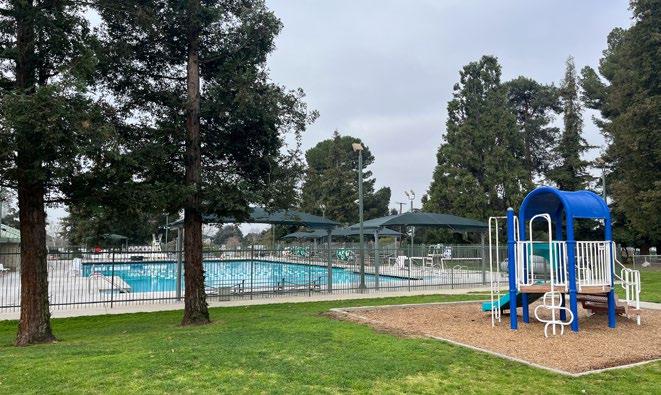
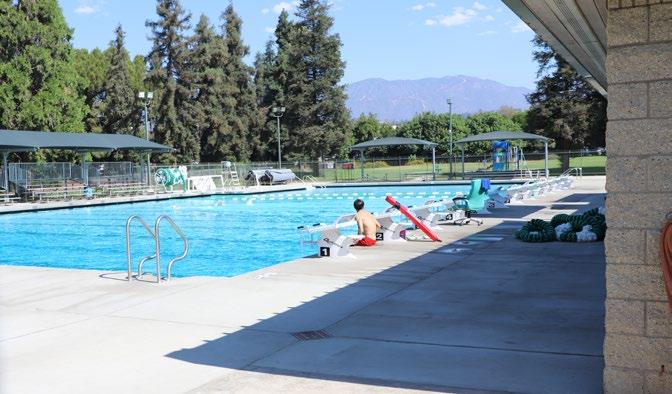
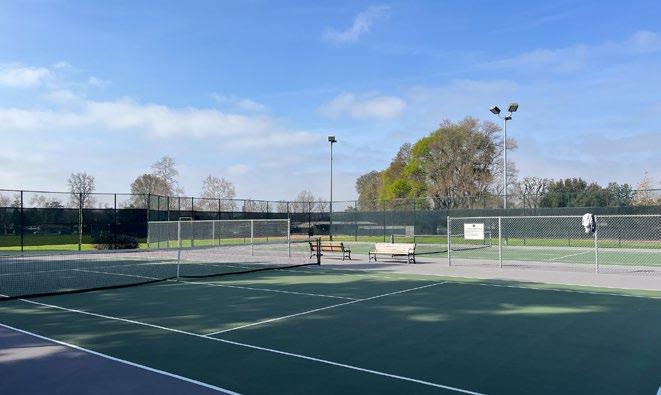
Description: Las Flores Park is a community park located in then south eastern area of the City, adjacent to the La Verne Sports Park. The park includes picnic areas with barbecues, two playgrounds, restroom facilities, a volleyball court, tennis courts, four pickleball courts, two diamond fields, soccer fields, and a horseshoe pit. The park also includes the La Verne Aquatic Center, a joint-use Olympicsized swimming pool shared between the City, Bonita High School, and the University of La Verne through a JUA.
Based on the overall asset condition assessment score
A A
Park has a full walking loop
Park amenities are accessible by wheelchair or other mobility aid device
Park has a nearby transit stop
Park has multiple access points
Park has entry signage
Park has placemaking elements
Park has adequate lighting for night activities
Park has controlled access
Park amenities that facilitate social gatherings
Park has City organized programming activities
Community events occur at the park
Park has both active and passive amenities
Use Park)

Park Type: Community Park
Acres: 19.62
Address: 3102 D Street
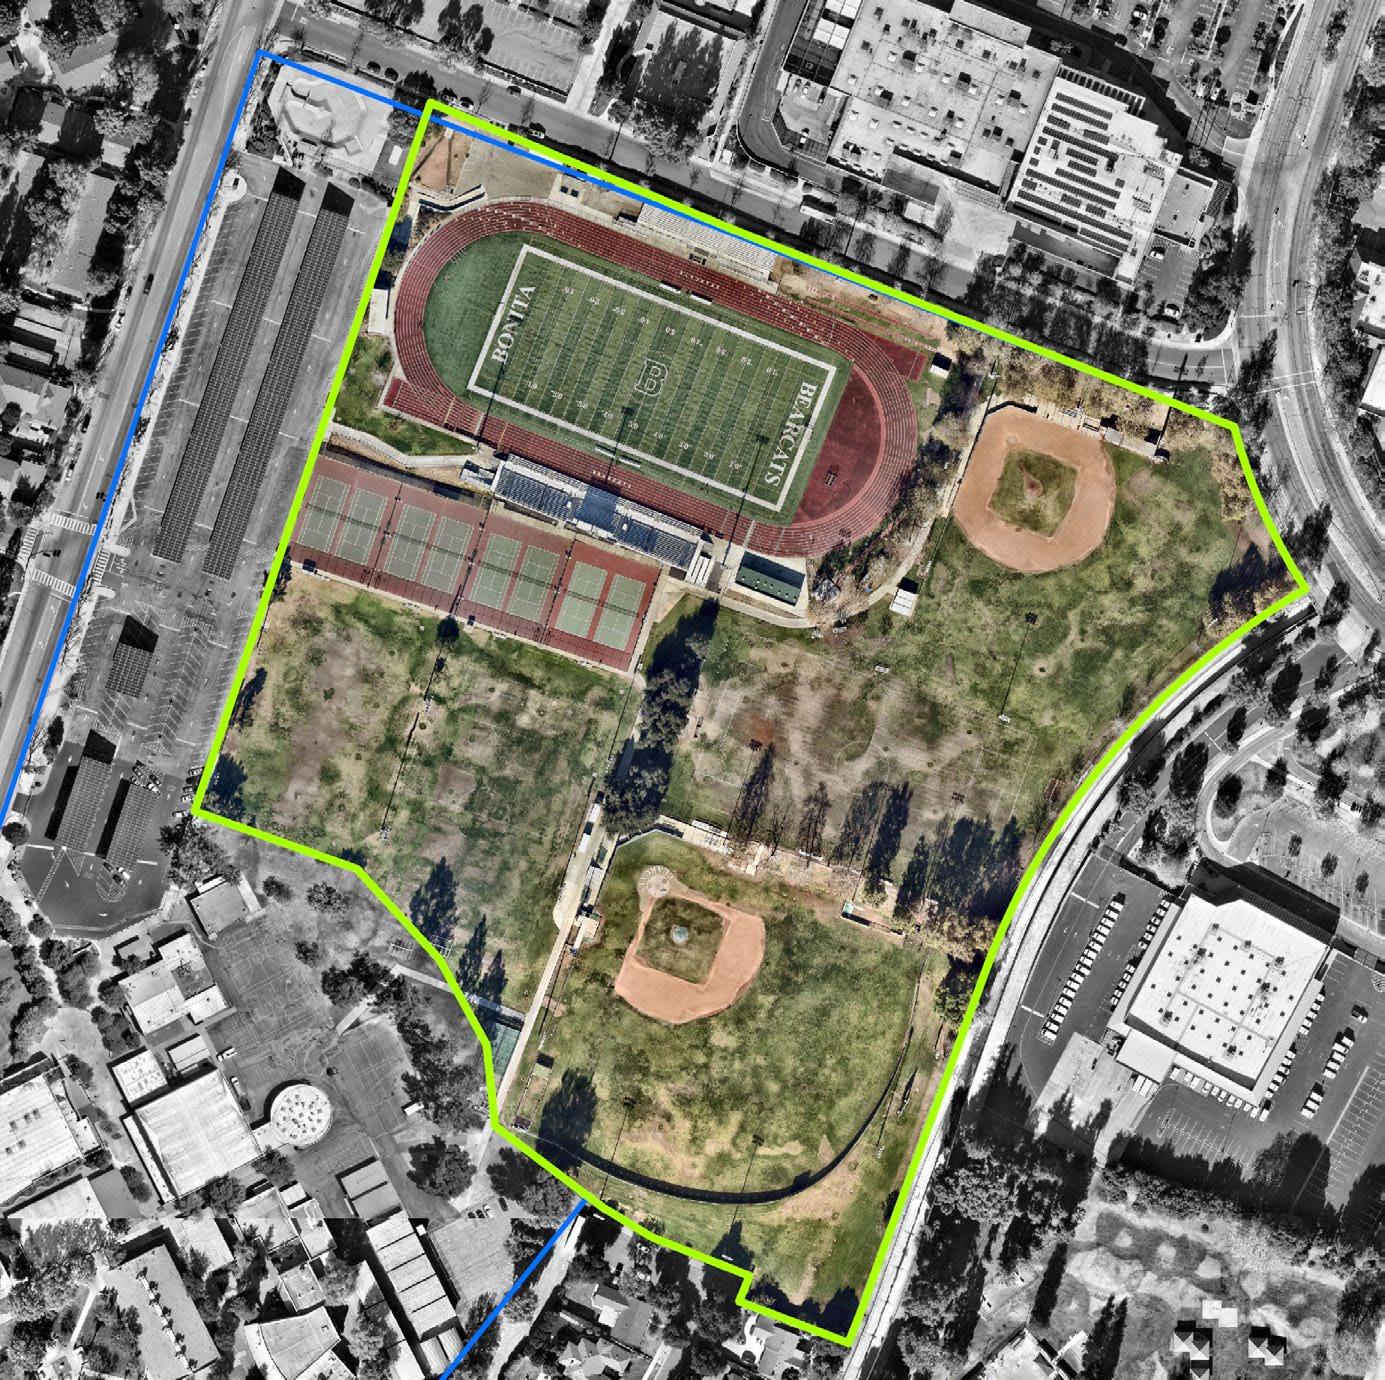
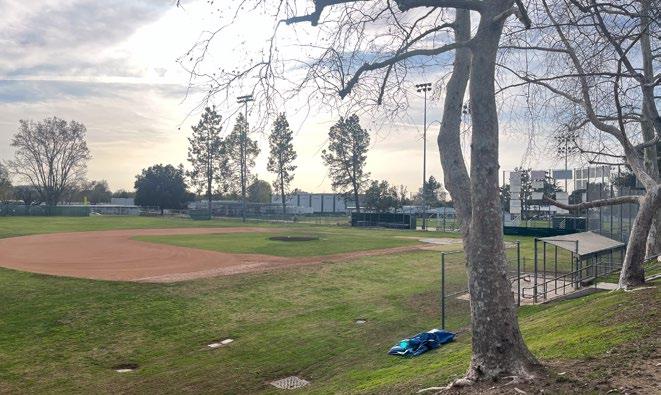
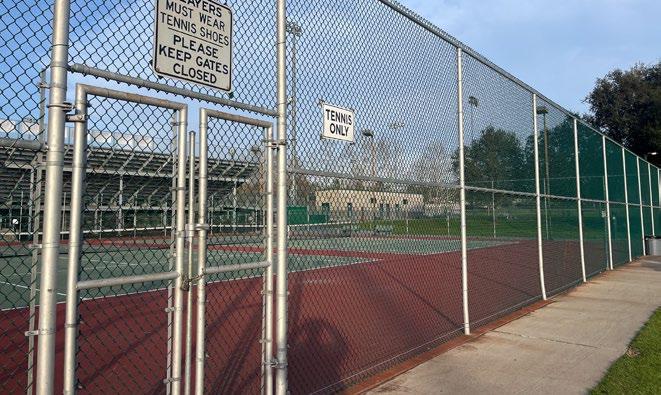
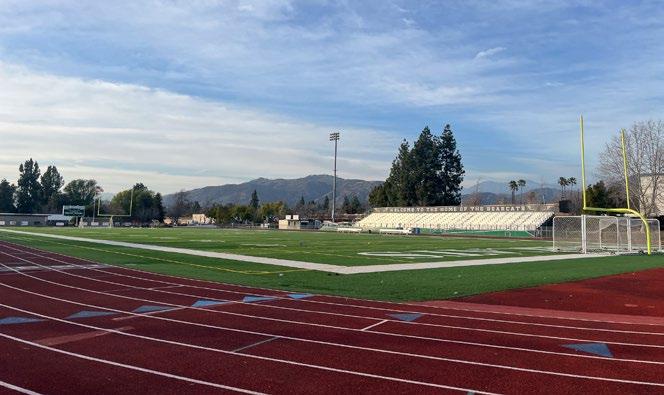
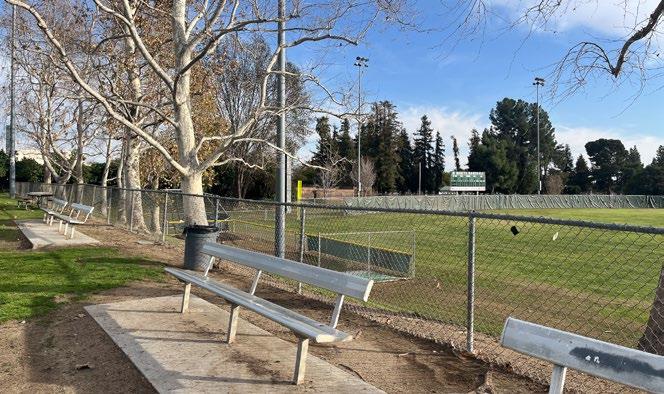
Description: The La Verne Sports Park is a community park and jointuse agreement between the City and Bonita Unified School District. The park is located near the southeastern area of the city. The park includes eight tennis courts, two diamond fields, three soccer fields, a football field, a concession stand, a track, and restroom facilities.
Based on the overall asset condition assessment score
Park has a full walking loop
Park amenities are accessible by wheelchair or other mobility aid device
Park has a nearby transit stop
Park has multiple access points
Park has entry signage
Park has placemaking elements
Park has adequate lighting for night activities
Park has controlled access
Park amenities that facilitate social gatherings
Park has City organized programming activities
Community events occur at the park
Park has both active and passive amenities
Park Type: Mini Park
Acres: 0.13
Address: 3102 D Street
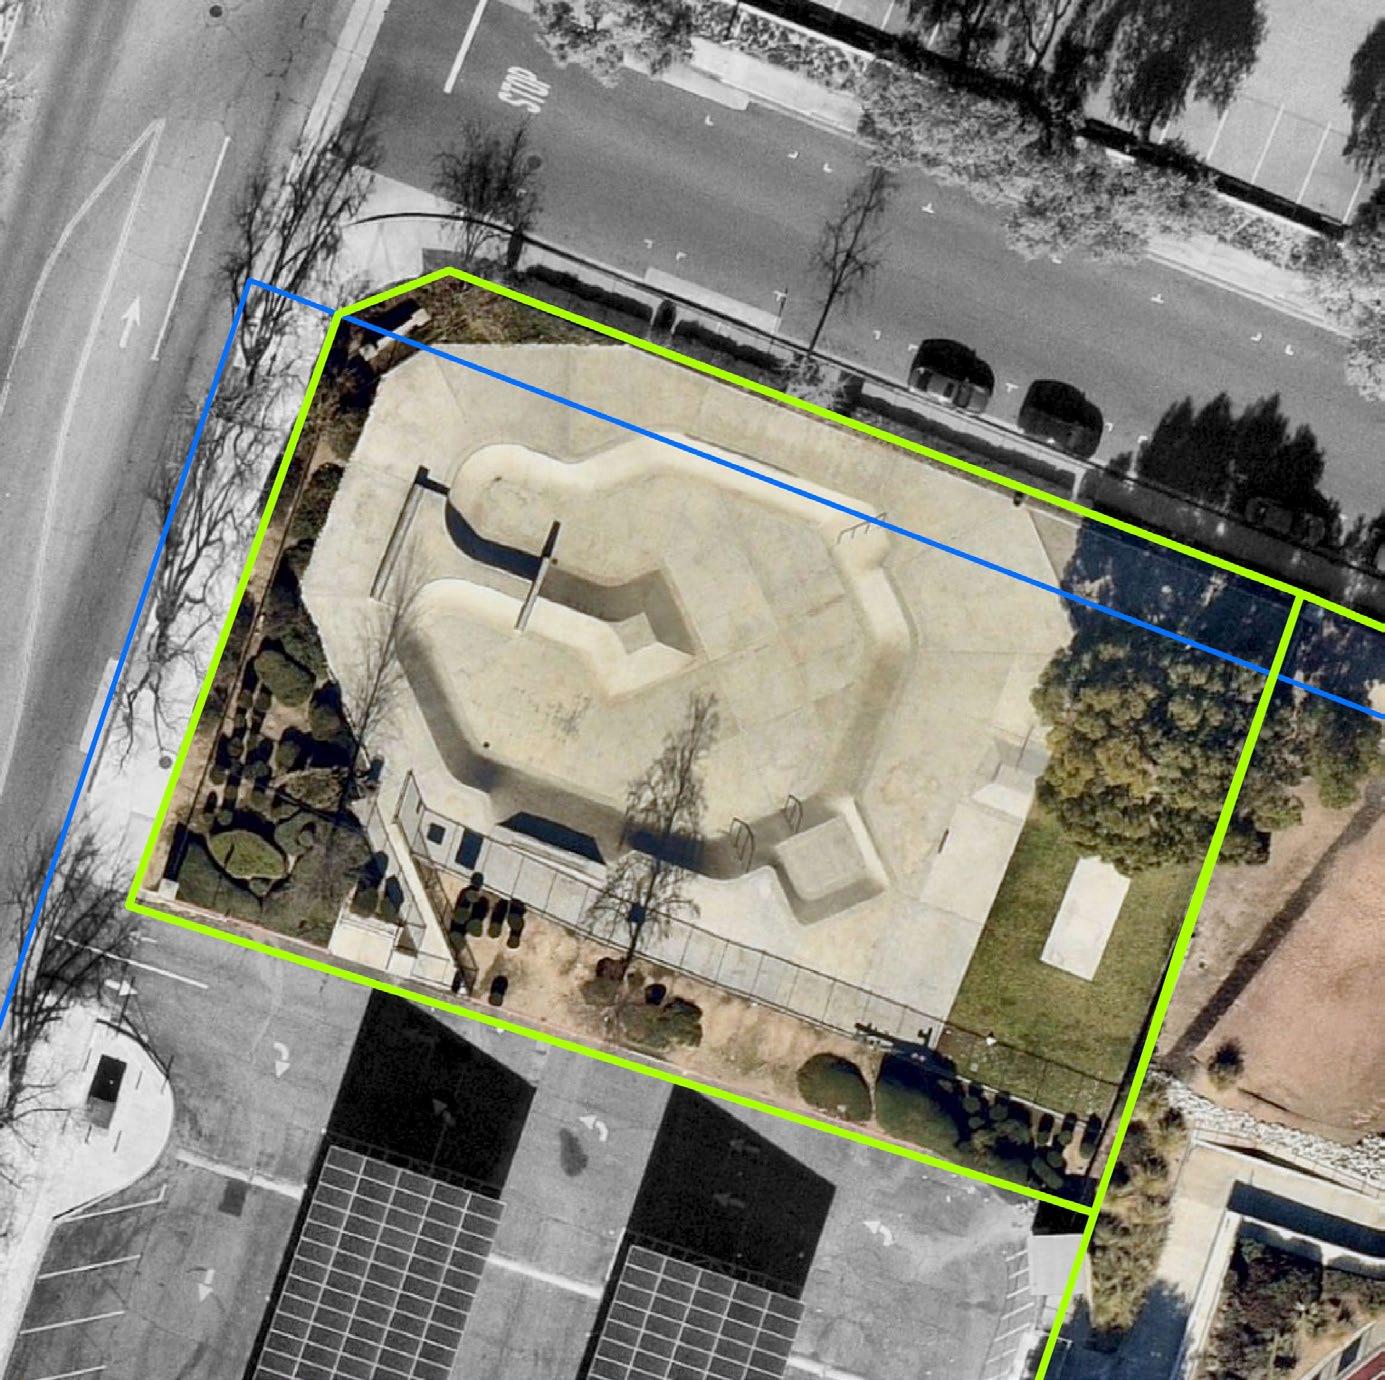
Description: The La Verne Skate Park is a mini park and part of the joint-use agreement between the City and Bonita Unified School District. The skate park sits at the northwestern corner of the La Verne Sports Park and provides visitors with a concrete horse-shoe shaped bowl to recreate in.
Amenities:

Based on the overall asset condition assessment score
Park has a full walking loop
Park amenities are accessible by wheelchair or other mobility aid device
Park has a nearby transit stop
Park has multiple access points
Park has entry signage
Park has placemaking elements
Park has adequate lighting for night activities
Park has controlled access
Activation
Park amenities that facilitate social gatherings
Park has City organized programming activities
Community events occur at the park
Park has both active and passive amenities
Park Type: Neighborhood Park
Acres: 4.31
Address: 5701 Shemiran Street
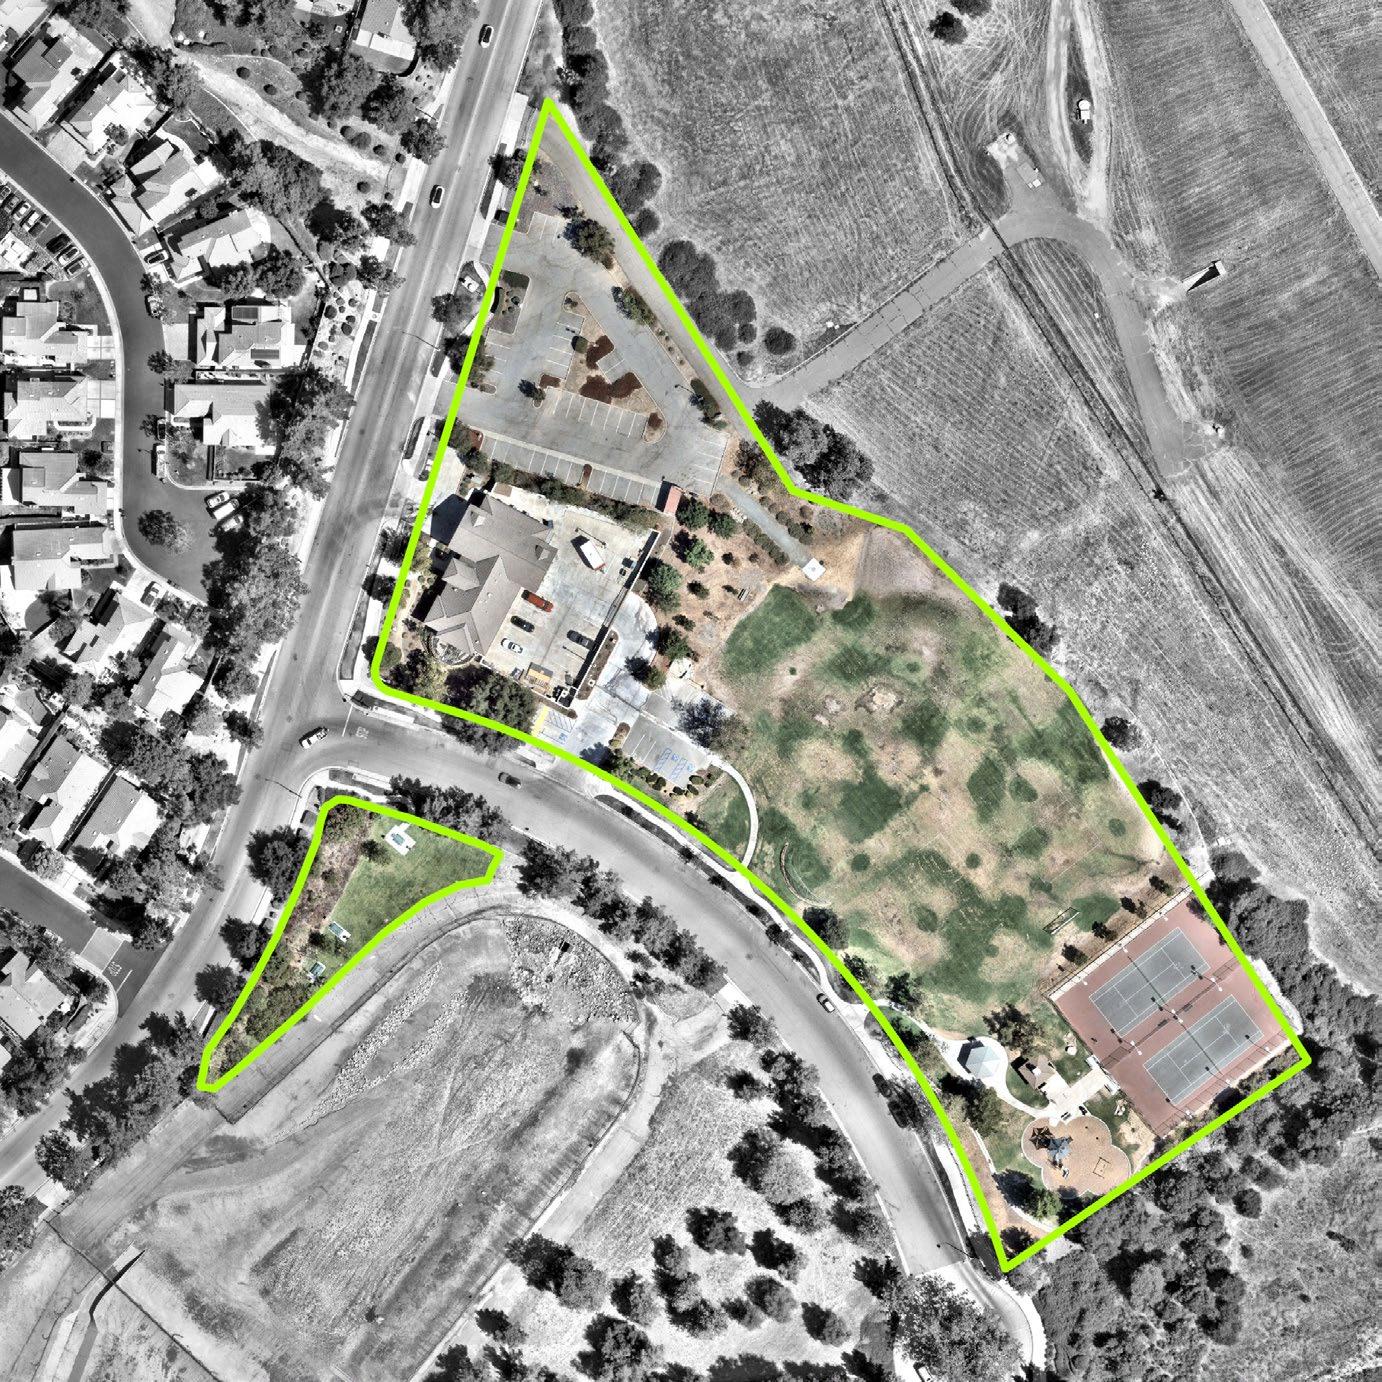
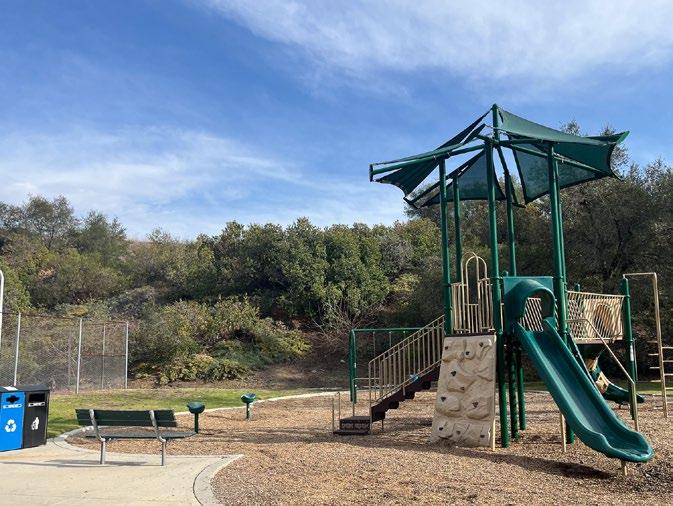
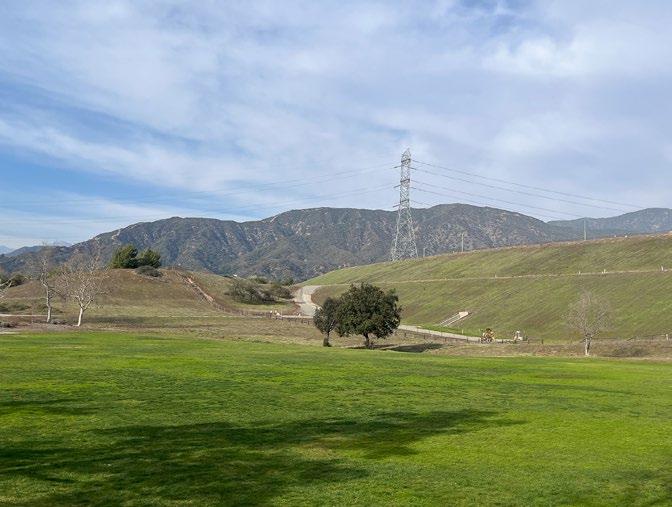
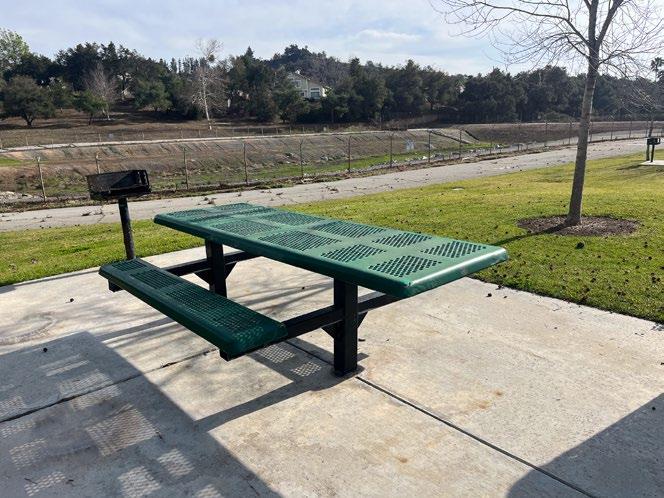
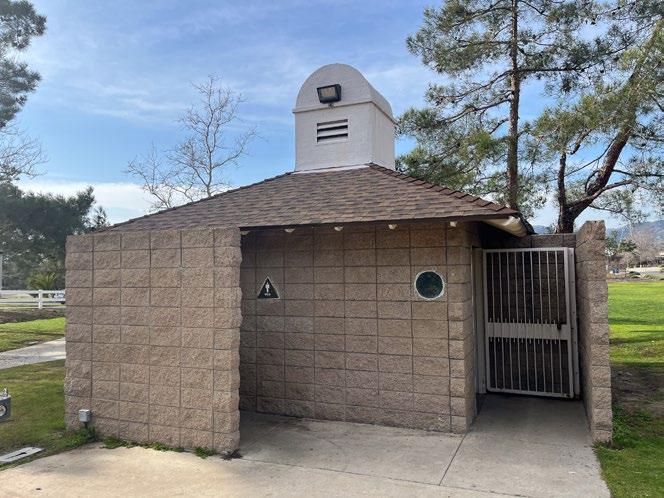
Description: Live Oak Park is a neighborhood park located at the base of the Live Oak Reservoir, in northeastern La Verne. This Park is a JUA with the Metropolitan Water District. The park includes a covered picnic area, picnic tables, a playground, a restroom facility, two tennis courts, a soccer field, and a multi-purpose diamond field.
Amenities:
Based on the overall asset condition assessment score
Park has a full walking loop
Park amenities are accessible by wheelchair or other mobility aid device
Park has a nearby transit stop
Park has multiple access points
Park has entry signage
Park has placemaking elements
Park has adequate lighting for night activities
Park has controlled access
Park amenities that facilitate social gatherings
Park has City organized programming activities
Community events occur at the park
Park has both active and passive amenities
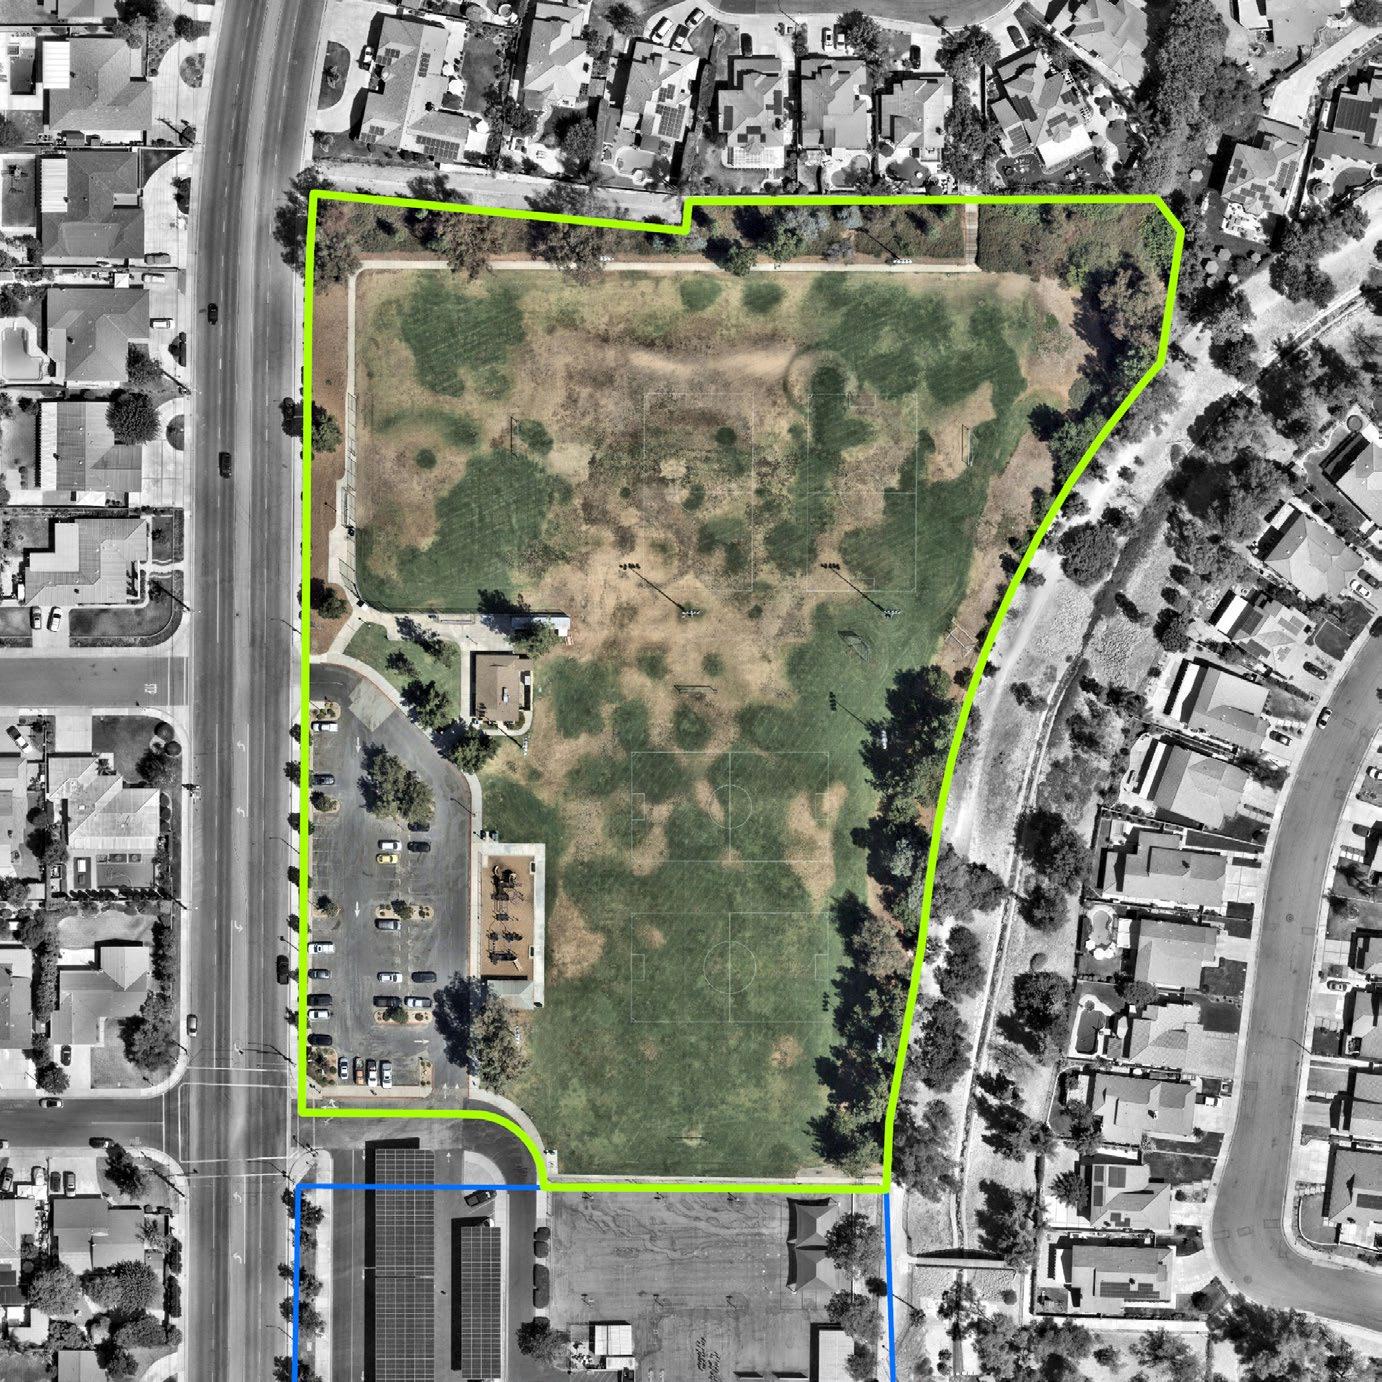
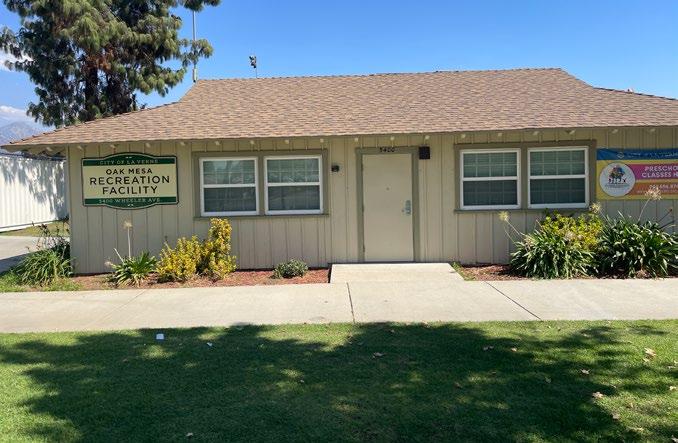
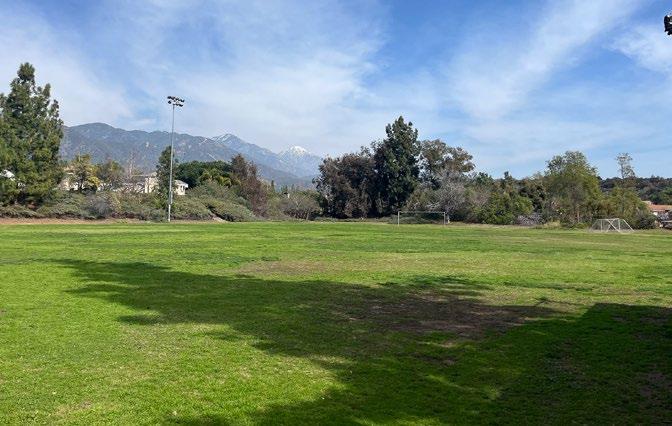
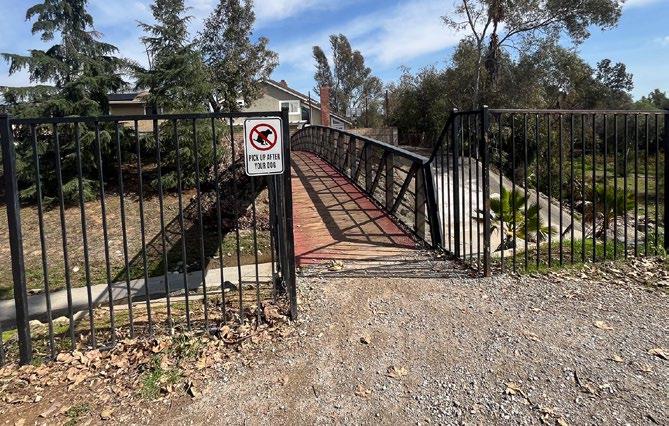
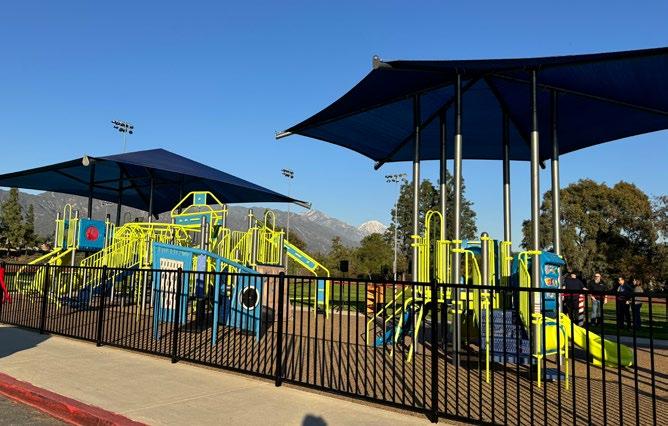


Park Type: Neighborhood Park
Acres: 7.28
Address: 5400 Wheeler Avenue
Description: Oak Mesa Park is a neighborhood park and joint-use agreement between the City and Bonita Unified School District. The park is located in the northwestern portion of La Verne and is directly adjacent to Oak Mesa Elementary. The park includes a community room, restroom facilities, a picnic area, a new playground (as of 2025), two soccer fields/multi-purpose diamond field, and a bike repair station. The park also informally connects to Heritage Park via a soft-surface trail on the east side of the park.
Based on the overall asset condition assessment score
Park has a full walking loop
Park amenities are accessible by wheelchair or other mobility aid device
Park has a nearby transit stop
Park has multiple access points
Park has entry signage
Park has placemaking elements
Park has adequate lighting for night activities
Park has controlled access
Park amenities that facilitate social gatherings
Park has City organized programming activities
Community events occur at the park
Park has both active and passive amenities
3rdSt
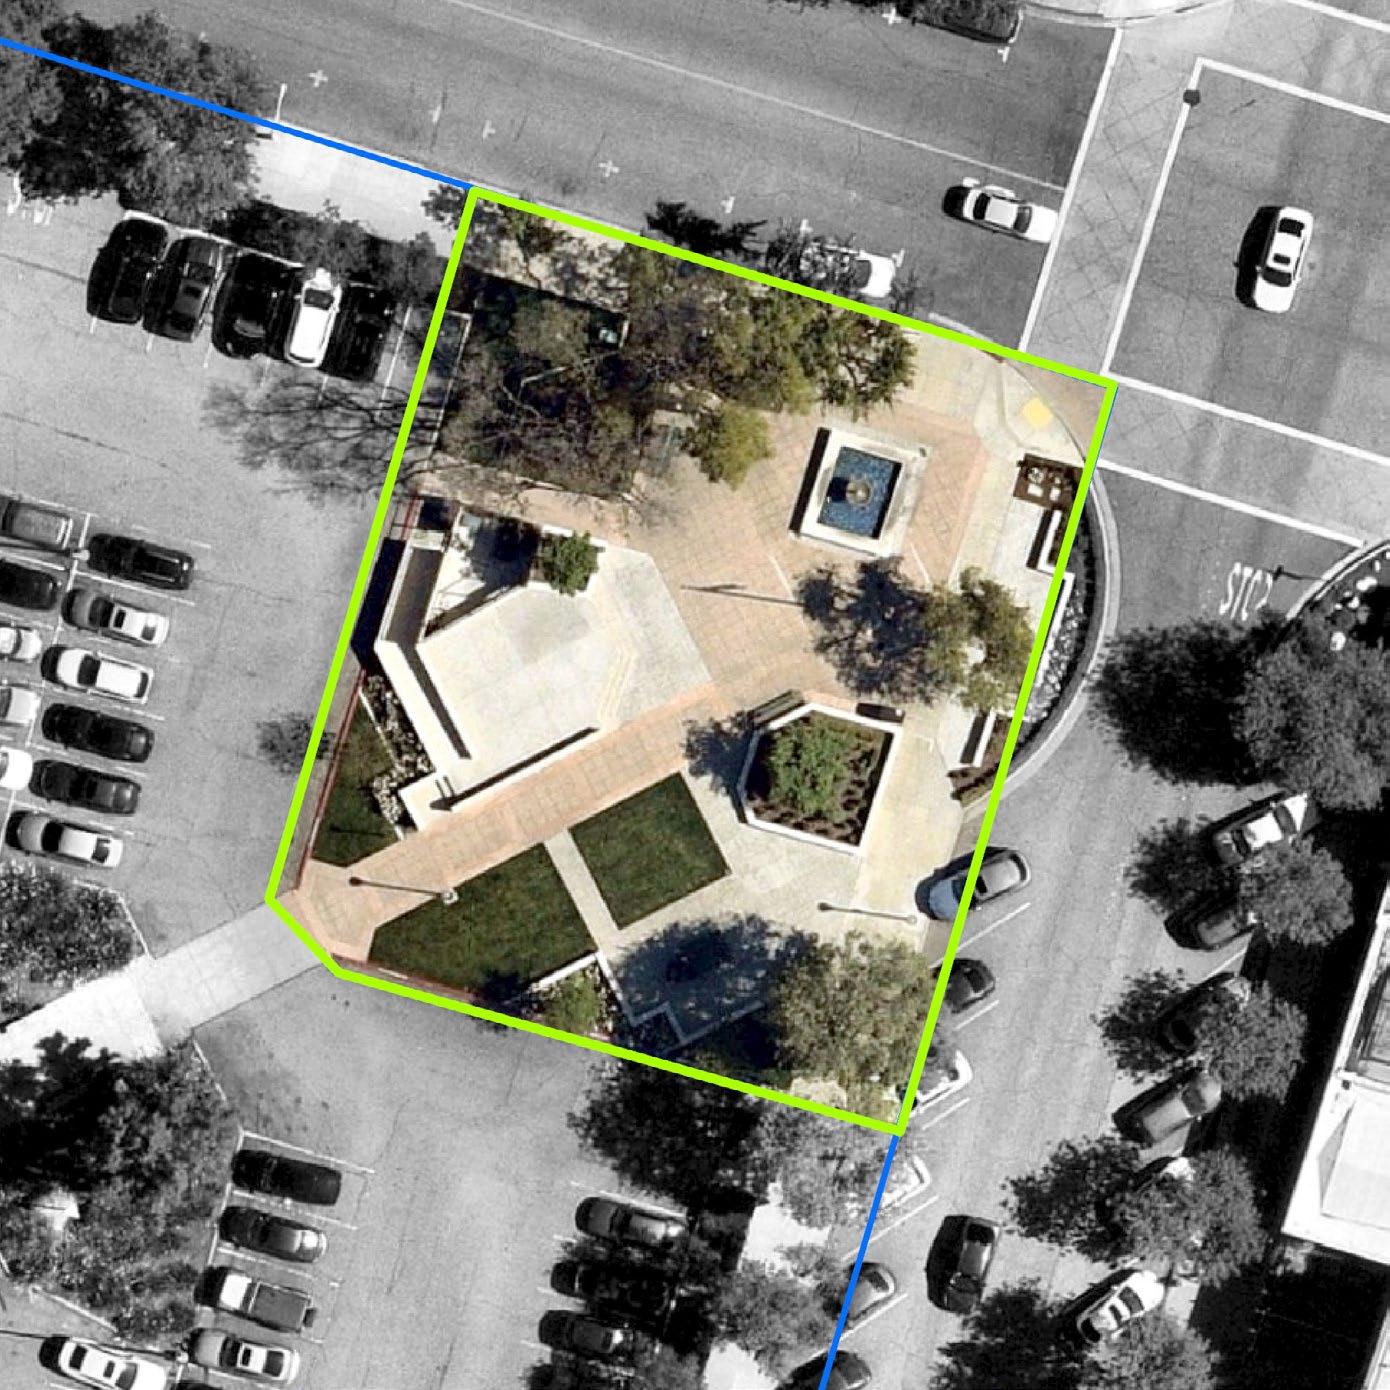
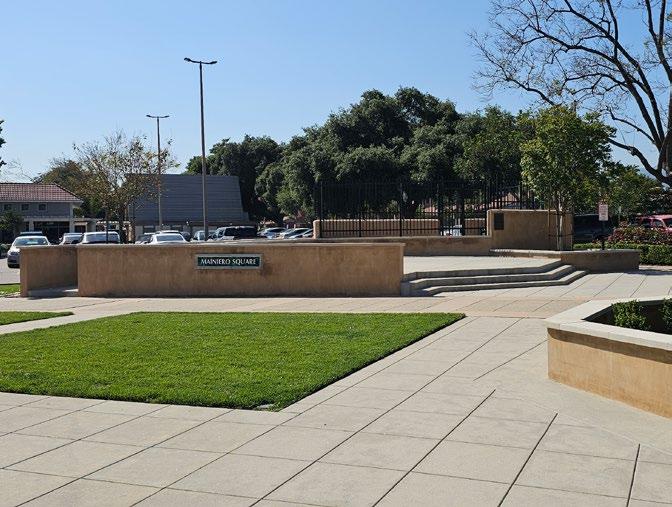
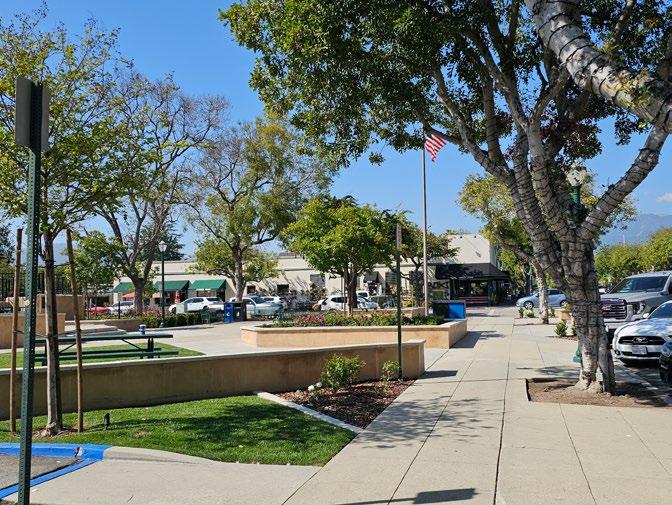
Park Type: Mini Park
Acres: 0.21
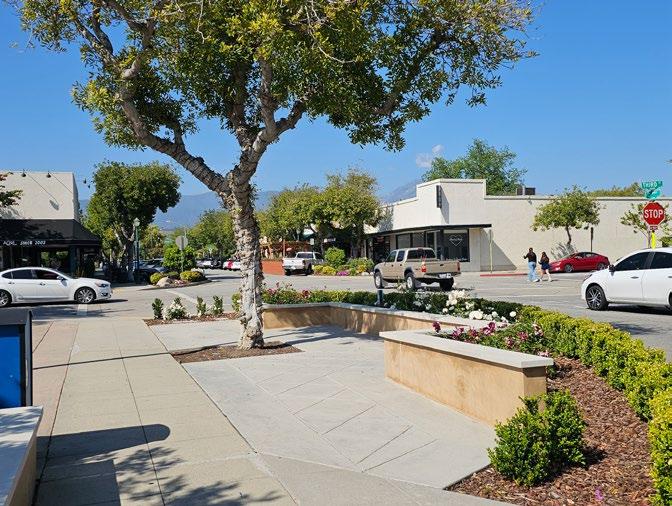
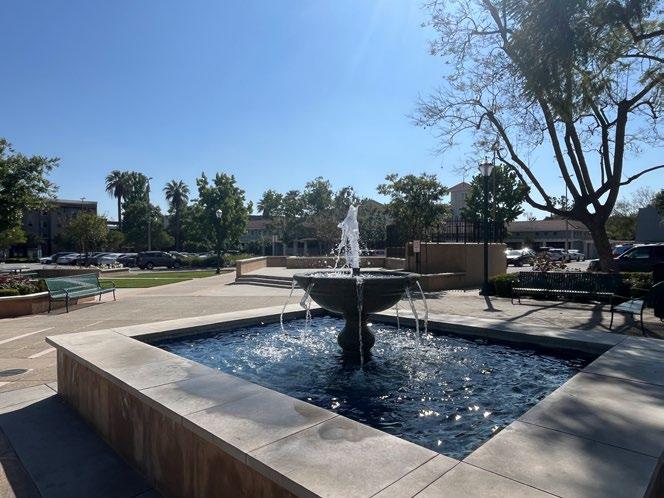
Description: Maniero Square is a plaza located in downtown La Verne, on the northeastern corner of the University of La Verne campus. The park includes a number of benches, picnic tables, a small stage, and a water feature.
Amenities:
Address: 3rd Street and D Street x B A x x x B B
Based on the overall asset condition assessment score
Park has a full walking loop
Park amenities are accessible by wheelchair or other mobility aid device
Park has a nearby transit stop
Park has multiple access points
Park has entry signage
Park has placemaking elements
Park has adequate lighting for night activities
Park has controlled access
Park amenities that facilitate social gatherings
Park has City organized programming activities
x x x
Community events occur at the park
Park has both active and passive amenities
2.4.1
Square Footage: 15,500
Address: 3680 D St
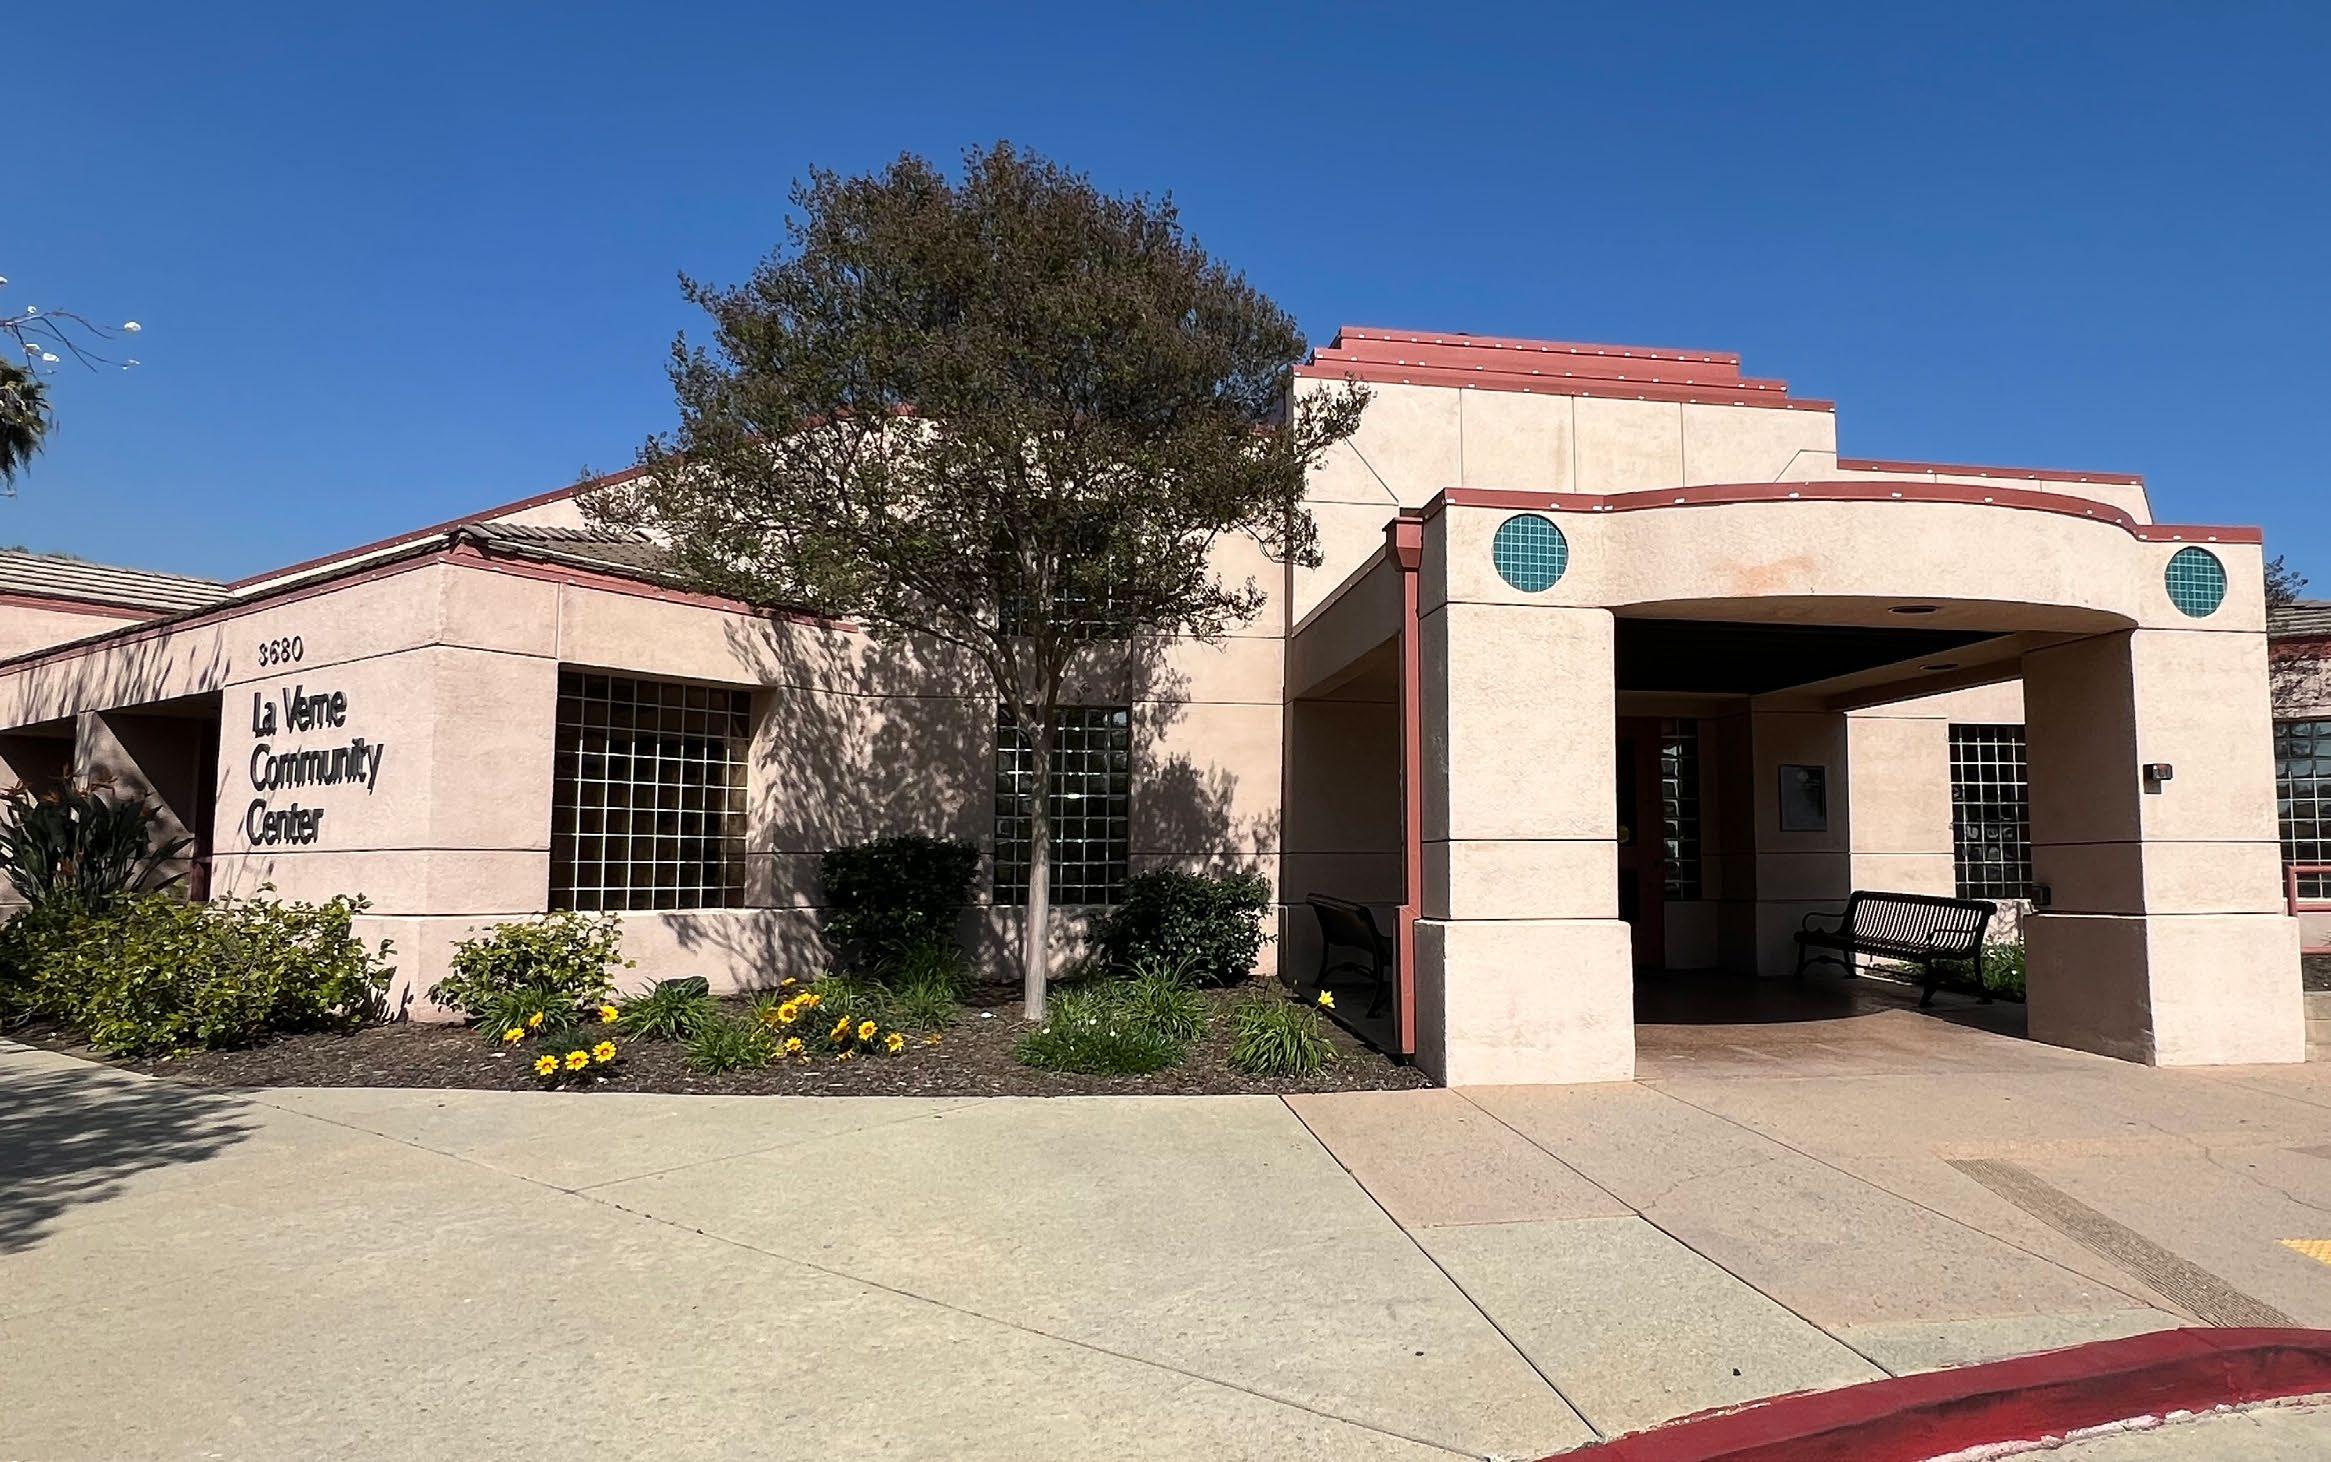
La Verne Community Center is a large public facility with multiple rooms, a commercial kitchen, outdoor patios, and a main event hall that can host up to 230 guests. The Center is located near the eastern border of the city, directly south of Historic Route 66, and can be rented out for receptions, celebrations, or corporate events.
Square Footage: 5,500
Address: 1550 Bonita Ave
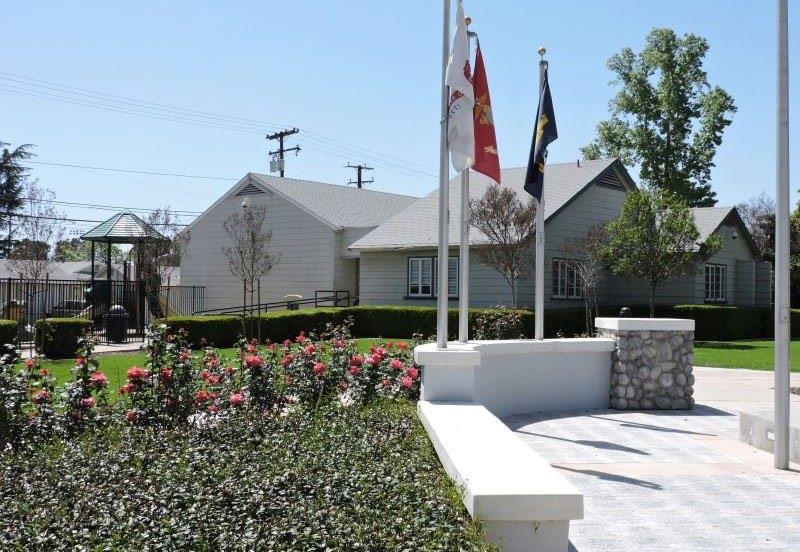
Veterans Hall is a community facility with a full service kitchen and a main hall that can host up to 80 guests. The Hall is located across the street from Kuns Park, west of downtown La Verne. Adjacent to the Hall is a small playground and picnic area.
Adjacent Parks are parks outside La Verne’s City boundary but sit just outside the boundary and may provide additional recreational access to La Verne residents.
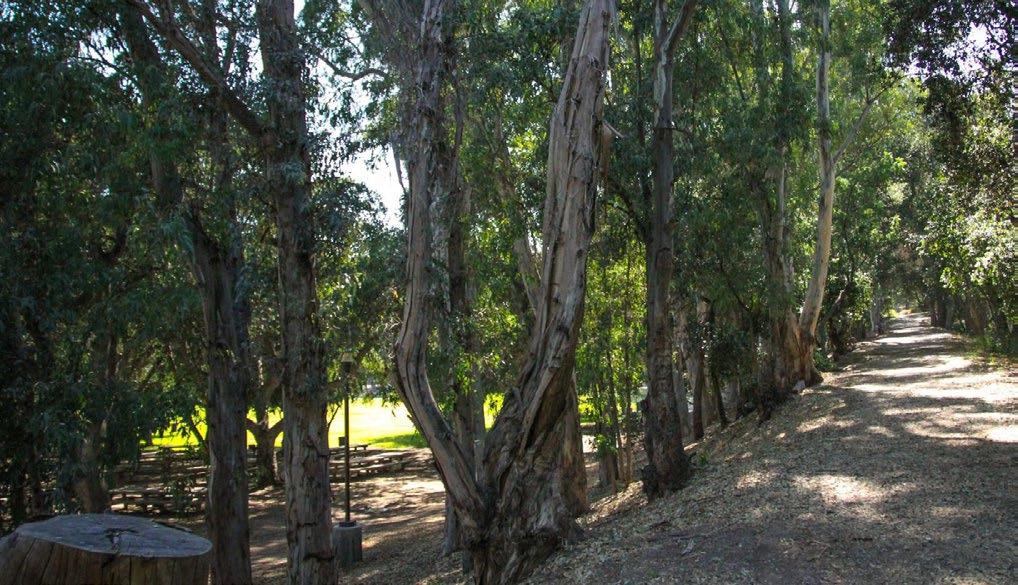
San Dimas Canyon Natural Area and Nature Center is a regional park located from the west to the north west of La Verne, sitting just outside of the city boundary. The park contains picnic tables, restrooms, and a network of trails. The park’s nature center hosts animal exhibits, presentations, and bird walks.
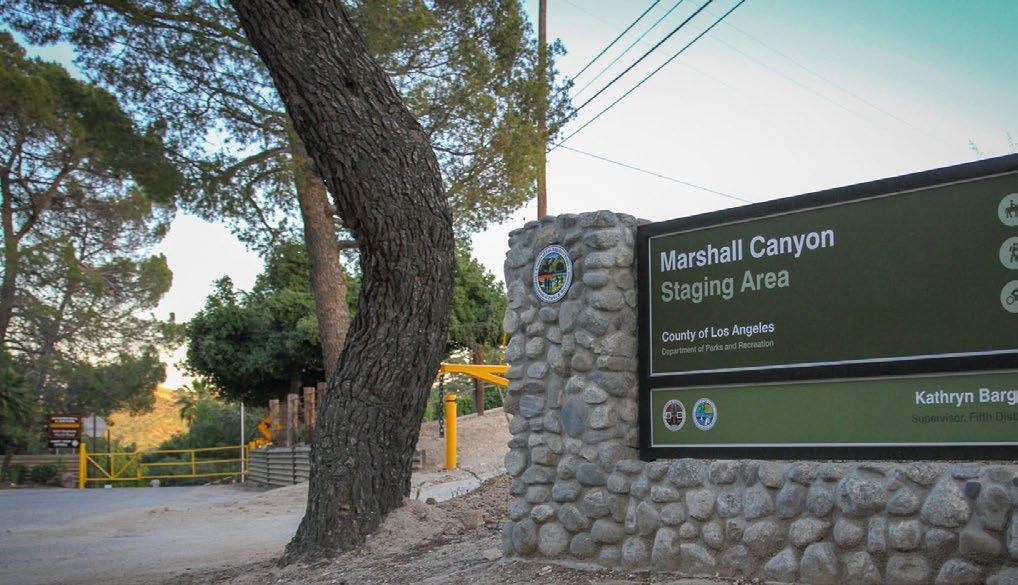
Marshall Canyon Park is a regional park located in Los Angeles County, just east of the northern tip of the La Verne city boundary. The park includes barbeques, camping sites, equestrian trails, hiking trails, horseshoe pits, mountain biking trails, and outdoor stages.
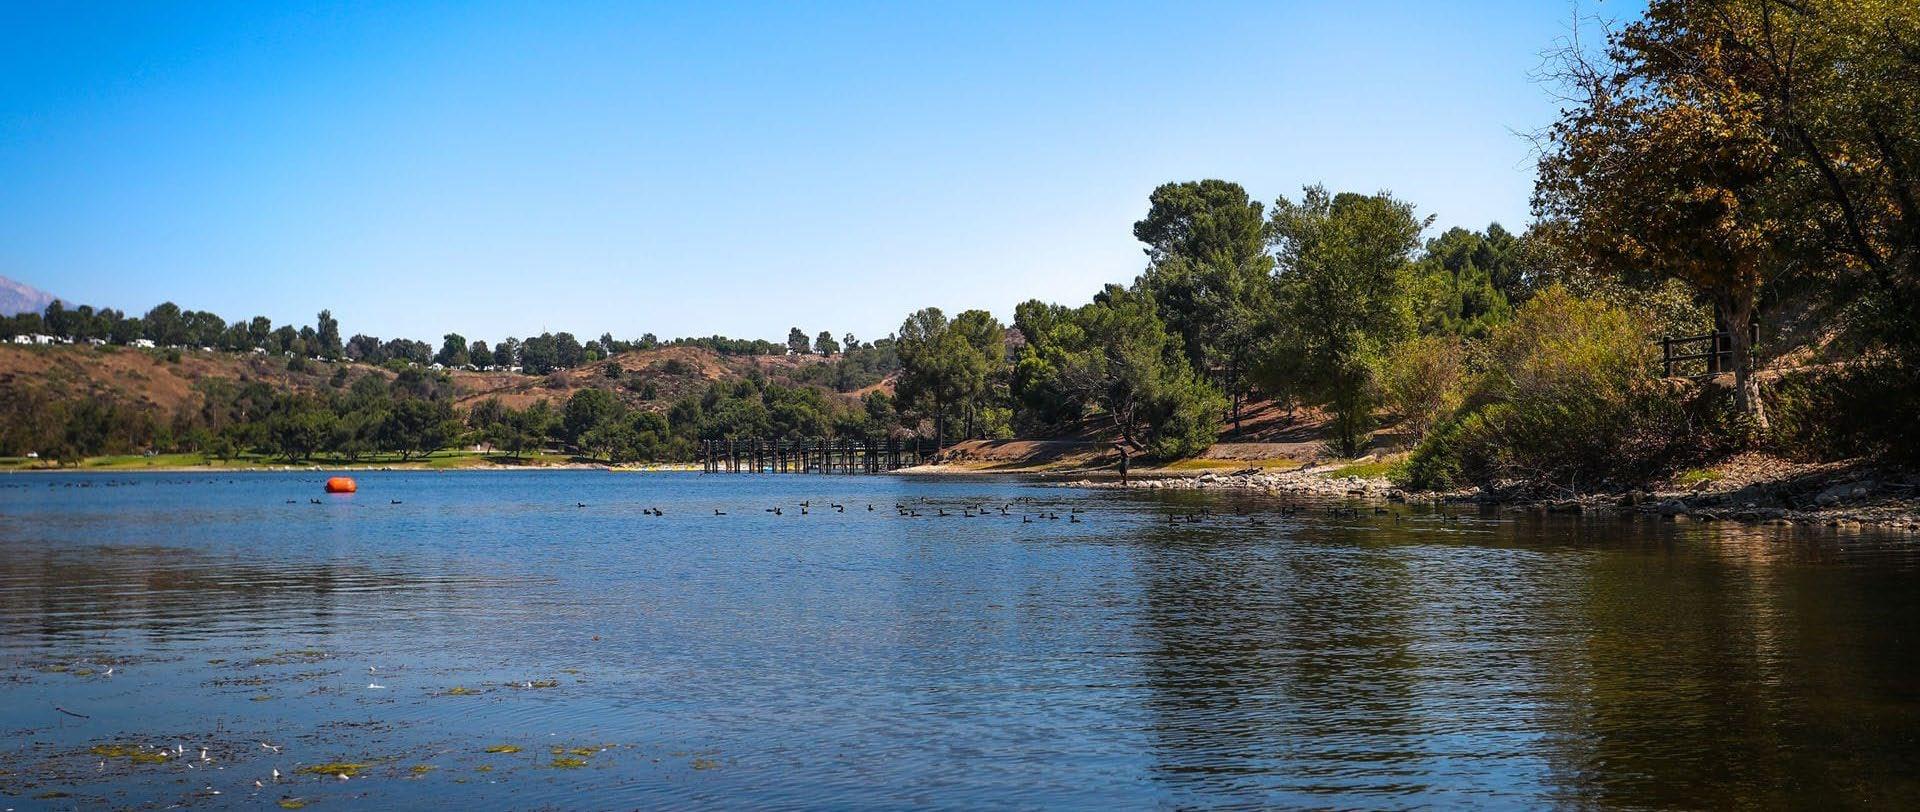
Bonelli Park is a regional park located in San Dimas, just south of the southern tip of La Verne’s city boundary. The park encompasses the Puddingstone Reservoir, and includes amenities such as boat launching areas, camping sites, playgrounds, concession stands, an equestrian center, equestrian staging areas, hiking trails, softball fields, swimming beaches, and restroom facilities.
Joint-use agreements between the City, schools, universities, and other non-City owned and operated entities provide additional park and recreation opportunities for those playing and recreating in La Verne.
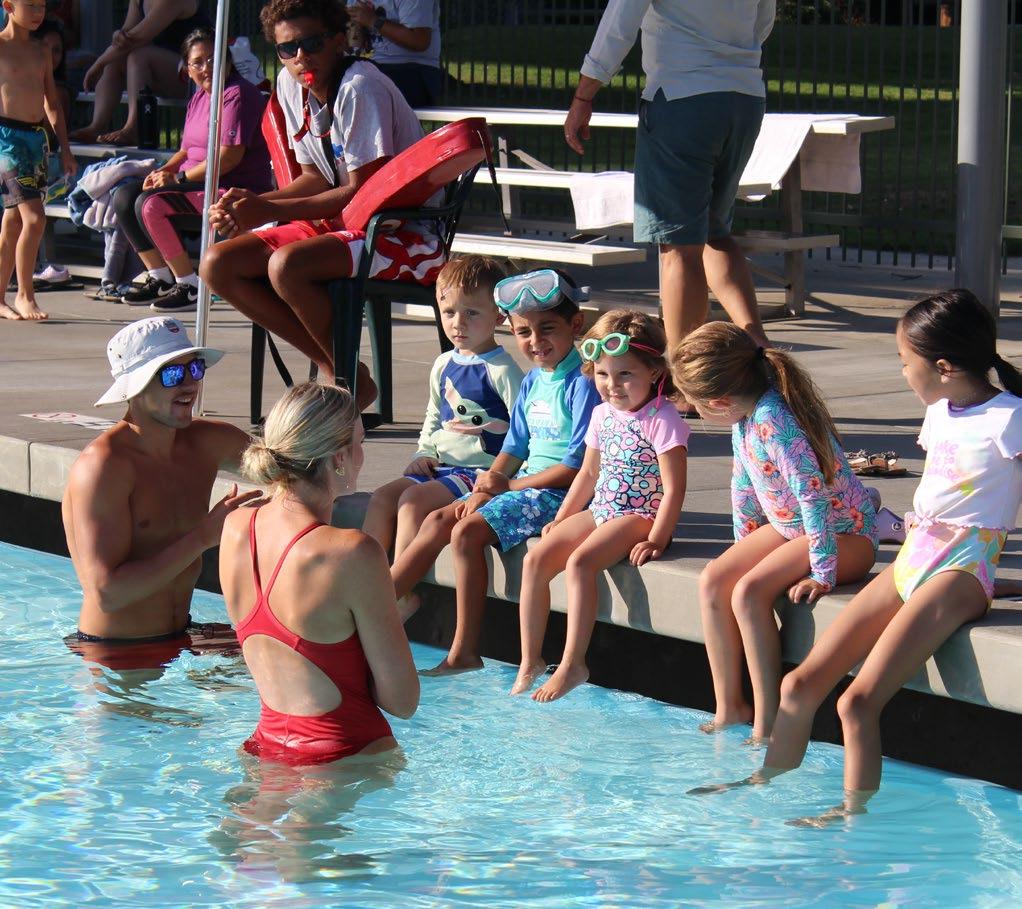
Joint-use agreements with Bonita Unified School District and the University of La Verne have allowed for the access and use of a number of playgrounds, sports courts, multipurpose fields, aquatic facilities, stadiums, gymnasiums, and more.
These agreements are primarily used for practices and games of various sports teams. Table 2-4 describes the current facilities. Acreages listed below are not counted in full towards the overall park level-of-service; only 25 percent of the total JUA park acreage was counted towards park level-of-service.
A more detailed overview of partnership agreements, including financial arrangements and maintenance responsibilities, can be found in Chapter 3 and the Appendix D.

FACILITY OWNER/ OPERATOR
Oak Mesa Park
City of La Verne; Bonita Unified School District (BUSD)
Bonita High School/La Verne Sports Park & Skate Park
Las Flores Park & Aquatic Center
City of La Verne; BUSD
Upper Grades ‘Hardcourt’ Area, Playground Equipment Park Playfields, Parking Lot
District maintains all school property and the City maintains all park property.
Skate park: City is solely responsible for all operations and maintenance of the facility.
Baseball and MultiUse Athletic Fields, Glenn Davis Stadium, Gymnasium, Tennis Courts, Park Playfields Parking Lot, Skate Park
City of La Verne; BUSD; ULV
Swimming Pool, Locker Rooms
La Verne Sports park: Shared responsibility (all); City manages contract with a third-party landscaping company (turf areas); District responsible for tree and shrub care; City sweeps parking lot at least twice per year.
Las Flores Park: maintained by City
Aquatic Center: City manages contract with a third-party cleaning company for swimming pool and building and decking is a joint responsibility on a rotating basis (in four-month intervals).
• BUSD has exclusive access of amenities during schools hours during the school year
• Playfields may only be used by youth sports organizations
• Hardcourts may be used for community recreation programs
• BUSD has exclusive access of amenities during school hours during the school year, and priority use outside of the school year
• City has right to schedule recreation programs during non-school hours
• BUSD and City may rent out facilities to a third party during non-school time
• BUSD and ULV have priority access for competitive aquatic athletic participation
• City may rent out facilities to a third party
University of La Verne Campus West
University of La Verne (ULV); City of La Verne
Oak Park Metropolitian Water District of Southern California
La Verne Heritage Foundation City of La Verne
Baseball Stadium, Softball Field, MultiUse Field, Tennis Courts, Parking Lot
Live Oak Park
City-owned property adjacent to the east of Heritage Park which includes the historic structure, fruit orchard, and barn areas
Lutheran High School Lewis Land Developers Gymnasium and Outdoor Field
University responsible for normal maintenance; City responsible for leaving facilities orderly after use; cost of additional maintenance and repair dependent on party used.
City maintains all park property
City and Foundation each maintain their designated area and facilities of Heritage Park
in lieu of a license fee, City responsible for all maintenance and utilities
• ULV has exclusive use of stadiums in September/October and January through May
• City, community, and public may access multi-purpose field during non-ULV time and during summer
• ULV may rent out facilities to a third party
• Road, parking, equestrian trail, recreation and the development of recreation facilities
• Foundation is authorized to use portion of Heritage Park for the preservation and exhibition of historical structures/artifacts and conduct special events
• City may permit uses of facility for programs such as volleyball and soccer.
A park Level of Service (LOS) analysis is a method of measurement used in park planning to evaluate how parks, open spaces, and facilities serve a given community. The analysis in this Plan uses three types of park LOS analyses to determine the overall park LOS for La Verne.
1. Population-based LOS analysis uses population and park acres to determine LOS.
2. Amenity LOS analysis uses population and park amenity counts and compares them to national averages to determine park LOS.
3. Accessibility analysis LOS uses residential population density and park locations to determine the accessible distance to travel to get to a park.
These three LOS analysis methods provided the planning team with the quantitative data needed to determine how well the existing park system serves the community. This data is complemented by qualitative input gathered from the community members, stakeholders, and City staff.
A population-based park acreage level of service analysis demonstrates the extent to which the City is meeting its established goal of providing four acres of parkland for every 1,000 residents. Table 2-5 shows the existing LOS is 4.01 park acres per 1,000 residents, which is a slight 0.01 surplus over the City’s goal of 4.0 acres per 1,000 residents.
According to projection data from the Southern California Association of Governments (SCAG), the City of La Verne will only see a very minimal increase in population over the next decade, from about 31,500 in 2019 to 32,000 in 2035. This projection indicates the projected growth will result in a slight deficit of 0.07 acres of parkland for every 1,000 people.
Table 2-5: La Verne Population Level of Service
A detailed citywide amenity inventory was collected as a part of park fieldwork. This amenity inventory was used to inform the amenity level-of-service analysis. The amenity level-of-service was performed using National Recreation and Park Association NRPA park metric averages of similar sized cities from 2008-2023. The NRPA metrics are based on the results of a comprehensive national survey of parks and recreation agencies. These NRPA metrics are used by the project team as guidelines for best practices.
Table 2-6 displays the amenity LOS based on the NRPA guidelines for cities within the same population category as La Verne. Amenities shaded in green meet the needs of the population, amenities in yellow are on the cusp of meeting the needs, and amenities in orange do not meet the need of the population.
While the amenity LOS analysis serves as a powerful indicator of identifying deficits, it should not be the only indicator for identifying amenity shortfalls. It is important to also consider regional trends and needs identified during the outreach process.
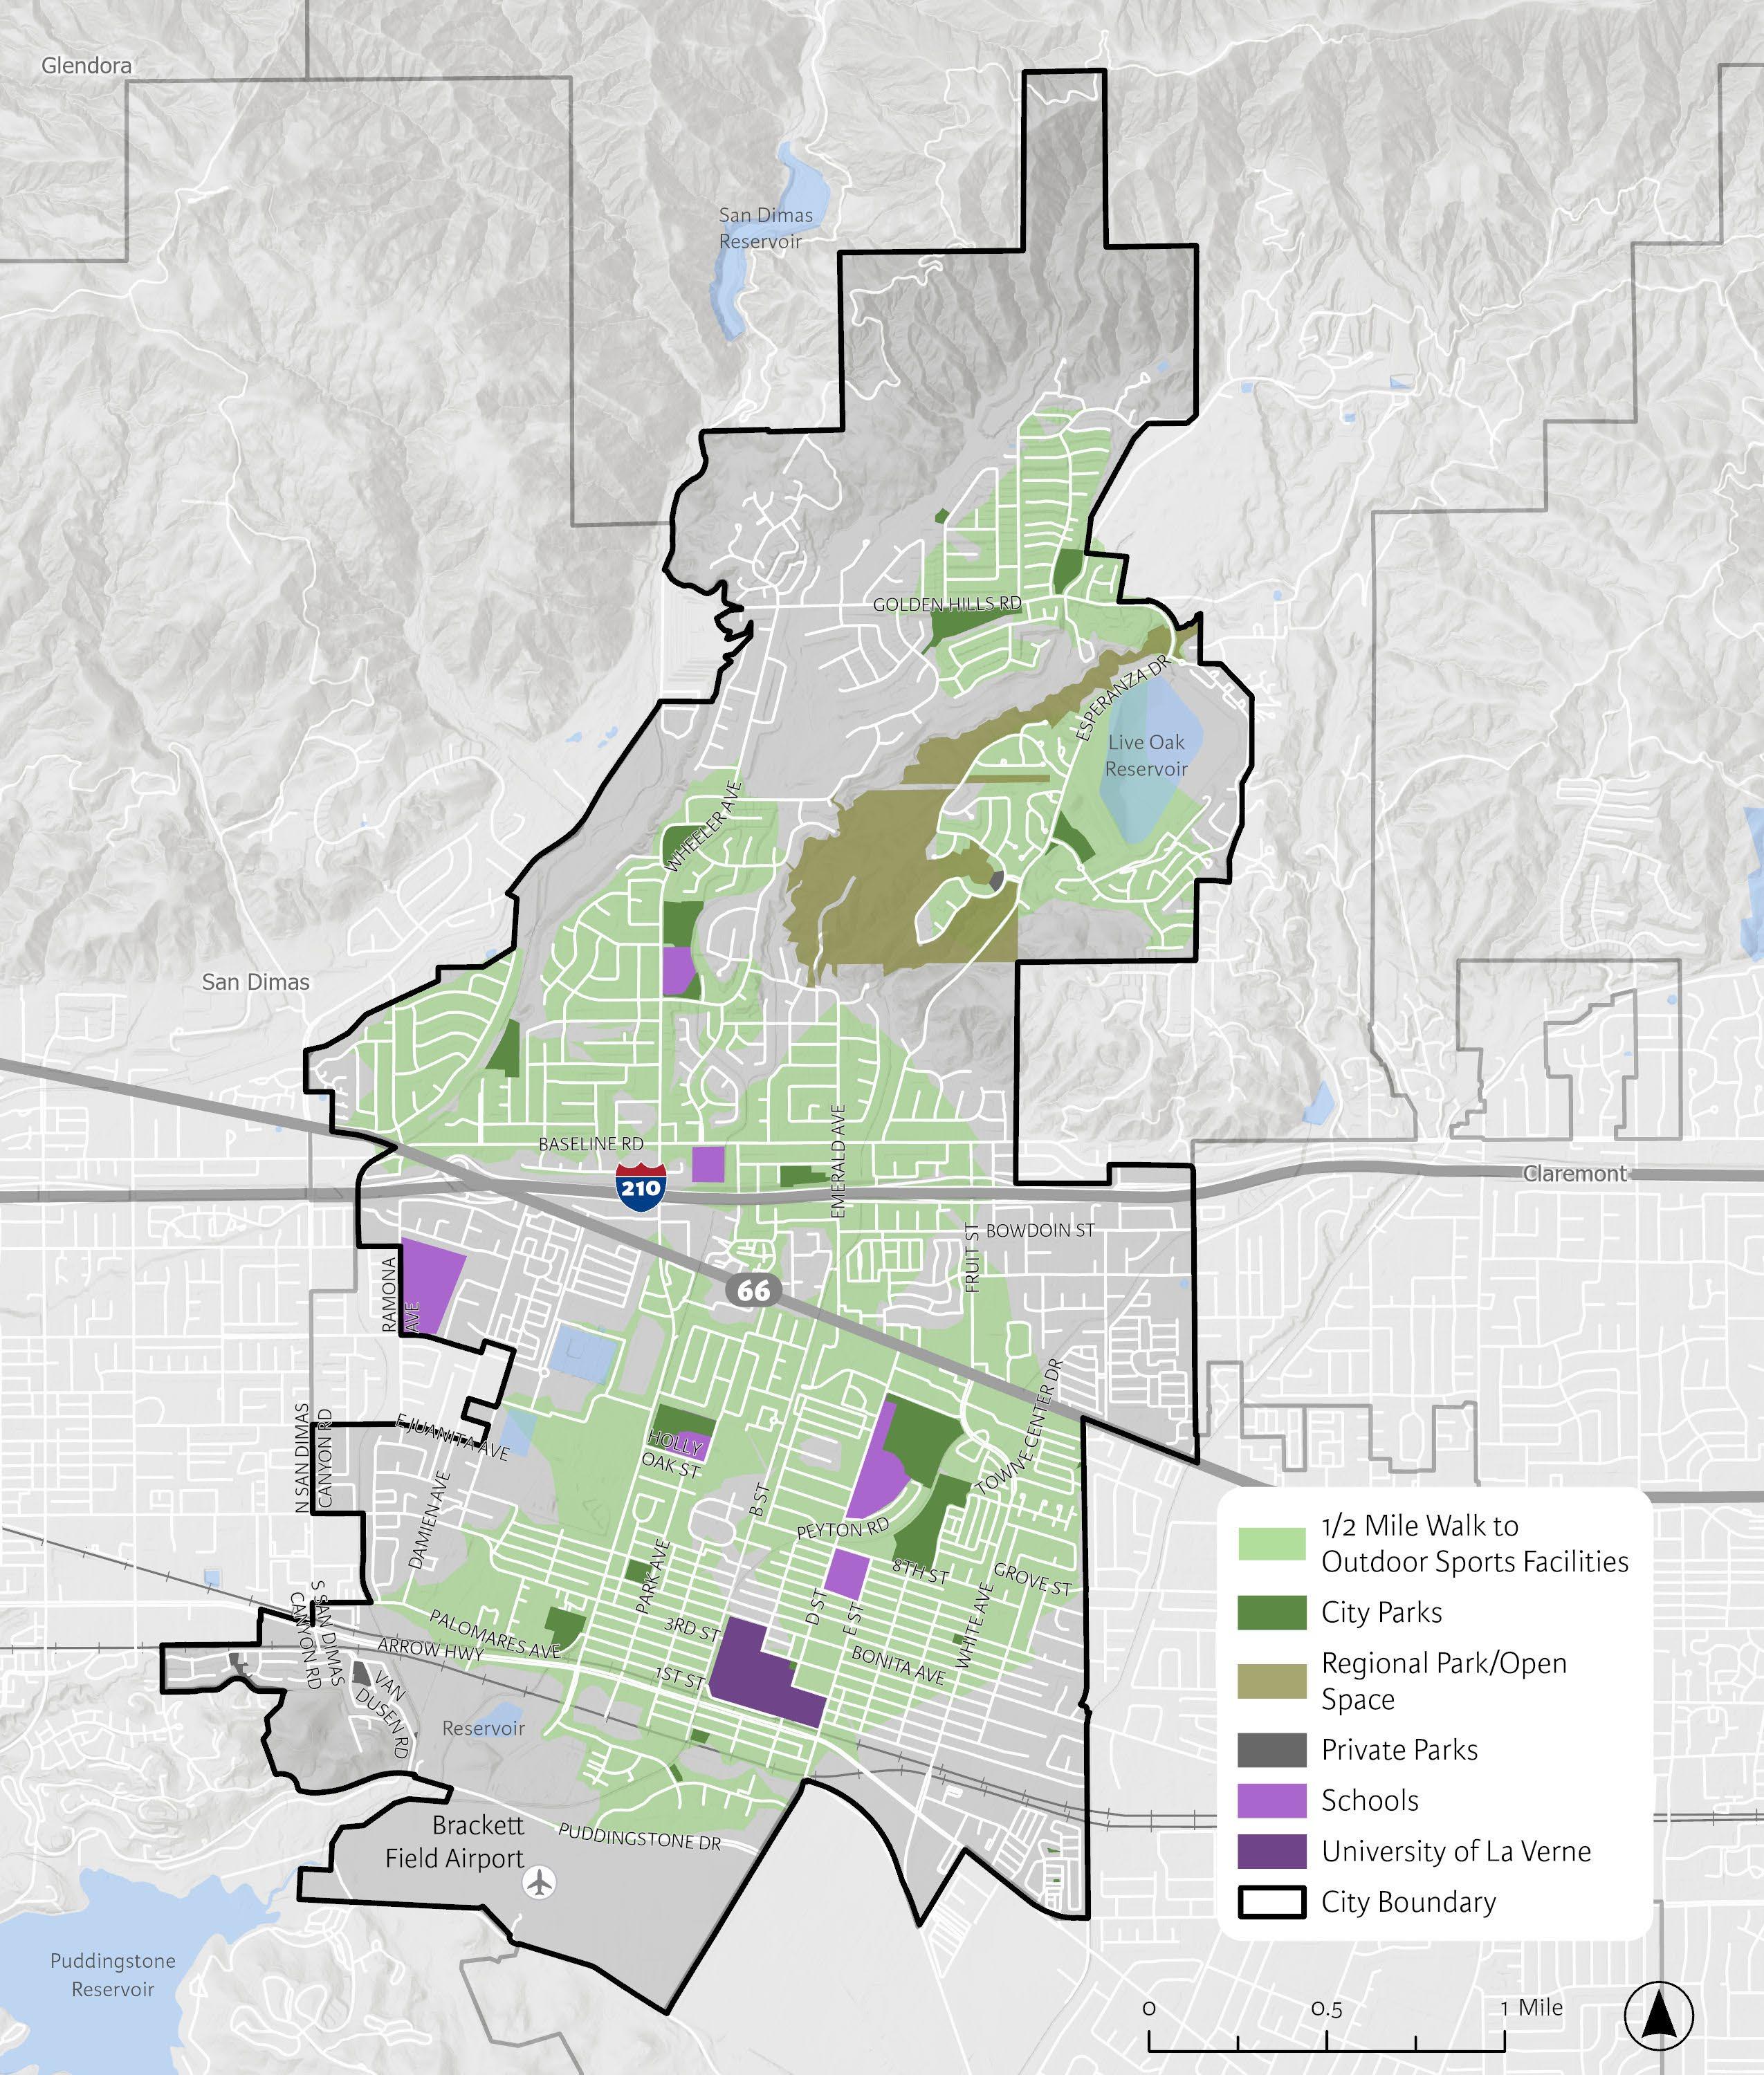
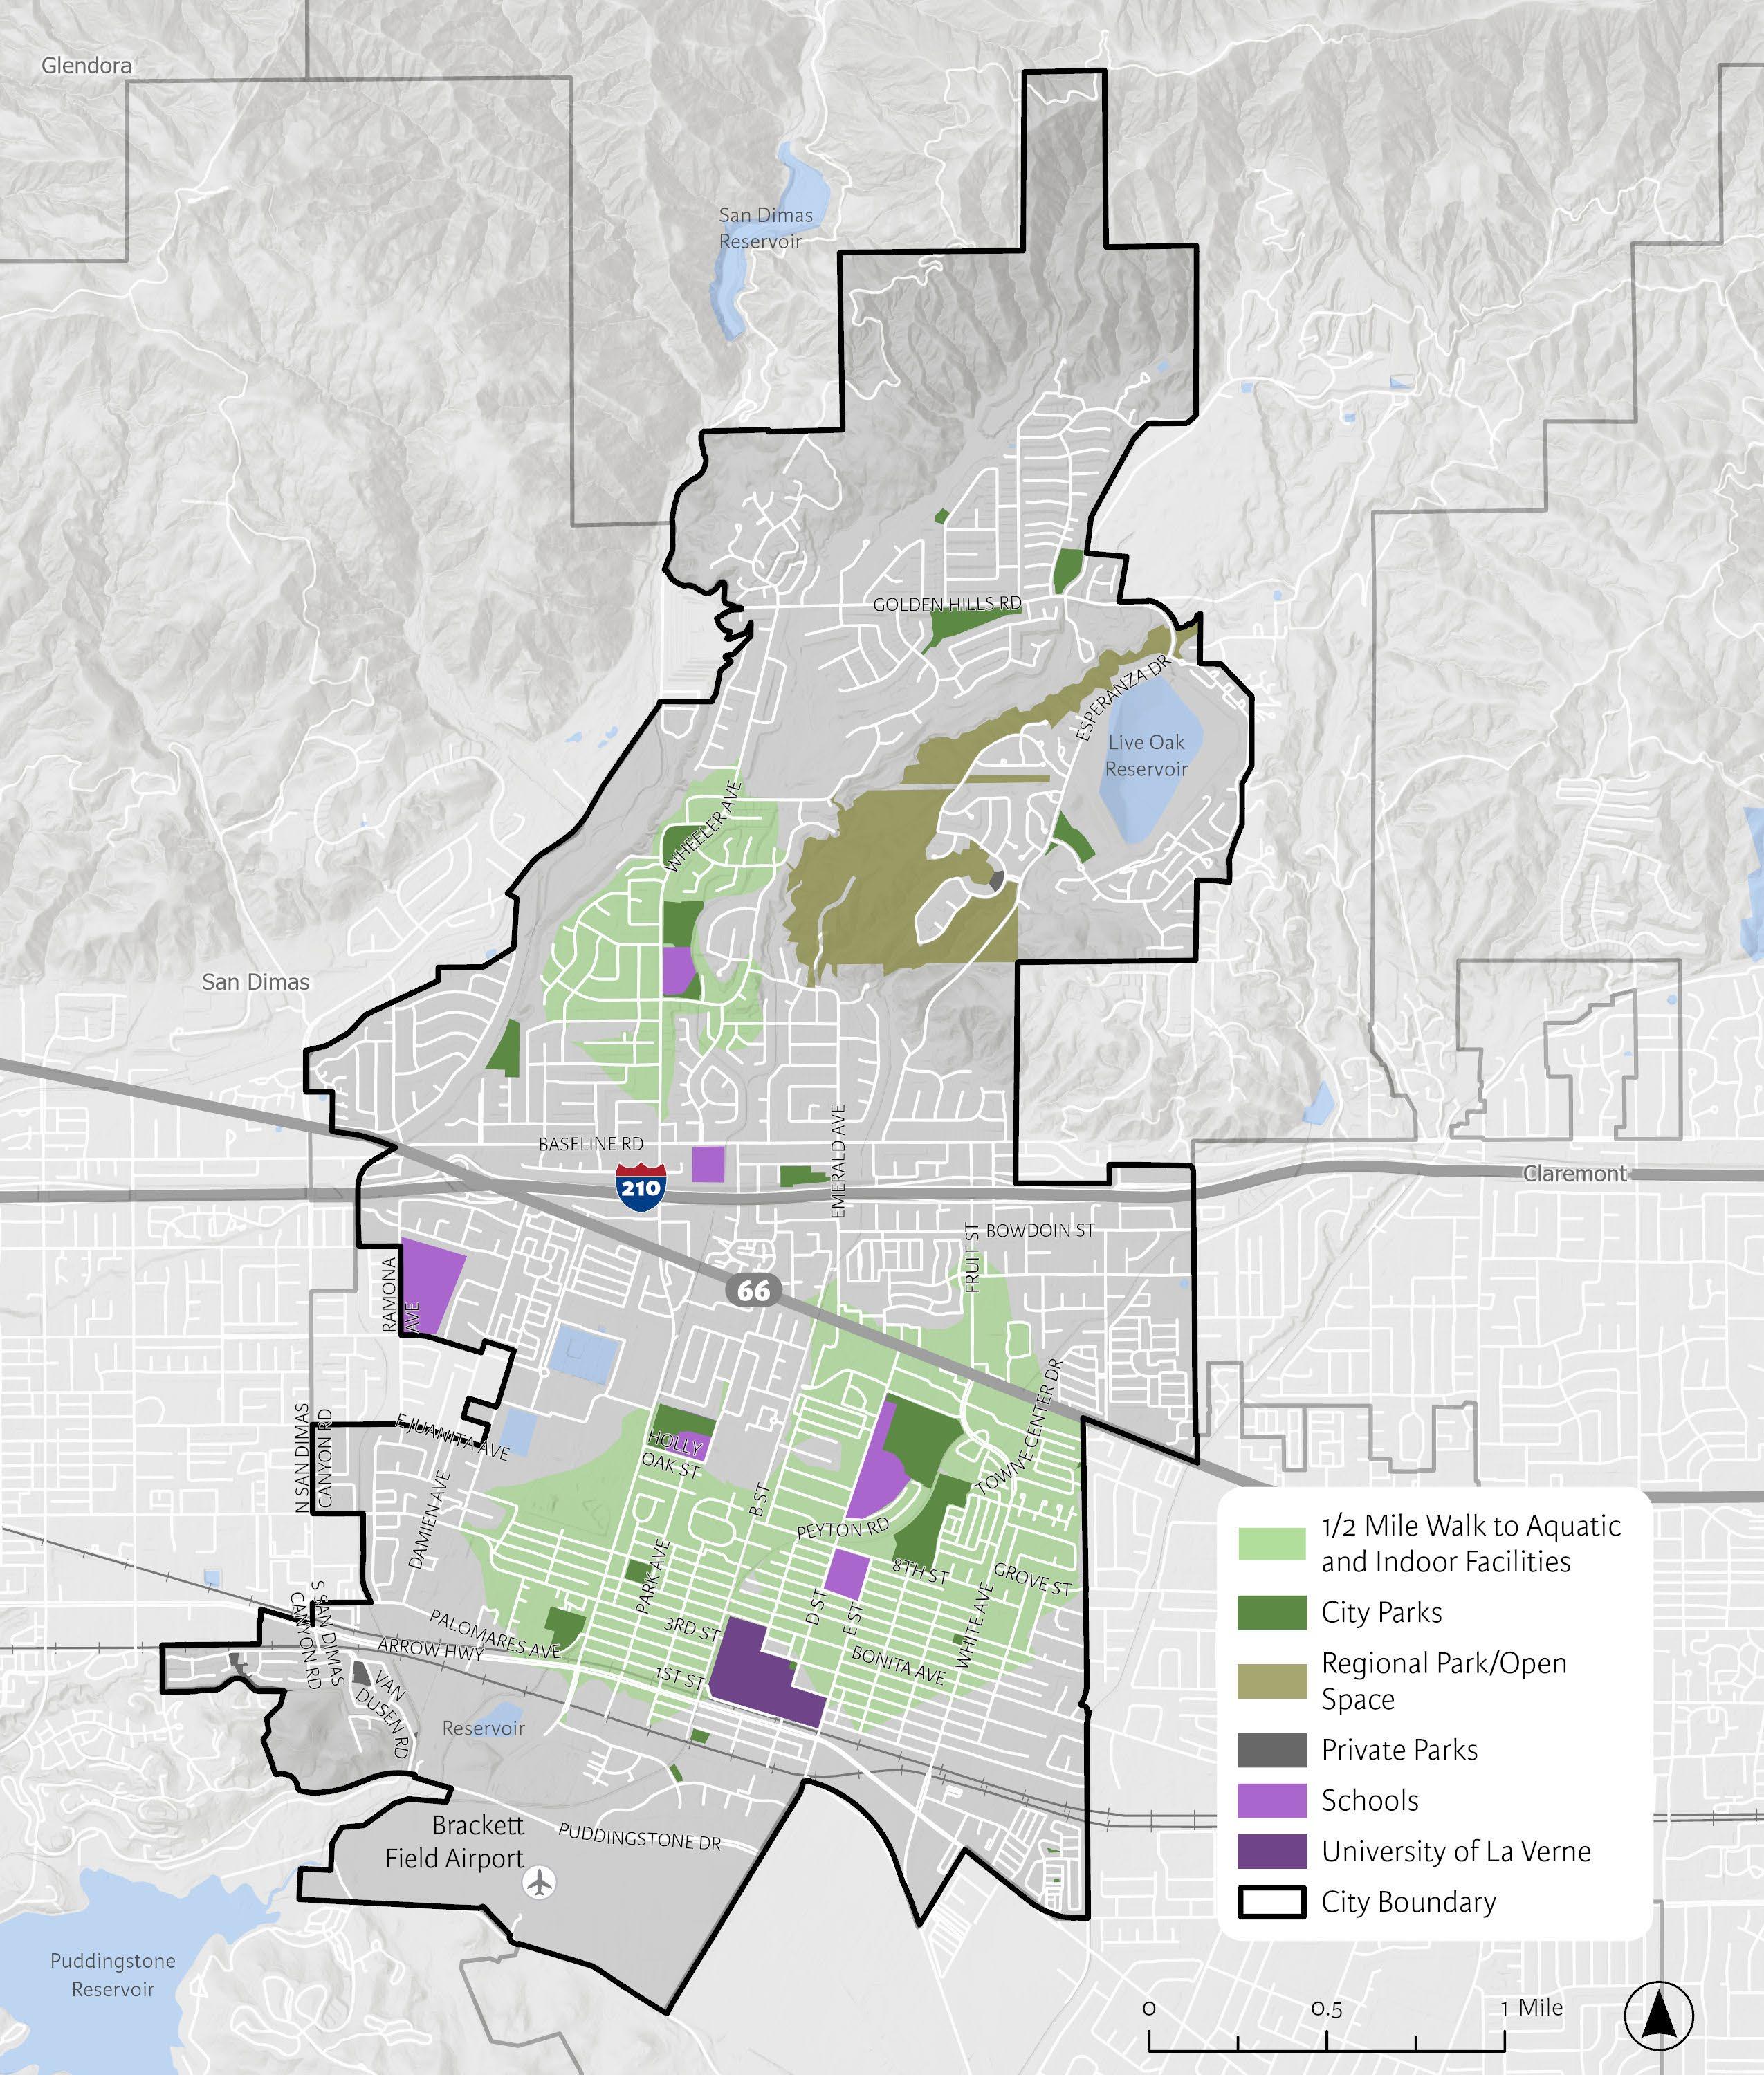
A level of service analysis was conducted to identify the availability of parks and recreation facilities within the geographical distribution of the city. The analysis visualizes which residential areas currently have easy walking access to a park or recreation facility and which do not by displaying the areas within a 10-minute walk (or half-mile) of each park facility. Instead of showing a simple half-mile radius of the area surrounding each park facility, the analysis uses the actual road network to generate the “walkable service area” around each park by using viable routes based on the actual road network and park access points. The analysis draws attention to opportunities to improve sidewalks, trails, and roads, to increase access to parks and facilities.
Most importantly, the analysis highlights residential areas without easy access to a park or facility. Results from this analysis are displayed in Figure 2-2 through Figure 2-5. The green hatch pattern displays areas within a 10-minute walk to a park. Most of La Verne’s residential areas are already access within a 10-minute walk (or half mile) but there are some service gaps to the east and west areas of the city.
This analysis is part of a national initiative led by The Trust for Public Land (TPL), in partnership with NRPA and the Urban Land Institute. This movement, known as the 10-Minute Walk, aims to ensure that by 2050, everyone in the United States has safe and easy access to a park within a 10-minute walk of their home. The 10-minute walk benchmark is recognized nationally as a best practice and standard for creating equitable and accessible parks and recreation systems.
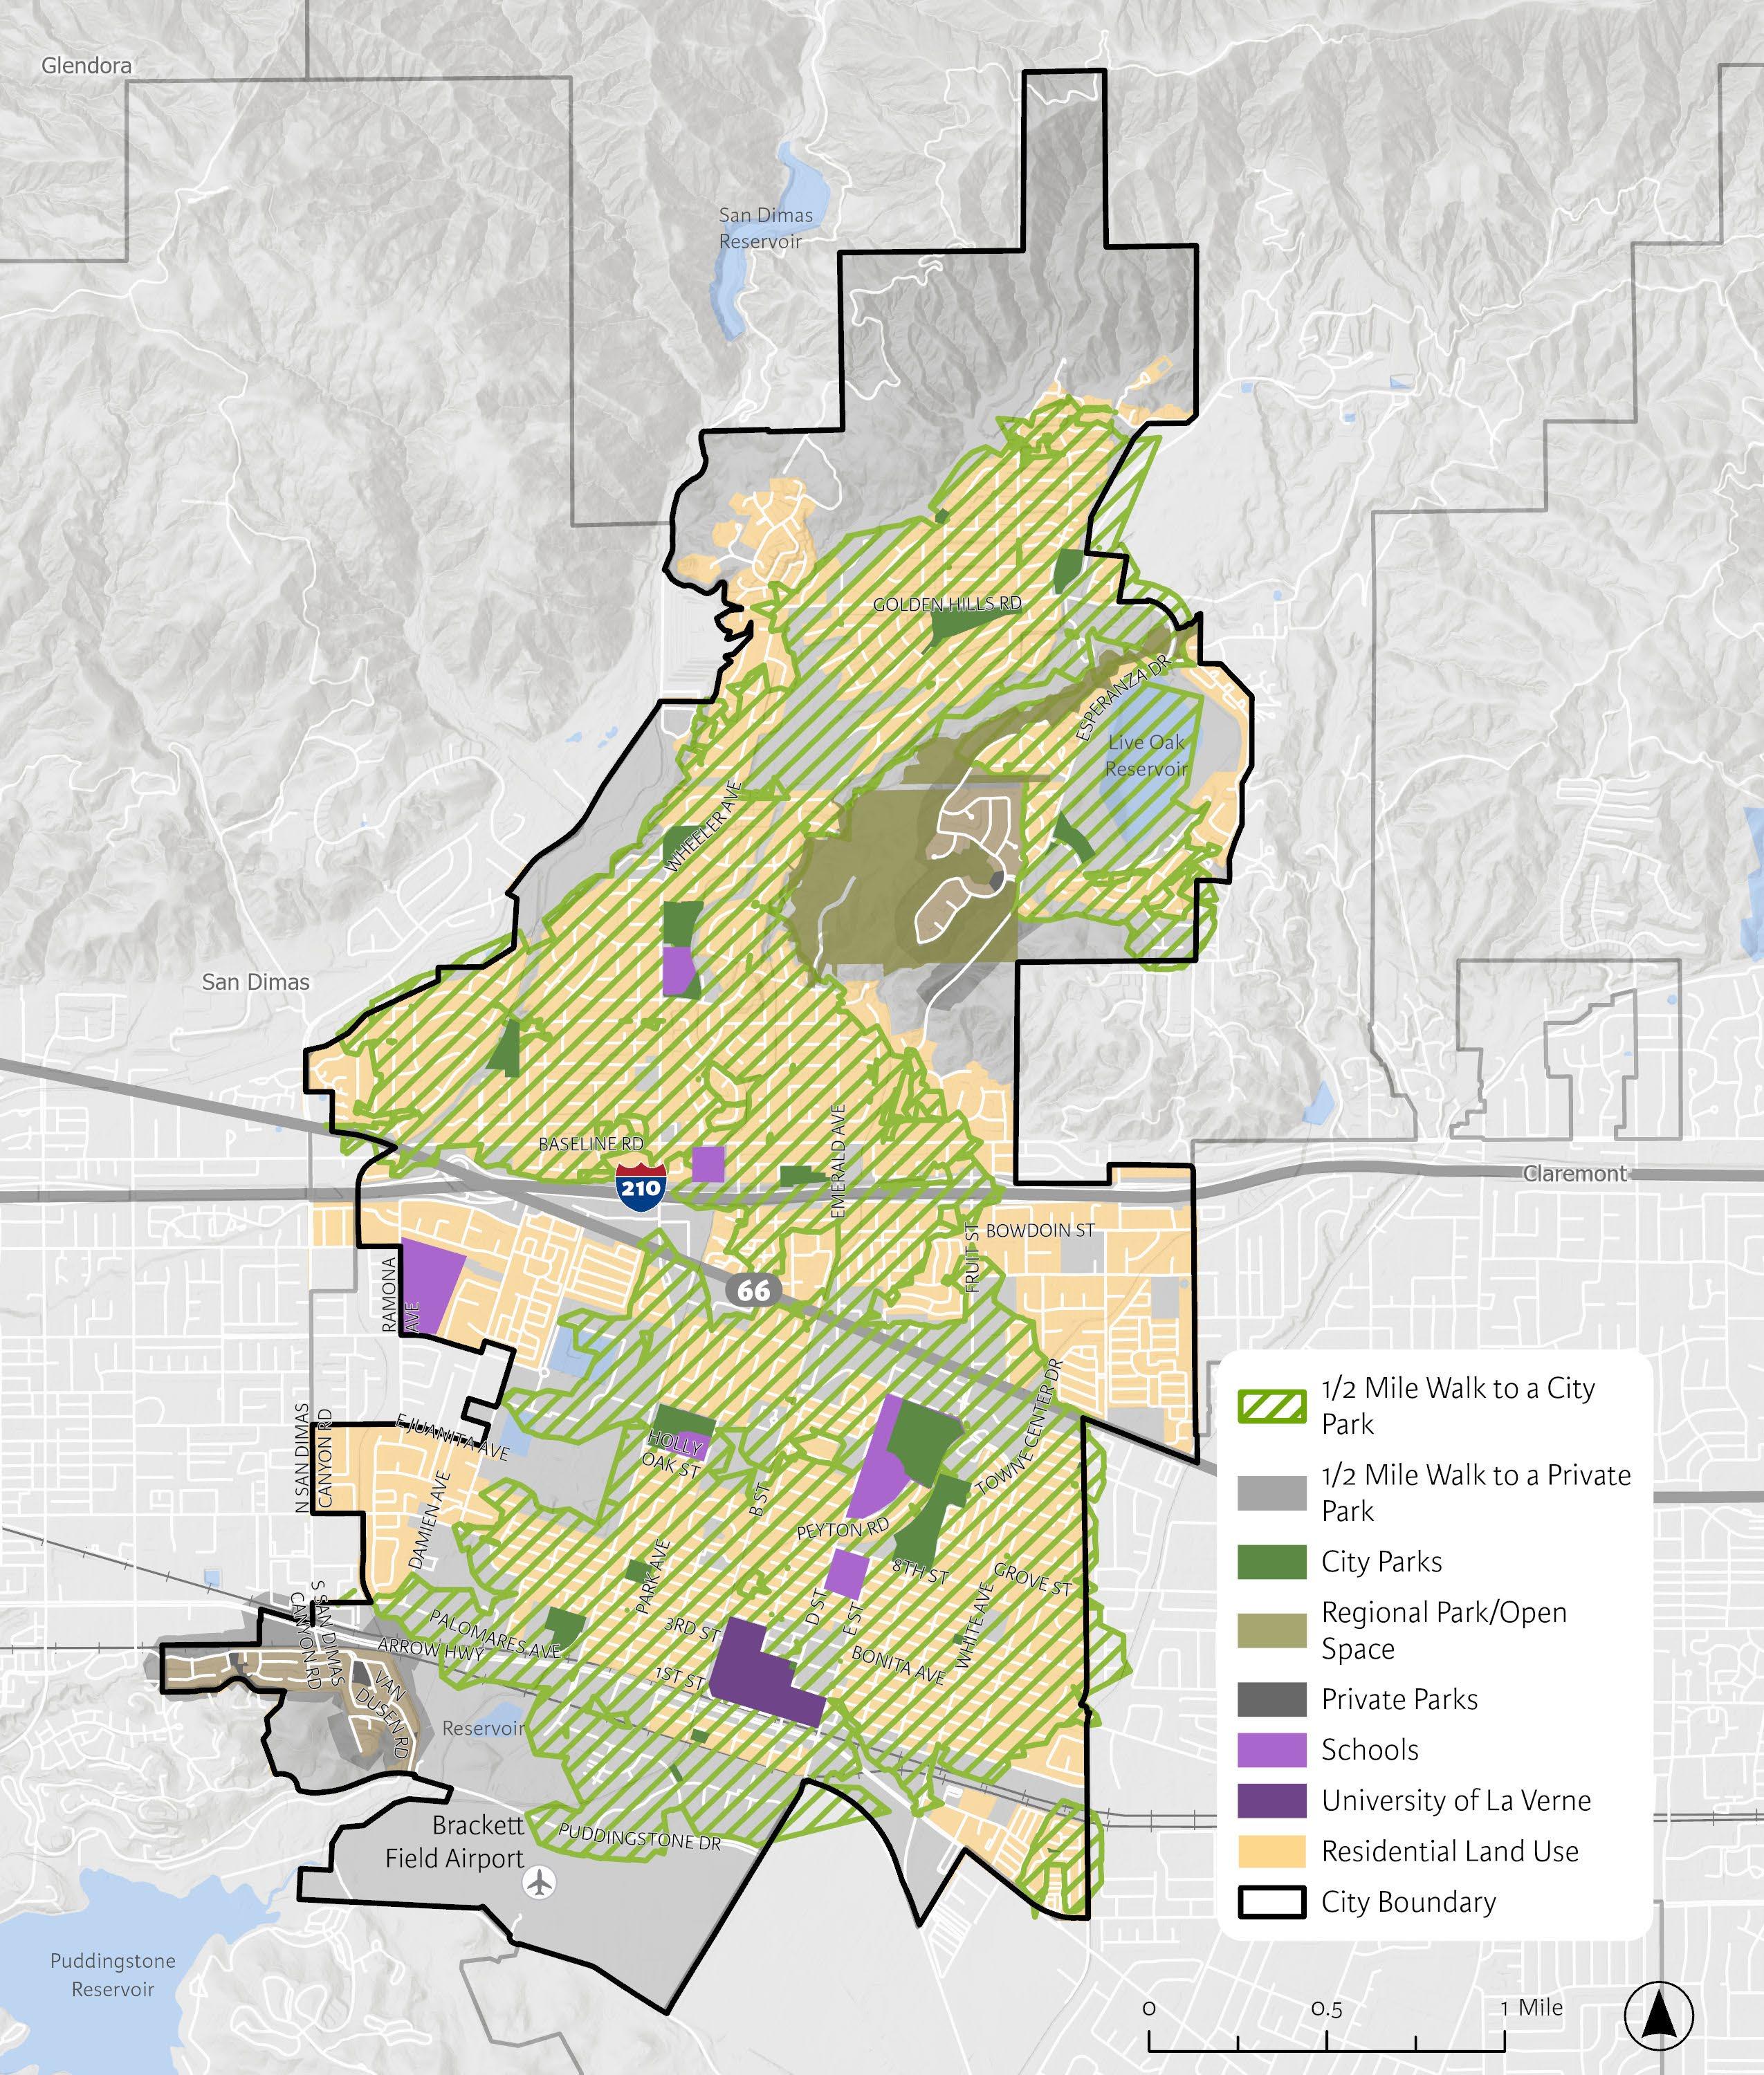
Additional mapped travelshed analyses were generated for playgrounds, outdoor sports facilities, aquatic facilities, and indoor facilities. The largest gap identified is on the aquatic facilities and indoor facilities map. This is consistent with the amenity level of service in Table 2-6, which reveals a deficit in amenities such as recreation centers, senior centers, teen centers, nature centers, splashpads, and swimming pools.
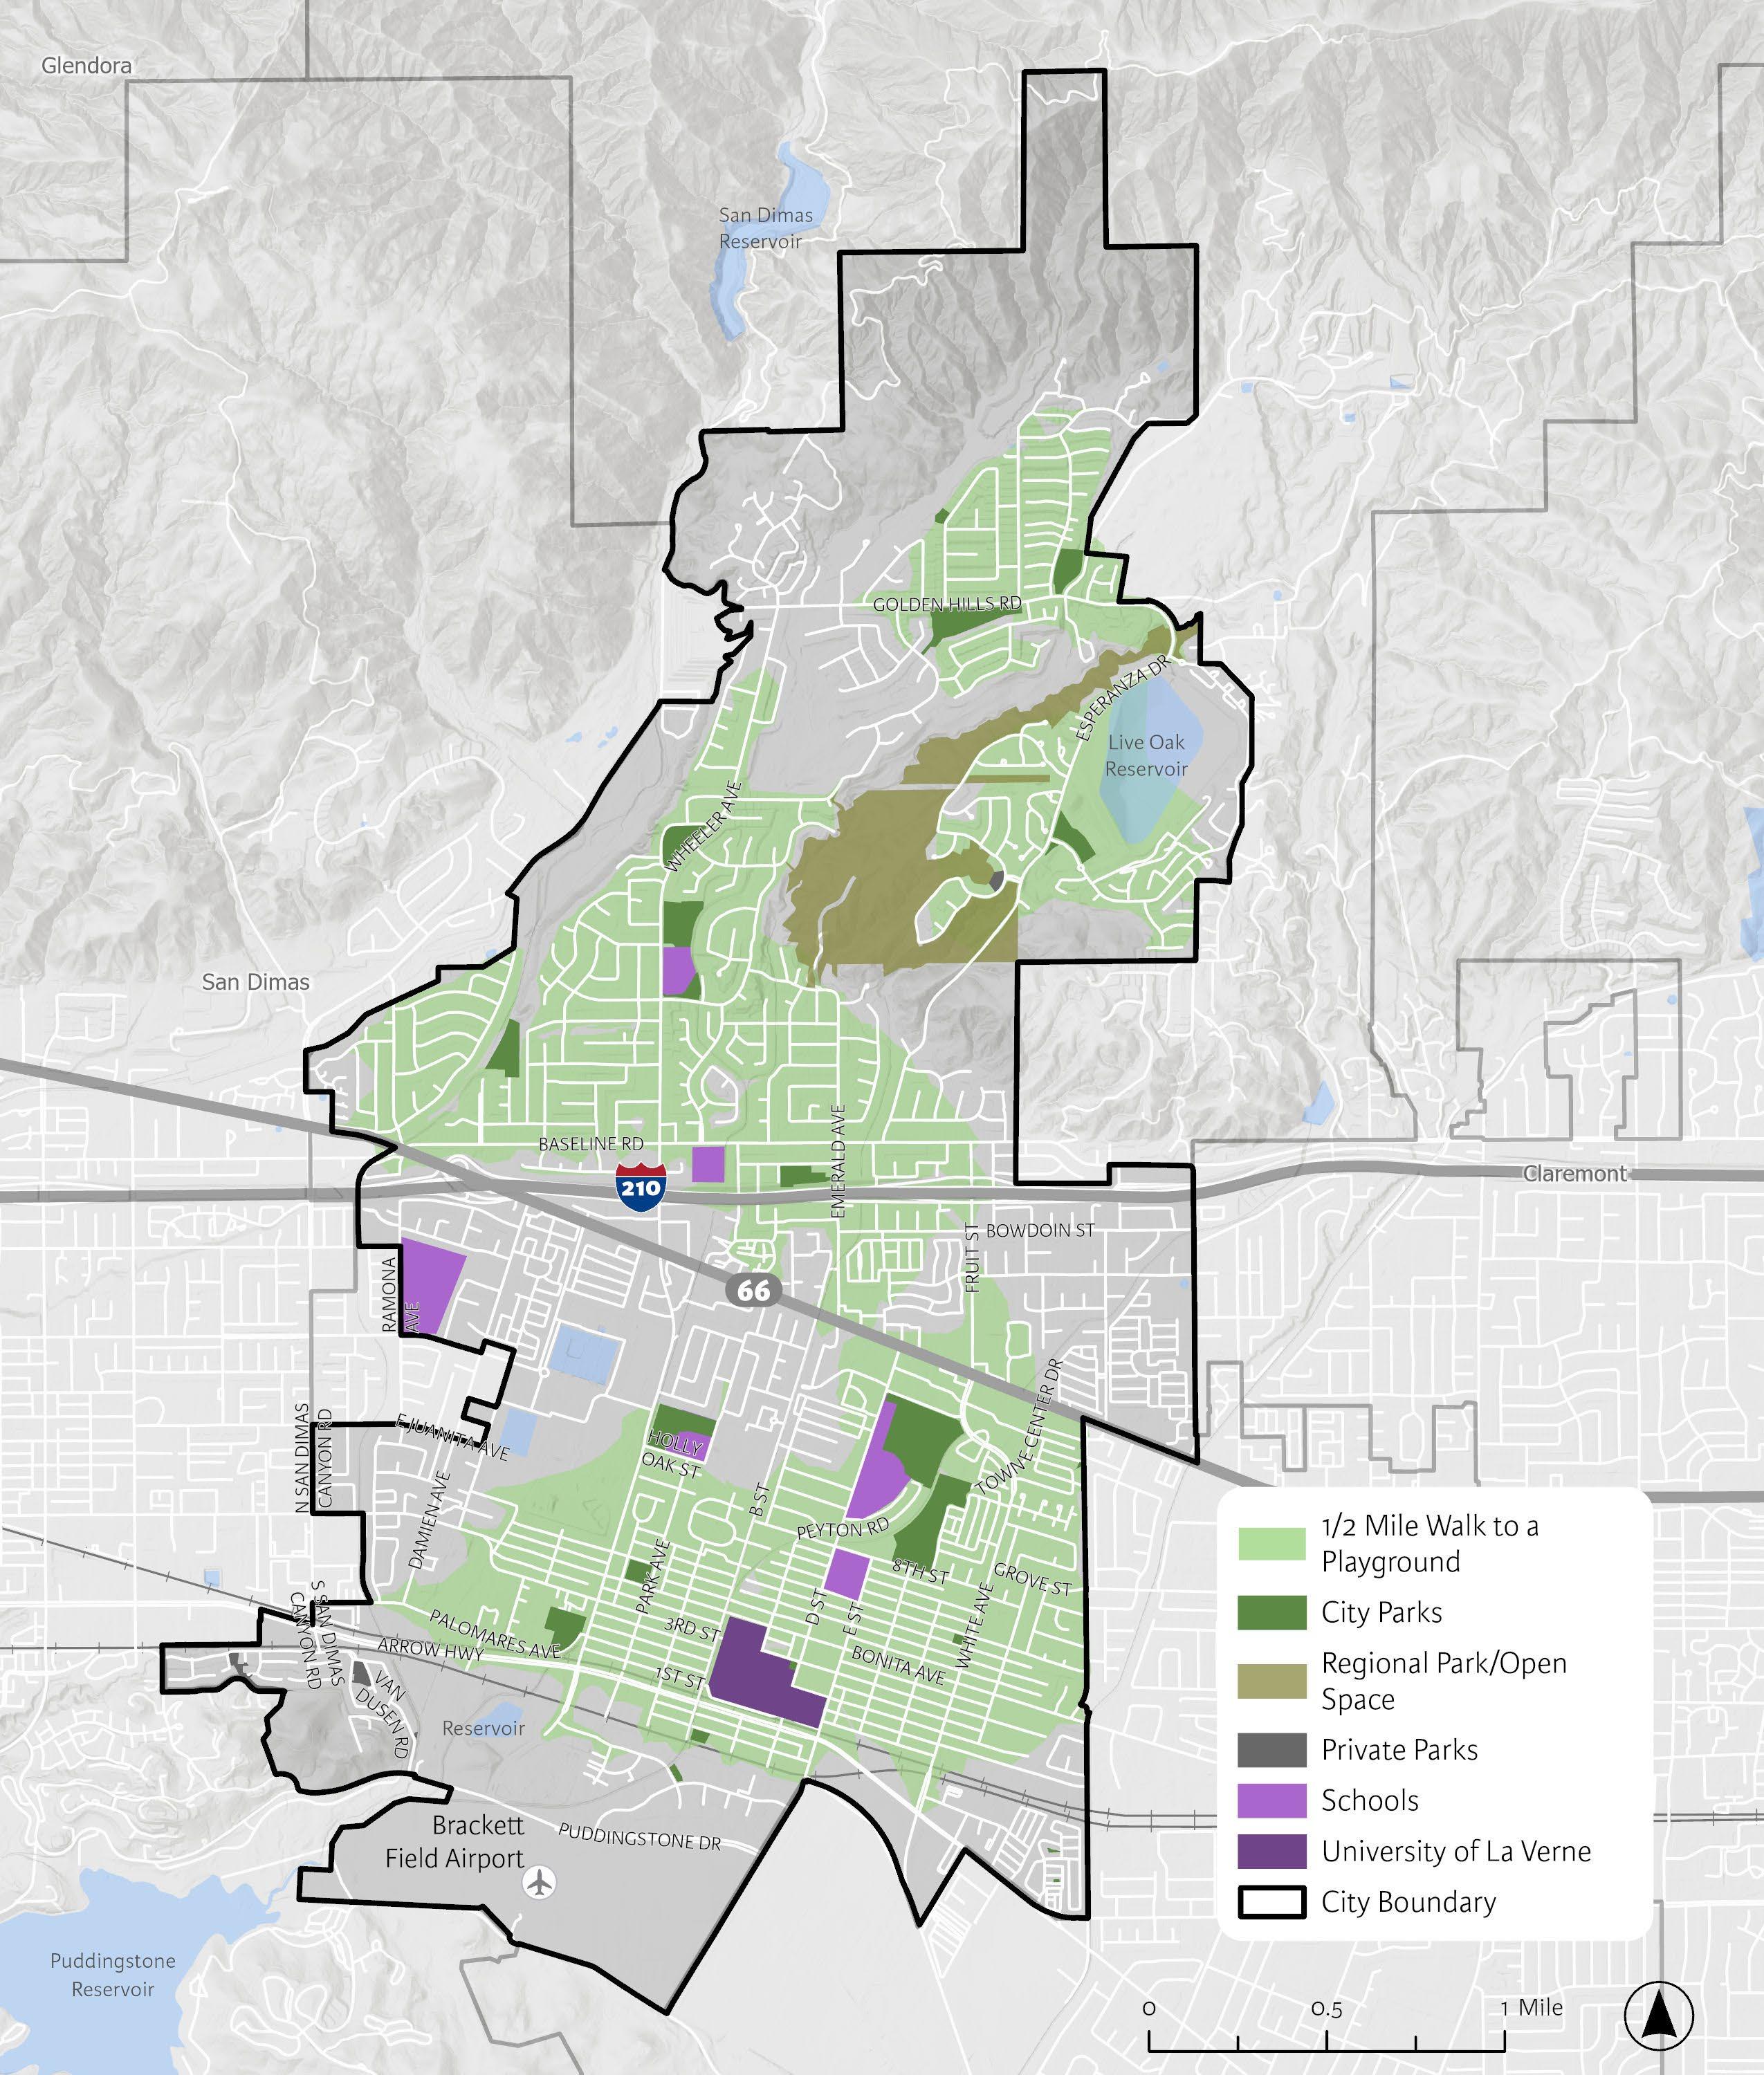
Playgrounds
Figure 2-3 displays the walkable area to playgrounds in La Verne. The map shows that most parks in La Verne contain a playground, with a few exceptions. Playground gaps are present in the central-west and central-east portions of the city.
Outdoor Sports Facilities
Figure 2-4 shows the walkable areas to outdoor sport facilities, which includes sports field and sports courts. Gaps exist in the north, central, and southeastern area of the city.
Indoor and Aquatic Facilities
Figure 2-5 displays the areas accessible within a 10-minute walk to an indoor recreation facility and the aquatic facility. Gaps are present north of Foothills Boulevard and the eastern area of the city.

Though parks, open space, and recreation facilities have consistently been shown to increase positive health outcomes, reduce chronic illness, and promote overall wellbeing, they are not always available at a consistent level among communities of varying racial and economic spectrums. A study conducted in 2023 by the National Equity Atlas found that residents in Los Angeles County are three times more likely to live in an area deficient in park neighborhoods. Additionally, the Los Angeles region is known to have the least amount of accessible park space of all major metropolitan areas.
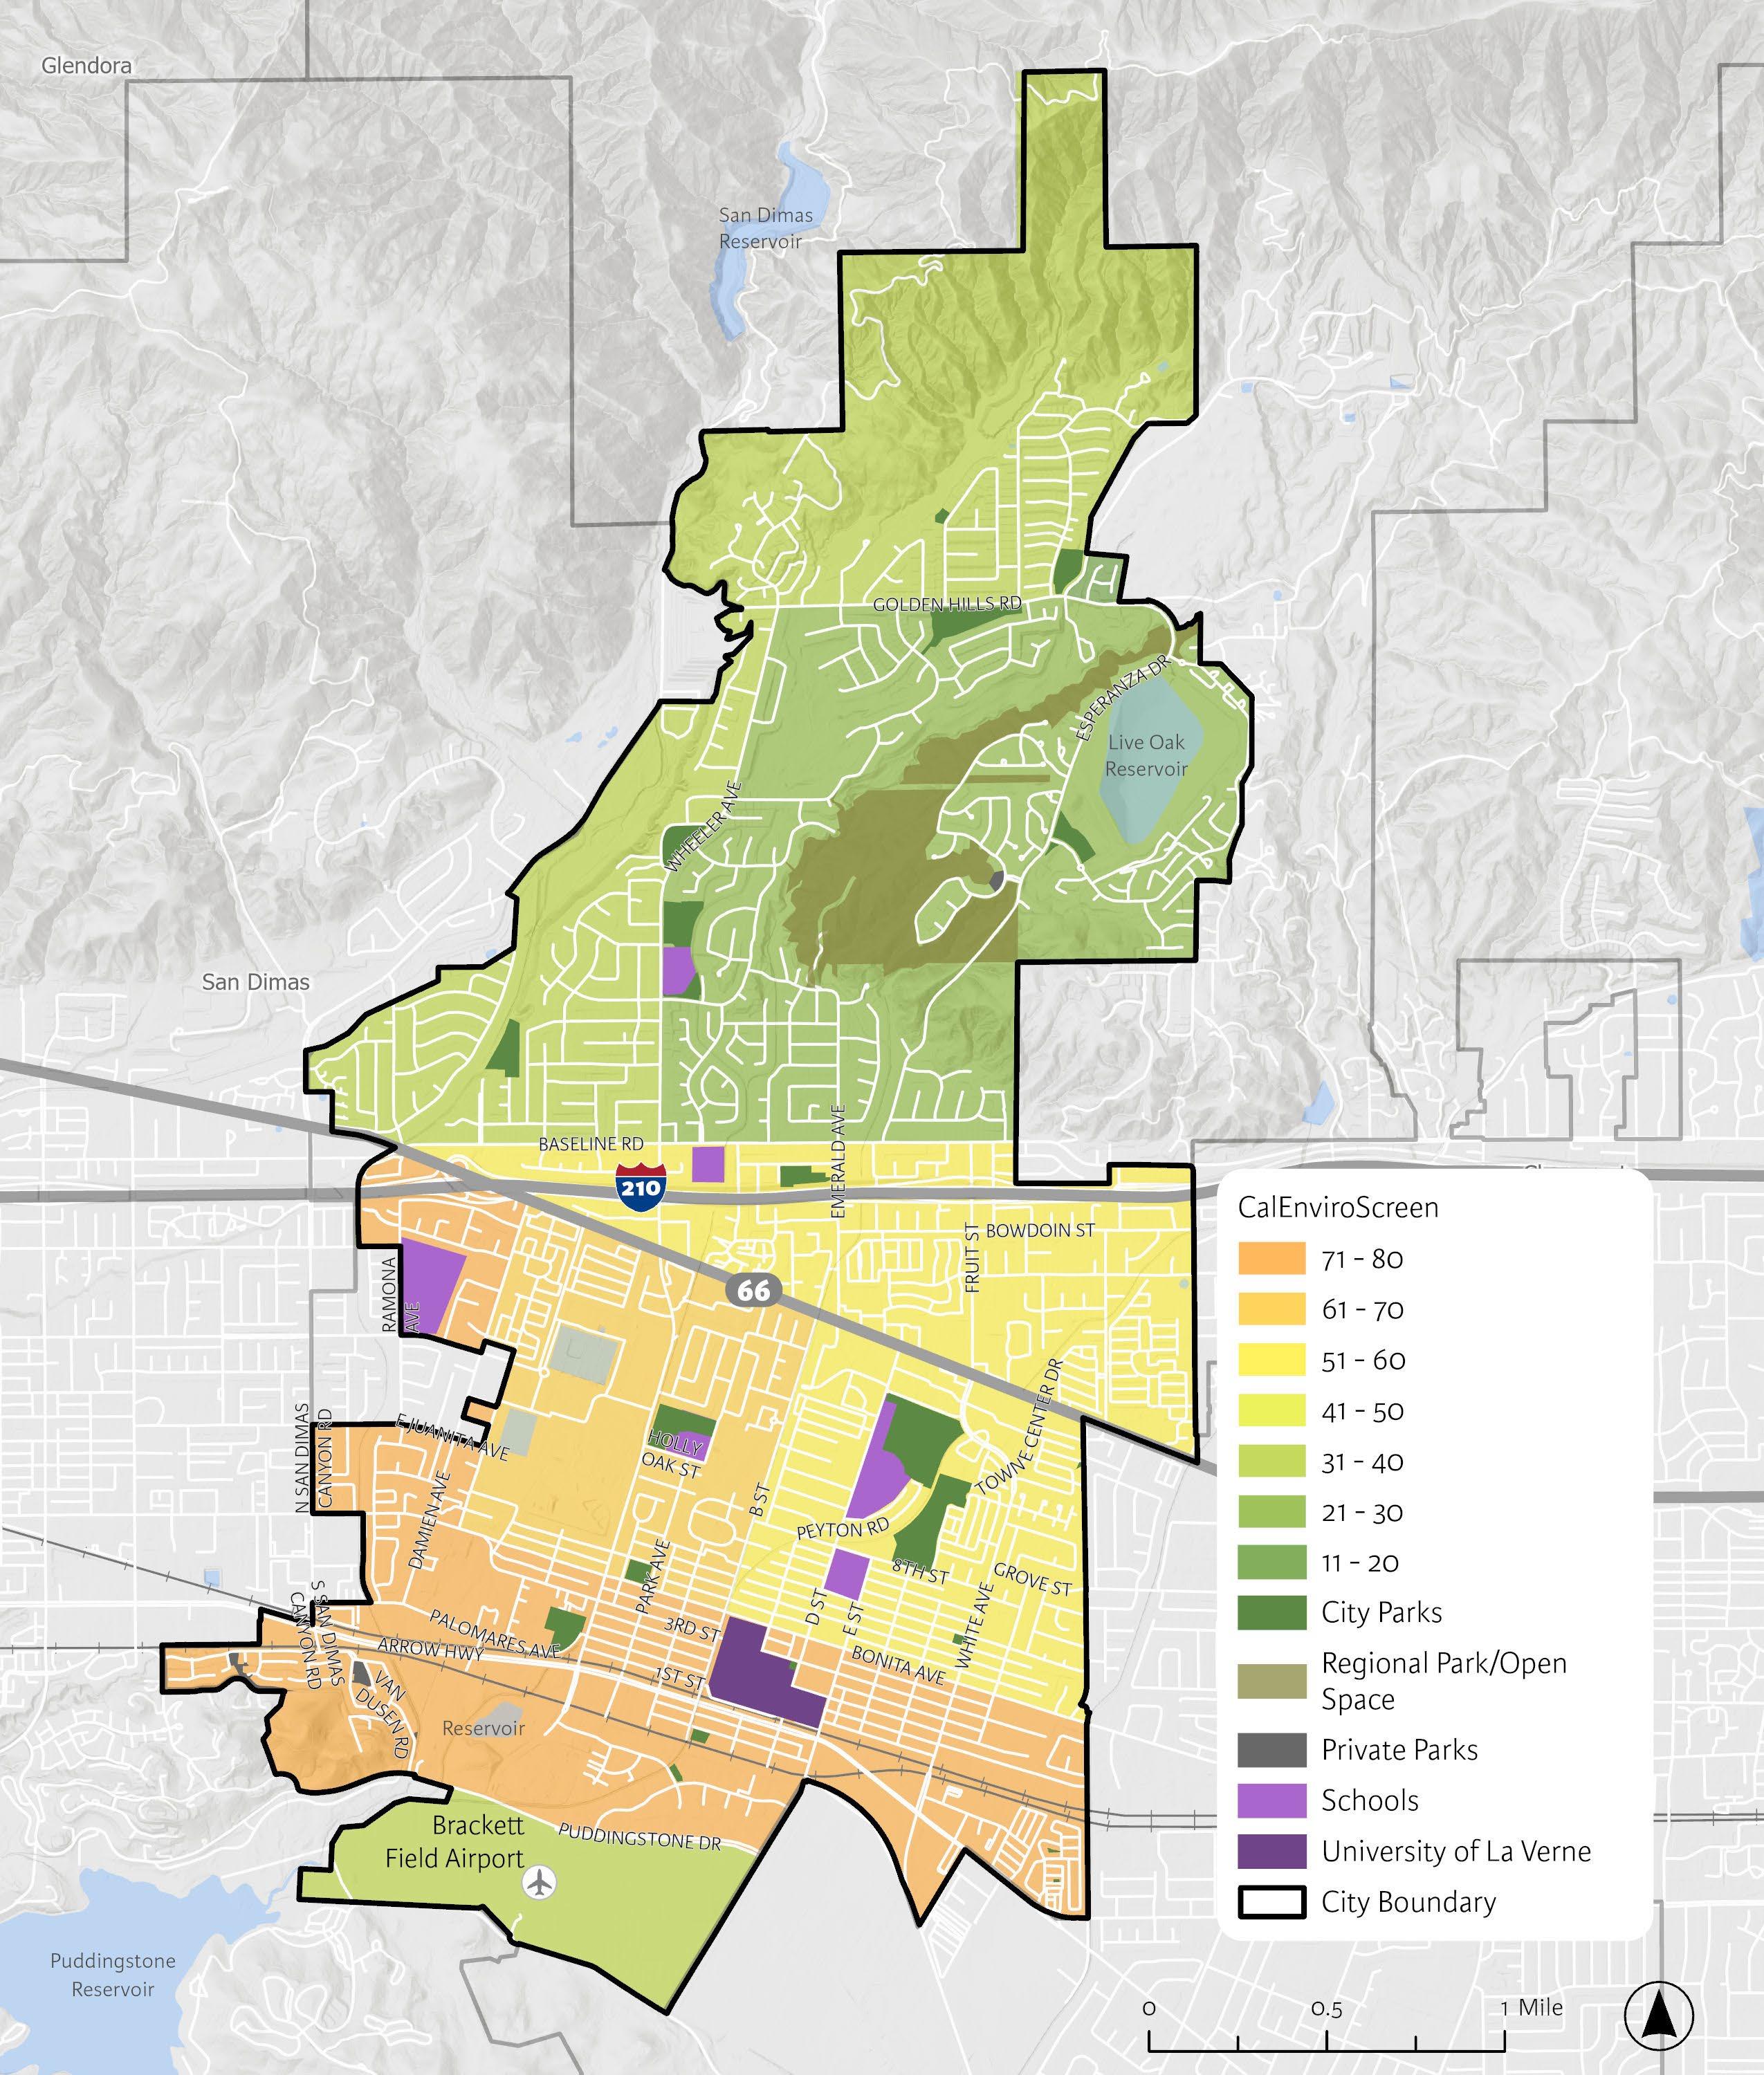
The use of mapping data ensures that disadvantaged portions of a general area are provided resources that lead to an equitable distribution of services and improvements. The California Office of Environmental Health and Hazard Assessment (OEHHA) hosts a mapping tool essential for identifying which California communities are most disadvantaged when it comes to pollution and its negatively associated effects. The mapping tool utilizes environmental, health, and socioeconomic information to produce a score ranging from 0 (healthiest) to 100 (least healthy) among designated census tracts in California.
Figure 2-6 displays the CES ratings of each census tract in the City of La Verne. Based on the CalEnviroScreen data, the areas in La Verne with the highest levels of economic, health, and environmental burdens are located in the southern portion of the city. The further you move north in La Verne, the less burden there is on residents.
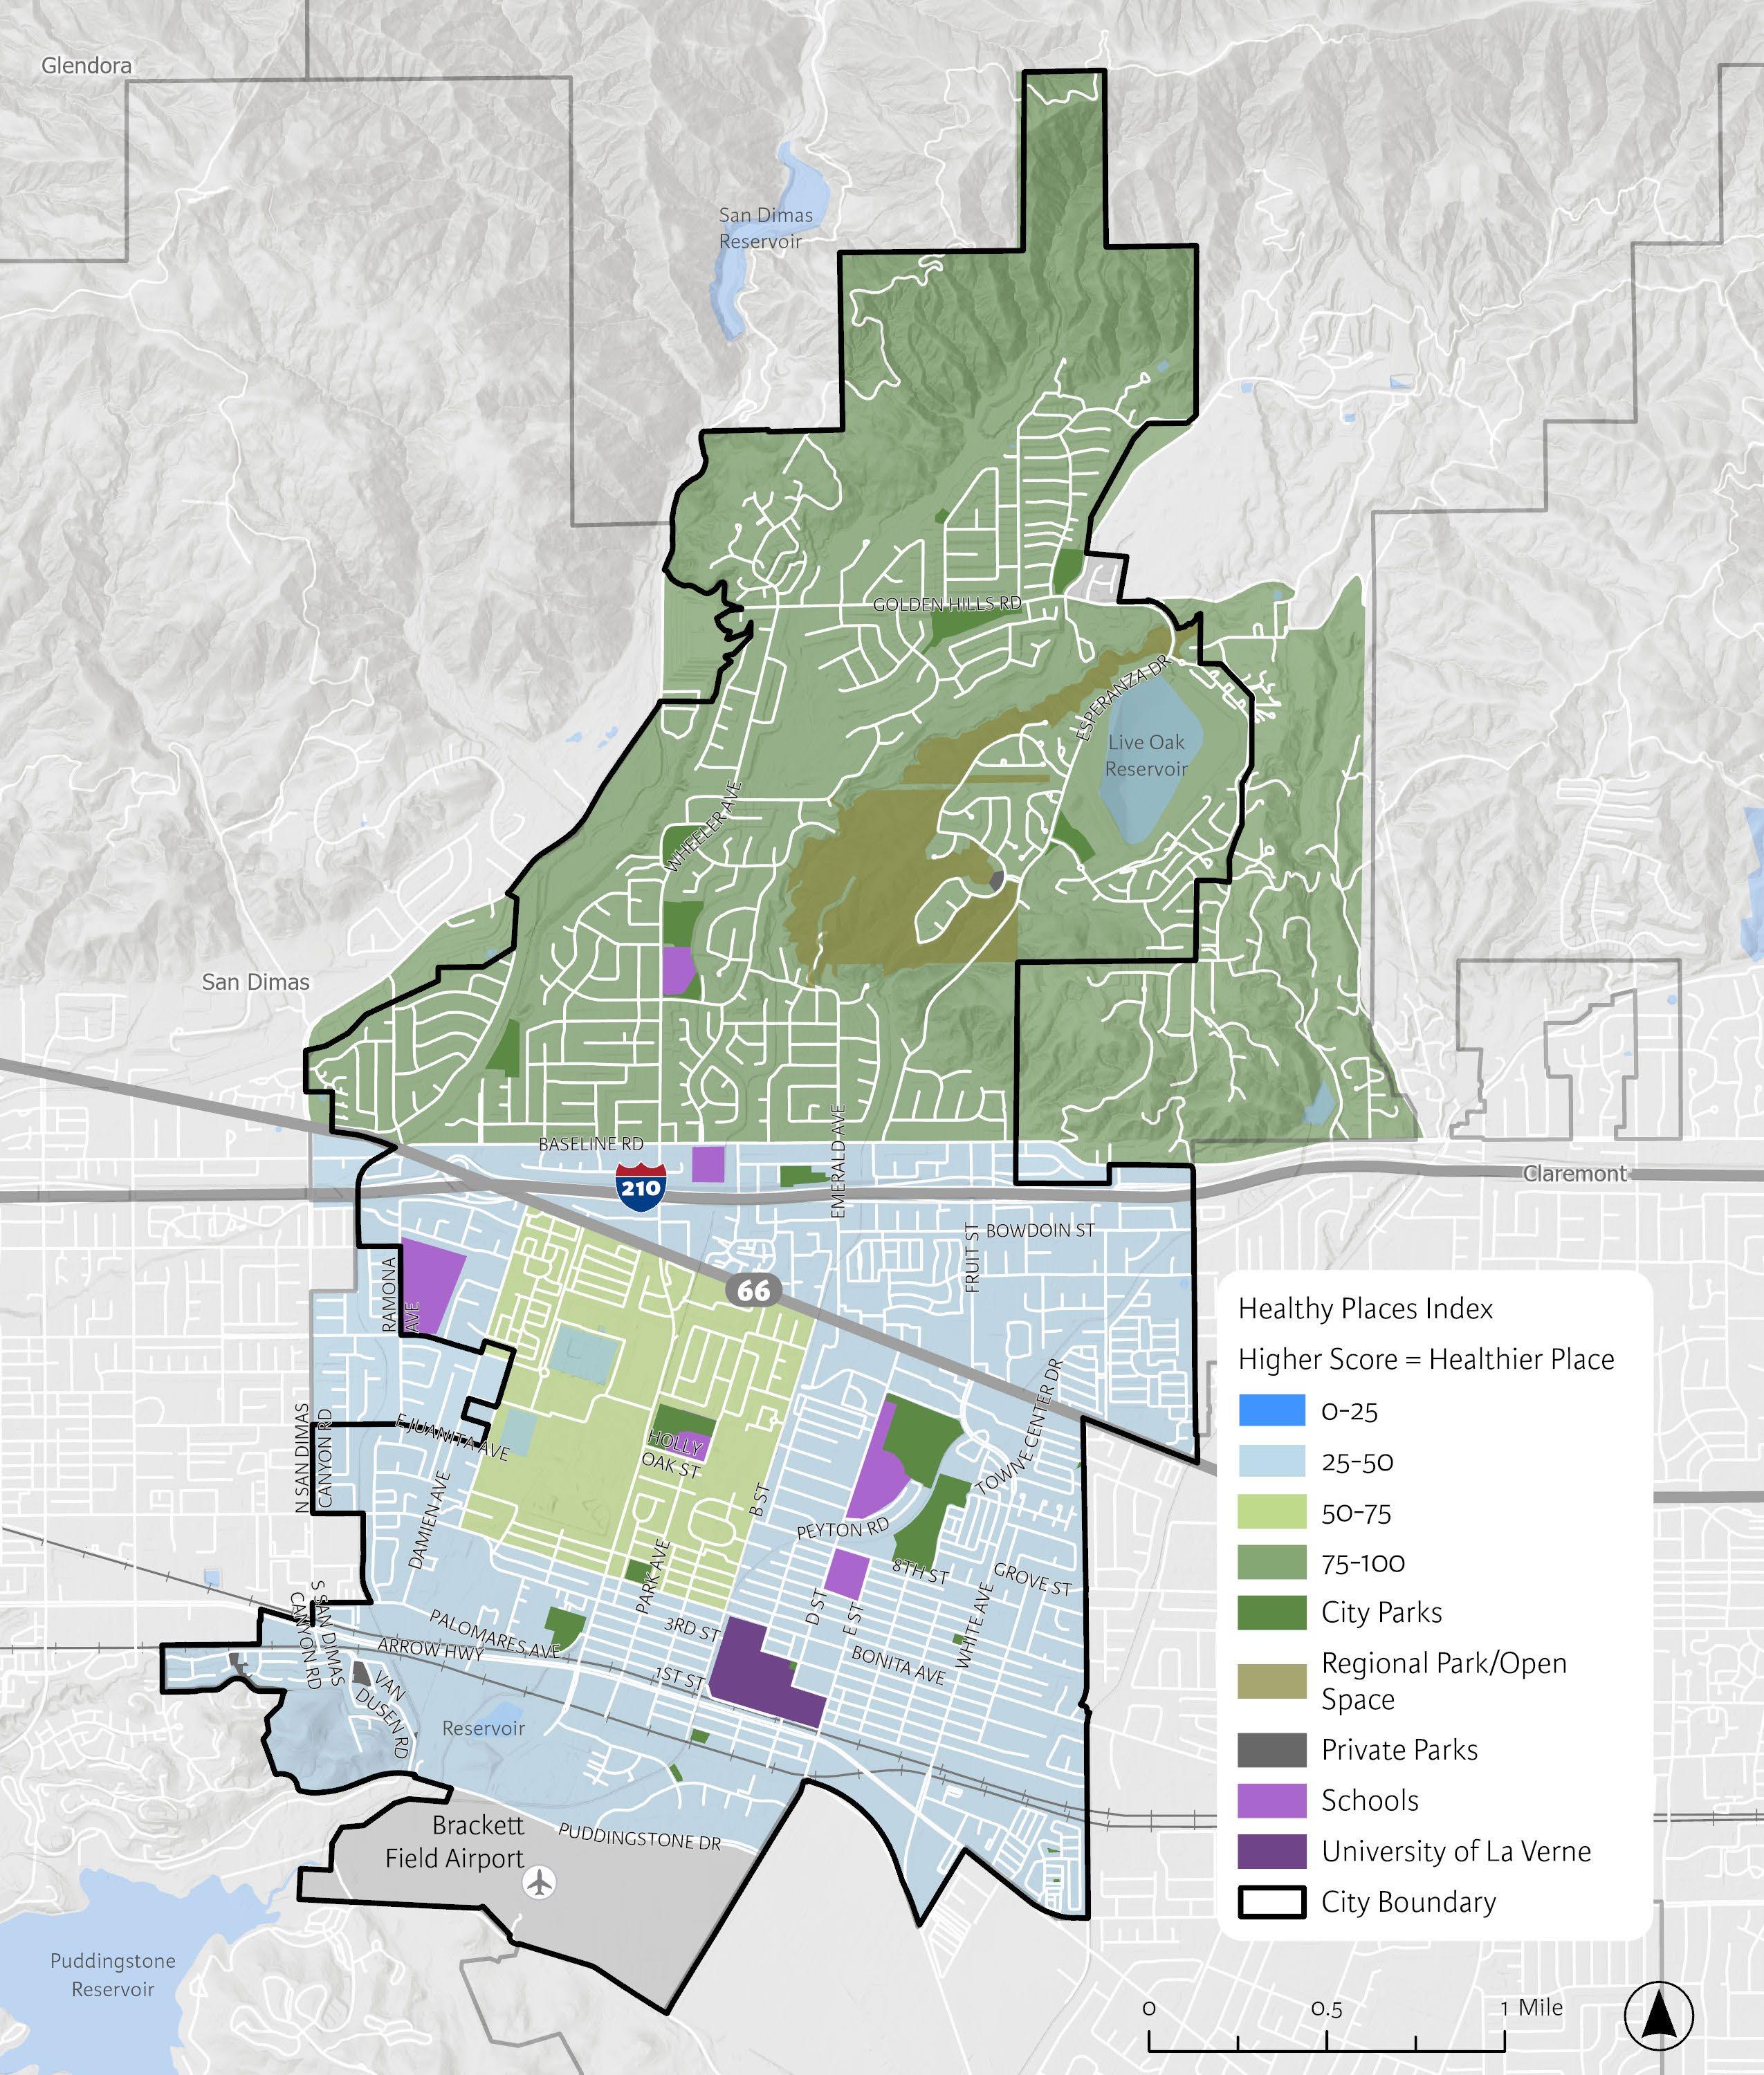
The Health Places Index (HPI) is a tool endorsed by the California Department of Public Health’s Office of Health Equity that gives neighborhood-level census tracts a rating determined by a variety of indicators. These are a variety of indicators that determine health outcomes, and include areas such as economic, education, social, transportation, neighborhood, and housing. Scores on the HPI range in percentiles from 0 (least healthy) to 100 (most healthy) as a determinate for community health conditions.
Figure 2-7 reveals the highest scoring and therefore the portion of the City with the highest percentage of healthiest community indicators, at the north end of the City, nearest the Marshall Canyon Regional Park.
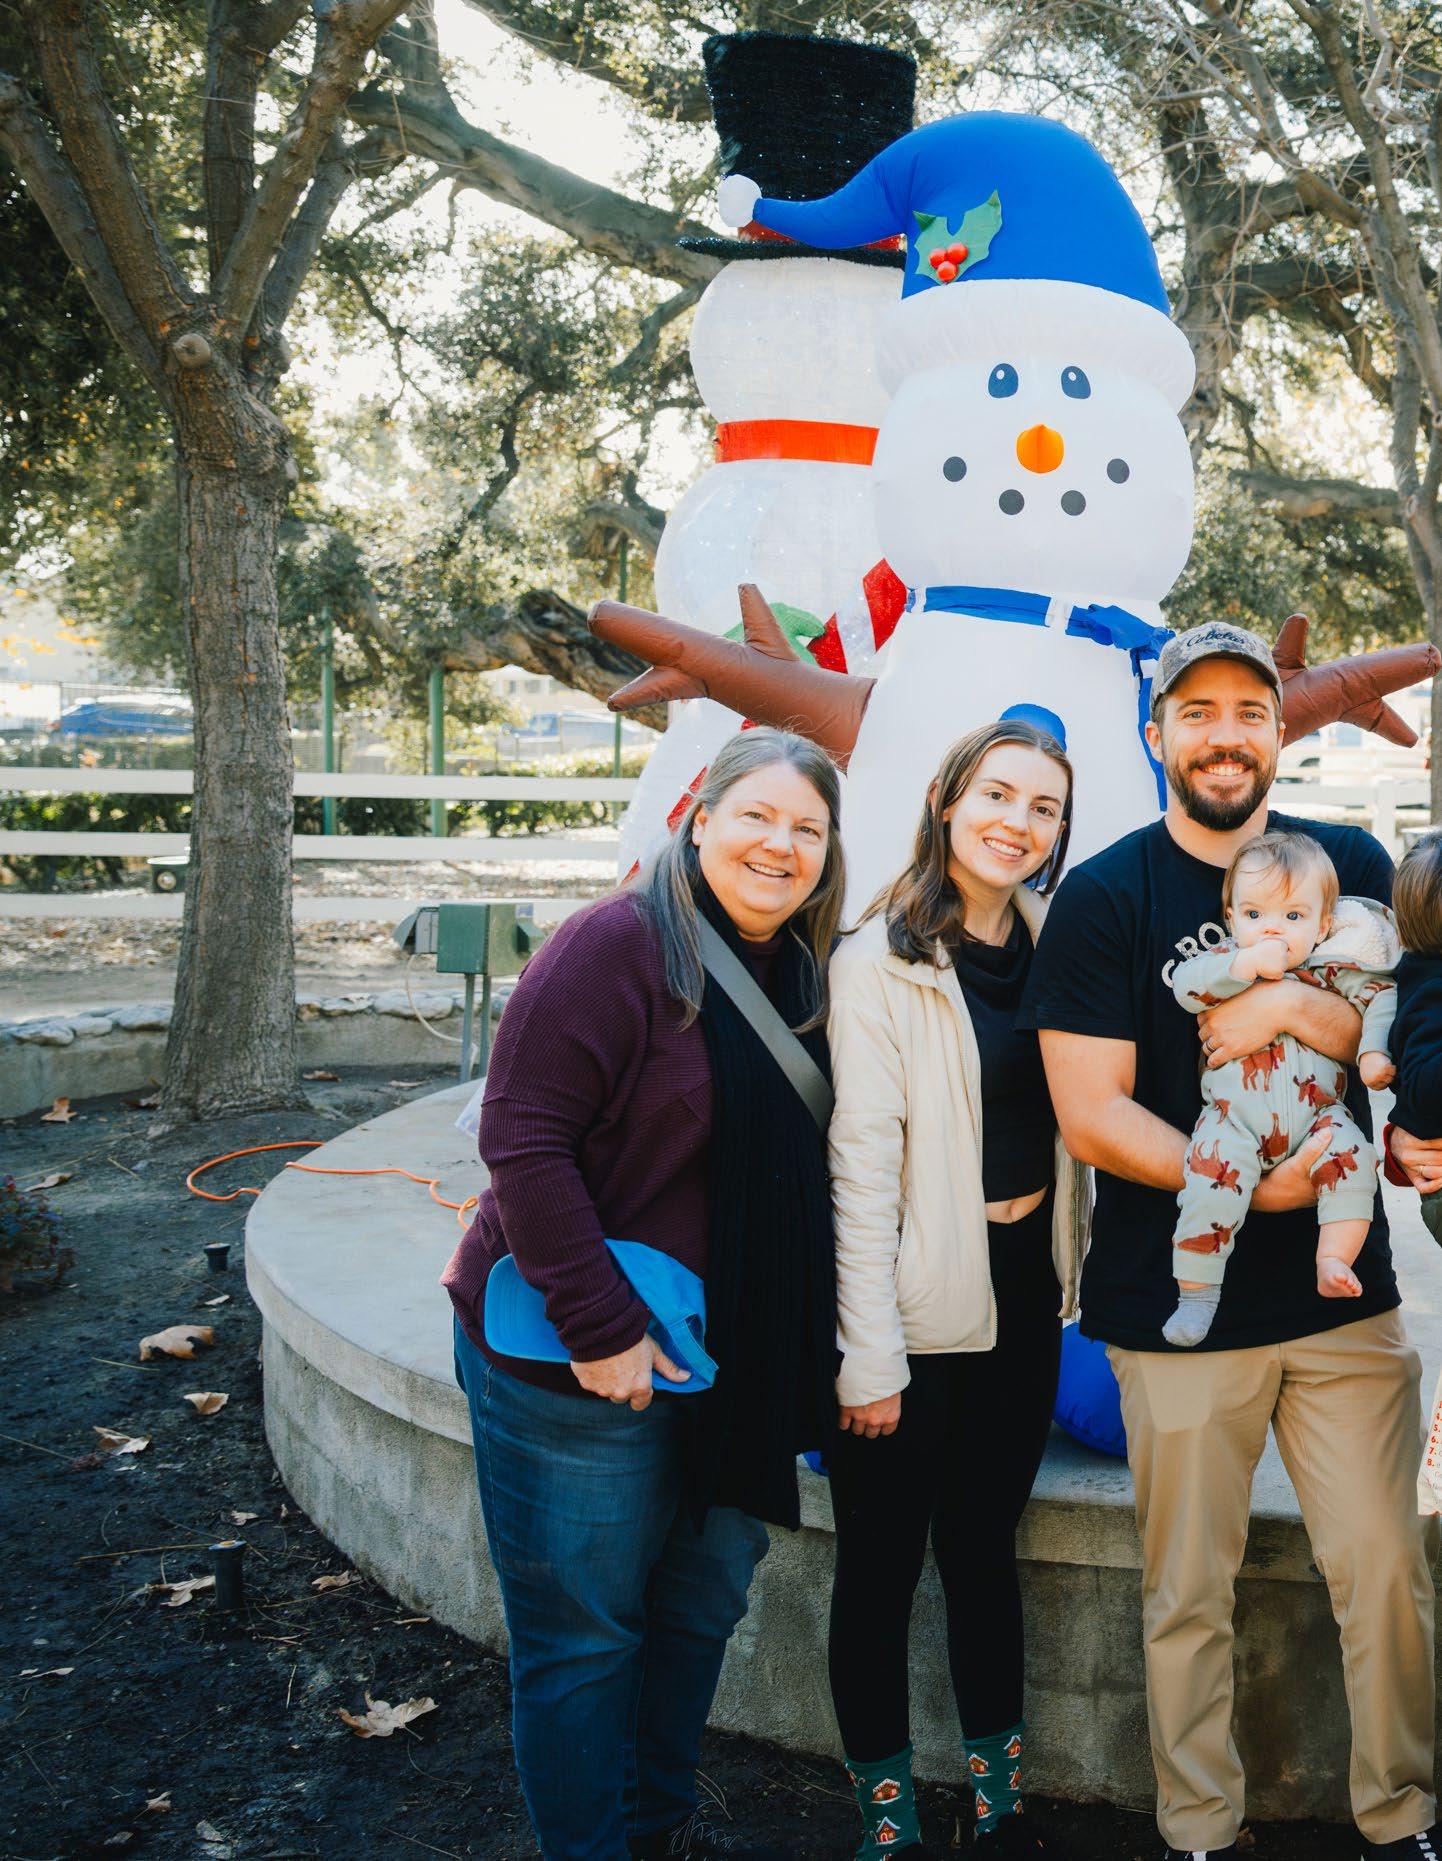
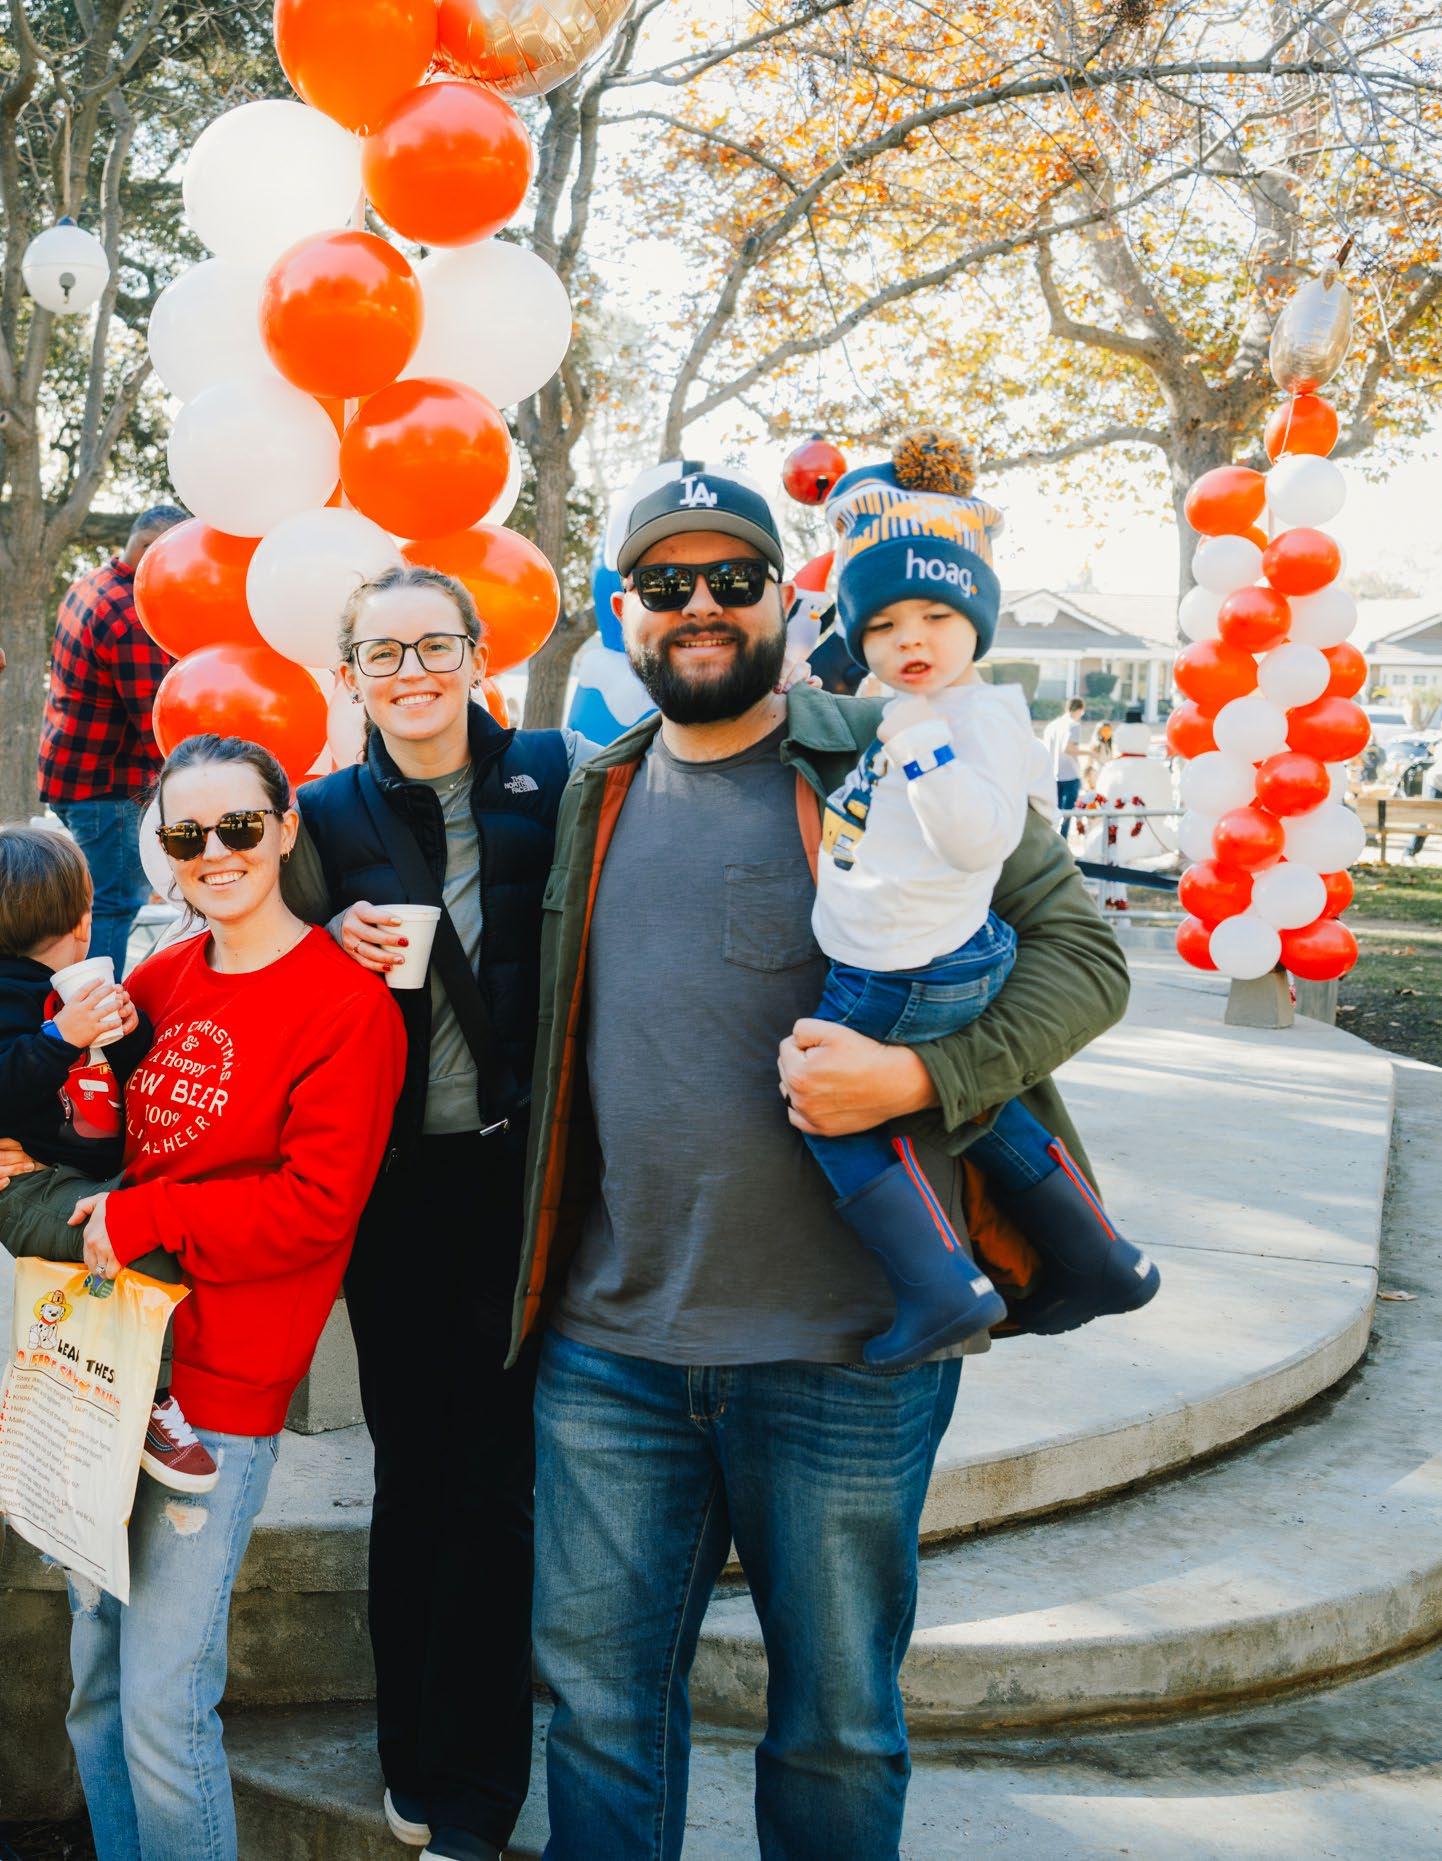
La Verne offers over 550 various recreation services to the La Verne community, including classes, events, programs, activities, leagues, rentals, camps, and more. These services are hosted across the City’s parks and facilities, and at various non-City owned facilities through JUAs.
La Verne Parks and Recreation are managed and maintained by 14 full-time positions across two separate Departments, with recreation operations falling under the Parks and Recreation Department and the Parks Division under the Public Works Department. Staff are charged with the oversight of all City park amenities and public recreation spaces and programs, ensuring they remain safe, clean, and accessible for residents and visitors alike.
The City of La Verne is committed to be fiscally responsible stewards of taxpayer dollars and to being accountable to all residents. The Plan’s importance extends beyond a typical park and recreation master plan to understanding and evaluating the costs of doing business so that there is a solid understanding of how taxpayer dollars are being spent to inform future decision making.

Understanding the current framework of programs and services offered by the City is essential to determining how staff and financial resources are allocated by the Parks and Recreation and Public Works Departments.
The Parks and Recreation Department provides various recreation programs and services to the community, currently grouped into the following Service Areas:
1. Active Adults: Services include general interest classes and events, drop-in activities, educational seminars, lunch program, etc.
2. Adult Sports: Services include various sport leagues (basketball and soccer) and memberships (tennis)
3. Aquatics: Services include youth and adult group and private swimming lessons, youth swim team, recreational and lap swim, etc.
4. Community Sports Organizations: Services include rentals to local community sports organizations
5. Contracted Programs: Services include art, basketball, dance, dog obedience, fitness, flag football, gymnastics, LEGO, martial arts, soccer, and tennis camps and classes, etc.
6. Disability Programs: Services include events, dances, and the Mt. San Antonio College impact program
7. Events: Services include Movies in the Park, Memorial Day Ceremony, Halloween Coloring Contest, etc.
8. General Public Rentals: Services include rentals of athletic fields, pool, rooms, shelters, etc.
9. Preschool Programs: Services include preschool, Parent and Me classes, etc.
10. Youth Sports: Services include basketball and t-ball leagues, etc.
11. Other Non-Parks and Recreation Services: Services include Animal Services, Mental Health and Unhoused Program, Passport Services, Transportation Services, Veteran’s Resource Center
La Verne Parks and Recreation offers an extensive range of programs that cater to a wide variety of interests and ages. As a trusted entity, both by residents and activity providers, the Parks and Recreation Department plays a key role in delivering high-quality recreation opportunities. Recreation is vital to the community because it promotes physical health, mental well-being, and social connections, helping to maintain a vibrant and engaged population. Through its continued programming, the Department contributes to the overall quality of life in the area.
The Parks and Recreation Department delivers services that residents value, and there is a strong orientation toward community service. Key programs and services such as youth sports, Active Adult lunch program and excursions, and special events are popular and well-attended. Additionally, there are several non-parks and recreation services that the Department currently oversees, highlighted by U.S. Passport Services and Mental Health and Unhoused resources; these services, while undoubtedly important for a community, do not traditionally fit under the parks and recreation operations.
The City’s recreation programming and services was reviewed against state and national perspectives through a review structure set by NRPA. The 2025 NRPA Agency Performance Review and NRPA Park Metrics features were used to review general programming types and specific targeted programs. The NRPA Agency Performance Report is an annual report that provides a clear overview of park and recreation agencies’ performance and allows agencies to compare their own performance metrics against those of other agencies. Data is collected annually via NRPA’s Agency Performance Survey, by way of NRPA Park Metrics, which allows agencies to build detailed custom reports to further compare their performance against other agencies.
Table 3-11 shows the general programming types offered by La Verne alongside the percentage of agencies that offer those services nation and state-wide. La Verne offers nearly all of the most common programming types.
Table 3-22 shows targeted programming offered by park and recreation agencies for specific demographic groups (e.g., children, older adults, and people with disabilities), evaluated through the same lens as Table 3-11. La Verne meets some of the most common targeted programs offered by park and recreation agencies. However, the biggest absence in the City’s targeted programs and services are for summer camps, which a vast majority of agencies both statewide and nationwide provide.
TABLE 3-1: General Programming Offerings
TABLE 3-2: Targeted Programming Offerings
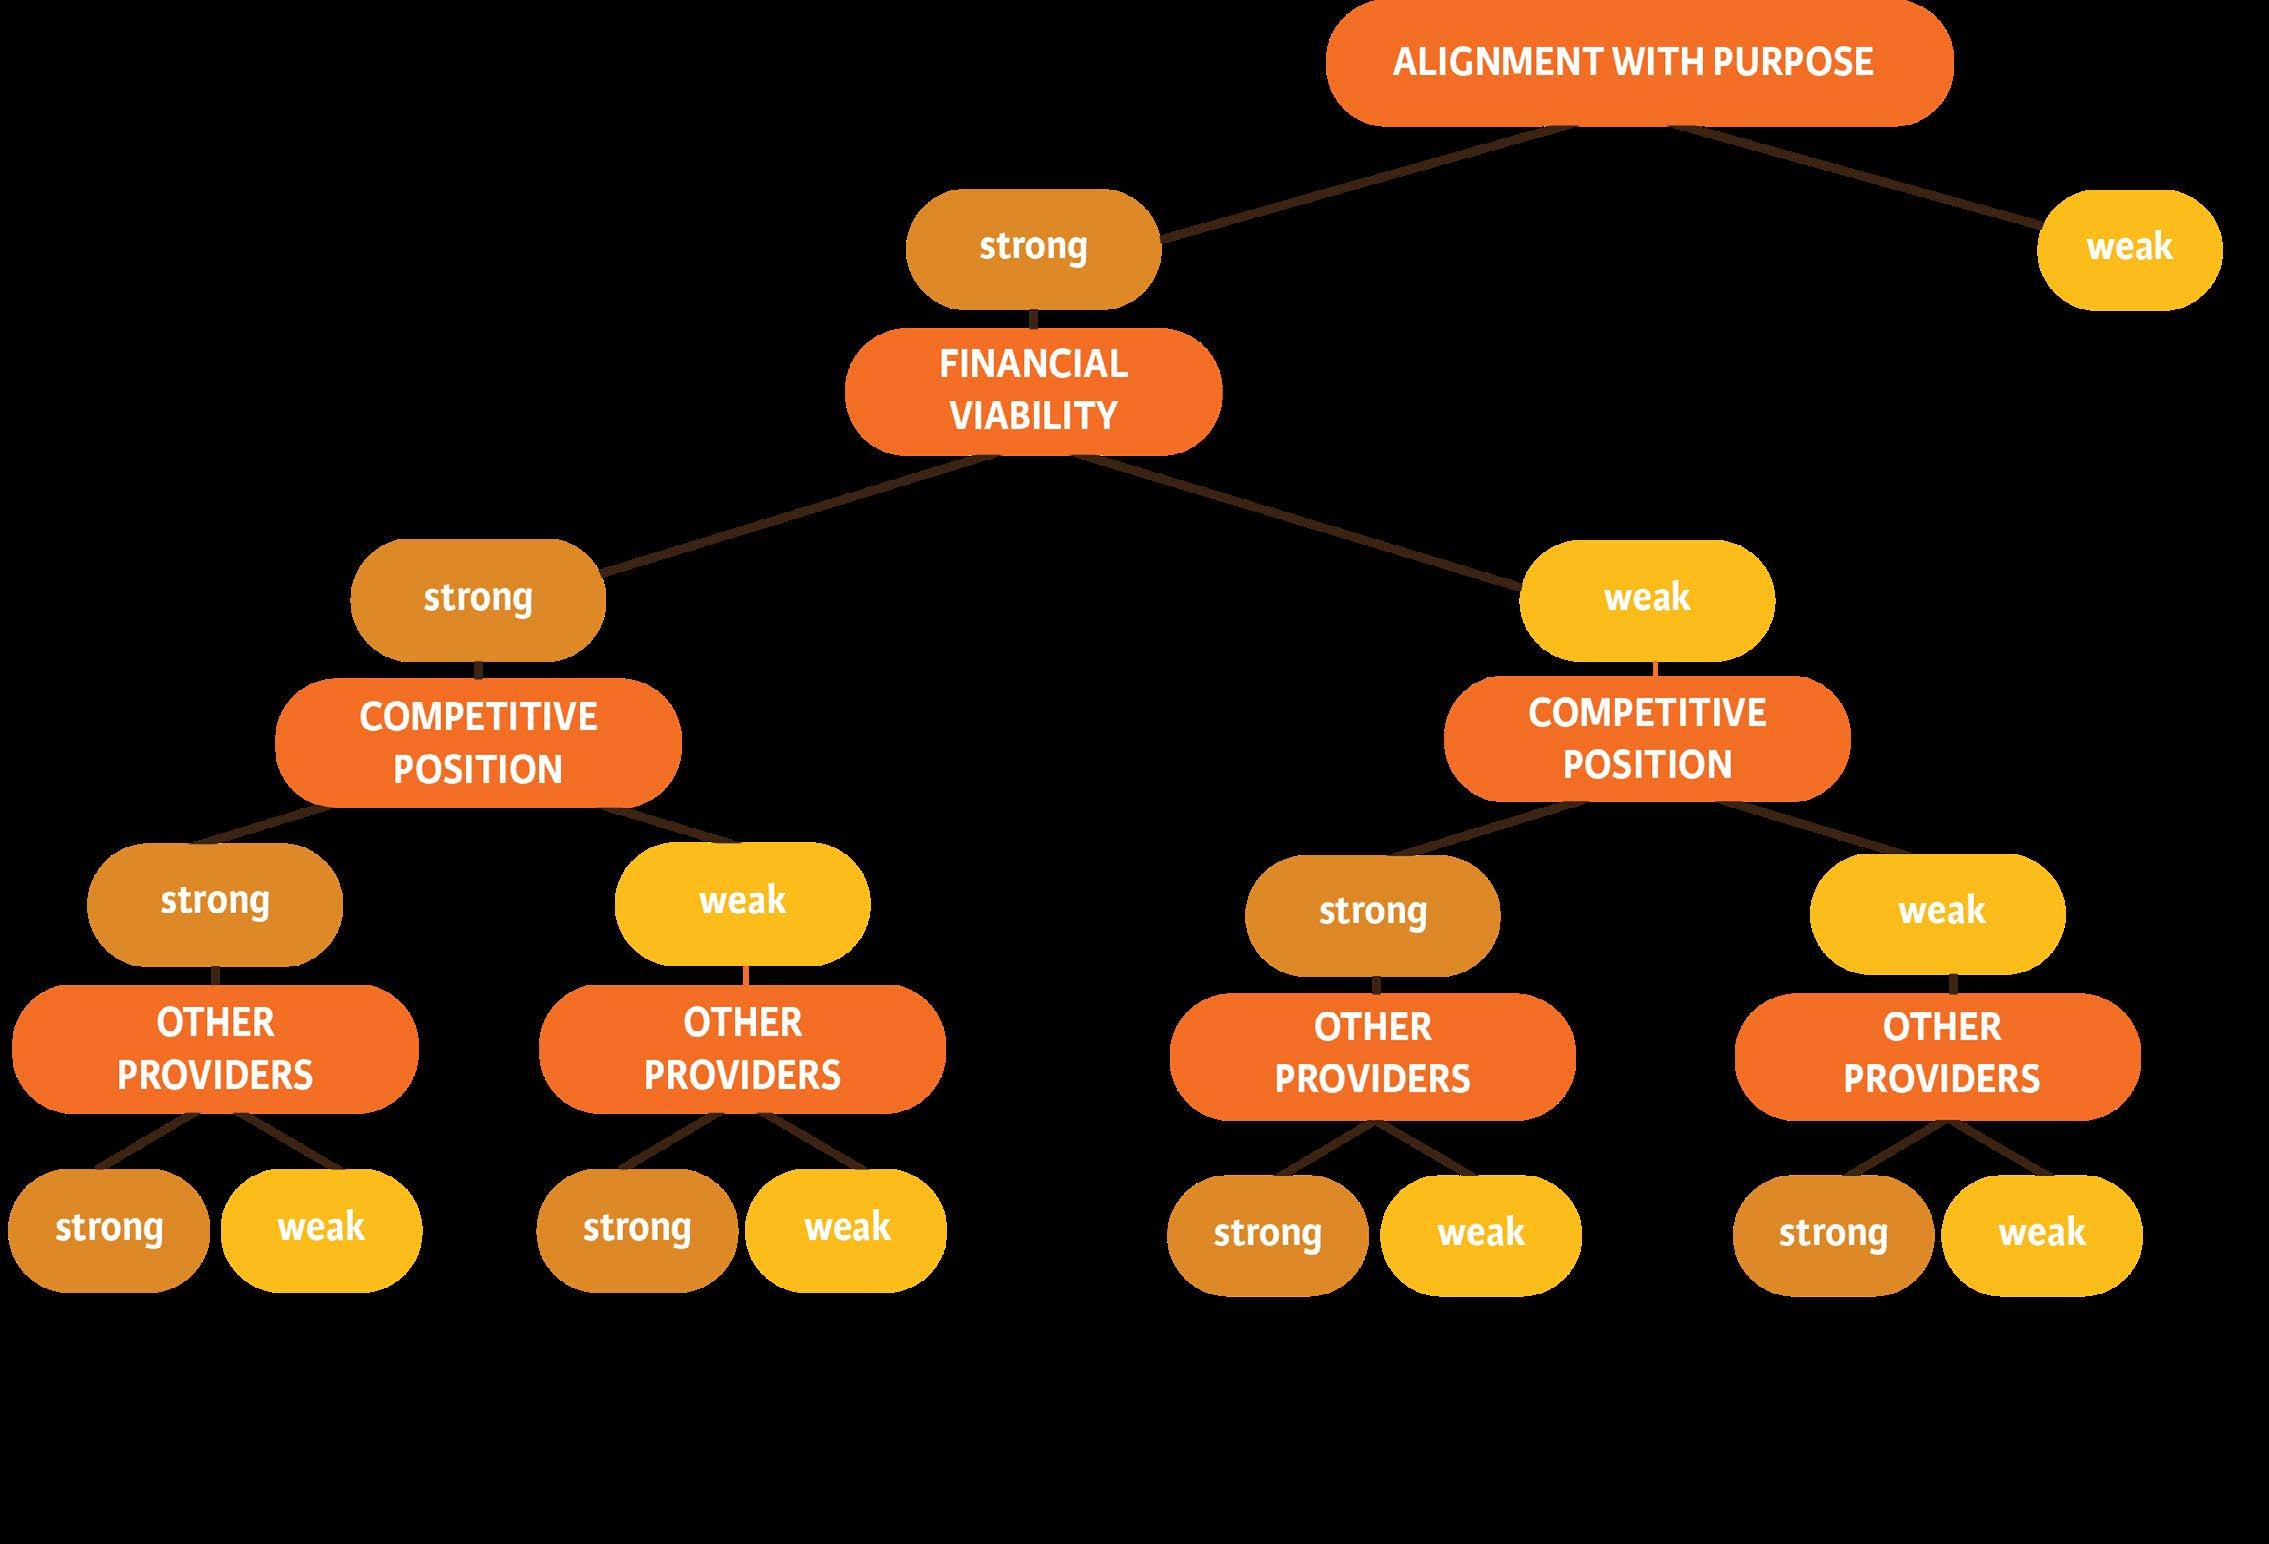
The Services Analysis includes an evaluation of the effectiveness and efficiency of recreation programming and services, such as activities, courses, classes, events, and rentals. The analysis considers each service’s relevance, alignment with purpose, market position, financial viability, and consideration of other providers which offer similar and like services. Analysis results were used to develop recommended service delivery strategies, which can include either continued investment in the service, collaboration, subsidization, or divestment. The analysis utilizes 110%’s Service Analysis Tool, a valuable resource to help park and recreation professionals analyze their organization’s service inventory and best define their service “lane”. This analysis will help the City deliver a more focused service menu, improve service quality, and most responsibly use finite financial resources.
The Services Analysis Tool Decision Making Tree, shown in Figure 3-1, is built around four criteria that guide the evaluation of services.
1. Alignment with Organizational Mission/Purpose: Does the service align with the mission/purpose of the organization?
2. Financial Viability: Is the service meeting its cost recovery or subsidy investment goals?
3. Competitive Position : Is the service currently or reasonably able to be provided at a high level of service given available resources (i.e., funds, staff, facilities)? Is the target market interested in the service and if so, to what degree?
4. Other Providers: Do other service providers exist in the community or region that provide similar or like services creating competition for market share? What is their reach and market share in contrast to that of the organization? After evaluating services based upon the criteria above, one of four recommended operational strategies are suggested as an implementation tactic. These include:
Provides an opportunity for revenue enhancement, thus, positing the organization to distribute excess revenues to subsidize “common good” services, or to enhance exclusive services that can increase financial return on investment.
To eliminate unnecessary duplication of service if present. Collaboration results in efficient and effective use of finite resources.
When investments are made to the greater “common good”, it produces broader and farreaching benefits for the entire community
Allows for the reallocation of savings to subsidize “common good” services or to enhance exclusive services that may provide for increased financial return on investment.

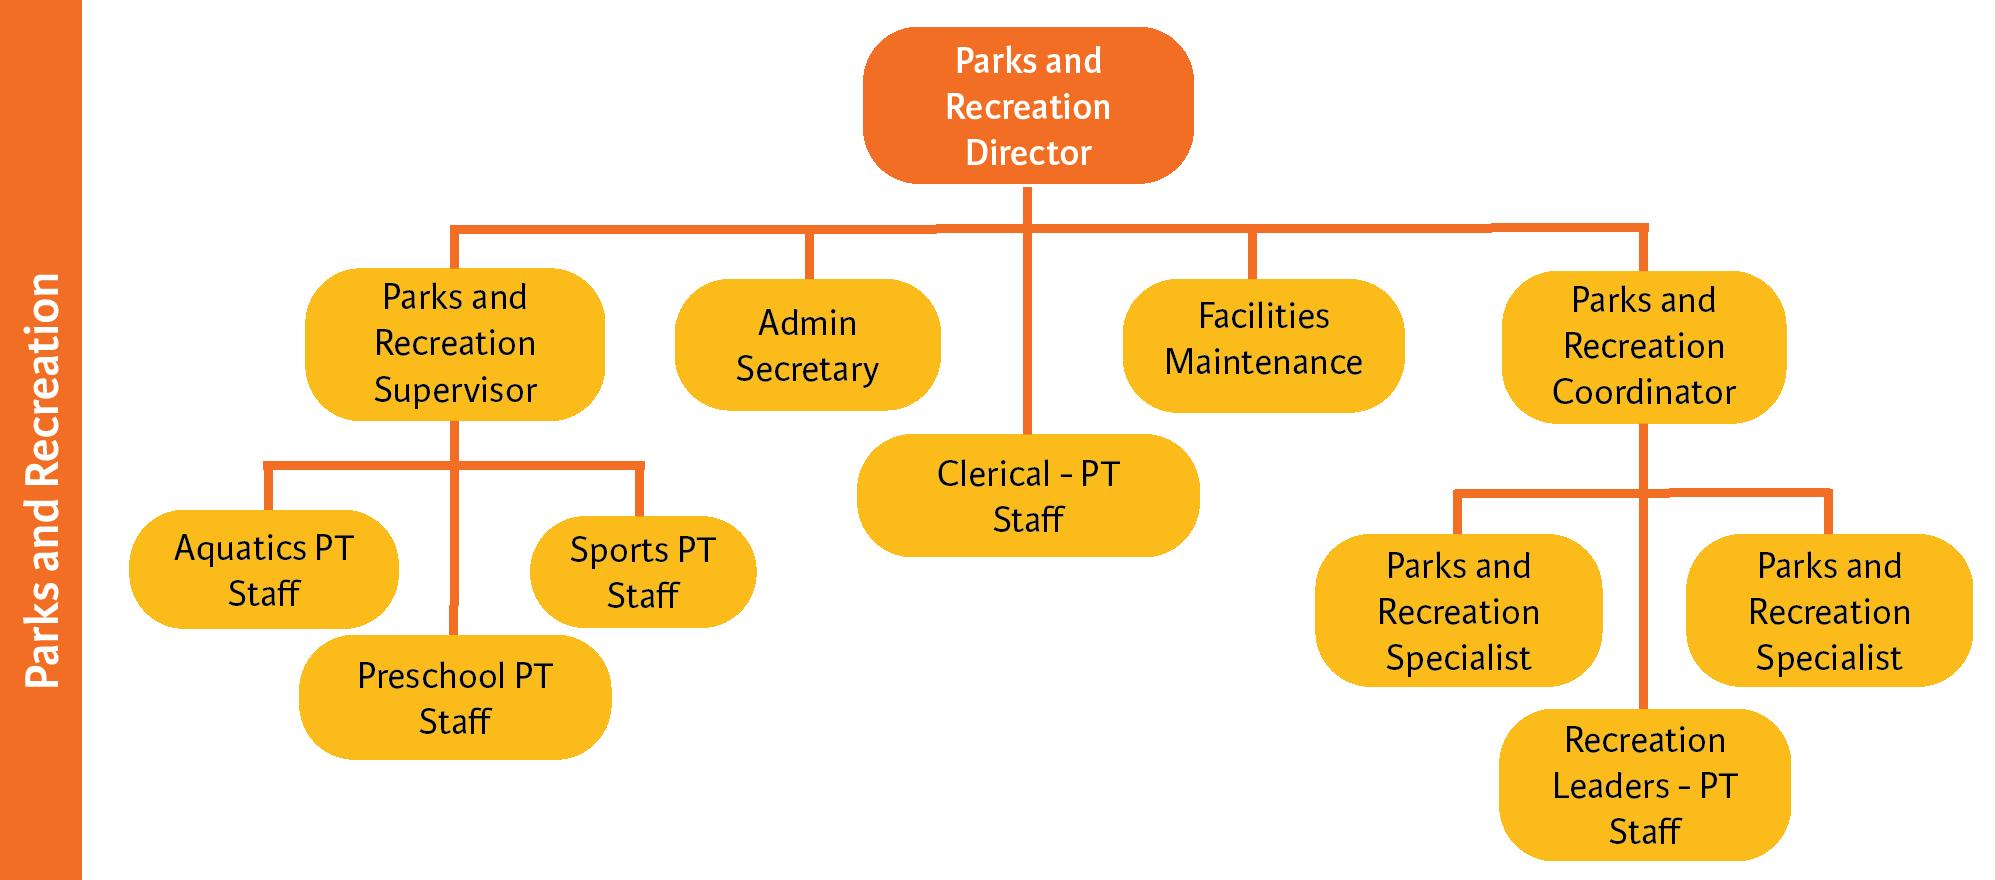
The Staffing Analysis reviewed and assessed the City’s parks and recreation staffing operations. This task consisted of a series of exercises to quantitatively and qualitatively evaluate the current state of the both the Public Works Department and Parks and Recreation Department that included a review of the current organizational structure and personnel allocation, benchmarks at the state and national levels, and comprehensive interviews with key staff members.
La Verne Parks and Recreation is comprised of 14 full-time positions and consists of two divisions across two Departments, the Parks and Recreation Department and Public Works Department, as shown below.
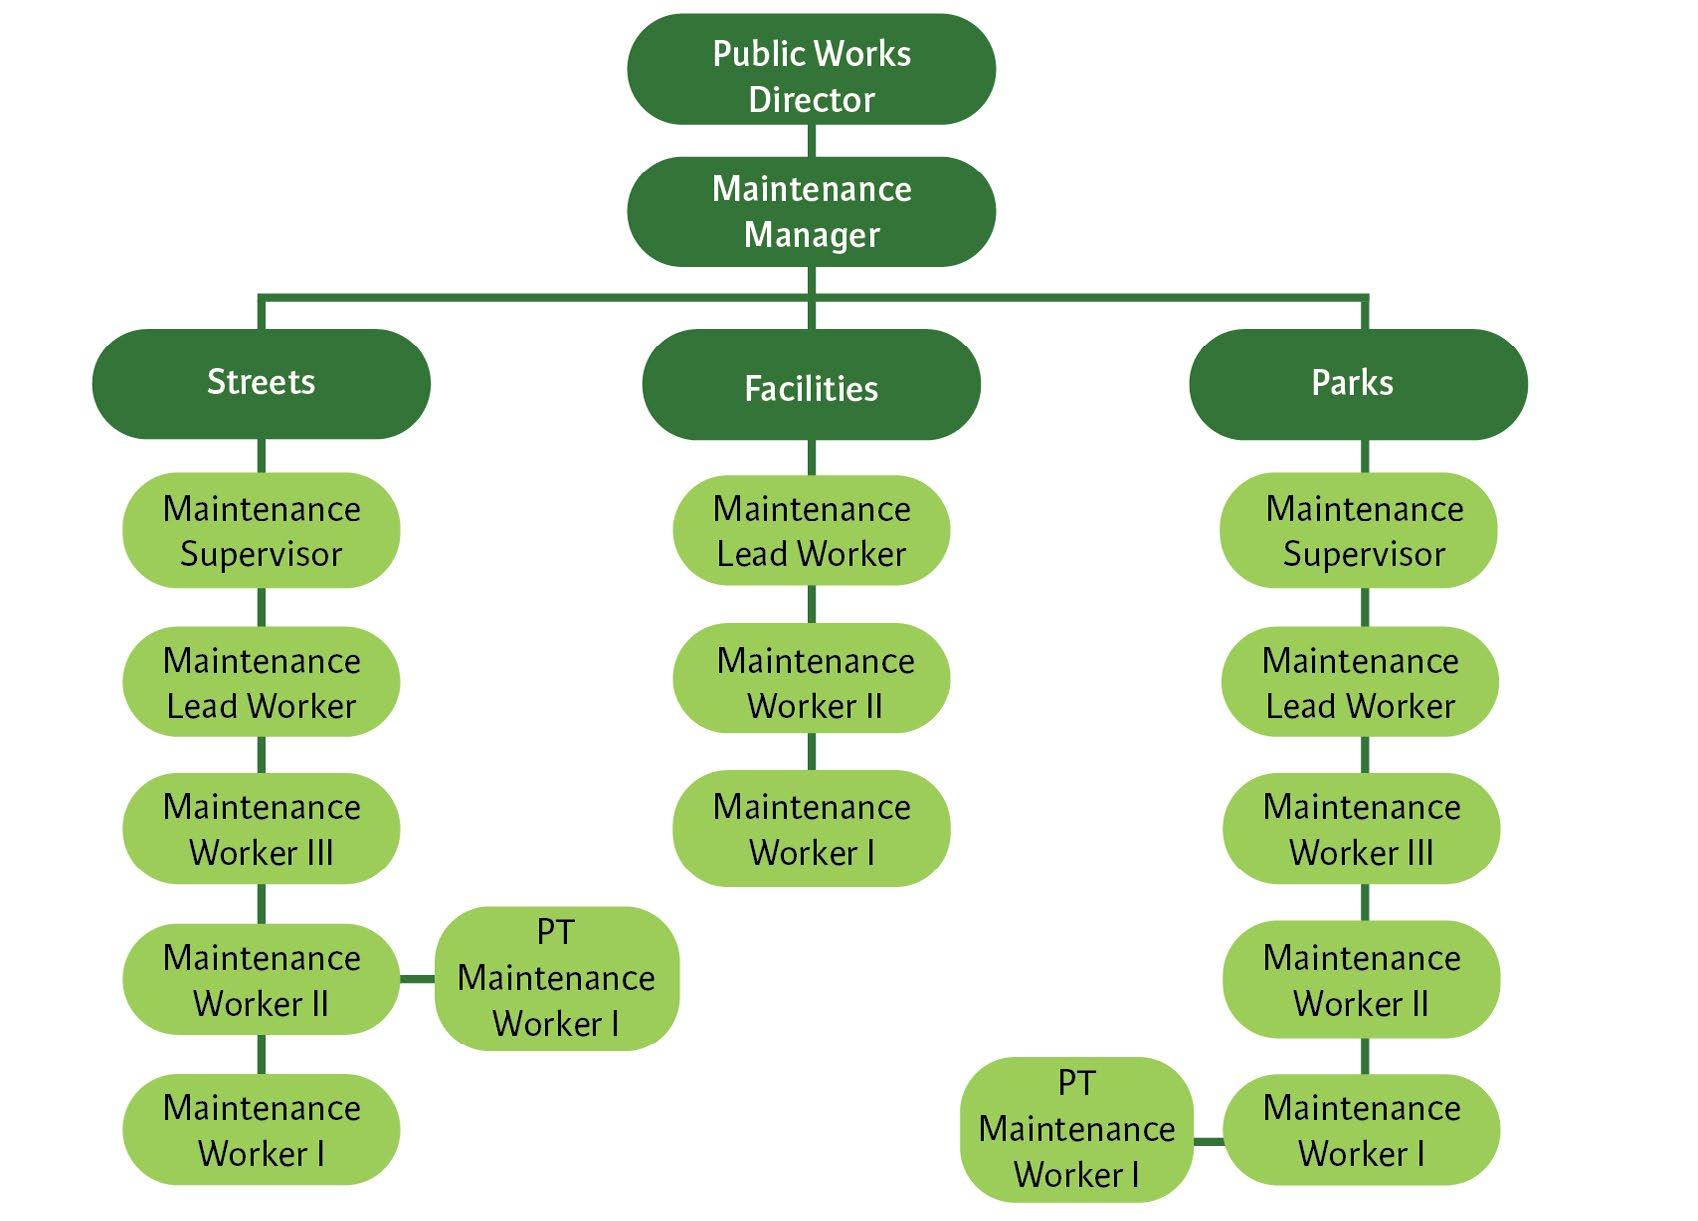
It’s important to note that benchmarking exercises need to be taken with caution due to the variances in how each community provides parks and recreation and leisure services. This exercise was conducted to give both Departments a general idea of how their staffing levels compare on a state and national level.
Overall staffing levels of the Departments were observed through the lens of state, and national benchmarks by utilizing NRPA’s Park Metrics database by using the number of employees per 10,000 residents. In terms of the total number of full-time employees (FTEs) based on the population served, La Verne falls below state and national benchmarks, as depicted in Table 3-3.
3.5.3.
Comprehensive interviews with key City staff members were conducted to assess current operations. Input was gathered from staff of various levels from Parks and Recreation, Public Works, Finance, as well as the City Manager. These discussions were focused on several key aspects including roles, responsibilities, bandwidth, and personal and organizational assessments.
Staff provided valuable insights that were categorized into the following key areas:
Staff Capacity and Utilization:
1 and 2 – 2024 and 2025 NRPA Park Metrics Agency Performance Reports
Contracted labor was not included in the calculation of FTE total
» Staff are working at full capacity to meet maintenance and program demands.
» Parks and Recreation staff are balancing a wide range of responsibilities such as supporting unhoused populations, maintaining restrooms, and coordinating large-scale community events.
» Public Works staff are balancing a wide range of responsibilties such as landscaping in the public right-of-way, tree maintenance, irrigation, and public facility maintenance.
Organizational Structure:
» Recreation operations rely significantly on part-time employees, which supports flexibility but can make long-term planning more challenging.
» Administrative staff ensure consistent operations, though their workload leaves limited time for new projects.
» The current structure, with Parks and Recreation and Public Works operating as separate Departments, presents opportunities to strengthen coordination and align day-to-day and long-term decision-making.
» It is very important to maintain institutional knowledge with new staff changes.
Deferred Maintenance:
» Maintenance and capital projects could benefit from better proactive planning and long-term investment to extend the life of facilities and amenities.
» Better maintenance practices will help the community meet evolving expectations for quality parks and recreation services.
Parks and Recreation is a relationship-based field wherein the community does not distinguish between who maintains the facilities and who programs them. La Verne’s parks and recreation system has a solid foundation of dedicated staff that supports the provision of excellent passive and active recreation services. Although the current model has areas of improvement, the two departments are committed to providing residents a seamless recreation experience. Continued collaboration, both organizationally and culturally, will help La Verne reduce areas of strain to a more sustainable, proactive model. By implementing recommendations outlined in Chapter 6, the City will be positioned to continue to deliver the high-quality services residents deserve.
Plan recommendations that suggest new or expansion of parks and facilities may require additional staffing and resources in the future. The Department may consider a phased implementation approach to address relevant changes to staffing resources and overall impacts. The Department can continue to evaluate supplementing Department staff with the use of contracted labor, both for park maintenance and recreation programming. When utilizing contracted labor, the Department should continue to stay abreast of current state policies.
“Partnerships” encompass a variety of relationships such as strategic alliances, cooperative ventures, and collaborations. A partnership revolves around achieving mutually beneficial outcomes for all parties. Given today’s competitive landscape, ever-changing markets, and resident requests, a thoughtfully constructed and managed partnership can be a powerful asset. Partnerships represent advantageous collaborations that position organizations to efficiently utilize resources leading to cost-effective and efficient service delivery. They facilitate the bridging of markets, reduce duplication of services and fragmentation of resources, and foster cooperative capital development and/or improvements.
The City fosters numerous strategic partnerships to deliver programs and services to the community, primarily through Joint Use Agreements (JUAs) and Facility Use Agreements (FUAs). JUAs and FUAs are formal agreements between two separate entities to establish the terms and conditions for the shared use of property or facilities. The City’s partnerships allow it to effectively serve the residents in specific ways, which benefits the community at large.
Bonita Unified School District
Bonita Unified School District grants the City use of various District facilities for community recreation use during non-school hours. This includes the Bonita High School facilities (baseball and multi-use fields, Glen Davis Stadium, gymnasiums, tennis courts, and Skate Park), Oak Mesa Elementary School basketball courts, and Las Flores Park facilities (softball fields, soccer fields, and playground). Additionally, the City grants the District use of the Aquatics Center at Las Flores Park and turf area at Oak Mesa Park.
La Verne Heritage Foundation
La Verne Heritage Foundation preserves, operates, and maintains the historic structures of Heritage Park including the Weber House, Romick Barn, True Hartshorn bunkhouse, and Warden stables.
Lutheran High School (Owned by Lewis Land Developers)
The City has the non-exclusive licensed use of the Lutheran High School Gymnasium and Field for youth and adult sports, and City programs/classes/events.
University of La Verne
The University of La Verne grants the City use of the La Verne Athletic Complex for community recreation use including the softball field, and multi-use field. Additionally, the City grants the University use of the Aquatics Center at Las Flores Park.
Partnerships can not only increase the variety of programs and services available to the community but also help maximize financial and staffing resources while maintaining high-quality standards. As the Parks and Recreation Department continues to evaluate its current partnerships as well as the exploration of new potential partners, the following considerations should be taken into account when selecting a partner organization with which to work (or continue working with):
1. Reciprocal benefit: Any organization that has something the Parks and Recreation Department may want or need is a potential partner. Reciprocal benefit will be critical to an effective partnership. It is important to recognize that any alliance comes with a cost – whether it be time or money, there will be some type of necessary investment.
2. Value: A partnership needs to provide value. This can be in terms of the bottom line, enhanced image, community impact or some other benefit.
3. Long-term Investment: Partnerships should benefit those involved for a minimum of three to five years. Partnerships should be strategic with an interest in the long term.
4. Relationships: Partnerships are business relationships and the people behind the partnership are the ones that will make or break the partnership.
5. Reputation: The reputation of partner organizations needs to be on par with that of the City. Evaluate their credibility, practices, and public perception of their services and offerings.
6. Mission/Purpose Aligned: Potential partners must have a similar fundamental purpose (mission) to that of the City and Departments (Parks and Recreation and Public Works) or the alliance will likely fail.
Recommended objectives and actions for how to improve partnerships can be found in Chapter 6. Detailed agreements can be found in Appendix D.
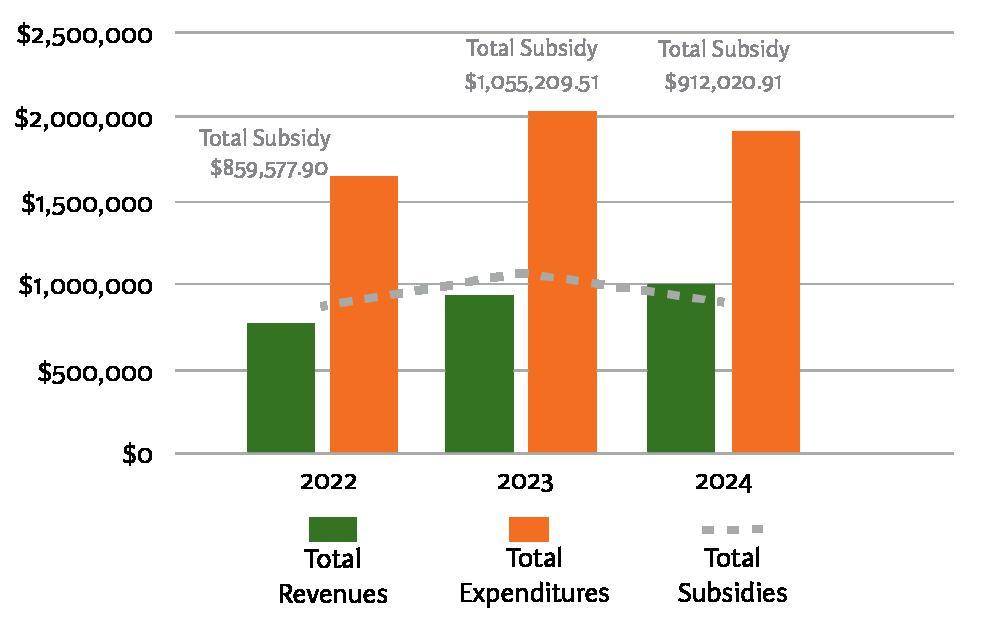
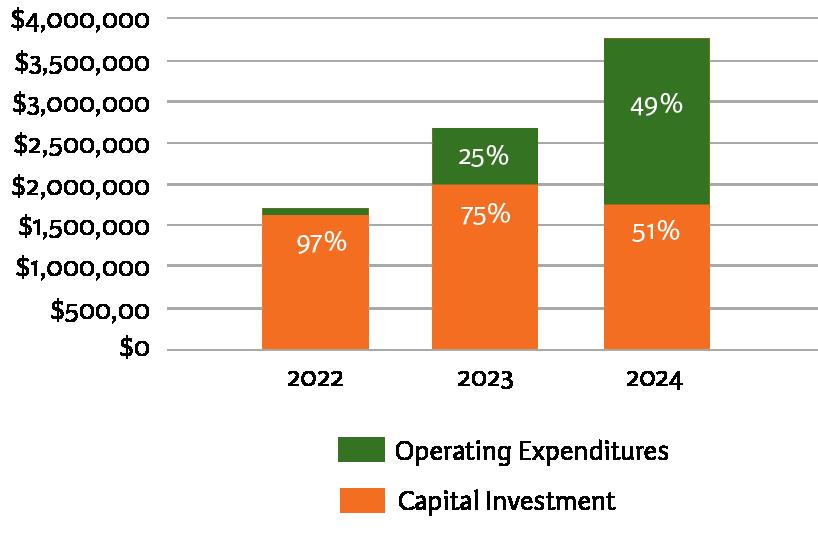
Reviewing the Parks and Recreation and Public Works Department’s revenues and expenditure patterns over recent years helps clarify financial trends. This information provides useful insight into year-over-year changes and their influence on fund balance, as shown in Figure 3-3 and Table 3-4 below.
The Park Development Fund, illustrated below in Figure 3-3, Table 3-4, and Figure 3-3 below, show a clear increase in capital investment over the past three years. Relative to operating expenditures, capital spending now represents a significantly larger share of the total expense.
Additionally, this Plan’s scope of work extended beyond a conventional comprehensive master planning effort to evaluate the costs of doing business so that there is a solid understanding of how taxpayer dollars are being spent and invested so that future financial decision making continues to be as informed as possible.
High-performing park and recreation agencies seek out and embrace responsible financial and service management practices. They actively understand the cost of doing business, identify cost savings, seek out partnerships that have reciprocal benefits, and divest from services that do not align with their mission or waste resources. They also generate revenues when appropriate to reinvest in important and often underfunded services, maintain infrastructure, and relieve pressure on taxpayer resources. Ultimately, they possess a financial sustainability philosophy that provides a foundation from which all investment and spending decisions, and funding strategies are built.
110%’s Financial Sustainability Strategy, illustrated by the process’ Three-legged Stool, builds on the philosophy of Parks and Reconomics© - how parks and recreation organizations manage their finite financial resources.
The City embraced this charge and the exercise of creating a financial sustainability strategy for its parks and recreation services by following these principle steps.
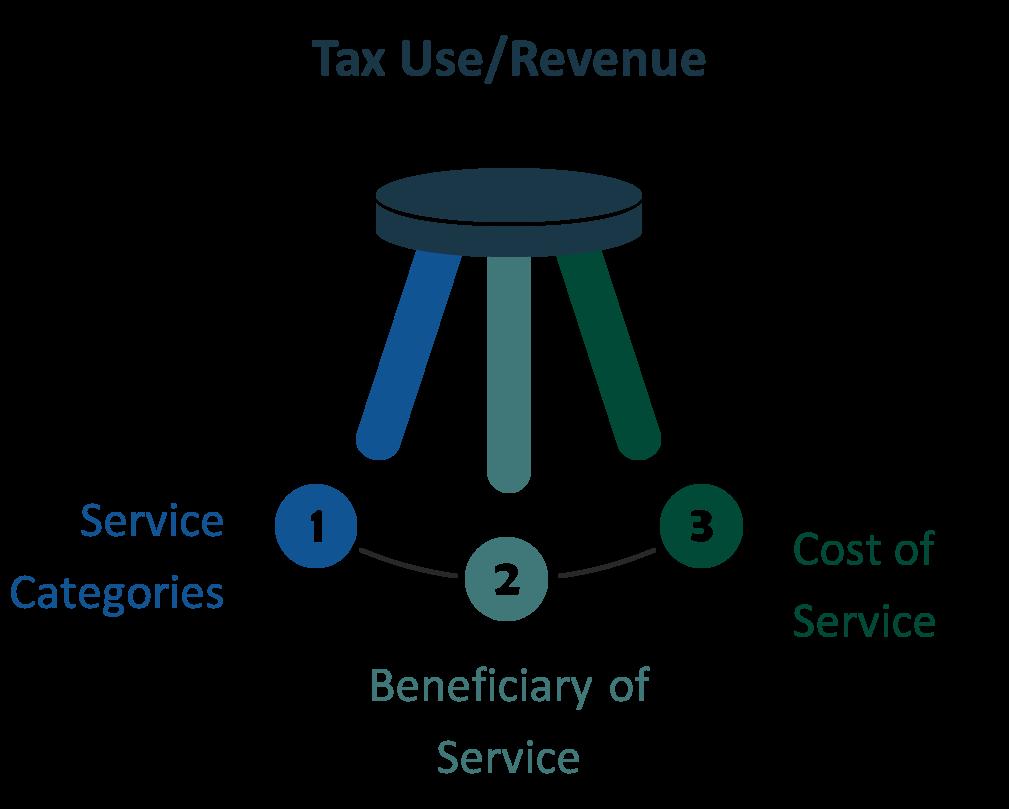
The development of categories which include services that are alike in “purpose” is important when it comes to justifiable and equitable allocation of subsidy, cost recovery levels, and assignment of budget and general ledger lines to account for a category’s fiscal performance. The benefits of this type of approach are two-fold:
1. It is inefficient for the City to determine cost recovery expectations by each individual service including facility, activity, or event
2. Categorizing by “type of service” or “likeness of service” discourages attempts to determine fees and charges (and therefore cost recovery decisions) based upon special interests, age-based services, or individual values.
Common Good Services or cause and purpose driven services intend to impact social, economic, and environmental issues and needs and align with the fundamental purpose and mission of the City. Typically, there are no similar services provided by the non-profit/Non-Governmental Organizations (NGO) or private sectors.
Exclusive Benefit Services or specialized services, intend to serve personal interests. Typically, there is competition with the non-profit/ Non-Governmental Organizations (NGO) and private sectors which offer like services.
Common Good Services (justification for greater subsidy investment)
» Community building
» Provides accessibility to marginalized/under-represented populations
» Broad appeal to a wide audience
» Services contribute to greater equity, cultural awareness, and make EVERYONE’s life better
Exclusive Benefit Services (justification for greater cost recovery expectations)
» Individualized, special interest
» Requires higher competency/ability level to participate
» Specialized activities
» Individualized services are often accessible outside of the City
Open Access Activities - Services or facilities available to all community members without the need for reservations or registrations. [ex: Los Encinos Park, Challenger Park basketball courts, Mills Park playground, Golden Hills Wilderness Park trails, etc.]
Human Services - Supportive programs designed to promote health, wellness, independence, and community connection, helping residents of all ages thrive. [ex: Veterans Resource Center, Bone Builders, Mental Health and Unhoused Program, Fall Prevention, etc.]
Special Events – These events bring the community together through fun, memorable experiences and seasonal celebrations for residents of all ages. [ex: Family Swim Night, Senior Dinner Dances, Veterans and Memorial Day Ceremonies, Winter Wonderland, Intellectual/Developmental Disabilities Dances, Concerts, Movies in the Park, etc.]
Education/Enrichment Activities - Engaging programs that encourage lifelong learning, creativity, and exploration, offering everything from hands-on activities to outdoor adventures and workshops. [ex: MT SAC classes, Vacation Playschool, Trail Trekkers, Senior Seminar Series, etc.]
Beginner/Introductory Activities - Fun and supportive programs that introduce new skills and activities, helping participants explore interests, learn the basics, and gain confidence in a welcoming environment. [ex: Water Tots, Webby Dance – Baby Ballet, Mobile Technology, Drawing, Kids Speed and Agility, Tot Soccer, T-Ball, etc.]
Drop-In Activities - Flexible, no-commitment activities that make it easy to join in, have fun, and connect with others. [ex: Open Lap Swim, Movie Matinee, Rec Swim, etc.]
Rentals - City facility spaces available for public use, providing convenient and flexible options for meetings, events, and gatherings. [ex: Community Center, Veterans Hall, Park Shelters, etc.]
Advanced/Intermediate Activities - Programs designed for participants who have built foundational skills and are ready for the next challenge through exciting instruction, friendly competition, and advanced skill development. [ex: Competitive Swim, Basketball Fundamentals – Level 2 and 3, Intermediate Gymnastics, etc.]
Private/Semi-Private Activities - Focused programs that offer personalized instruction or small group experiences, giving participants the opportunity to sharpen skills and enjoy a more individualized approach. [ex: Gators Water Polo, Private Piano Lessons, Youth Sports Organizations, Winter Women’s 30+ Thurs. Night Soccer, etc.]
TABLE 3-5: Service Categories: Actual to Target Cost Recovery %
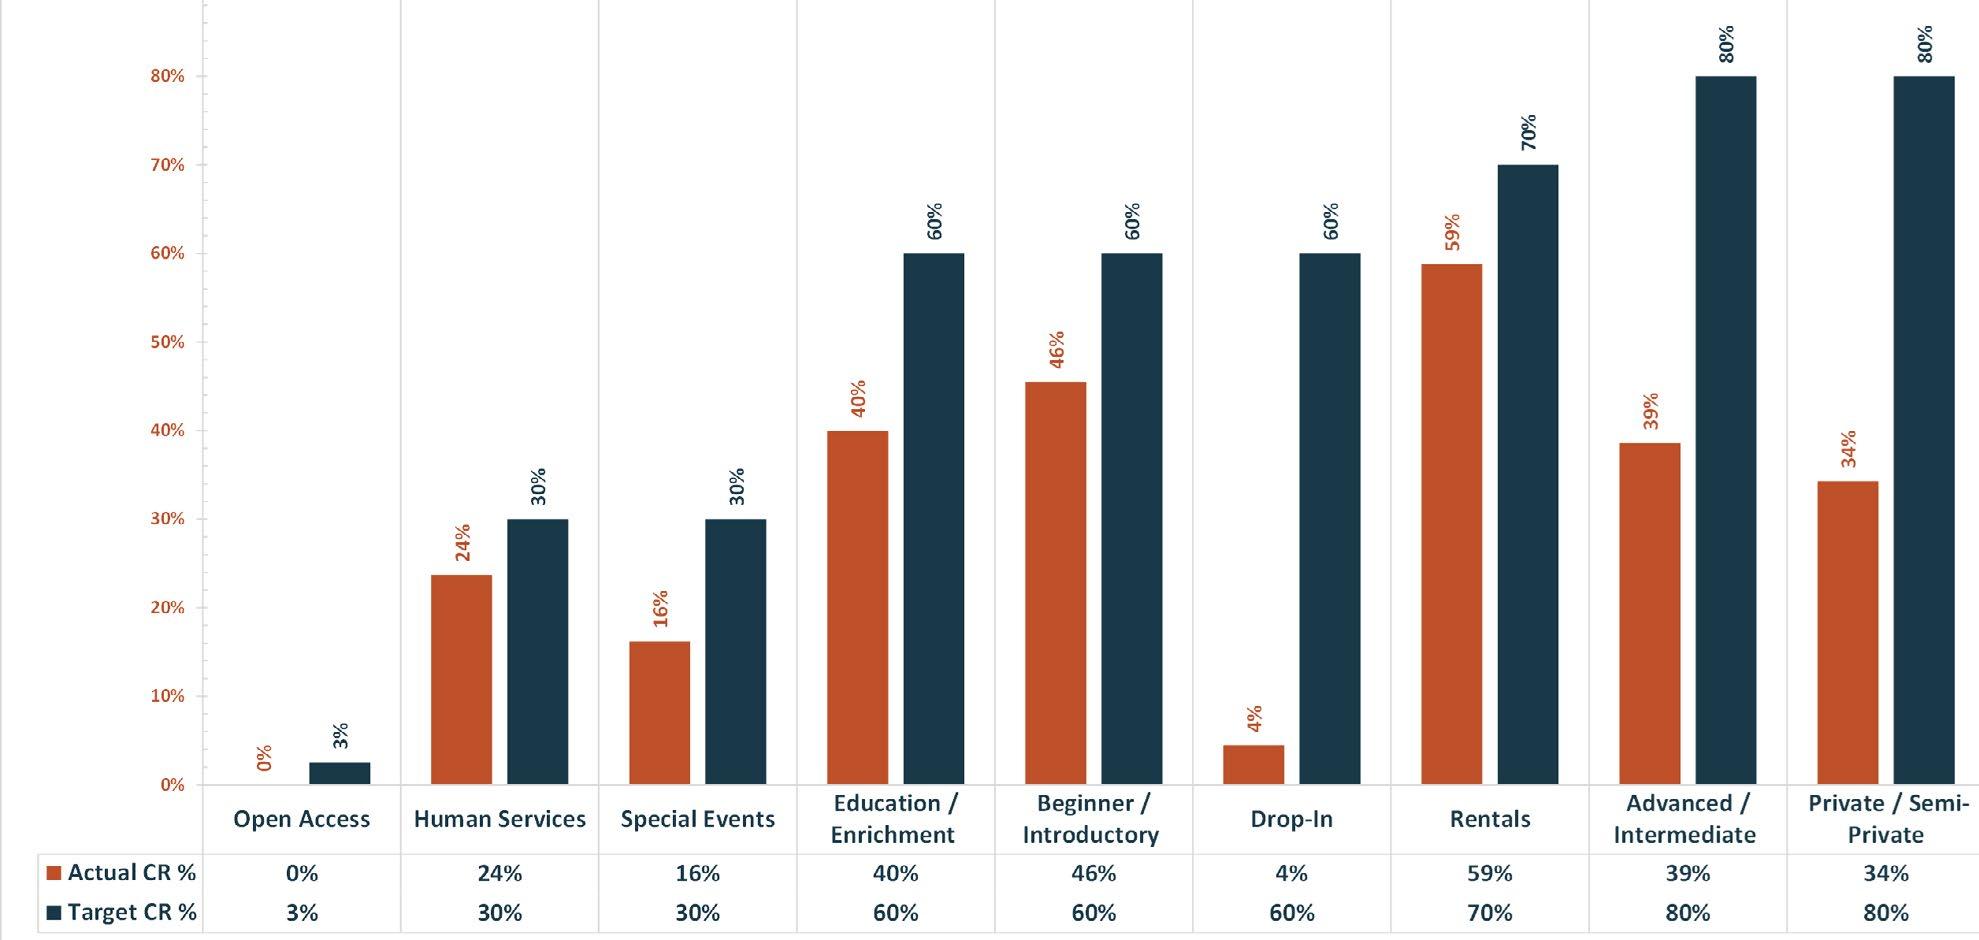
Completion of an operational cost-of-service analysis allowed the City to understand its cost-of-service of doing business, ultimately revealing each service’s cost recovery and subsidy investment level. Operational revenues (fees and charges, sponsorships, grants, donations), direct costs (expenses associated with the delivery of a service; without the service, the cost would not exist) and indirect costs (expenses that would exist with or without the provision of any one service) that the City provided were captured and attributed to all services as part of this work, providing several insights that would inform the design and development of the Parks and Recreation Department’s Tax Use/Revenue Generation Strategy.
NOTE: Capital expenses, which are a large portion of the Department’s total budget, were not included as they do not relate to the cost-of-service delivery.
Expenses and services were identified, to develop meaningful divisions, facility, and park areas to facilitate the appropriate attribution of expenses to services. The result is a clear picture of the total cost-of-service guiding the development of cost recovery/subsidy investment goals.
Results of the analysis provide a comprehensive review of fiscal year 2024, encompassing May 1, 2023 – April 30, 2024. The full results from the analysis and interactive features are available in the Cost-of-Service Results excel file provided separately. Selected results from the analysis are included below.
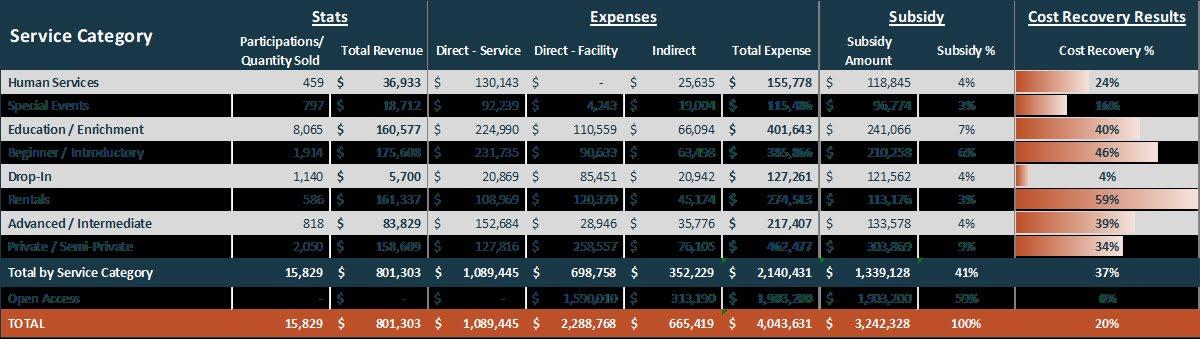
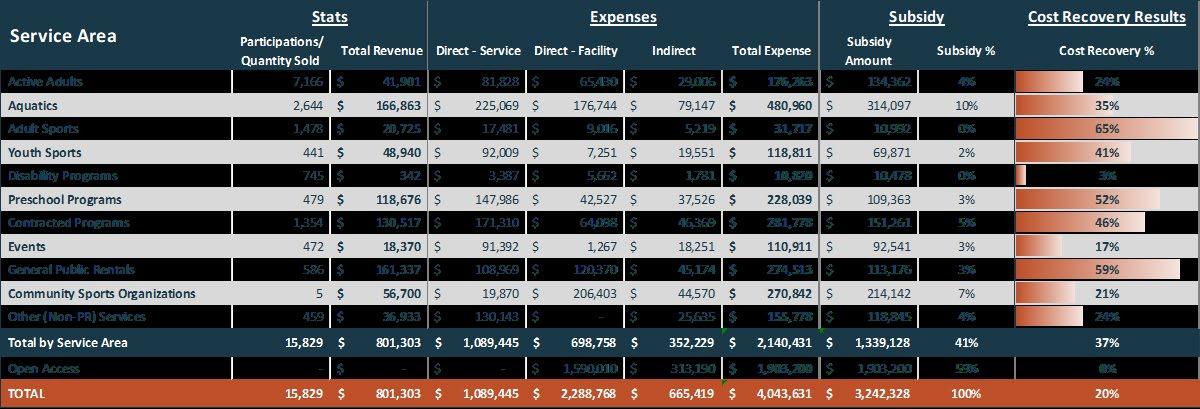

The Parks and Recreation Department’s tax use and revenue generation approach is illustrated as the “Parks and Recreation Sustainability Roadmap” is a continuum , presenting the degree to which financial resources will be spent and expenses will be recovered and managed. This strategy shifts from one that suggests that all services should be provided at no or low cost for everyone to an equitable philosophy where subsidy allocation decisions are based upon “beneficiary of service”. In this conceptualization, each type of service has a set of specific characteristics that provide a rationale for who should pay (e.g., taxpayers, the individual, or both) and to what degree. Ultimately, this aligns subsidy allocation, cost recovery goals, and expectations with beneficiary of service. The three-year Parks and Recreation Sustainability Roadmap includes the Parks and Recreation Department’s Service Categories and cost recovery/subsidy goals and expectations.
To prepare for and respond to future service and program demands, the evaluation examined current and emerging trends in recreation services and participation, with findings supported by industry-leading organizations.
Recreation Management Magazine’s 2025 Aquatic Trends Report revealed that the top five positively trending planned aquatic program additions include aquatic aerobics (up 7.1%), birthday parties (up 6.2%), dive-in movies (up 6%), ninja competitions (up 6%), and diving programs and teams (up 3.2%).
Another continuing trend that’s affecting aquatic operations for park and recreation agencies across the country is the challenge of recruiting and retaining part-time and seasonal staff. Organizations like the New York City Department of Parks and Recreation (NYC Parks) are taking the challenge head-on. As covered in NRPA’s 2025 Top Trends in Parks and Recreation article, NYC Parks are offering free municipal lifeguard training programs that provide a certification and employment track with the agency; the program includes 40 hours of swimming and rescue techniques, first-aid, and CPR. This example is corroborated by Recreation Management Magazine, citing that nearly one-fifth of agencies are relying on “other” benefits to attract and retain lifeguards, which include reimbursement for training and certification.
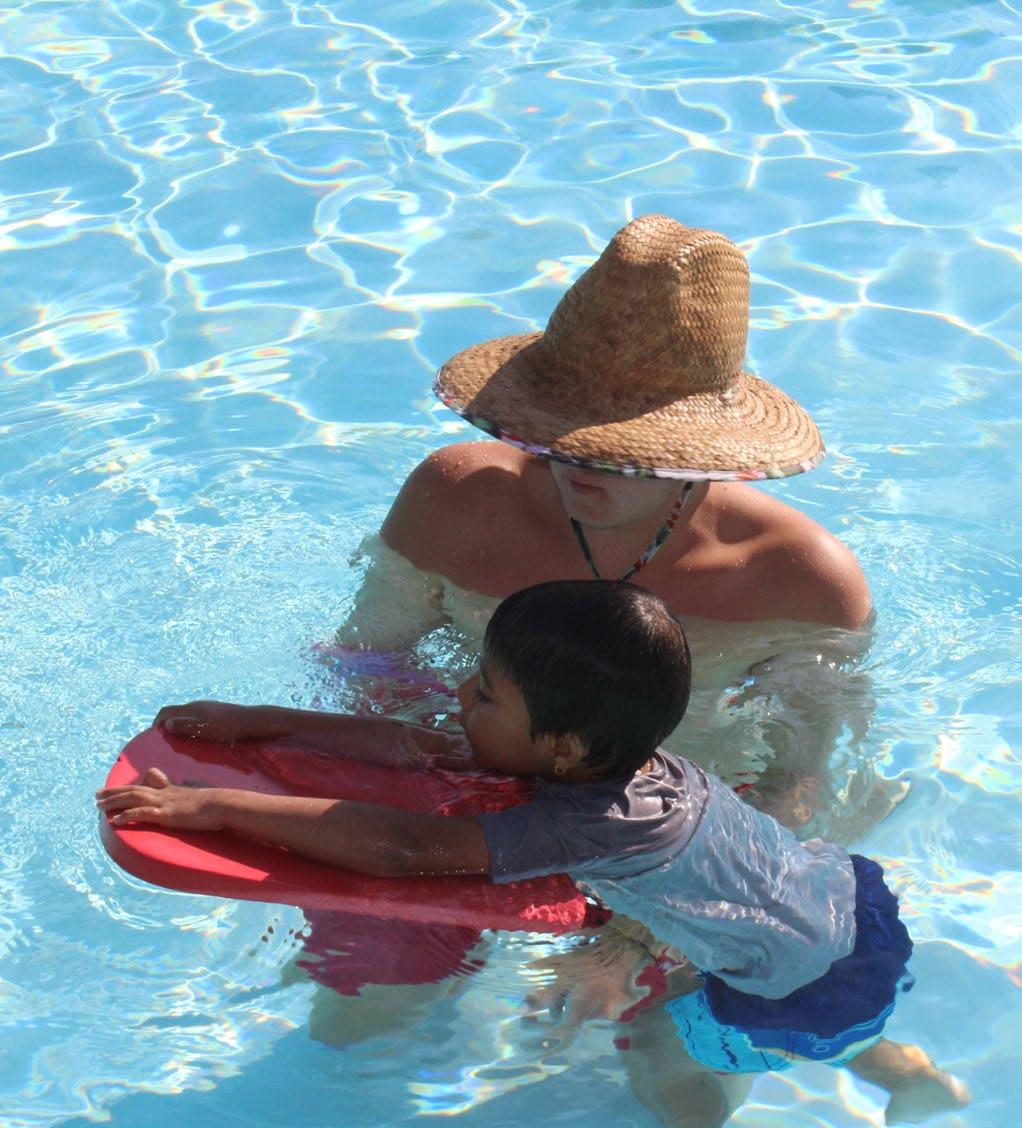
Sports, Fitness, and Leisure Activities’ (SFIA) 2024 Topline Participation Report reported that the fitness area continues to excel with over 200 million participating in fitness activities. The SFIA reports that health club-based fitness activities (e.g., treadmill, stair-climbing machine, stationary cycling, etc.) and class-based fitness activities (e.g., Barre, aquatic exercise, boot camp style training, etc.) all had good participation gains over the past year. It is also the most popular activity type for the Baby Boomer generation, Generation X, and Millennials, with each cohort showing over a 60% participation rate.
The SFIA showed that the most notable positively trending fitness activities over the past year are swimming for fitness (up 16.0%), Pilates training (up 15.0%), Barre (up 12%), and stair-climbing machines (up 8.0%). The five most popular fitness activities by total participation are walking for exercise, treadmill, free weights-dumbbells/ hand weights, running/jogging, and yoga.
With overall increased awareness around the importance of mental, emotional, and social health, park and recreation organizations nationwide are working to modify and implement services to address these needs. NRPA reports that nine in ten agencies take specific actions to ensure their health and wellness services promote health equity and more than four in five offer mindfulness programs that specifically target stress, anxiety, and positive decision making. Some common programs that are being implemented include: nature therapy, social-emotional learning programs, wellness checks, community healing activities, and substance use prevention programs.
The Outdoor Industry Association’s (OIA) 2025 Outdoor Participation Trends Report shows that the outdoor recreation participant base increased, growing 3% in 2024 to 181.1 million participants or 58.6% of the U.S. population ages 6 and older. The SFIA also reports that outdoor activities is the second most popular activity type for the Baby Boomer generation, Generation X, and Millennials, and the most popular among Generation Z with each cohort showing over a 45% participation rate.
The SFIA showed that the five most positively trending outdoor-related activities over the past year are climbing (up between 3.7-10.0% depending on type), bicycling-BMX (up 6.7%), fishing (up between 1.9-5.8% depending on type), bicycling-mountain (up 4.2%), and bird watching (up 3.8%). The five most popular outdoor-related activities by total participation are hiking (61.4 million), fishing-freshwater, bicycling-road, camping, and wildlife viewing.
NRPA’s Healthy Aging in Parks Survey Report shows that 44% of participating agencies are targeting adults as young as 50 years old for their senior program offerings and an additional 40% of agencies target the age of 55 years old. This segment of seniors, or soon-to-be seniors, are largely still a part of the active labor force, meaning that they can be a harder-to-activate sub-demographic due to their limited free time, especially when compared to those who are retired. Given this, programming for these newcomers can be challenging. Agencies can attempt to activate them in roundabout ways, like through family programming (e.g., family nights out, movies or concerts in the park). More targeted approaches may find success by focusing on socialization (e.g., pop-up beer gardens), higher-impact activities (e.g., running clubs), and even education services focused on career enhancement (e.g., leadership development).
Another trend among this demographic segment, highlighted by NRPA, is that individual and team sports activities are being adapted, specifically for seniors, to introduce new active and energetic activities. These programs, such as short mat bowling and walking soccer, are being played in small indoor spaces with modified rules that focus on concentration, teamwork, and camaraderie, versus agility and speed.
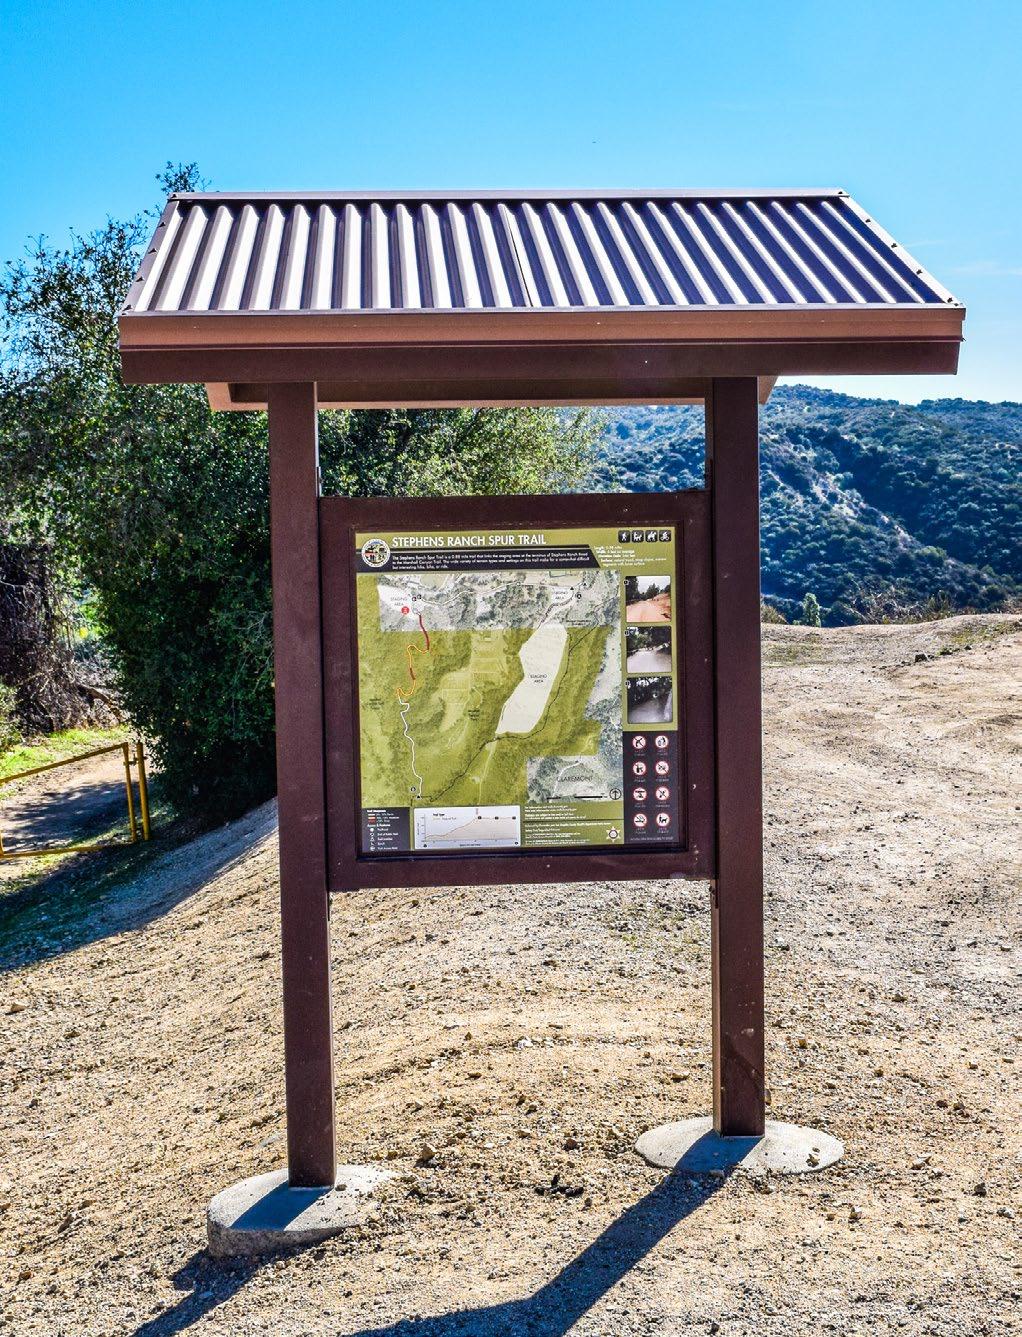
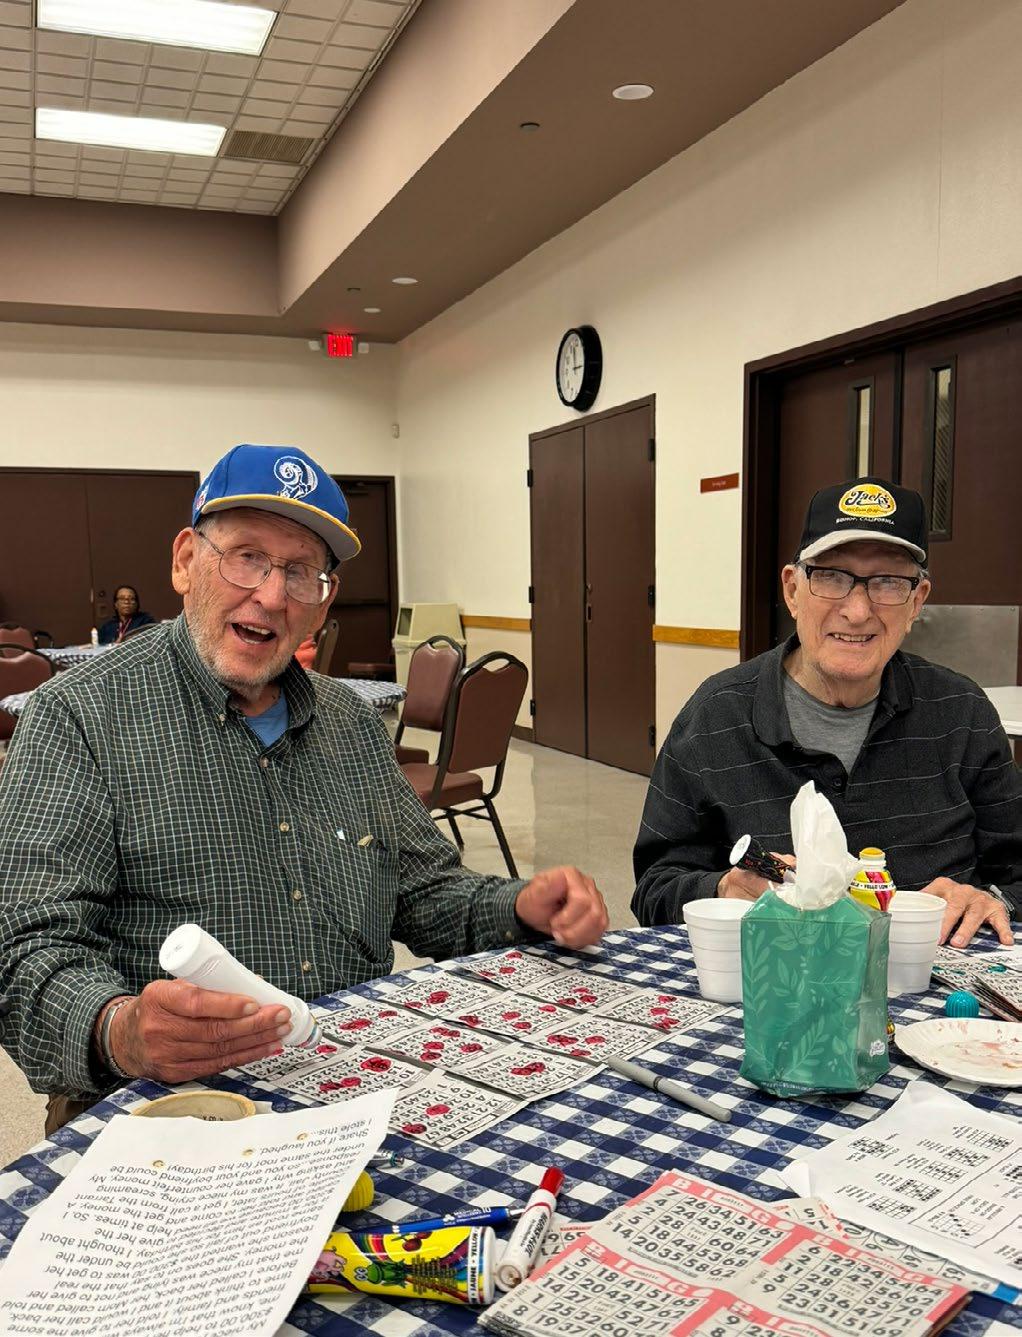
Pickleball continues to be the biggest standout trend in sports, which the SFIA reported is the fastest-growing sport for the fourth consecutive year. With 19.8 million participants in 2024, it has grown over 45% in the past year and 311% over the past three years. The sport continues its popularity that transcends generational appeal due to its low barrier to entry (i.e., cost, physical demand, and skill).
Another notable trend shows that after recent declines or stagnation in nationwide participation that predated the COVID-19 pandemic, youth team sports participation is beginning to trend upwards once again, as reported by both The Aspen Institute and the SFIA. The Aspen Institute’s State of Play 2024 report indicated that youth sports participation for children ages 6-17 showed a 6% uptick, resulting in the highest rate since 2015.
The SFIA showed that the ten most positively trending sports-related activities over the past year are pickleball (up 51.8%), cardio tennis (up 27.3%), golf (up between 3.9-18.8%), swimming-team (14.6%), ice skating (up 13.4%), volleyball-court (up 13.4%), bowling (up 12.5%), trail running (up 12.3%), ice hockey (up 9.9%), and football-7-on-7 (up 9.1%).
The ten most popular sports-related activities by total participation are bowling (47.6 million), golf (45 million), basketball (29.7 million), tennis (23.8 million), pickleball (19.8 million), baseball (16.7 million), trail running (14.9 million), soccer-outdoor (14.1 million), ice skating (11.4 million), and skateboarding (8.9 million).
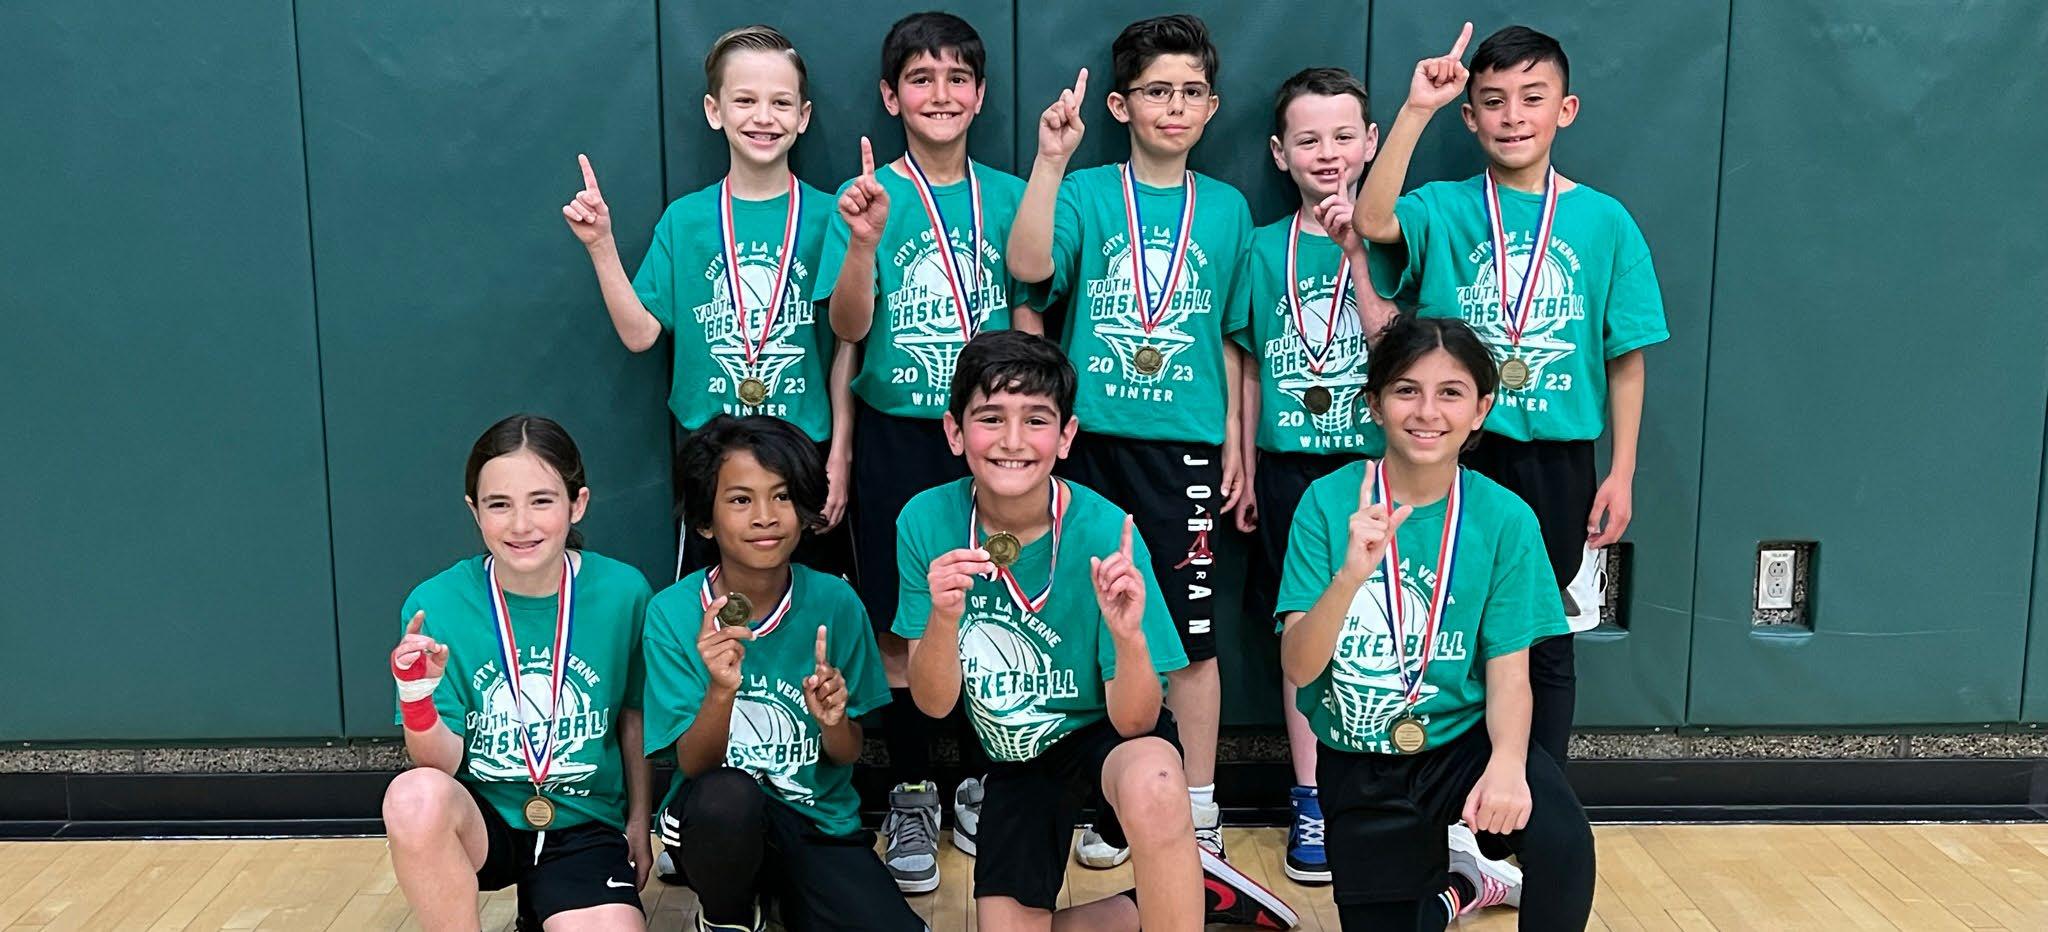
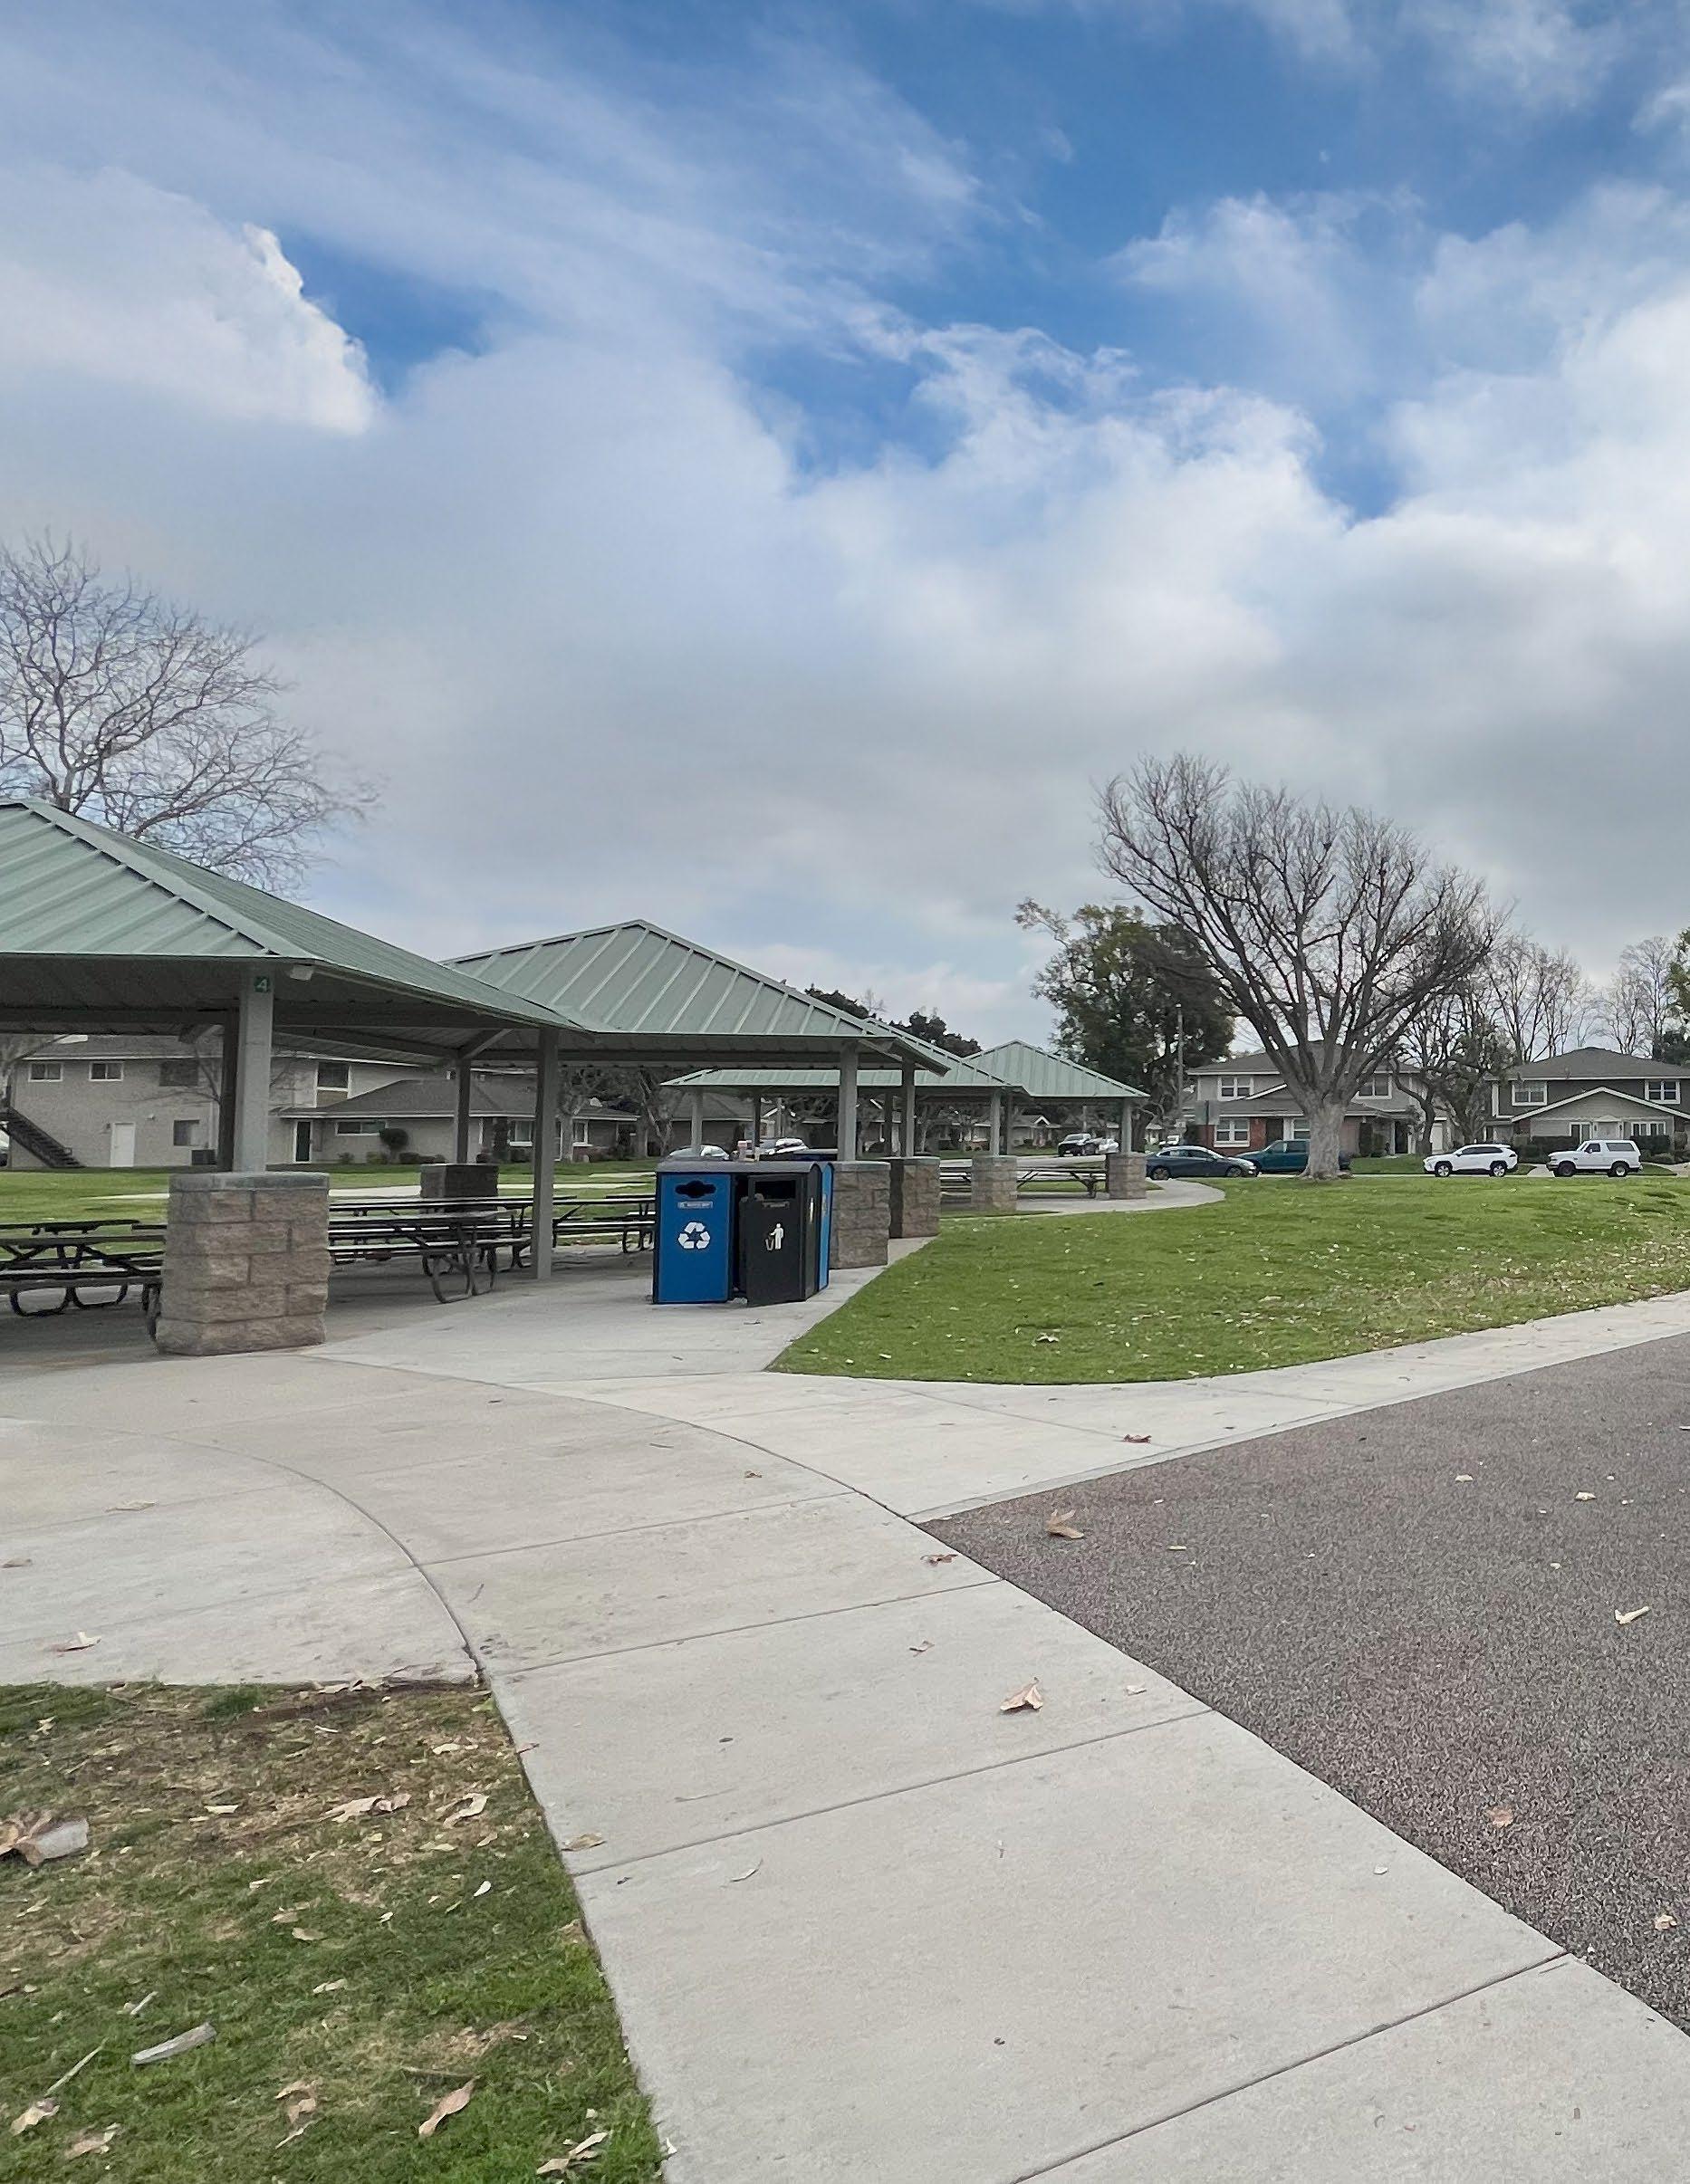
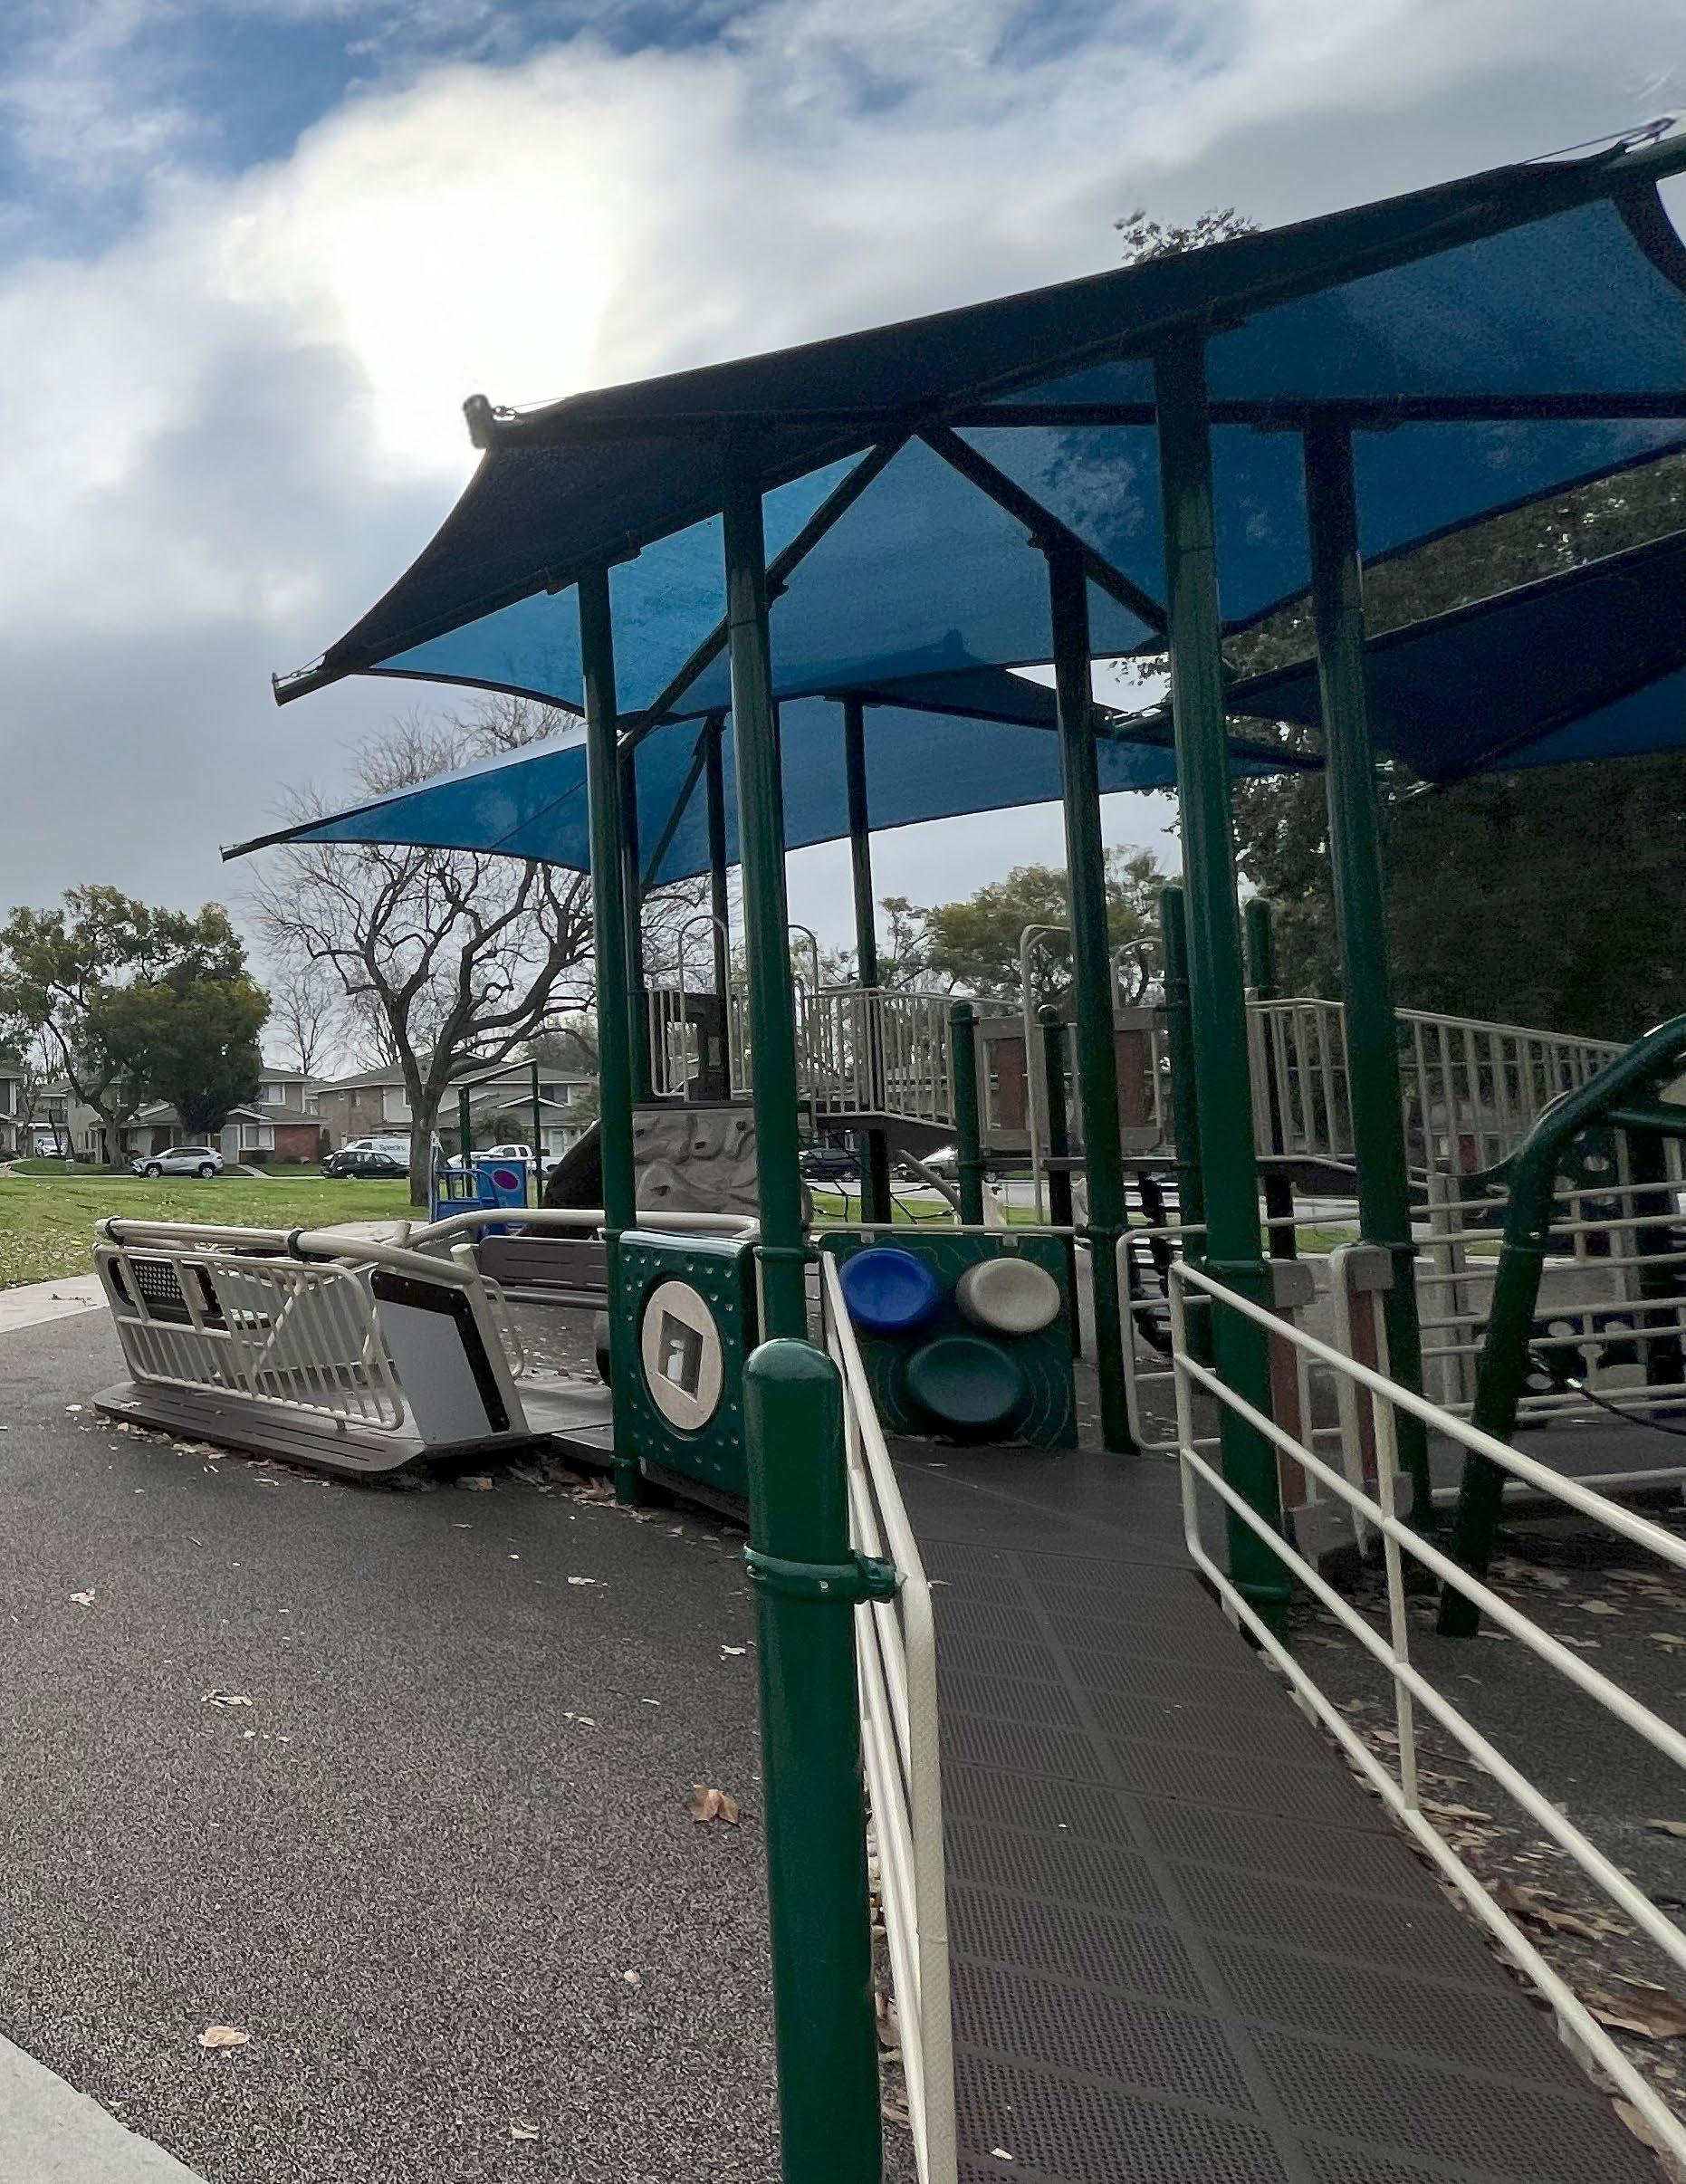
The City’s park maintenance operations team successfully manages a diverse park system totaling roughly 125 acres, spanning high-use community hubs, neighborhood parks, and natural open spaces. The following sections describe key elements of the City’s current maintenance operations and how they contribute to the overall success of the City’s parks and recreation system.
The Parks Division is a subdivision of the Public Works Department, which in addition to providing input to this Plan, holds a broad range of responsibilities outside of the purview of the Parks & Recreation Department. The data collected for this Plan reflects only those Parks Division activities that directly support Parks & Recreation programming, including restroom cleaning and restocking, trash collection, and graffiti removal. It is recommended in Section (X) that the Public Works Department develop a Maintenance Management Plan to more accurately and comprehensively capture the full scope of the Division’s contributions.
This chapter serves a planning-level snapshot of the tasks the City’s maintenance staff complete to provide the highest level of maintenance possible with existing staffing and financial resources. This chapter sets the foundation for a future, in-depth Maintenance Management Program endeavor that will allow the City to take a deeper dive and develop sustainable and fiscally-responsible maintenance strategies and implementation processes.
» Summer – Highest daily workload, driven by peak turf growing season and events, requiring full staffing and supplemental labor.
» Fall – Increased sports field usage and debris/drain tasks from leaf drop and storms.
» Winter – Lowest daily service volume, creating opportunities for preventive and capital maintenance.
» Spring – Ramping up for peak summer activity with increased weekend coverage.
Seven parks—Oak Mesa, Pelota, Las Flores, La Verne Sports Park, Live Oak, Wheeler Avenue, and Kuns—are considered high impact sites. These sites have average asset condition scores and high community demand, making them priority candidates for intensified maintenance and targeted capital investment.
Systemwide, the City’s assets score relatively high due to existing maintenance operations. When comparing assets against each other, lighting, basketball courts, sport fencing, and picnic tables emerge as the lowest-scoring amenities. City strives to balance and make distinctions between high-use park site assets, such as those found at Las Flores Park, and low-use site assets to ensure they are able to be enjoyed by the community.
The 2025 survey reinforces operational findings top resident concerns including restroom cleanliness, lighting, trash management, and playground upgrades. Demand is high for shade structures, trails, and enhanced amenities in neighborhood parks.
» Implementing all recommended improvements requires ~1.0 additional FTE equivalent, split between a permanent hire and seasonal contract labor, plus ~$128K in annual recurring costs and ~$345K in onetime capital investments.
La Verne’s parks system is a blend of community gathering hubs, neighborhood-serving green spaces, and natural/ open-space assets. The system’s size, diversity of park types, and high-intensity amenities at certain sites directly drive maintenance needs. This diverse blend of assets and spaces directly corresponds to the various tasks the City’s maintenance staff are responsible for. This general understanding will allow the City to assess and identify the new opportunities that can lead to a sustainable maintenance operations processes.
The following major maintenance task categories should be recognized as primary workload drivers within the park system. This list represents the large variety of tasks maintenance staff complete throughout the year to ensure parks are welcoming, comfortable, and safe for La Verne residents. The intensity and level of effort for these tasks will vary by season, special events, and recreation programs offered. It is also important to recognize everything listed below to accurately reflect true staff workload, preventive maintenance demand, and lifecycle asset preservation needs.
» Core grounds maintenance
» Turf mowing across park and field areas
» Edging and string trimming around hardscape and amenities
» Turf renovation and patch repair
» Aeration and overseeding coordination
» Sports turf rotation and recovery work
» Landscape & Vegetation Management
» Weed abatement and control
» Shrub and hedge trimming
» Landscape bed maintenance and mulching
» Plant replacement and seasonal planting
» Integrated pest management activities
» Irrigation System Operations
» Irrigation head, valve, and lateral repairs
» Controller programming and seasonal adjustments
» Coverage audits and efficiency tuning
» Leak detection and mainline response
» Backflow coordination and testing support
» Tree Care
» Tree pruning and clearance trimming
» Hazard limb mitigation
» Young tree establishment care
» Contractor coordination for removals and major pruning
» Park Asset & Infrastructure Repair
» Benches, tables, and furnishing repair
» Fence and gate repair
» Signage replacement
» Minor concrete and hardscape repair
» Trail and pathway patching
» Playground & Athletic Facility Maintenance
» Playground inspections and corrective repairs
» Safety surfacing leveling and replenishment
» Field lining and striping
» Infield and court maintenance
» Sports equipment setup and repair
» Electrical & Lighting Systems
» Park lighting inspection and minor repair
» Fixture and control replacement
» Irrigation controller electrical troubleshooting
In addition to this exhaustive list of tasks the Public Works maintenance staff conduct throughout the year, the Parks and Recreation Department also shares various maintenance responsibilities, most notably the closing of restrooms seven days per week and reopening them on Fridays, Saturdays, Sundays, and holidays. The exception to this schedule is the Fourth of July, when opening and closing responsibilities are managed by the Public Works Department.
Ongoing coordination between the two departments is essential as they continue to evaluate operational efficiencies and the financial resources.
Table 4-1 depicts fiscal year 2024-205 budget allocation resources across administrative, field operations, and contracted service lines. This section also blends LMAD/LLMD funding to show the full financial picture for park maintenance. It serves as a snapshot for how general fund allocations generally affect the maintenance operations that are expected of staff.
TABLE 4-1: General Fund – Public Works, Parks Division DIVISION
Parks Administration
Parks Division
Parks Division –
Observations:
$520,044
$665,170
$1,098,852
Insurance; City water for parks; training; A&E
Contract maintenance
$500,000; other contractual
$250,000; utilities. fleet; supplies
$520,044
$1,764,022
Administrative backbone for parks operations.
Daily field labor with large, contracted scope for specialized services.
Contract-heavy, following a six-year grid trimming model.
» Nearly $750,000 in contracted services (maintenance + trees) effectively supplements City crews.
» Public Works, Parks Division is the operational workhorse, managing both in-house daily service and vendor oversight.
» Admin’s large utility line underscores the irrigation and facility water footprint.
Benchmarking La Verne’s maintenance program against NRPA data helps confirm the system’s true workload and funding needs. This comparison uses NRPA’s 2025 Agency Performance Review data for cities serving 20,000–49,999 residents, the population range most comparable to La Verne (32,000).
TABLE 4-2: Benchmark Matrix
Acres of Parkland
La Verne has more parks per capita than peers; this increases daily workload.
La Verne manages fewer acres per 1,000 residents, but the City has higher-intensity developed acres.
Staffing is lean compared to peers; preventive maintenance capacity is limited.
La Verne spends less per resident than peers; budget expansion is needed to meet expectations.
La Verne is slightly above peer median per acre, reflecting its more developed, laborintensive system. Revenue as % of Expenditures (Cost Recovery)
La Verne recovers less than peers; opportunity to increase rentals, events, or partnerships.
NRPA benchmarking is a useful way to frame La Verne’s maintenance and funding needs relative to similarly sized agencies, but it should be used as a context tool rather than a one size fits all standard. NRPA’s Agency Performance Review is based on self reported agency data and presents median and quartile ranges to show where an agency sits within a peer distribution, not a required target.
La Verne’s ratio of 1,455 residents per park is significantly lower than the peer median (2,071 residents per park), which means the City operates more park sites per resident than many comparable jurisdictions. This is generally a positive community service outcome because it reflects distributed neighborhood access and a strong local park presence. However, from an operations perspective, it also creates a much more demanding maintenance environment.
A higher number of sites increases the number of:
» Trash pickup points
» Restroom checks and cleaning cycles
» Opening and closing tasks
» Safety inspections
» Irrigation controllers and landscape zones
» Travel time between sites
» Work order interruptions and reactive callouts
In other words, even if total acreage is not high, the number of locations drives recurring labor demand. Smaller neighborhood parks can be especially labor intensive when spread across the city because staff lose efficiency to travel, setup, and repeated site mobilization. This helps explain why La Verne may feel “busy all the time” operationally even when acreage based comparisons suggest a smaller system.
Strategic implication: La Verne’s maintenance model should be planned around site count and service frequency, not acreage alone.
La Verne’s estimated staffing level of ~6.6 FTEs per 10,000 residents is below the peer median of 9.6 FTEs, placing the City on the lean side of the benchmark range. This suggests La Verne is likely relying on a highly efficient team that is covering a broad workload, but it also indicates limited capacity for proactive and preventive maintenance.
In lean staffing conditions, agencies often experience a predictable pattern:
» Priority work gets completed (trash, safety, visible complaints)
» Lower visibility work is deferred (preventive repairs, turf conditioning, pruning cycles, detailing)
» Staff spend more time in reactive mode
» Seasonal peaks create service stress
» Equipment downtime and deferred replacement have larger operational impacts
This does not necessarily mean current staff performance is inadequate. In many cases, it means staff are working at or near capacity and have little room for:
» Quality control
» Training and cross training
» Planned improvements
» Event support without service trade-offs
» Lifecycle maintenance tasks that prevent larger future costs
Strategic implication: The staffing benchmark gap supports the need to evaluate additional maintenance capacity, whether through phased full time positions, seasonal labor, contract support, or route based deployment improvements.
La Verne’s estimated operating expenditure per capita (~$84) is below the NRPA peer median ($112.38). This indicates the City is spending less per resident than typical peer agencies in this population group, even while maintaining a system with a high number of parks per resident.
This gap is important because community expectations generally align with:
» Cleanliness
» Landscape appearance
» Repair response times
» Program readiness
» Safe and functional amenities
Those expectations do not decline simply because an agency has a lower operating budget. When per capita funding is below peer levels, agencies often bridge the gap by:
» Stretching staff coverage
» Deferring non critical maintenance
» Using one time fixes instead of durable repairs
» Limiting replacement cycles
» Reducing service frequencies in less visible areas
Over time, that can create a “hidden backlog” where park conditions remain acceptable in core areas, but system resilience declines and maintenance becomes more expensive to catch up.
Strategic implication: The benchmark indicates a likely maintenance capacity funding gap, not just a budget variance. Incremental operating investment should be tied to clearly defined service level outcomes so decision makers can see what additional funding buys (for example, more frequent litter collection, improved turf conditions, faster repair response, and better preventive care).
La Verne’s estimated operating expenditure per acre (~$9,500) is slightly above the peer median ($8,979 per acre), even though the City’s acres per 1,000 residents is below the peer median. This is a key finding and should be viewed as a sign of system intensity, not inefficiency.
Per acre costs rise when parkland is more developed and actively maintained. For example, developed acres with the below cost substantially more to maintain than passive or natural acreage.
» Irrigated turf
» Planting beds
» Playgrounds
» Sports courts and fields
» Restrooms
» Trails and hardscape
» Lighting and amenities
» High visitation and use
This means La Verne’s system likely demands more labor and operating inputs per acre than a peer city with larger amounts of passive open space. As a result, comparing only total acres can understate La Verne’s actual maintenance burden.
Strategic implication: La Verne should continue to communicate maintenance needs using a workload based lens (developed acres, amenity counts, site count, and service frequency), rather than relying only on total acreage metrics.
La Verne’s estimated cost recovery (~15 to 20%) appears below the peer median (25.80%), suggesting there may be room to increase revenues from rentals, events, and partnerships. However, this should be approached strategically because cost recovery levels vary significantly by agency mission, facility mix, and community equity goals.
A lower cost recovery percentage is not automatically a problem if the City intentionally prioritizes:
» Affordable access
» Community benefit programming
» Neighborhood park services that are not intended to be self supporting
That said, La Verne may still have opportunities for modest gains without changing the City’s public service mission, such as:
» Improved rental utilization and pricing alignment
» Expanded special event partnerships or sponsorships
» Better recovery of direct event support costs
» Permit and reservation system improvements
» Select fee adjustments tied to market demand and service quality
» Activation of underused spaces during off peak periods
The strongest strategy is usually not “maximize fees,” but rather targeted cost recovery in areas where the market can support it, while protecting low cost community access.
Strategic implication: La Verne can likely improve revenue performance through focused operational and pricing strategies, but cost recovery should be treated as one tool to support maintenance sustainability, not a substitute for baseline public funding.
Overall, the benchmark comparison suggests that La Verne operates a high touch park system with more sites per resident than typical peers, but does so with lean staffing and below median per capita spending. The result is a system that likely performs through staff efficiency and prioritization, yet has limited margin for preventive maintenance, service expansion, or sustained quality improvements. La Verne’s slightly higher per acre costs are consistent with a more developed and labor intensive park system, not necessarily overspending. The benchmark findings support a planning direction focused on right sizing maintenance capacity, aligning funding to service levels, and pursuing targeted cost recovery opportunities where appropriate.
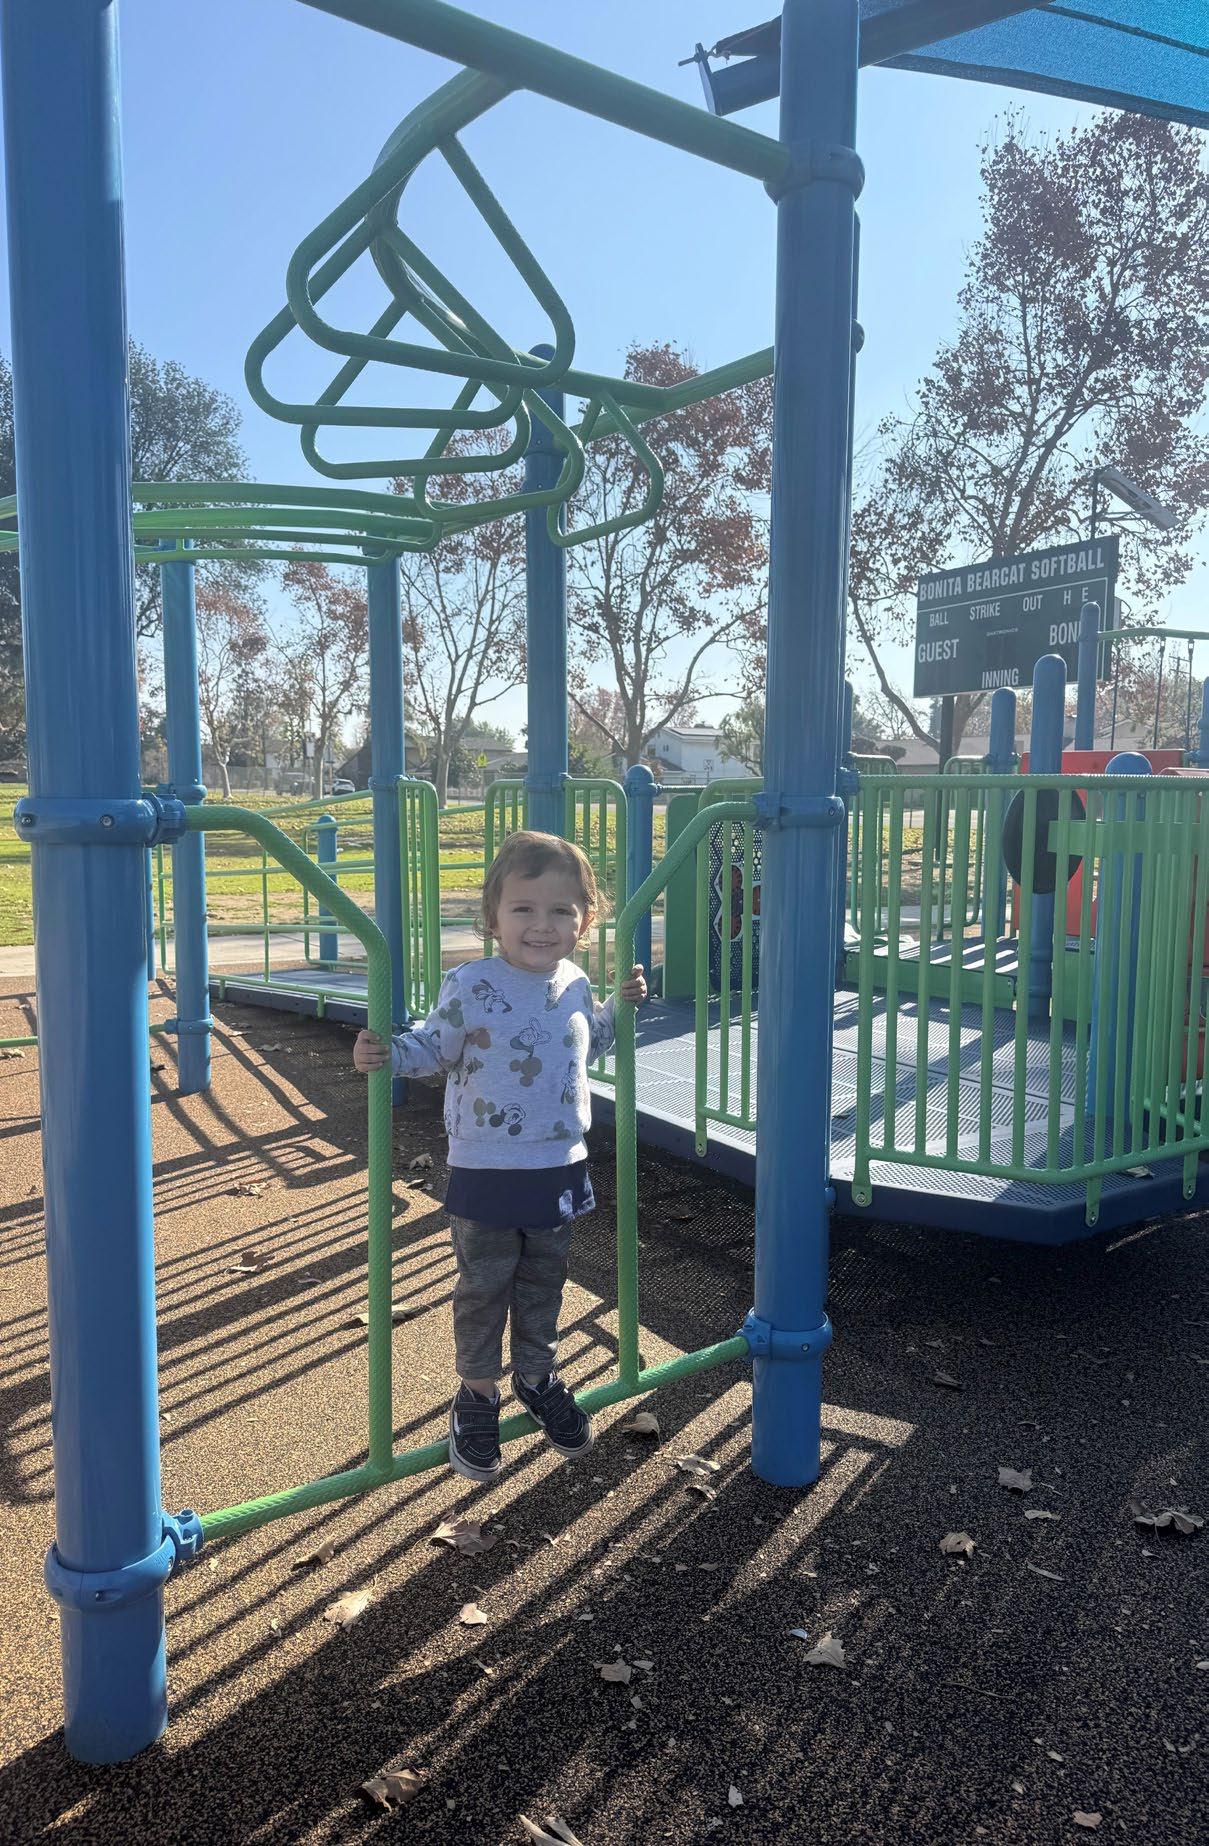
This dataset directly links asset condition with maintenance demand across the park system. Amenities with lower condition scores are more likely to generate reactive maintenance, unscheduled work orders, and staff time volatility. These patterns align with what was observed in daily maintenance logs.
The table below summarizes each park’s average condition score across all assessed amenities, based on the qualitative scoring (scale of 1-4 with 4 being the highest rating).
TABLE 4-4: Average Park Condition Scores
limited built infrastructure and lower wear pressure.
plaza performing well overall; recent hardscape and amenity investments showing positive results.
amenities in generally good condition with manageable maintenance needs.
Los
» High-use sports parks (Las Flores, La Verne Sports Park, Wheeler Avenue, Oak Mesa, Pelota) cluster in the 2.7–3.0 range, indicating that condition is being maintained only through sustained service hours and reactive effort.
» Smaller neighborhood parks (Kuns, Los Encinos, Live Oak) score lower not because of volume, but due to aging infrastructure and limited reinvestment, increasing the risk of future maintenance escalation.
» Golden Hills Wilderness Park and Mainiero Square stand out as top performers for different reasons. One is due to minimal built assets, the other is due to recent capital investment and visibility-driven maintenance focus.
» No park is currently in “poor” condition overall, but several are hovering just above the threshold where deferred reinvestment will begin to drive maintenance inefficiency.
Reviewing average scores by amenity type highlights where systemwide weaknesses—and future workload pressures—are concentrated.
TABLE 4-5: Condition by Amenity Type
Entry signage
Bins (trash + recycle)
Drinking fountains
Picnic tables
Shade structures
Play structures (ages 5–12)
Play structures (ages 2–5)
Safety lighting
Sport fencing
Basketball courts
Sports lighting
3.1
3.1
Generally serviceable; cosmetic aging present.
Functional but often dented, faded, or mismatched.
3 Fixtures aging: some repairs and replacements needed.
2.8 Weathering and surface wear common across parks.
2.9 Structural soundness is generally acceptable; finishes aging.
3.1 Holding up better than younger-age equipment.
3
2.8
2.6
Moderate wear: surfacing and hardware attention needed.
Several dim or non-functional fixtures noted.
Rust, bent sections, and gate failures observed.
2.5 Surface wear, faded striping, and aging hoops.
2.3
Lowest-performing category; frequent failures and high repair cost.
» Sports lighting, sport fencing, and basketball courts represent the highest-priority condition risks, both from a safety and workload standpoint.
» Picnic tables, benches, and bins consistently score below optimal which suggesting a need for planned replacement cycles, not ad-hoc repairs.
» Play structures are generally serviceable but trending toward mid-life condition, indicating upcoming capital pressure.
4.4.3.
» Align daily maintenance with condition risk: Amenities scoring below 2.8 should be placed on proactive inspection and minor-repair rotations to reduce reactive calls.
» Feed Capital Improvement Program prioritization: Lighting, fencing, and court surfaces, particularly at Wheeler Avenue, Lincoln, Live Oak, and Oak Mesa Parks, should be early CIP candidates.
» Leverage LMAD and contract scopes: Routine bench, fencing, and minor amenity repairs can be embedded into LMAD vendor contracts to stabilize workloads and preserve City staff capacity.
» Use condition scores as an early-warning system: Parks currently clustered in the 2.6–2.8 range represent the next tier of reinvestment need before condition degrades further and maintenance costs spike.
Source: 2025 statistically valid survey
Method: Mailed invitation + open link responses, weighted to reflect city demographics.
» Familiarity: 54% of invitation respondents and 74% of open link respondents rate themselves highly familiar (4–5 on 5-point scale) with La Verne’s parks and recreation offerings.
» This level of awareness supports high participation in park amenities but also correlates with higher reported wear and tear on high-traffic sites.
» Top Visited Sites: Las Flores Park, Kuns Park, Heritage Park, Live Oak Park, and La Verne Sports Park rank as the most frequently visited.
» Visit Frequency: Over 60% of respondents report visiting a city park at least monthly, and 30% weekly or more.
» Activity Drivers: Playground use, walking trails, sports fields, and special events were the most common activity categories.
Operational tie-in: These high-use patterns align with the higher restroom cleaning and trash collection counts in our maintenance logs.
Satisfaction
» Overall satisfaction with the park system is high, but:
» Lower ratings for restroom cleanliness (noted by ~20% as needing improvement).
» Concerns about lighting, parking availability, and trash/litter management.
Link to condition scores: Lighting and trash/recycle bin condition ratings from the condition assessment are consistent with these survey pain points.
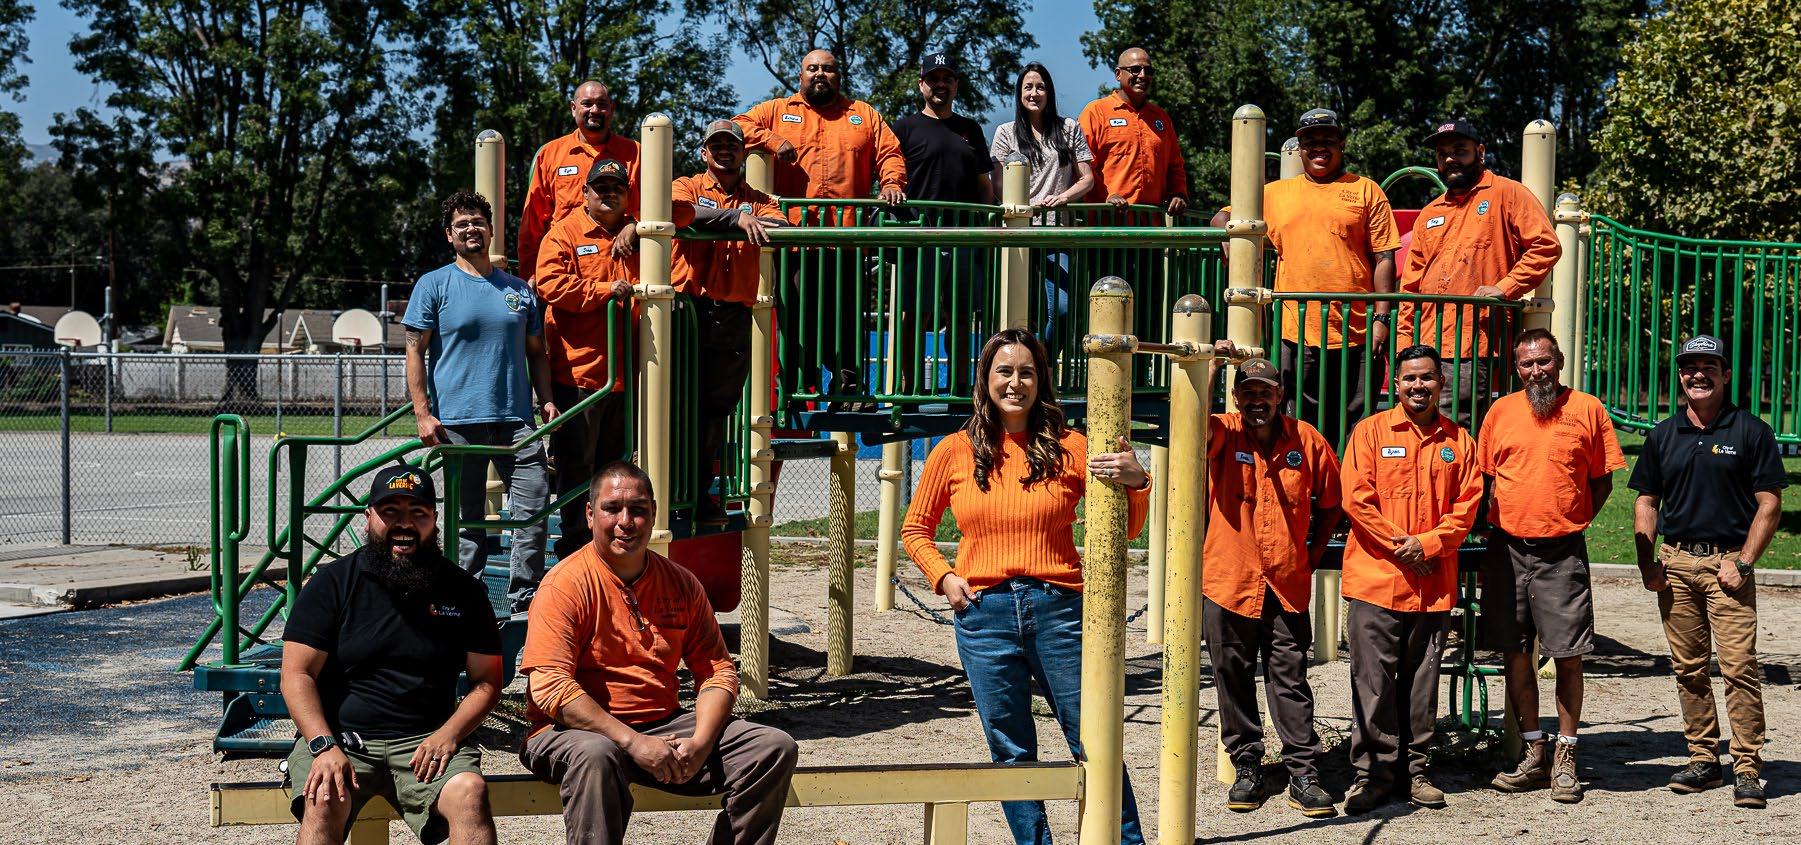
Respondents identified top priorities for:
1. Walking/biking trails (new or extended)
2. Shade structures
3. Restroom upgrades
4. Playground improvements
5. Sports field lighting.
Maintenance implication: Restroom upgrades would reduce the daily cleaning burden by improving durability; lighting improvements could shift some maintenance hours from repair to preventive inspection.
Barriers to Use
» Perceived safety (especially in unlit or less-visible areas)
» Lack of amenities in certain neighborhood parks
» Limited parking at peak times for large events
These factors suggest that maintenance and design improvements could have direct usage impacts.
Communication
» Most residents learn about facilities and programs via word of mouth and social media.
» Opportunity exists to integrate maintenance updates (closures, repairs, upgrades) into the City’s communication plan to build trust and transparency.
TABLE 4-6: Survey–Operations Matrix
SURVEY PRIORITY /
Restroom cleanliness
Lighting improvements
Trash/litter management
Playground improvements
Shade structures
Trails expansion
70%+ of all daily log tasks are restroom cleaning
Avg. condition score: 2.80
22% of workload; bin condition score: 2.90
Condition score: 3.05
Mid-condition, heat-related use drops
Evaluate staffing levels, frequency, and durability upgrades
Prioritize lighting upgrades in CIP; add to preventive maintenance schedule
Increase bin replacement cycle; evaluate event waste contracts
Capital reinvestment in surfacing, equipment, and shade
CIP integration; maintenance checks before summer
Not heavily featured in daily logs Plan for future maintenance capacity if built
This planning-level assessment of the City’s maintenance operations provides a general understanding of current operations using data collected over the last fiscal year. It sheds light into the successes and areas of opportunity regarding maintenance and the expectations residents have on the City. To set up the City for success for a future Maintenance Management Program planning process, the following systemwide recommendations should be considered:
1. City to assess maintenance operations every 2-3 years to identify new gaps and efficiencies
2. City is highly encouraged to transition away from hand-written reports to digital means of logging maintenance operations. By doing so, they will have clearer records that can be used for future assessments.
3. City is encourages to develop a detailed Maintenance Management Program. This will allow the city fully understand daily, weekly, and seasonal maintenance operations. This will help to ensure public safety, maximize asset lifespan, reduce long-term repair costs, and maintain clean, welcoming spaces that foster community health.
The following section describes the recommended maintenance priorities that the City can consider implementing to maintain a sustainable maintenance framework using existing resources. This prioritization framework is intended to combine three inputs:
1. Workload: Summarized maintenance tasks from the daily logs and staff input. The data confirms the overall mix and seasonality of work.
2. Condition: Asset condition assessment score by park (higher score indicates better condition). The assessment provides an average condition score for every park in the 21-site system.
3. Survey priority and demand: The survey identifies the most frequently visited sites and confirms resident concerns related to maintenance outcomes such as restrooms, lighting, and trash management.
» Tier 1: High impact service hubs: Documented as high impact workload sites and or top visited sites, where condition risk directly threatens day-to-day service.
» Tier 2: Stabilization and preventive focus: Moderate demand or mid condition, where targeted preventive work prevents escalation.
» Tier 3: Sustain and protect: Lower day-to-day pressure or stronger condition, managed through planned replacement cycles and seasonal preventive work windows.
1. Service pressure is concentrated: Seven parks are explicitly identified as generating more than a third of annual restroom and trash workload, so Tier 1 must be protected operationally.
2. The same parks driving demand are also the parks where condition risk matters most: High-use sports parks cluster in the 2.7 to 3.0 range and several neighborhood parks sit at 2.6 to 2.8, which creates risk of rising reactive work if reinvestment is delayed.
3. Amenity weaknesses are consistent across the system: Lowest-scoring system amenities include sports lighting, sport fencing, and basketball courts, with picnic tables also trending low. These should drive packaged maintenance and CIP actions.
4. The workload mix tells you where efficiency is gained: Restrooms and trash are the core workload. Improving restroom durability and creating predictable preventive cycles is the most direct way to stabilize routes and reduce reactive work.
This action matrix is structured around three parallel tracks that the documents support:
» Protect Tier 1 hubs with higher preventive frequency and route stability
» Apply condition-driven repair packages focused on lighting, fencing, courts, and picnic infrastructure
» Use planned replacement cycles and seasonal windows for Tier 3 sites
Systemwide standard package
» Restroom durability package: deep clean cycle, coatings, fixture inspection cadence
» Lighting reliability package: preventive inspection schedule plus CIP replacement where needed
» Courts and fencing package: crack sealing, striping, gate hardware, panel replacements
» Furnishings replacement package: bins, picnic tables, benches on a predictable cycle
Las Flores Park Tier 1
La Verne Sports Park Tier 1
Live Oak Park Tier 1
Heritage Park Tier 1
Kuns Park Tier 1
Oak Mesa Park Tier 1
Pelota Park Tier 1
Wheeler Avenue Park Tier 1
Lincoln Park Tier 1
Challenger Park Tier 2
Emerald Park Tier 2
Mills Park Tier 2
Los Encinos Park Tier 2
Valley Rancho Park Tier 3
Restroom durability package, trash surge planning, sports lighting and fencing package
Sports lighting and fencing package, court surface maintenance, restroom durability package
Restroom durability package, furnishings replacement package, phased upgrades plan
Trash surge plan, restroom deep clean cycles, picnic infrastructure replacement cycle
Playground and furnishings replacement cycle, restroom durability package
Lighting and fencing package, restroom durability package, furnishings replacement cycle
Courts and fencing package, restroom durability package, bin replacement cycle
Lighting and fencing package, restroom durability package, preventive inspection cadence
Lighting and fencing package, court maintenance, furnishings replacement cycle
Court surface package, bins and benches replacement cycle
Preventive rotations for fixtures, bins and picnic tables replacement cycle
Furnishings replacement package, playground mid-life inspection cycle
Furnishings replacement package, lighting inspection and targeted upgrades
Maintain baseline routes, planned replacement cycle for bins and tables
Lordsburg Park Tier 3 Maintain baseline routes, preventive inspections
Lowell Brandt Park Tier 3
Maintain baseline routes, preventive inspections and replacement cycle
Price–Hayes Park Tier 3 Planned replacement cycle for bins and picnic tables
Rustic Canyon Park Tier 3 Seasonal vegetation and trailhead preventive work
Mainiero Square Tier 3 Hardscape cleaning cadence, anti-graffiti rapid response plan
Veterans Hall Tier 3 Facility preventive maintenance schedule for restrooms and fixtures
Golden Hills
Wilderness Park Tier 3 Seasonal risk reduction and trail access upkeep
High impact workload and top visited; protect service reliability
High impact workload and top visited; sports lighting is a system weak point
Low condition and top visited; needs stabilization plus reinvestment
Top visited; protect the park experience where demand is highest
Top visited with mid-low condition; prevent decline-driven workload growth
High impact workload and mid-low condition; early CIP candidate profile
High impact workload: sport fencing and courts are system weaknesses
High impact workload: lighting and fencing are noted priorities
High impact workload; early CIP candidate for lighting and courts
Wear on courts and furnishings; predictable work prevents reactive spikes
Mid-range assets respond best to standard preventive maintenance
Moderate wear: stabilize before it becomes a reactive maintenance driver
Low condition tied to support amenities; small investments improve appearance and reduce calls
Condition is stable; protect performance through predictable cycles
Balanced condition; avoid backsliding
Strong condition; protect the asset base
Holds steady; reduce ad hoc repairs with predictable replacement
Best handled in seasonal windows; reduces service conflict in peak months
High visibility: protect appearance and reduce reactive responses
Stable facility condition: keep work integrated and predictable
High performing and limited infrastructure; focus on safety and access
La Verne’s maintenance workload is dominated by various obligations such as restroom cleaning and stocking, trash and litter removal, turf mowing, and irrigation. Time-intensive maintenance tasks leave limited time for preventive maintenance, mid-cycle repairs, and condition-driven reinvestment.
The seasonal pattern reinforces the staffing challenge. Summer is the highest-volume period and requires full staffing and supplemental support, while winter is the lowest-volume period and is the best operational window for deep cleaning, preventive maintenance, and capital repairs.
The snapshot assessed for the adopted FY 2024–25 structure blends General Fund staffing and O&M with significant contracted services. The documents show:
» Parks Division personnel and O&M totaling $1,764,022, including $500,000 in contract maintenance and $250,000 in other contractual lines.
» Tree maintenance totaling $503,612, driven by a major contract line ($447,106).
» A clear observation that nearly $750,000 in contracted services (maintenance + trees) supplements City crews, and that LMAD/LLMD contract zones provide predictable baseload maintenance that helps free City crews for higher-priority parks and event support.
Strategic implication: La Verne already has a strong contracting foundation. The staffing solution should not be “all City staff” or “all vendors.” The most effective model is a hybrid approach that protects core routes and uses contracting to absorb seasonal spikes, specialty work, and bundled rehabilitation tasks.
Benchmarking against NRPA agencies serving 20,000–49,999 residents shows:
» La Verne at approximately 6.6 FTEs per 10,000 residents versus a peer median of 9.6.
» Operating expenditures per capita of approximately $84 versus $112.38 at the peer median.
» Key observations explicitly note lean staffing and a funding gap that limits preventive maintenance capacity.
Strategic implication: The recommended staffing and fiscal actions are not aspirational. They are a practical step toward peer-aligned capacity.
Incremental capacity required to implement the recommendations:
» Approximately 1.0 additional FTE equivalent
» Approximately $128,000 in annual recurring costs
» Approximately $345,000 in one-time capital investment
» Hire a dedicated Facilities Maintenance Supervisor given the deferred maintenance backlog in parks
This approach aligns with the workload reality: maintain consistent daily service while creating capacity for preventive cycles and targeted condition improvements, especially at high-impact sites that drive a disproportionate share of restroom and trash workload.
1. Permanent capacity: Add a baseline, year-round capacity component to protect daily service routes and build a predictable preventive program for restrooms, lighting checks, and high-failure fixtures. This protects service quality during summer peaks, when full staffing and supplemental labor are repeatedly identified, as necessary.
2. Seasonal and contract capacity: Use seasonal contracts and targeted vendor scopes to:
» Cover peak summer surges and weekend loads
» Absorb event-driven cleanup and high-volume trash cycles
» Deliver bundled packages such as sports lighting repairs, fencing rehabilitation, and court surface maintenance, which are systemwide weak points
3. Winter Work: Use December through February as the planned execution window for deep cleaning, painting, preventive maintenance, and selected capital repairs because it is explicitly identified as the lowest volume period and the best time to complete this work without disrupting daily service.
Annual recurring costs should be structured around the hybrid model and aligned with existing contracting strengths.
Strategic funding guidance:
» Position recurring dollars as the cost of stabilizing service reliability and reducing reactive work, not as a discretionary enhancement.
» Tie recurring investment to measurable operational outcomes such as protected routes during summer peaks and a documented preventive cadence in winter.
If the City does not add capacity
Without incremental capacity, the department will remain locked into a model where restroom and trash obligations dominate, and preventive and condition-driven work will continue to slip to the margins. This increases the likelihood of reactive maintenance growth over time and makes it harder to stabilize service during peak seasons.
the City implements the recommended hybrid model
With the recommended approximately 1.0 FTE equivalent plus targeted contract support:
» Tier 1 parks that drive system workload can maintain stable service
» Winter becomes a true execution window for preventive and capital work
» The City can more reliably address systemwide weak points like lighting, fencing, and courts without sacrificing core daily routes.
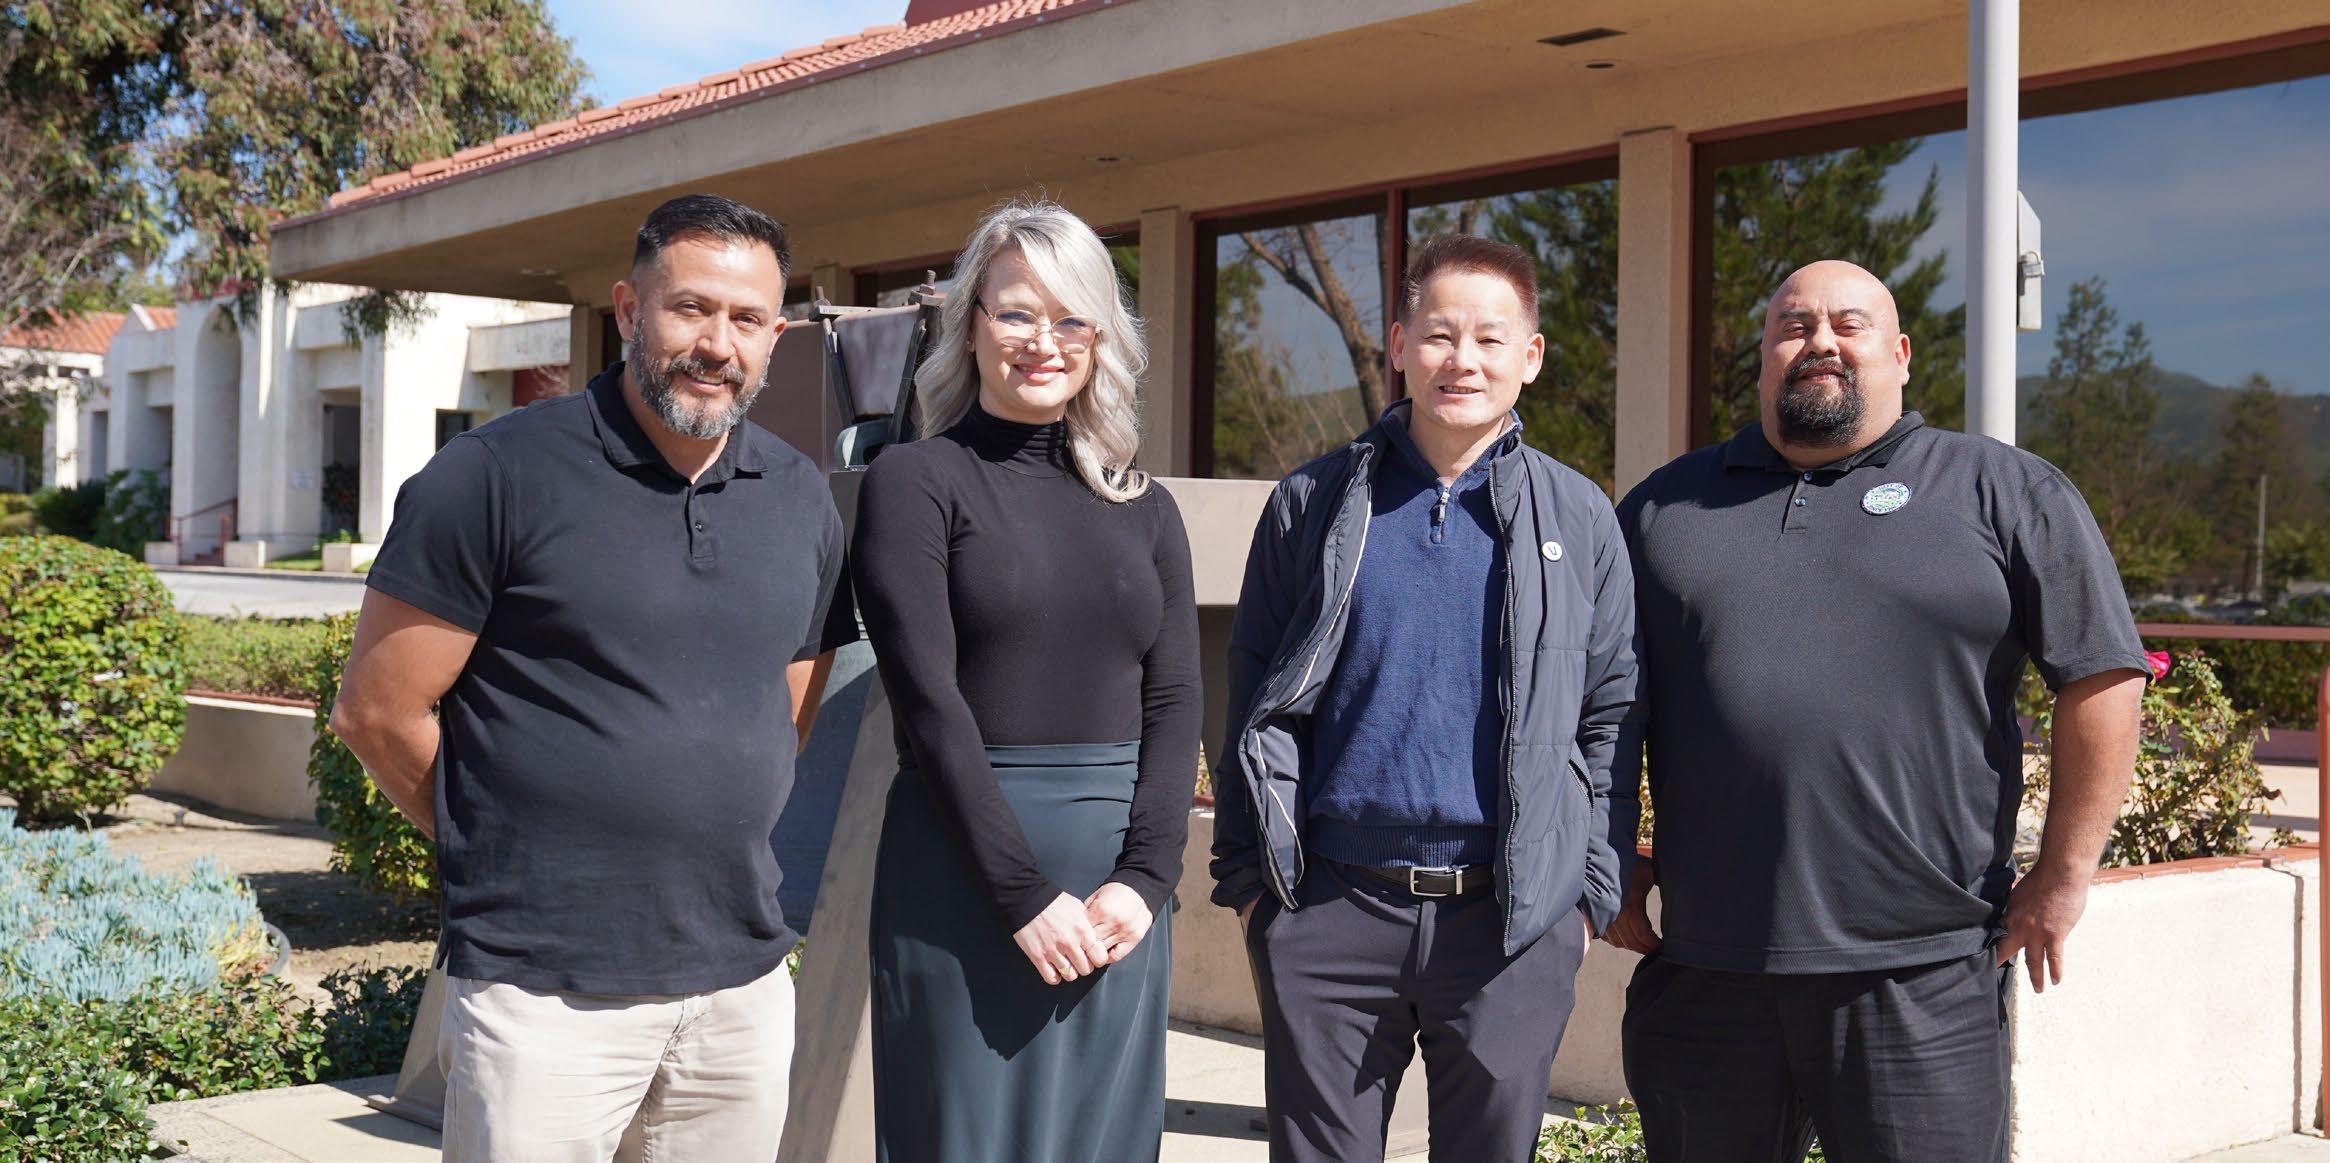
La Verne’s park maintenance program is sustaining a high-use, service-intensive park system and is consistently meeting the City’s most visible daily obligations. The workload data confirms that staff are maintaining service reliability through disciplined route coverage and daily task prioritization. At the same time, the chapter clearly shows that the current model is heavily weighted toward recurring daily demands, which limits capacity for preventive maintenance, planned repairs, and condition-driven reinvestment.
The chapter also confirms that La Verne’s maintenance challenge is not evenly spread across the system. Workload, condition, and community use patterns all point to the same conclusion: a relatively small group of high-impact parks carries a disproportionate share of service pressure. These sites are both the most heavily used and among the most operationally sensitive, which means condition decline in key amenities can quickly translate into more reactive work, greater service disruption risk, and increased customer complaints. This is why the recommended approach prioritizes protecting Tier 1 service hubs while addressing systemwide weak points such as lighting, fencing, courts, and furnishings through planned maintenance and targeted capital action.
The findings also support a practical operational strategy rather than a major restructuring. La Verne already has a strong contracting foundation through existing maintenance, tree, and LMAD/LLMD-supported service structures. The recommended path builds on that foundation with a hybrid delivery model that adds modest baseline capacity, uses seasonal and targeted contract support for peak loads and specialty work, and treats the winter low-volume period as a planned execution window for deep cleaning, preventive maintenance, and selected capital repairs. This approach is consistent with the documented seasonal workload pattern and the City’s current service delivery realities.
From a staffing and fiscal standpoint, the recommendation is measured and defensible. The chapter supports approximately 1.0 additional FTE equivalent, such as a dedicated Facilities Maintenance Supervisor, paired with roughly $128,000 in annual recurring funding and approximately $345,000 in one-time capital investment, as a right-sized step toward stabilizing service and improving maintenance outcomes. These investments are not framed as discretionary enhancements. They are
operationally targeted actions intended to protect route reliability, reduce long-term reactive maintenance pressure, and extend asset life in the parks and amenities that drive the greatest workload and community visibility.
Overall, this chapter presents a great starting point for clear and implementable maintenance direction for La Verne: protect high-impact parks, align preventive work with condition risk, use capital dollars strategically on systemwide weak points, and strengthen service reliability through a hybrid staffing and contracting model.
This chapter serves a planning-level snapshot of the tasks the City’s maintenance staff complete to provide the highest level of maintenance possible with existing staffing and financial resources. This chapter sets the foundation for a future, in-depth Maintenance Management Program endeavor that will allow the City to take a deeper dive and develop sustainable and fiscally-responsible maintenance strategies and implementation processes. By implementing the systemwide recommendations mentioned in section 4.6.1, the City can preserve strong day-to-day performance while building a more preventive, predictable, and sustainable maintenance program that supports community expectations over the long term.

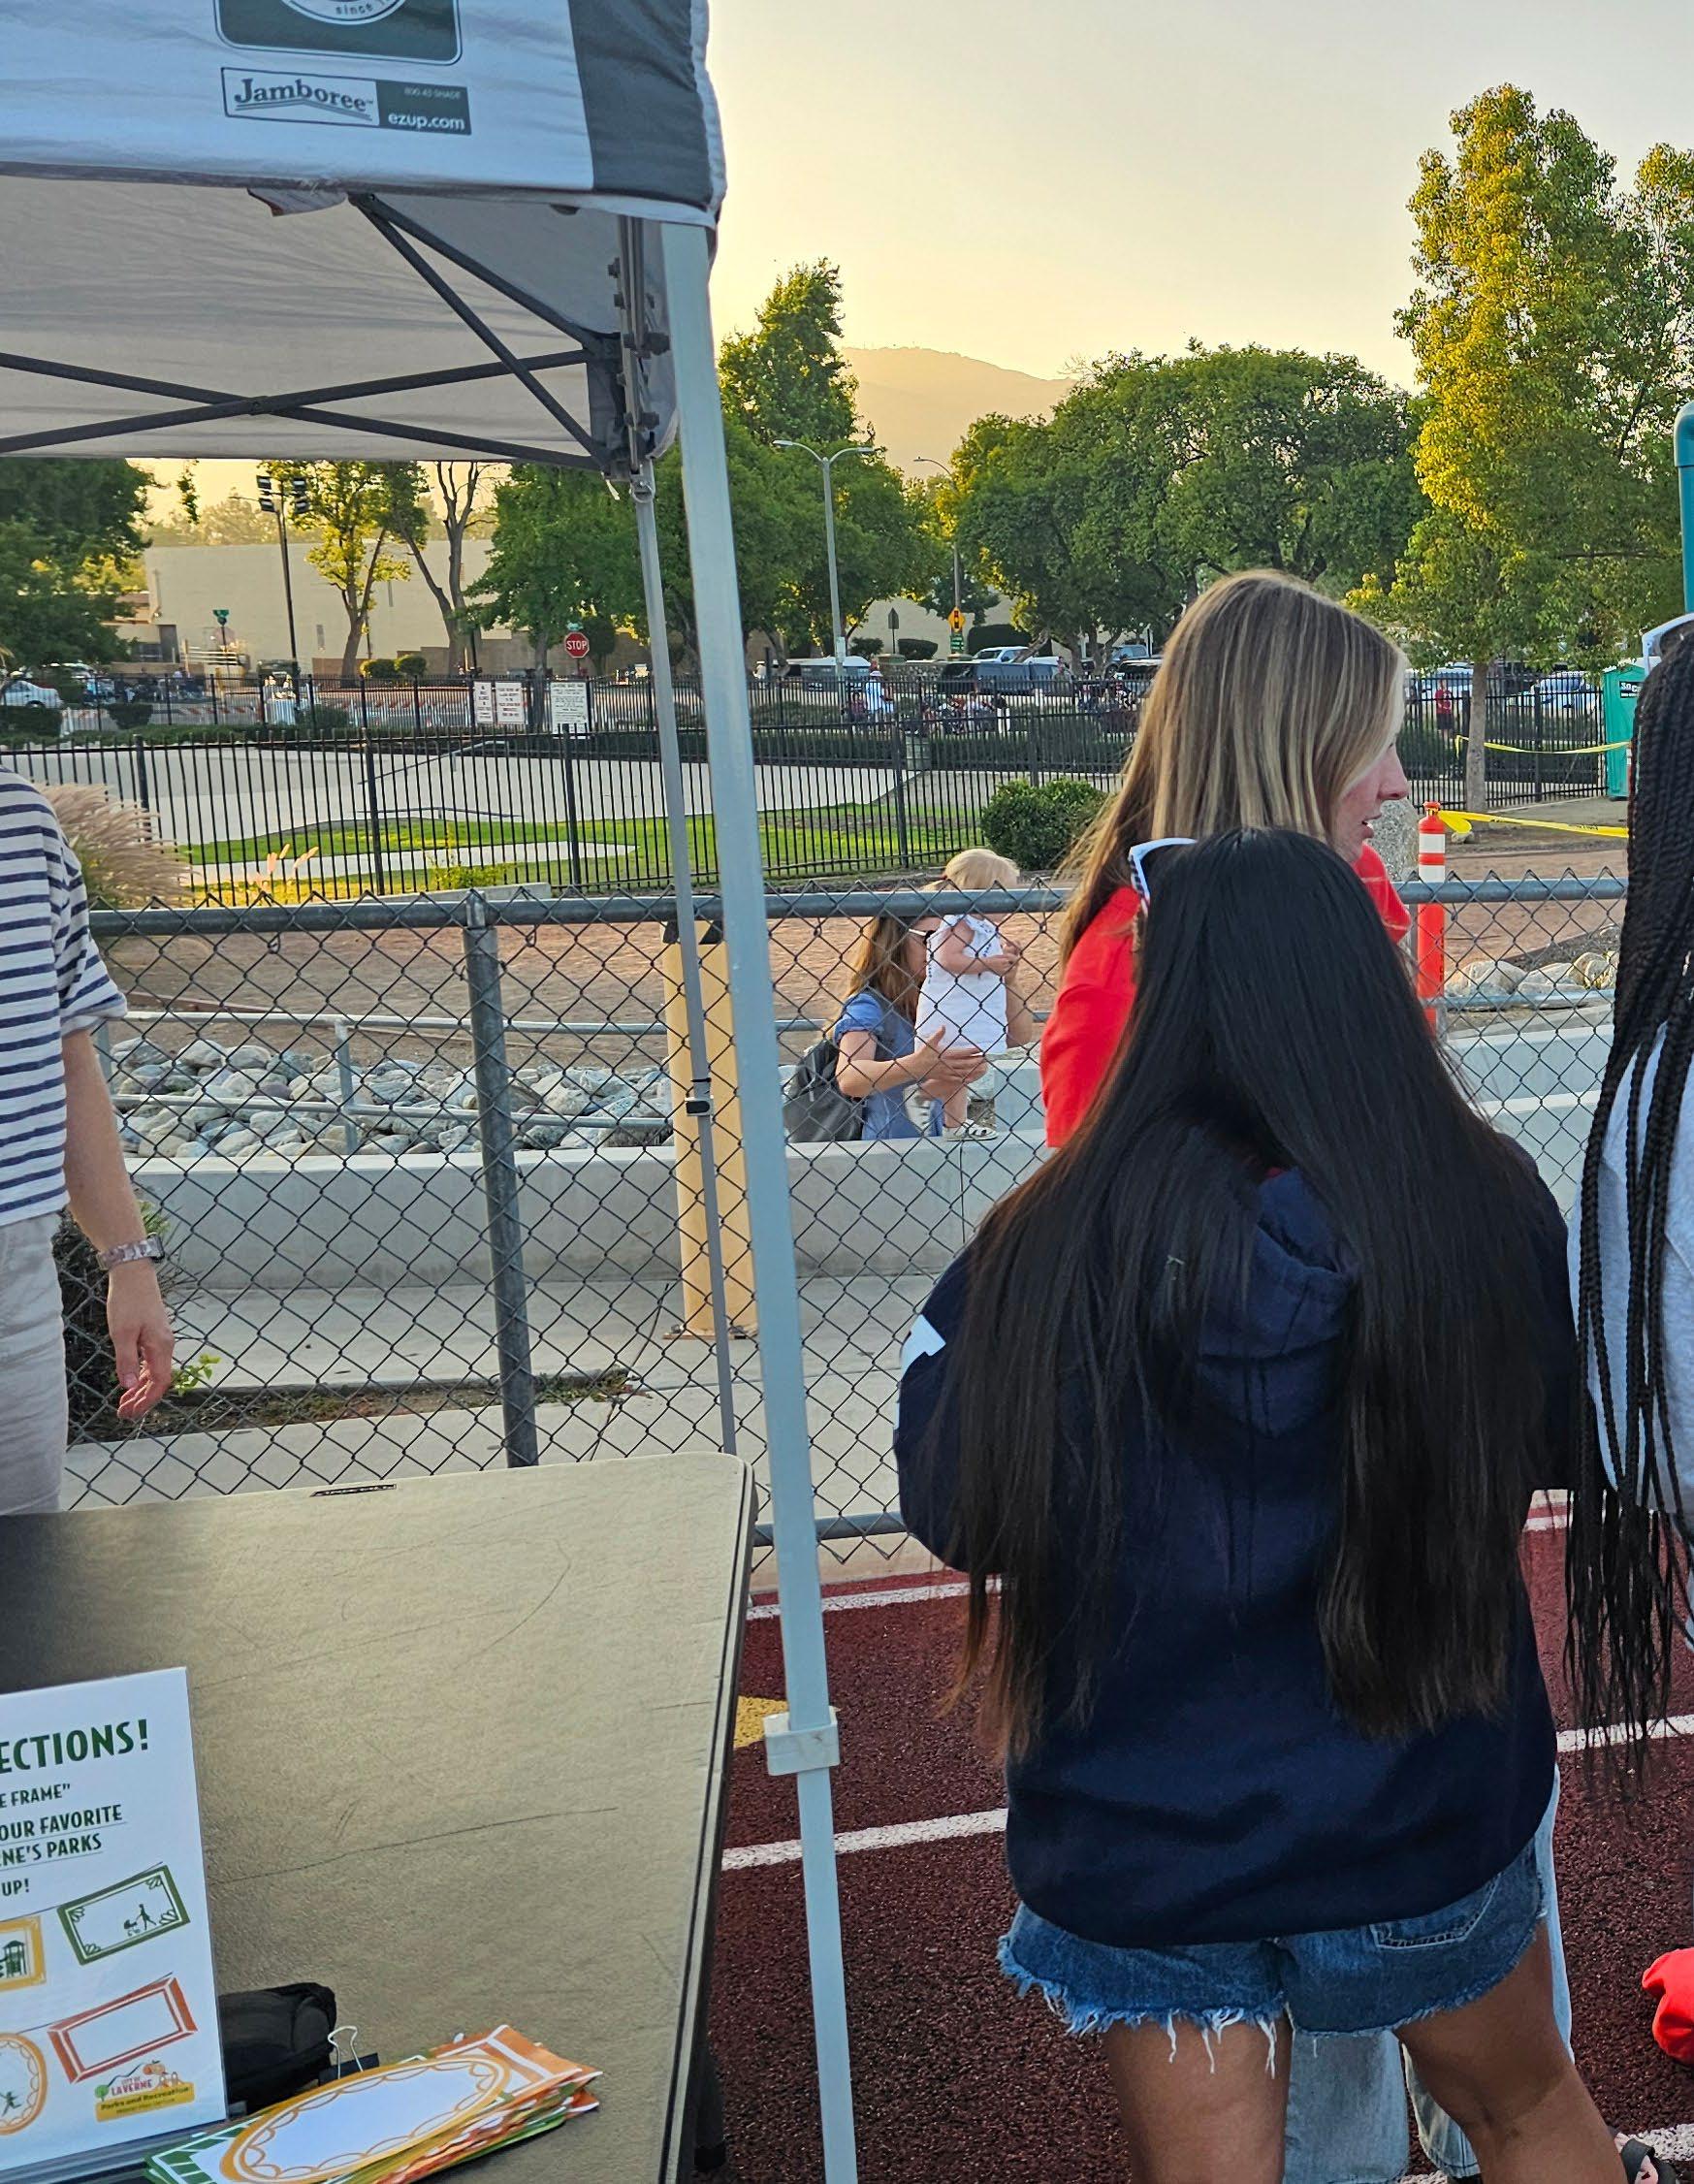
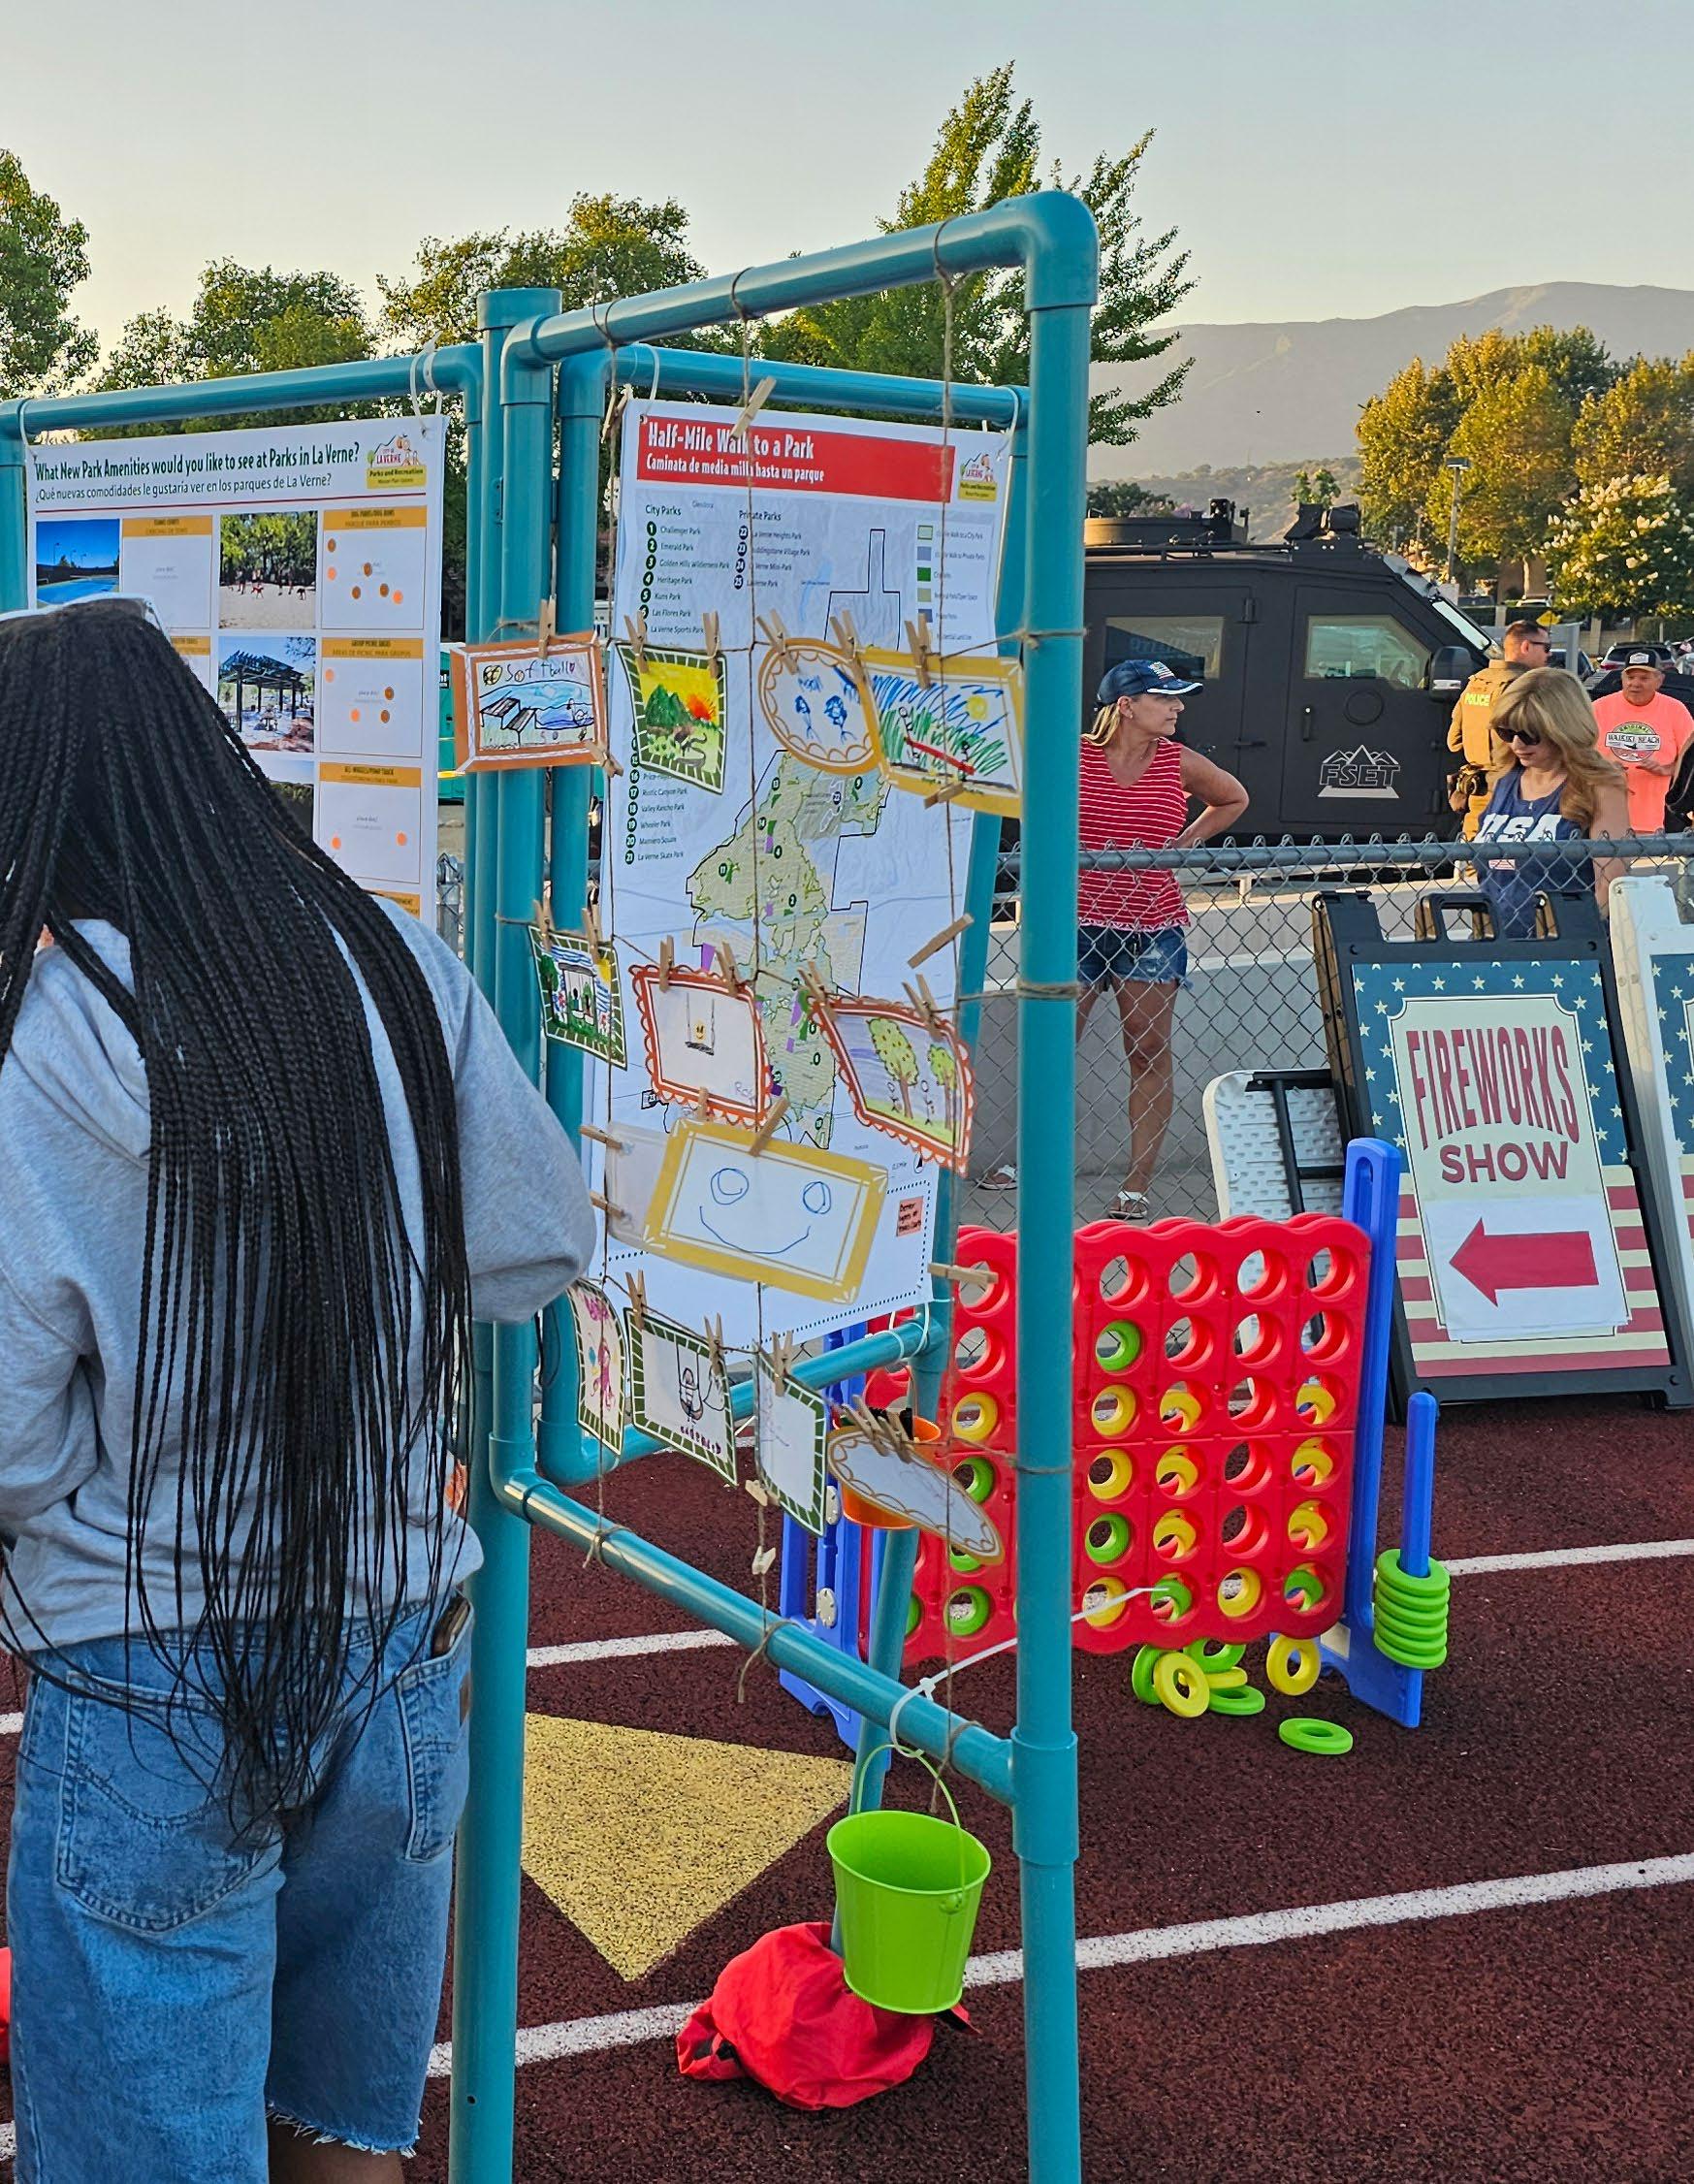
The development of an inclusive community engagement strategy was a critical step to ensuring Plan recommendations aligned with community priorities.
The community engagement process provided the team with many opportunities to hear from community members regarding the future of the La Verne’s parks and recreation amenities and facilities. A series of workshops, pop-up event booths, surveys, and meetings were conducted to collect feedback later used to prioritize areas of improvement. Everyone who lives, works, or plays within La Verne was considered an essential collaborator in the planning process and in the development of the recommendations for this Plan.
The following outreach methods were used to engage La Verne community members:
• Project branding
• Project webpage
• Social media
• Statistically valid survey
• Community survey
• Two community workshop meetings
• Two pop-up events at high-attendance community events
• Four focus group meeting with key stakeholders
• City meetings with Parks and Recreation Commission and City Council
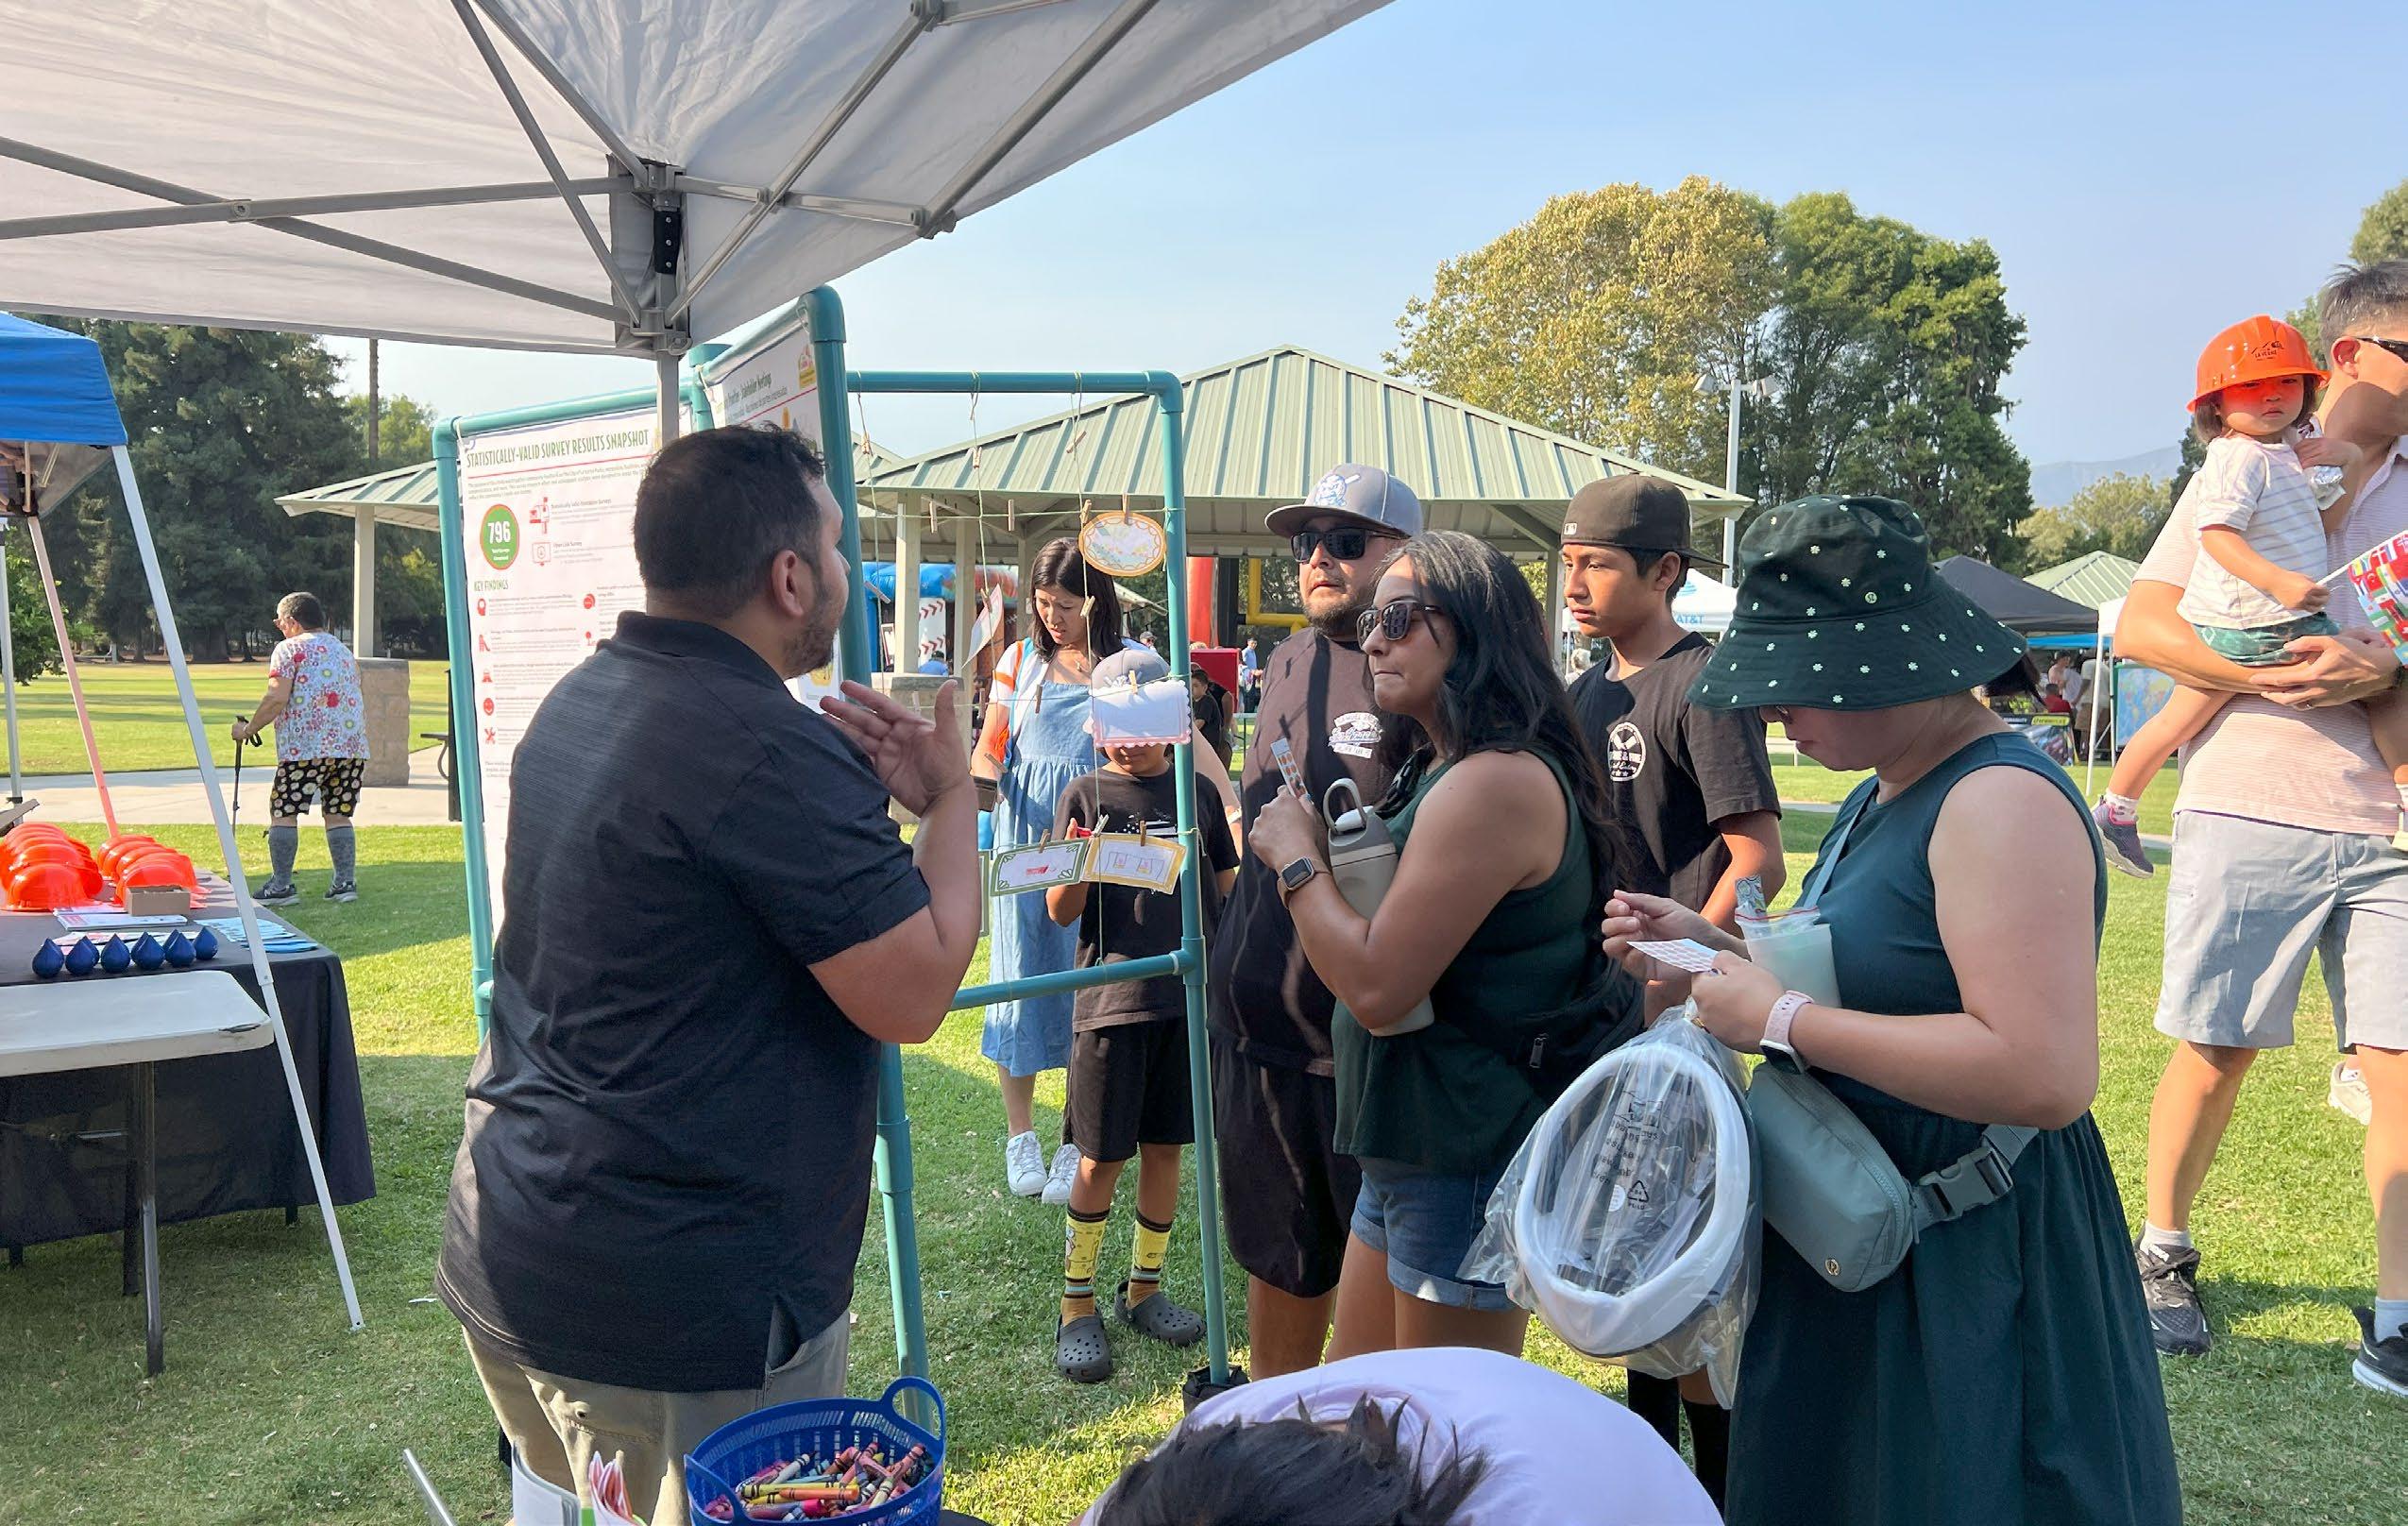
Surveys Completed
Focus Groups Facilitated
Community Workshops
Pop-Up Events Hosted
Project Fieldwork
February 2025

Survey Opens March 2025
La Verne Senior Advisory Committee Meeting
April 2025
La Verne City Council Meeting
May 2025
July 4th Pop-up Event
July 2025
Community Workshop #2
September 2025
City Council Plan
Adoption
March 2026
5-1: Community Engagement Timeline
Project Kick-Off
December 2024
Community Workshop #1
March 2025
La Verne Youth and Family Action Committee Meeting April 2025
Survey Closes May 2025
La Verne Youth Sports Committee Meeting
May 2025
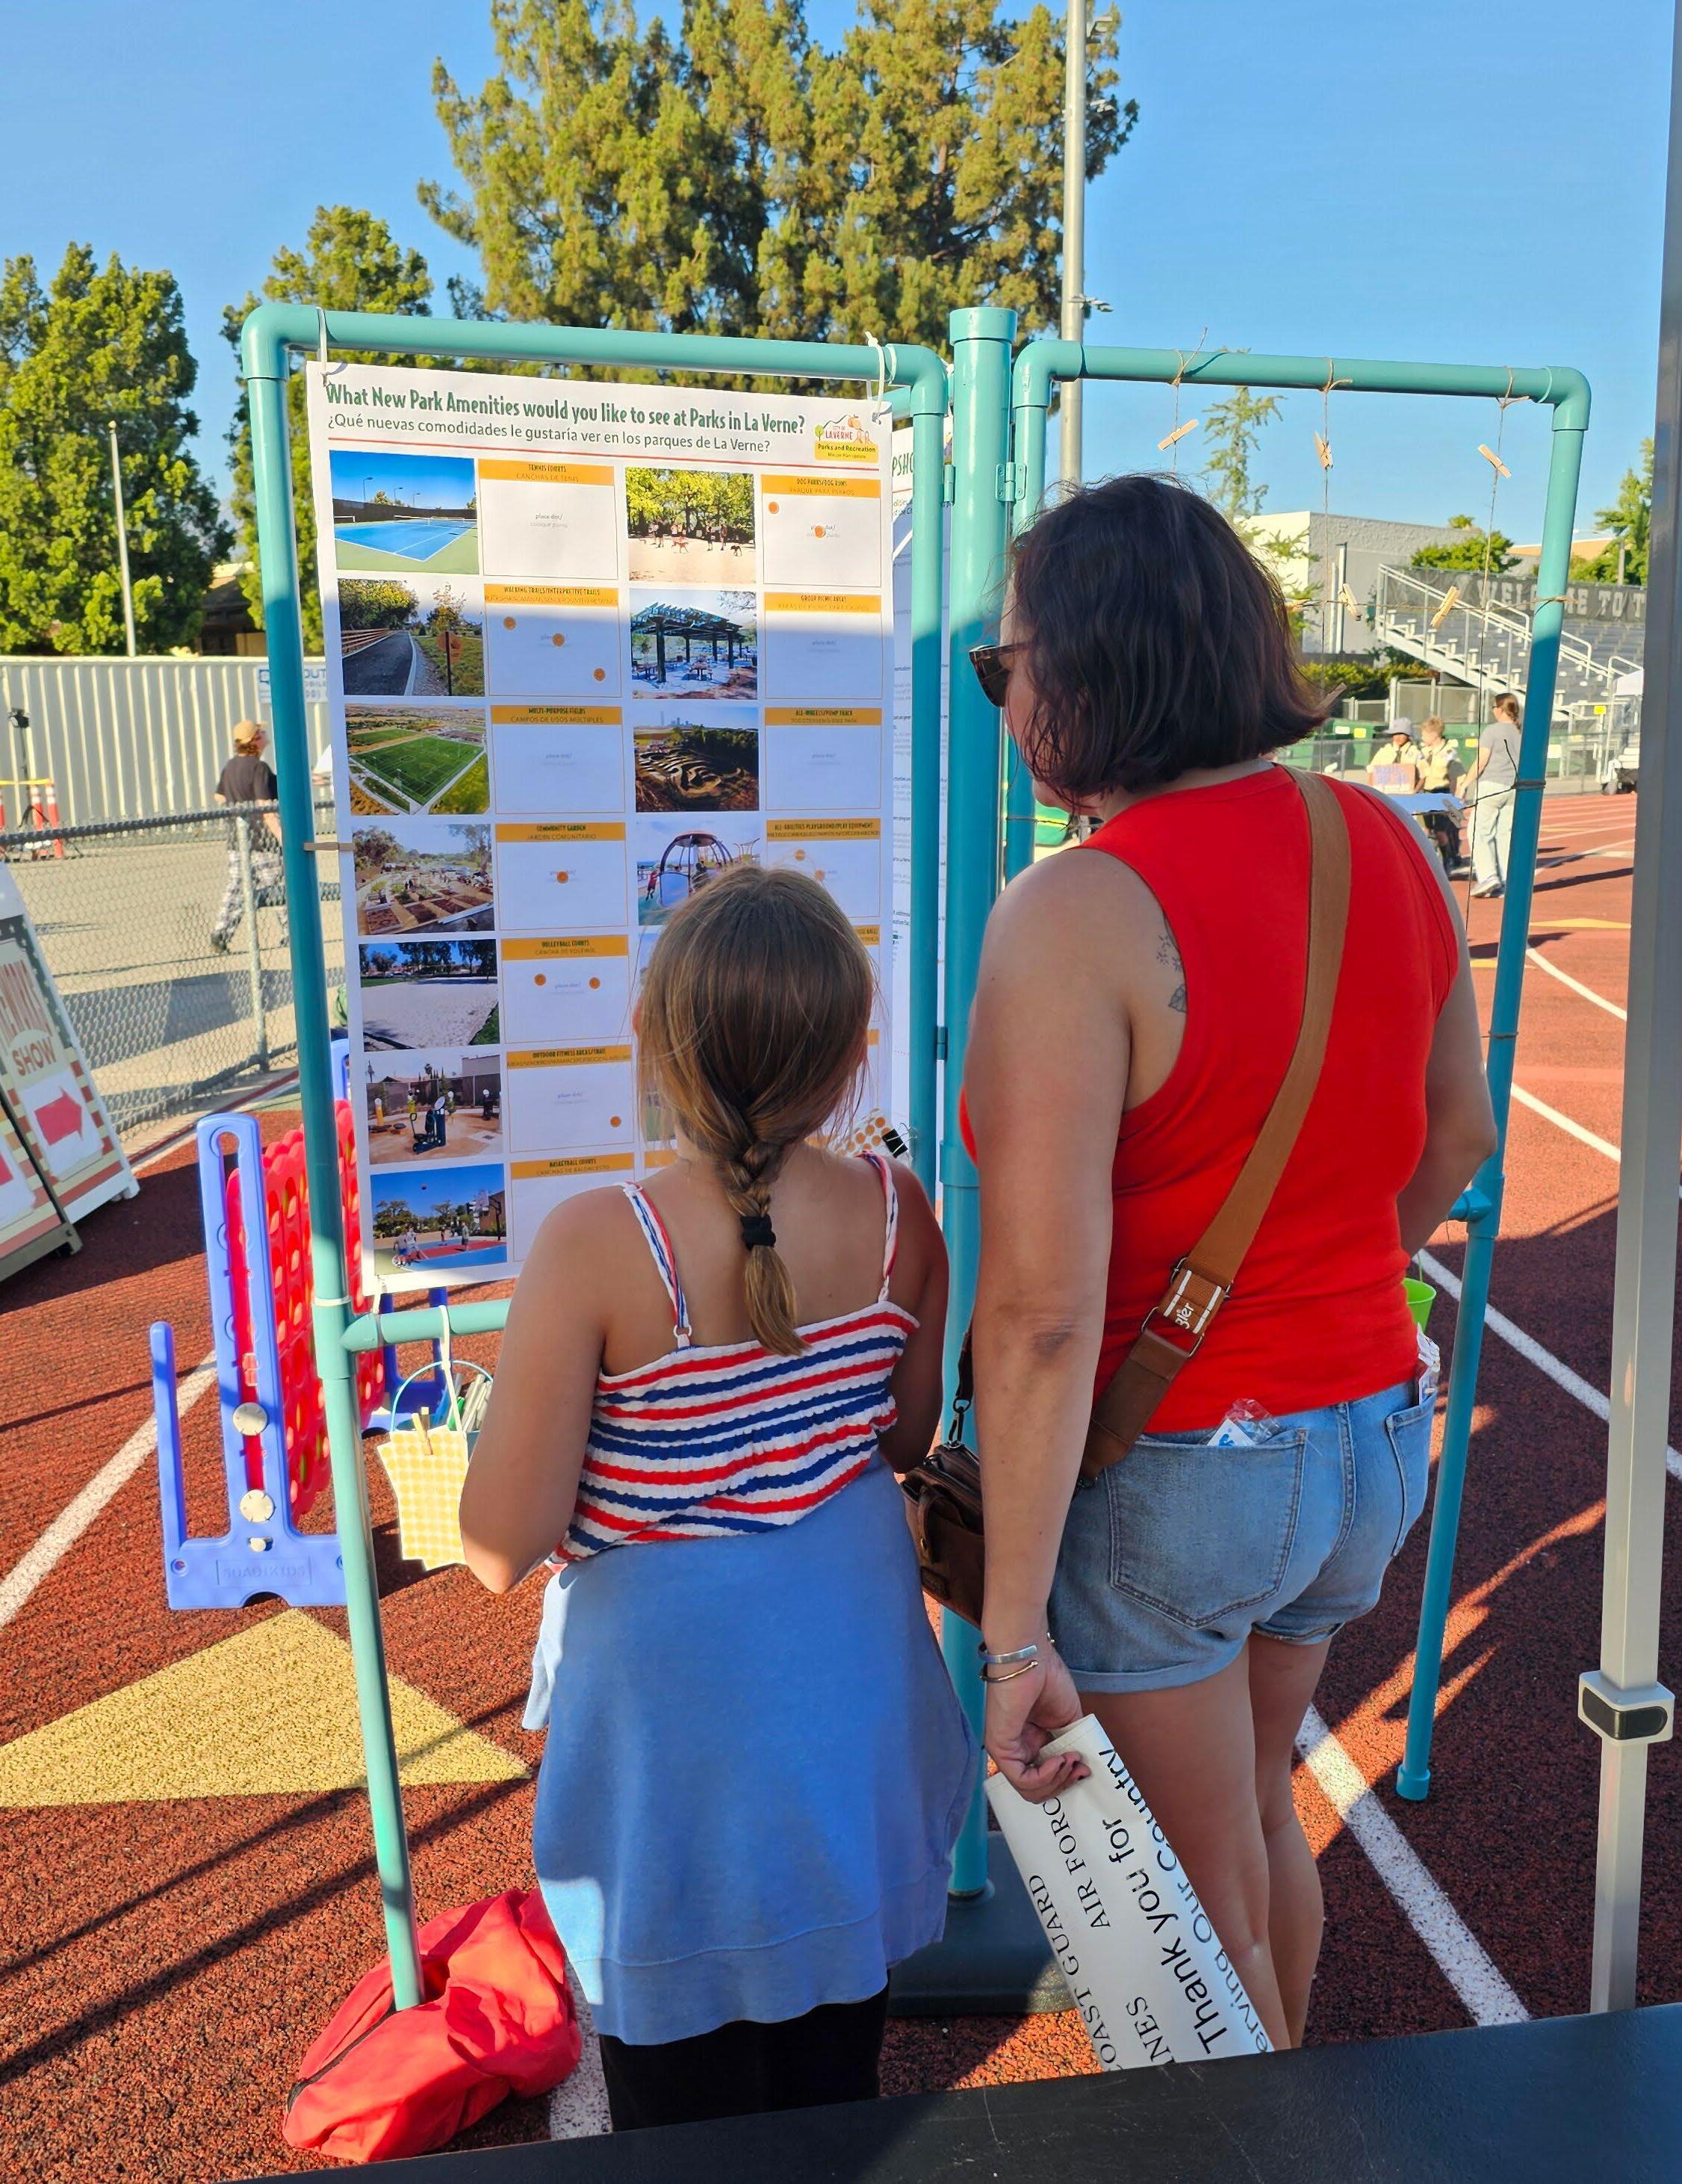
National Night Out Pop-up Event
August 2025
Parks and Recreation Commission Special Meeting
February 2026
Many tools were used to encourage community members to participate in the community engagement process. Tools used to promote community outreach events included social media announcements, posted flyers, distinct project branding, promotion of public workshops in the activity guides and holiday mailers, and a project webpage. These tools were provided in both English and Spanish.
La Verne’s Parks and Recreation Master Plan project branding was inspired by the City’s logo and branding. It used the same color scheme and incorporated similar elements as the City logo. Project branding was used throughout the project, from announcement flyers to the Plan document. Branding was used in outreach materials, the project website, and presentations.
The website created an opportunity for community members to readily access information about the project and to learn about upcoming community engagement opportunities. The project website also contained an interactive online comment map that allowed community members to comment on specific parks and problem areas.
Social media was used as a tool to invite and share information about upcoming events and community engagement opportunities, publish the Plan, and share project updates.

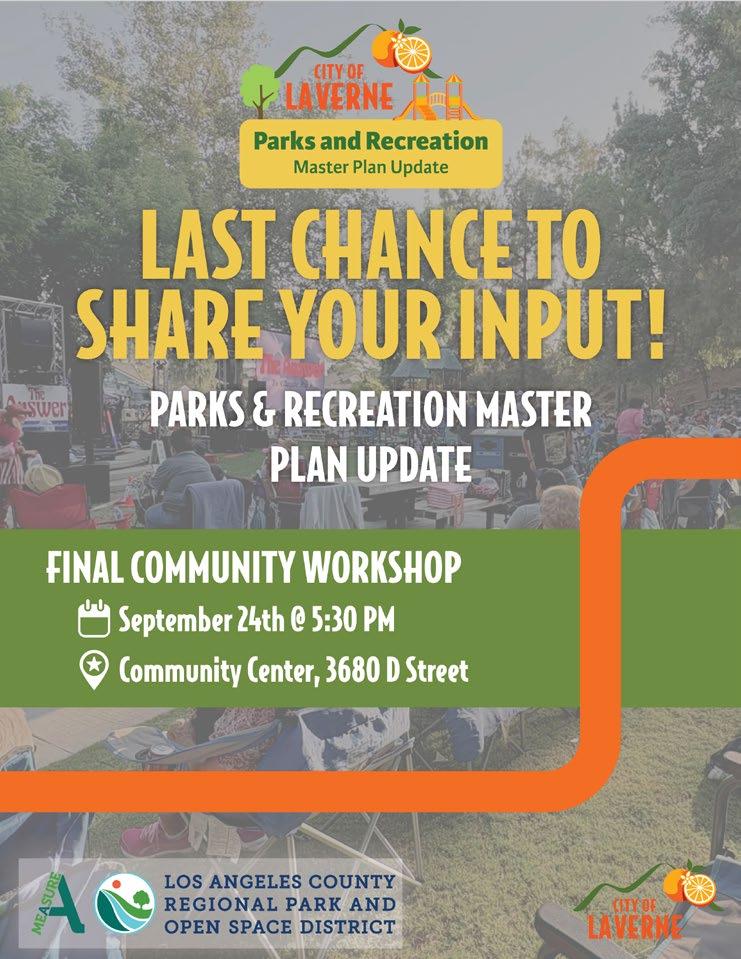

The project team held stakeholder meetings with four different focus groups: seniors, youth and families, city leadership, and youth sports. The focus group meetings with these stakeholder groups provided the project team with more intimate opportunities to hear and discuss resident preferences, concerns, and desires. The goal of these meetings was to gather input on the needs and desires of target community groups. This input, in combination with other community feedback from the survey and workshops, was used to guide the recommendations outlined in Chapter 6.
Date: April 2025
Location: La Verne Community Center
Top needs:
» More park amenities to make parks more accessible, like seating, parking, and restrooms
» Desire for improved children’s play areas
» Desire to increase opportunities for public use of the community pool
» Desire for more park spaces in the central-east area of the City
Date: April 2025
Location: La Verne City Hall
Top needs:
» Improvements/modernization of existing park amenities
» More efficient parking and access to parks and amenities
» Desire to update user fees for programs and services
» More variety of park activities
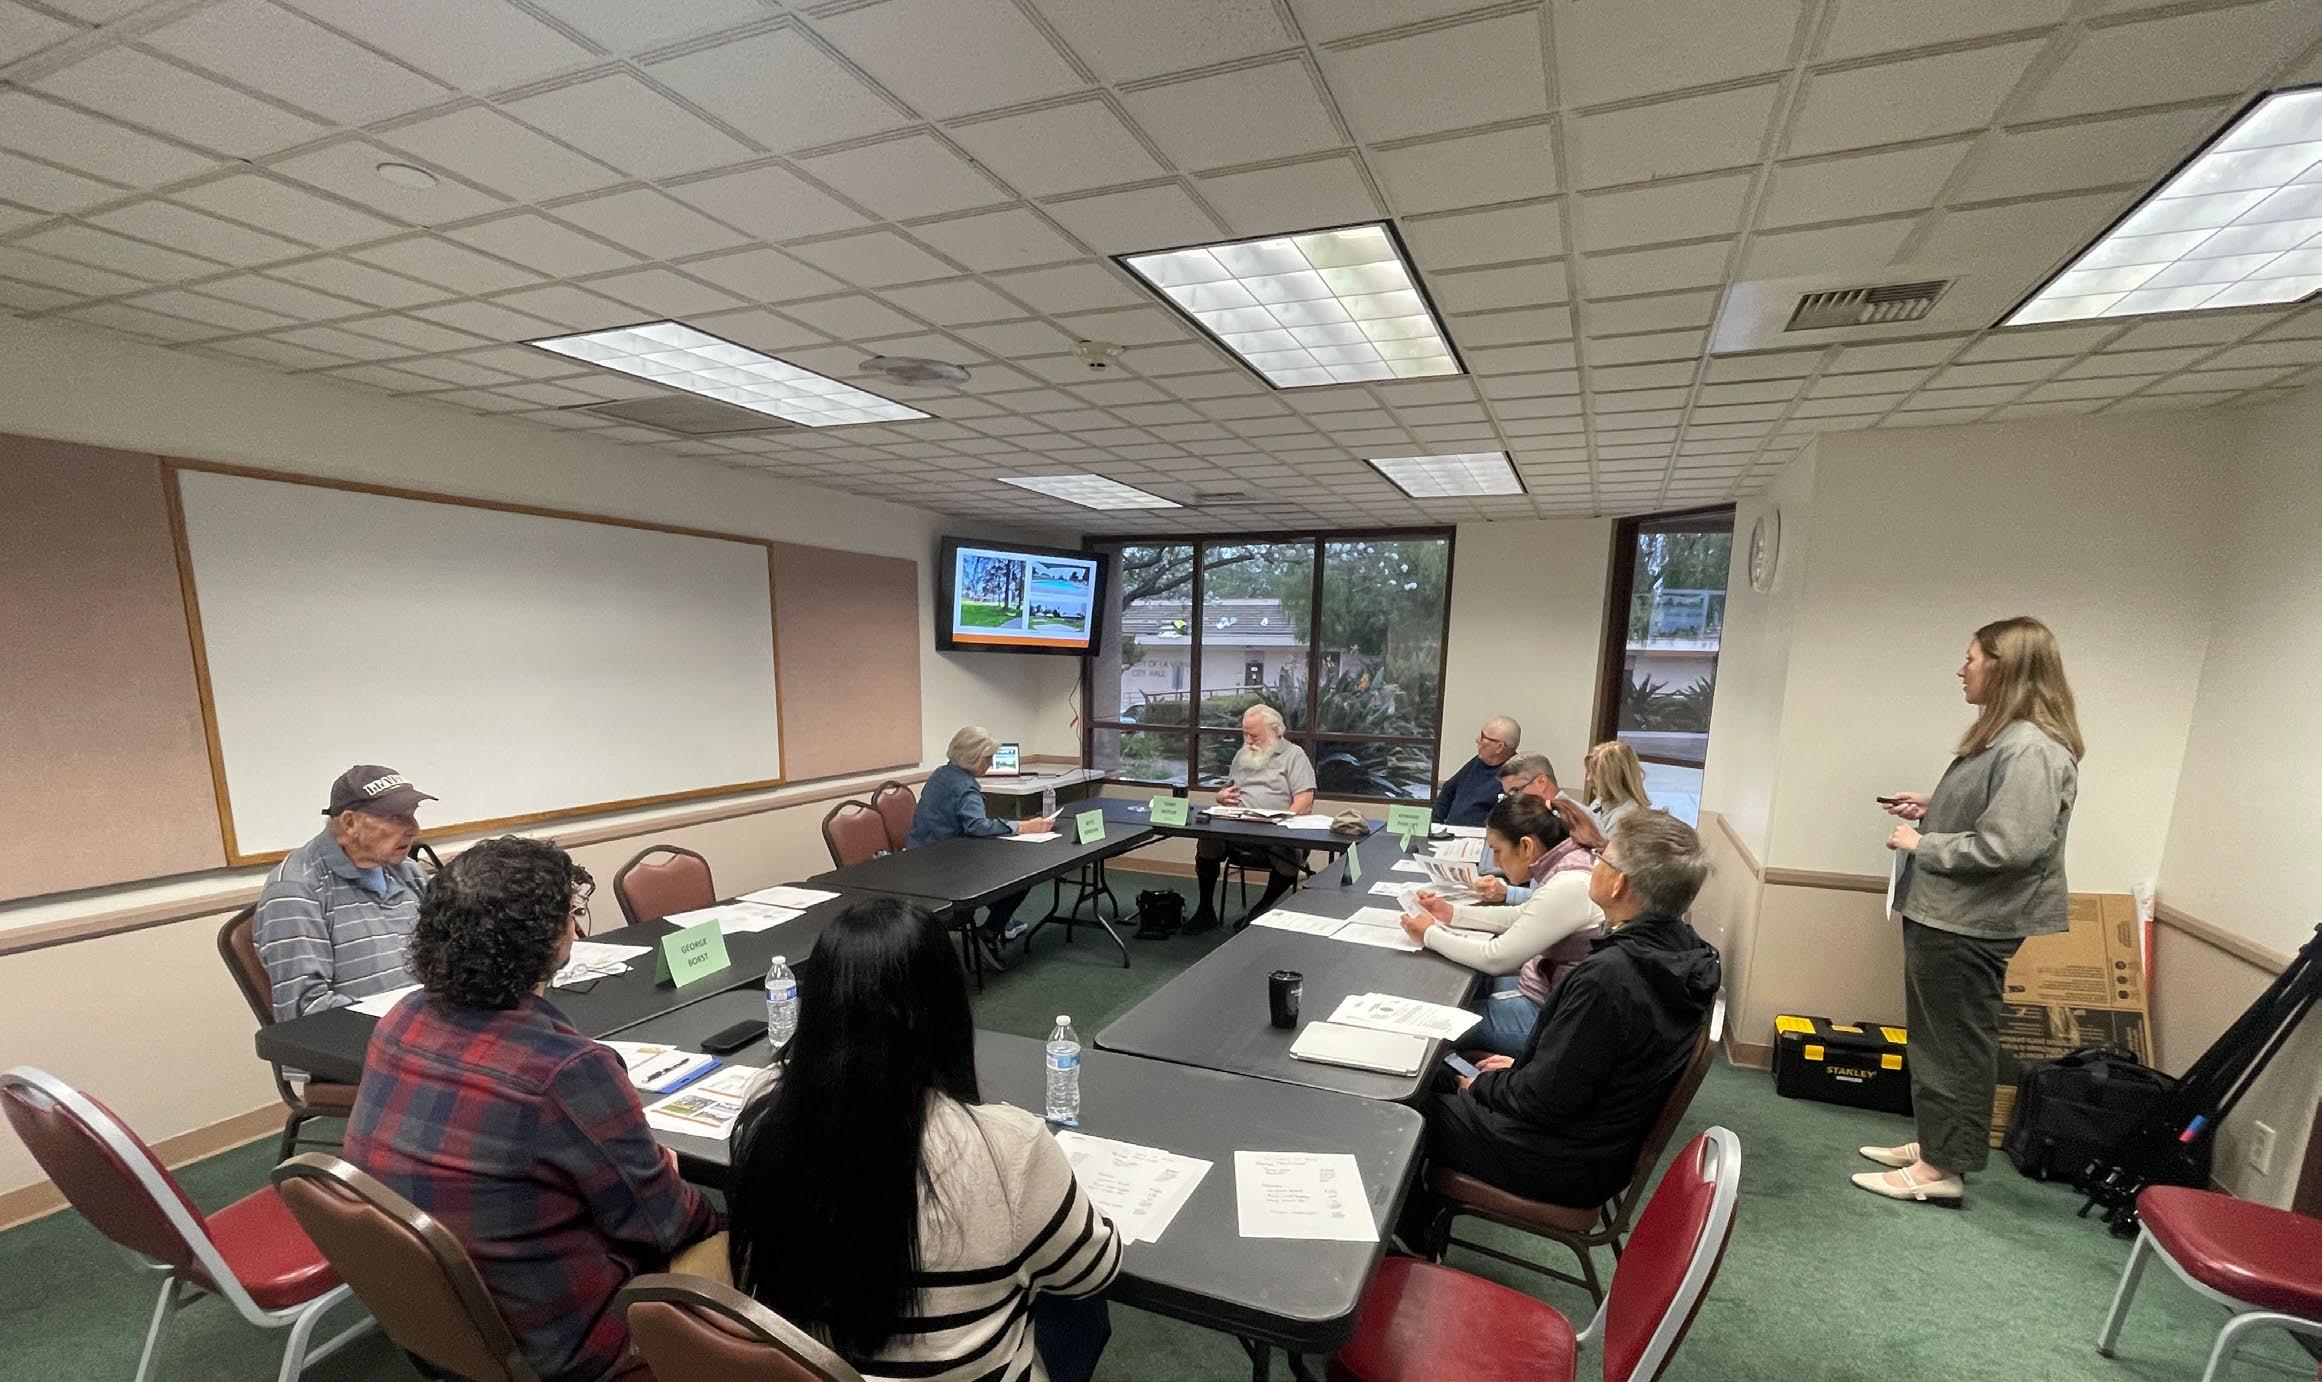
Date: May 2025
Location: La Verne City Hall
Top needs:
» Make parks safer and accessible for everyone (ADAcompliant walkways, safety lighting, inclusive play facilities)
» Desire to maintain and update joint-use agreements

Infrastructure and Amenity Upgrades
Citywide park infrastructure and amenity upgrades are desired
Recreation Programming
Improve and expand recreation programming
Diversity of Amenities
More variety of park amenities are desired
Park Availability and Quantity
Parks are distributed well throughout the city; desire to maintain and build on existing distribution
Maintenance and Operations
Parks are well maintained; desire to update user fees
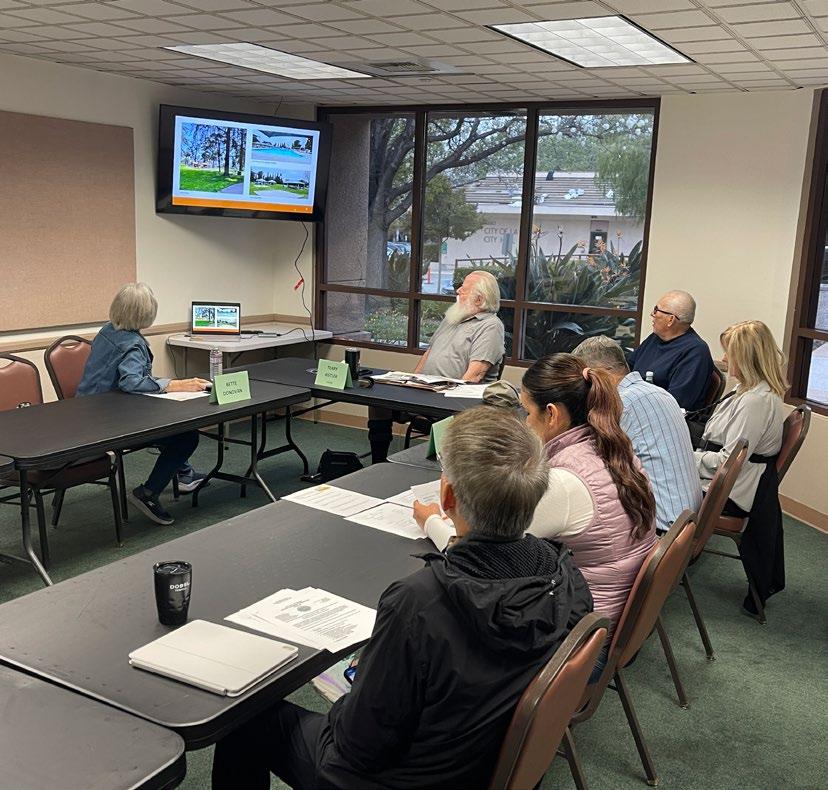
Date: May 2025
Location: La Verne City Hall
Top needs:
» Upgrade sports facilities (update field lighting, improve irrigation and drainage, restrooms)
» Desire to update user fees for sports programs
» Desire for pickleball programs
» Desire for park safety improvements like lighting
Safety and Accessibility
Desire to improve park safety and accessibility
Parking
More parking at parks is desired
Proposed Park Locations
Include park spaces at future commercial and residential developments
Aesthetics
Desire to maintain the natural beauty of existing city parks and green spaces
Community Support
Residents and stakeholders are very passionate about parks and recreation and very involved in the community
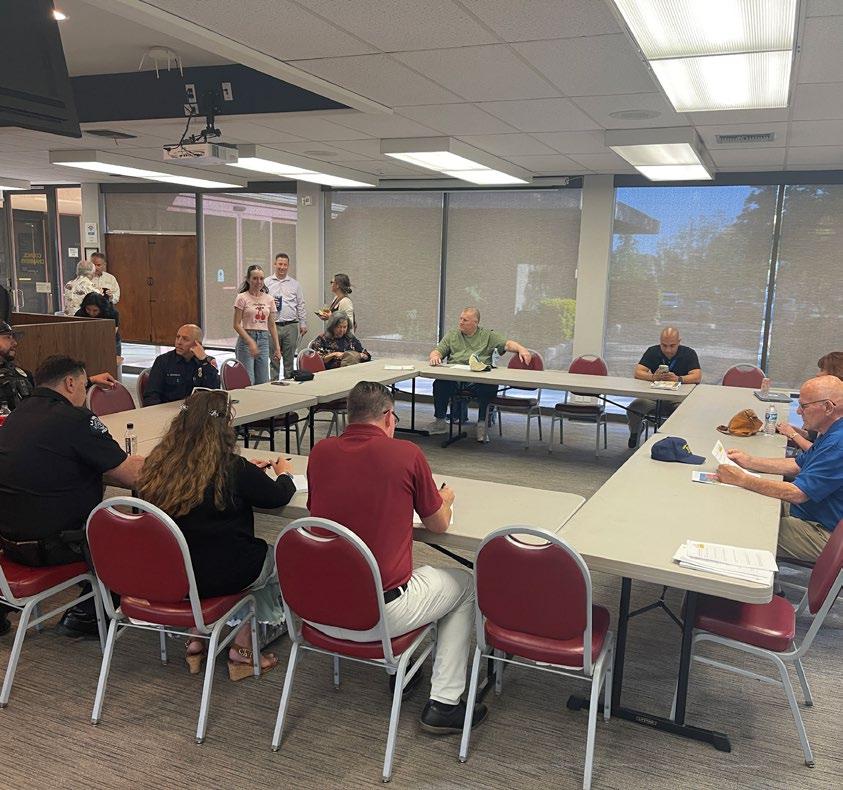
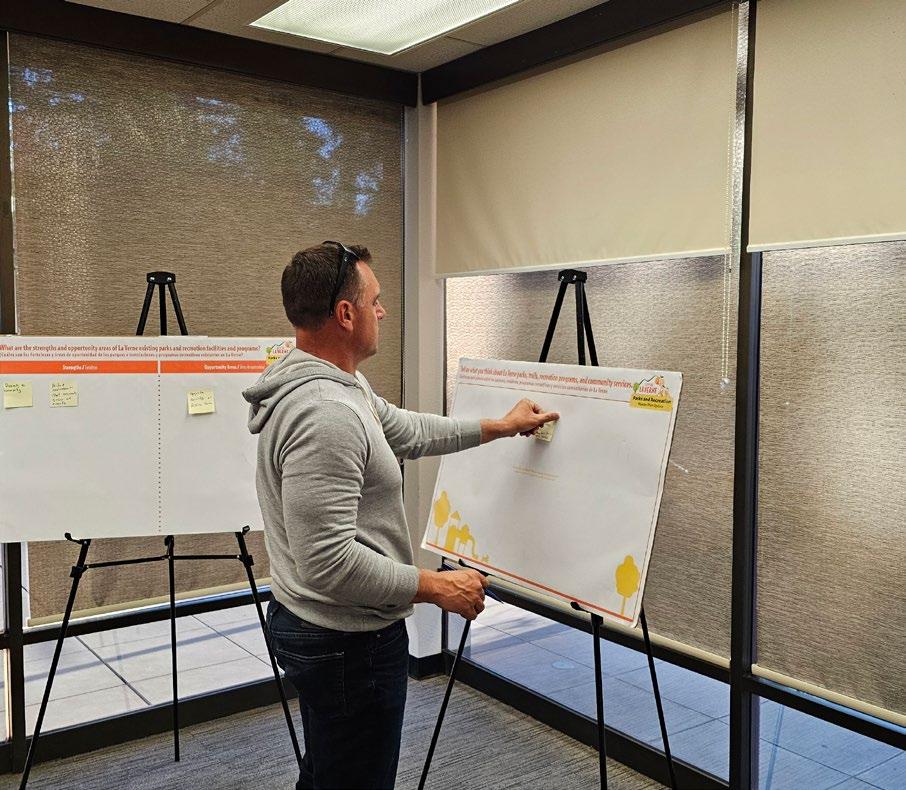
Community Workshop #1: Community Priorities
Date: March 2025
Location: La Verne Community Center and Zoom
Key takeaways:
» Improve and maintain existing City parks and facilities
» Offering more educational program opportunities
» Preserving existing City greenspace
» Add a dedicated dog area
» Add more walking trails in the City
The first workshop was held in March 2025 at the La Verne Community Center. The project team presented existing conditions findings and displayed a series of exhibits and interactive activities for community members to give feedback and comment on.
#1: Fourth of July Concert & Fireworks
Date: July 2025
Location: Bonita High School
Key takeaways:
» Desire for family-oriented activities at parks
» Desire for passive recreation amenities such as dog parks, walking loops, nature trails, and open space
» Desire for upgrades to sports facilities
The first pop-up was held in July 2025 at the Bonita High School. The project team set up a pop-up booth with exhibits displaying existing conditions, survey results, and stakeholder priorities. The project team also offered two interactive activities, an amenity voting activity and a prompted drawing activity. The top 5 desired amenities from participants are multi-purpose fields, all-abilities playgrounds/play equipment, community gardens, dog parks, and walking trails/interpretive trails. The prompt for the drawing activity was, “Write or draw your favorite memory at La Verne’s Parks.” Many of the drawings included children playing at playgrounds, orange picking, spending time with family and friends, seeing wildlife, playing frisbee, volleyball, and soccer.
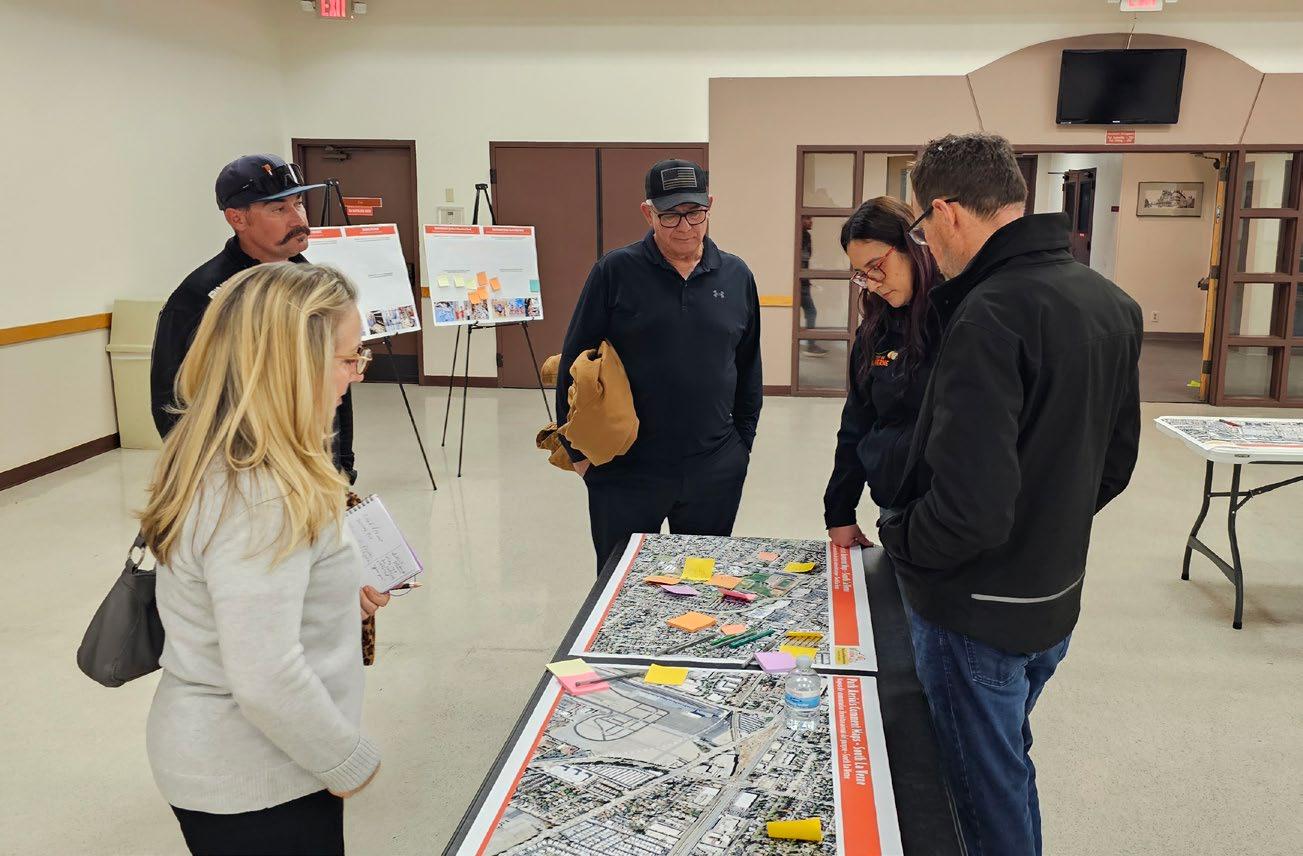
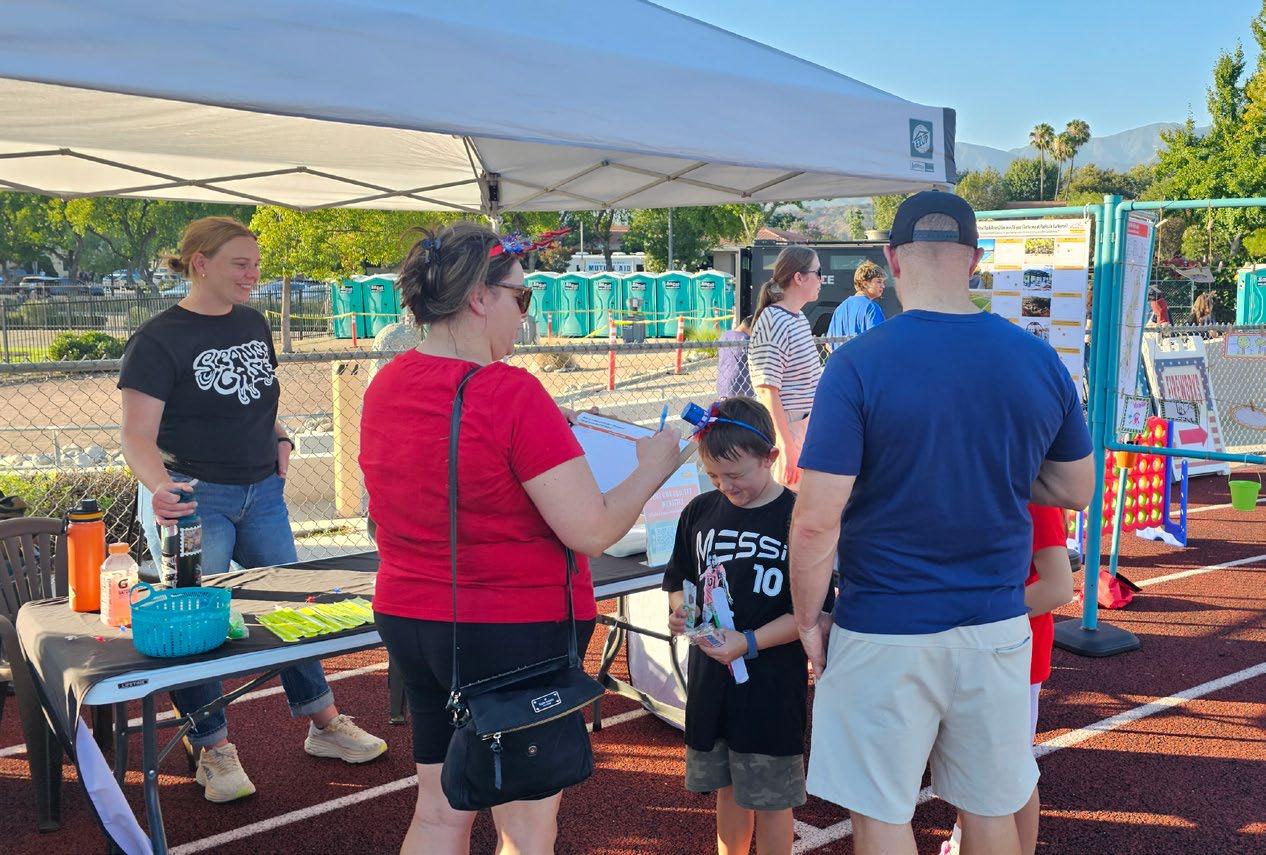
Pop-up #2: National Night Out
Date: August 2025
Location: Las Flores Park
Key takeaways:
» Desire for updated park equipment at Kuns park
» Desire for walking trails/interpretive trails
» Desire for upgrades to sports facilities
The second pop-up was held in August 2025 at Las Flores Park during the City’s annual National Night Out event. The project team hosted a booth complete with exhibits shown at the first pop up event, including displays of existing conditions, survey results, and stakeholder results. Two interactive activities were presented again; the first was an amenity voting activity that presented residents with the opportunity to vote on their top three preferred park and recreation amenities, and the second was a drawing activity with the prompt “Write or draw your favorite memory at La Verne’s Parks.” Engagement was high at this event - over 170 votes were collected, 11 comments recorded, and over 30 drawings created. The top three amenities voted for on the amenity voting activity were walking trails/interpretive trails, all-wheels/ pump track, and all abilities playground/play equipment.
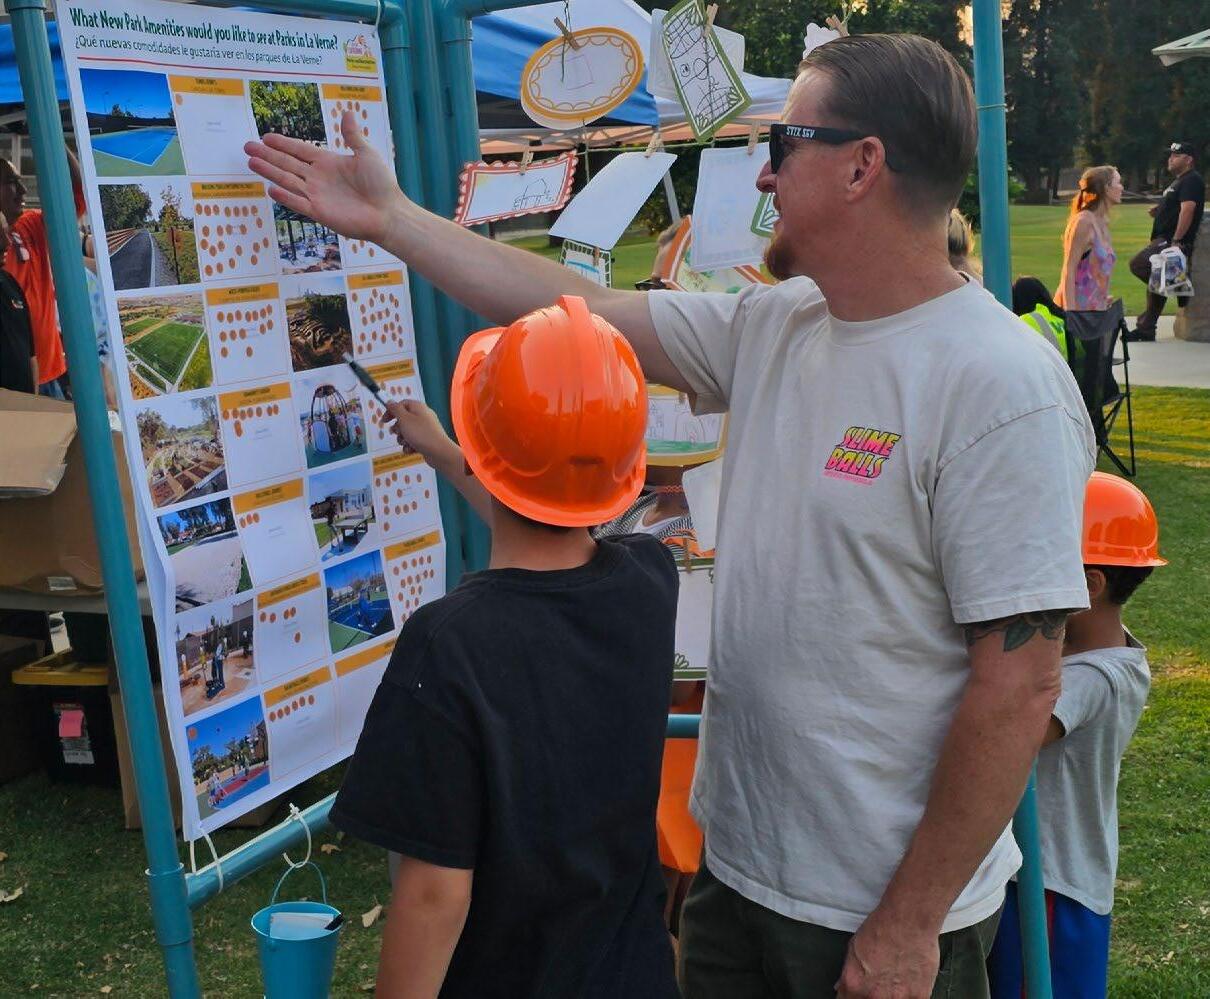
Community Workshop #2: Draft Recommendations
Date: September 2025
Location: La Verne Community Center and Zoom
Key takeaways:
Key takeaways:
» Desire for expanded operating hours at Las Flores Aquatic Center
» Desire for pickleball facilities at many identified park infill areas
The second and final workshop was held in September 2025 at the La Verne Community Center. The project team opened the workshop with a presentation detailing existing conditions, level of service analyses, community engagement efforts, and an overview of recommendations. Table and kiosk exhibits were set up to provide the participants with opportunities to provide input on the Plan recommendations. Recommendations were gathered for specific park improvements and infill opportunities as well as citywide park and recreation initiatives.
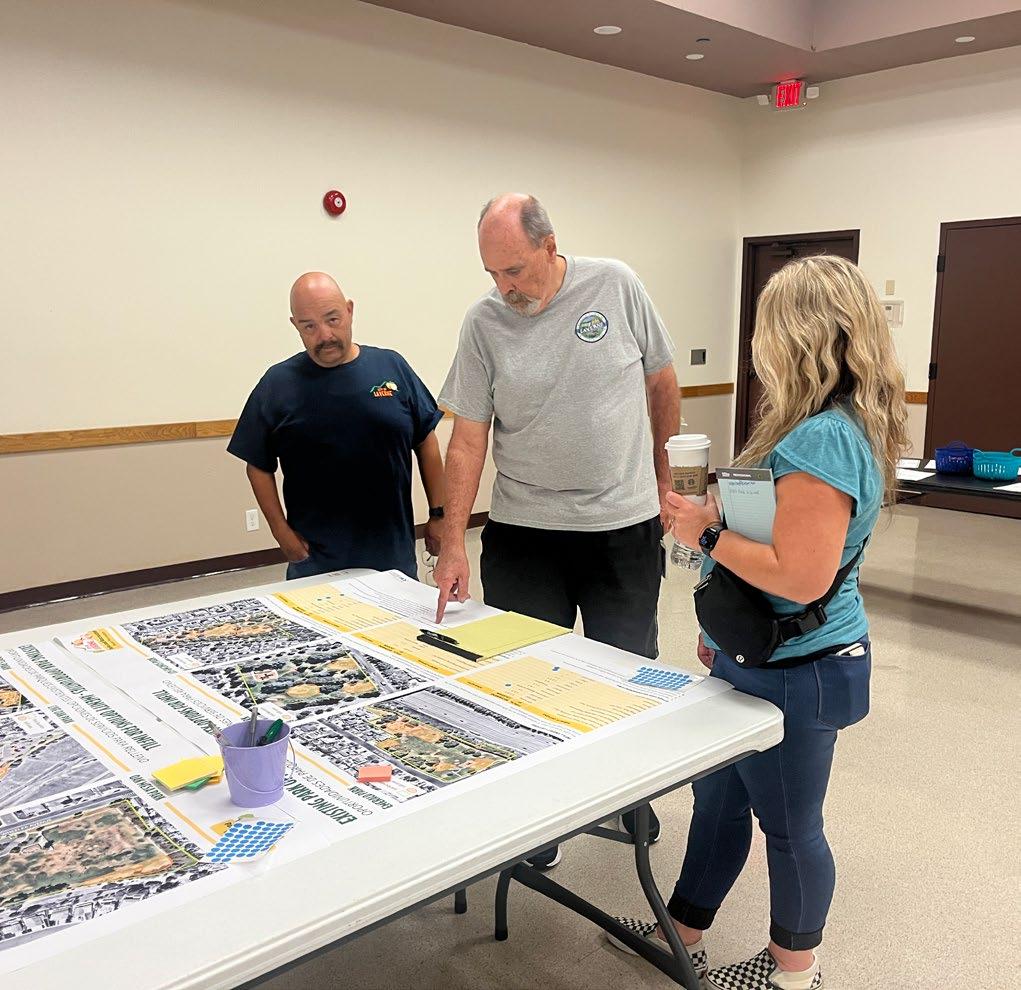
Add More Walking/Interpretive Trails & Outdoor Fitness Areas
Add Additional Courts (Basketball, Volleyball, Tennis, Pickleball)
Update Play Equipment (ADA-Accessible or Otherwise)
Add More Dog Facilities (Dog Parks, Dog Runs)
Add More All Wheels/Pump Tracks
Add More Multi-Purpose Fields
Create Community Gardens
Add More Passive Amenities (Picnic Areas, Open Space)
Add New Park Games (Ping Pong, Horseshoe, Hopscotch)
Upgrade Infrastructure
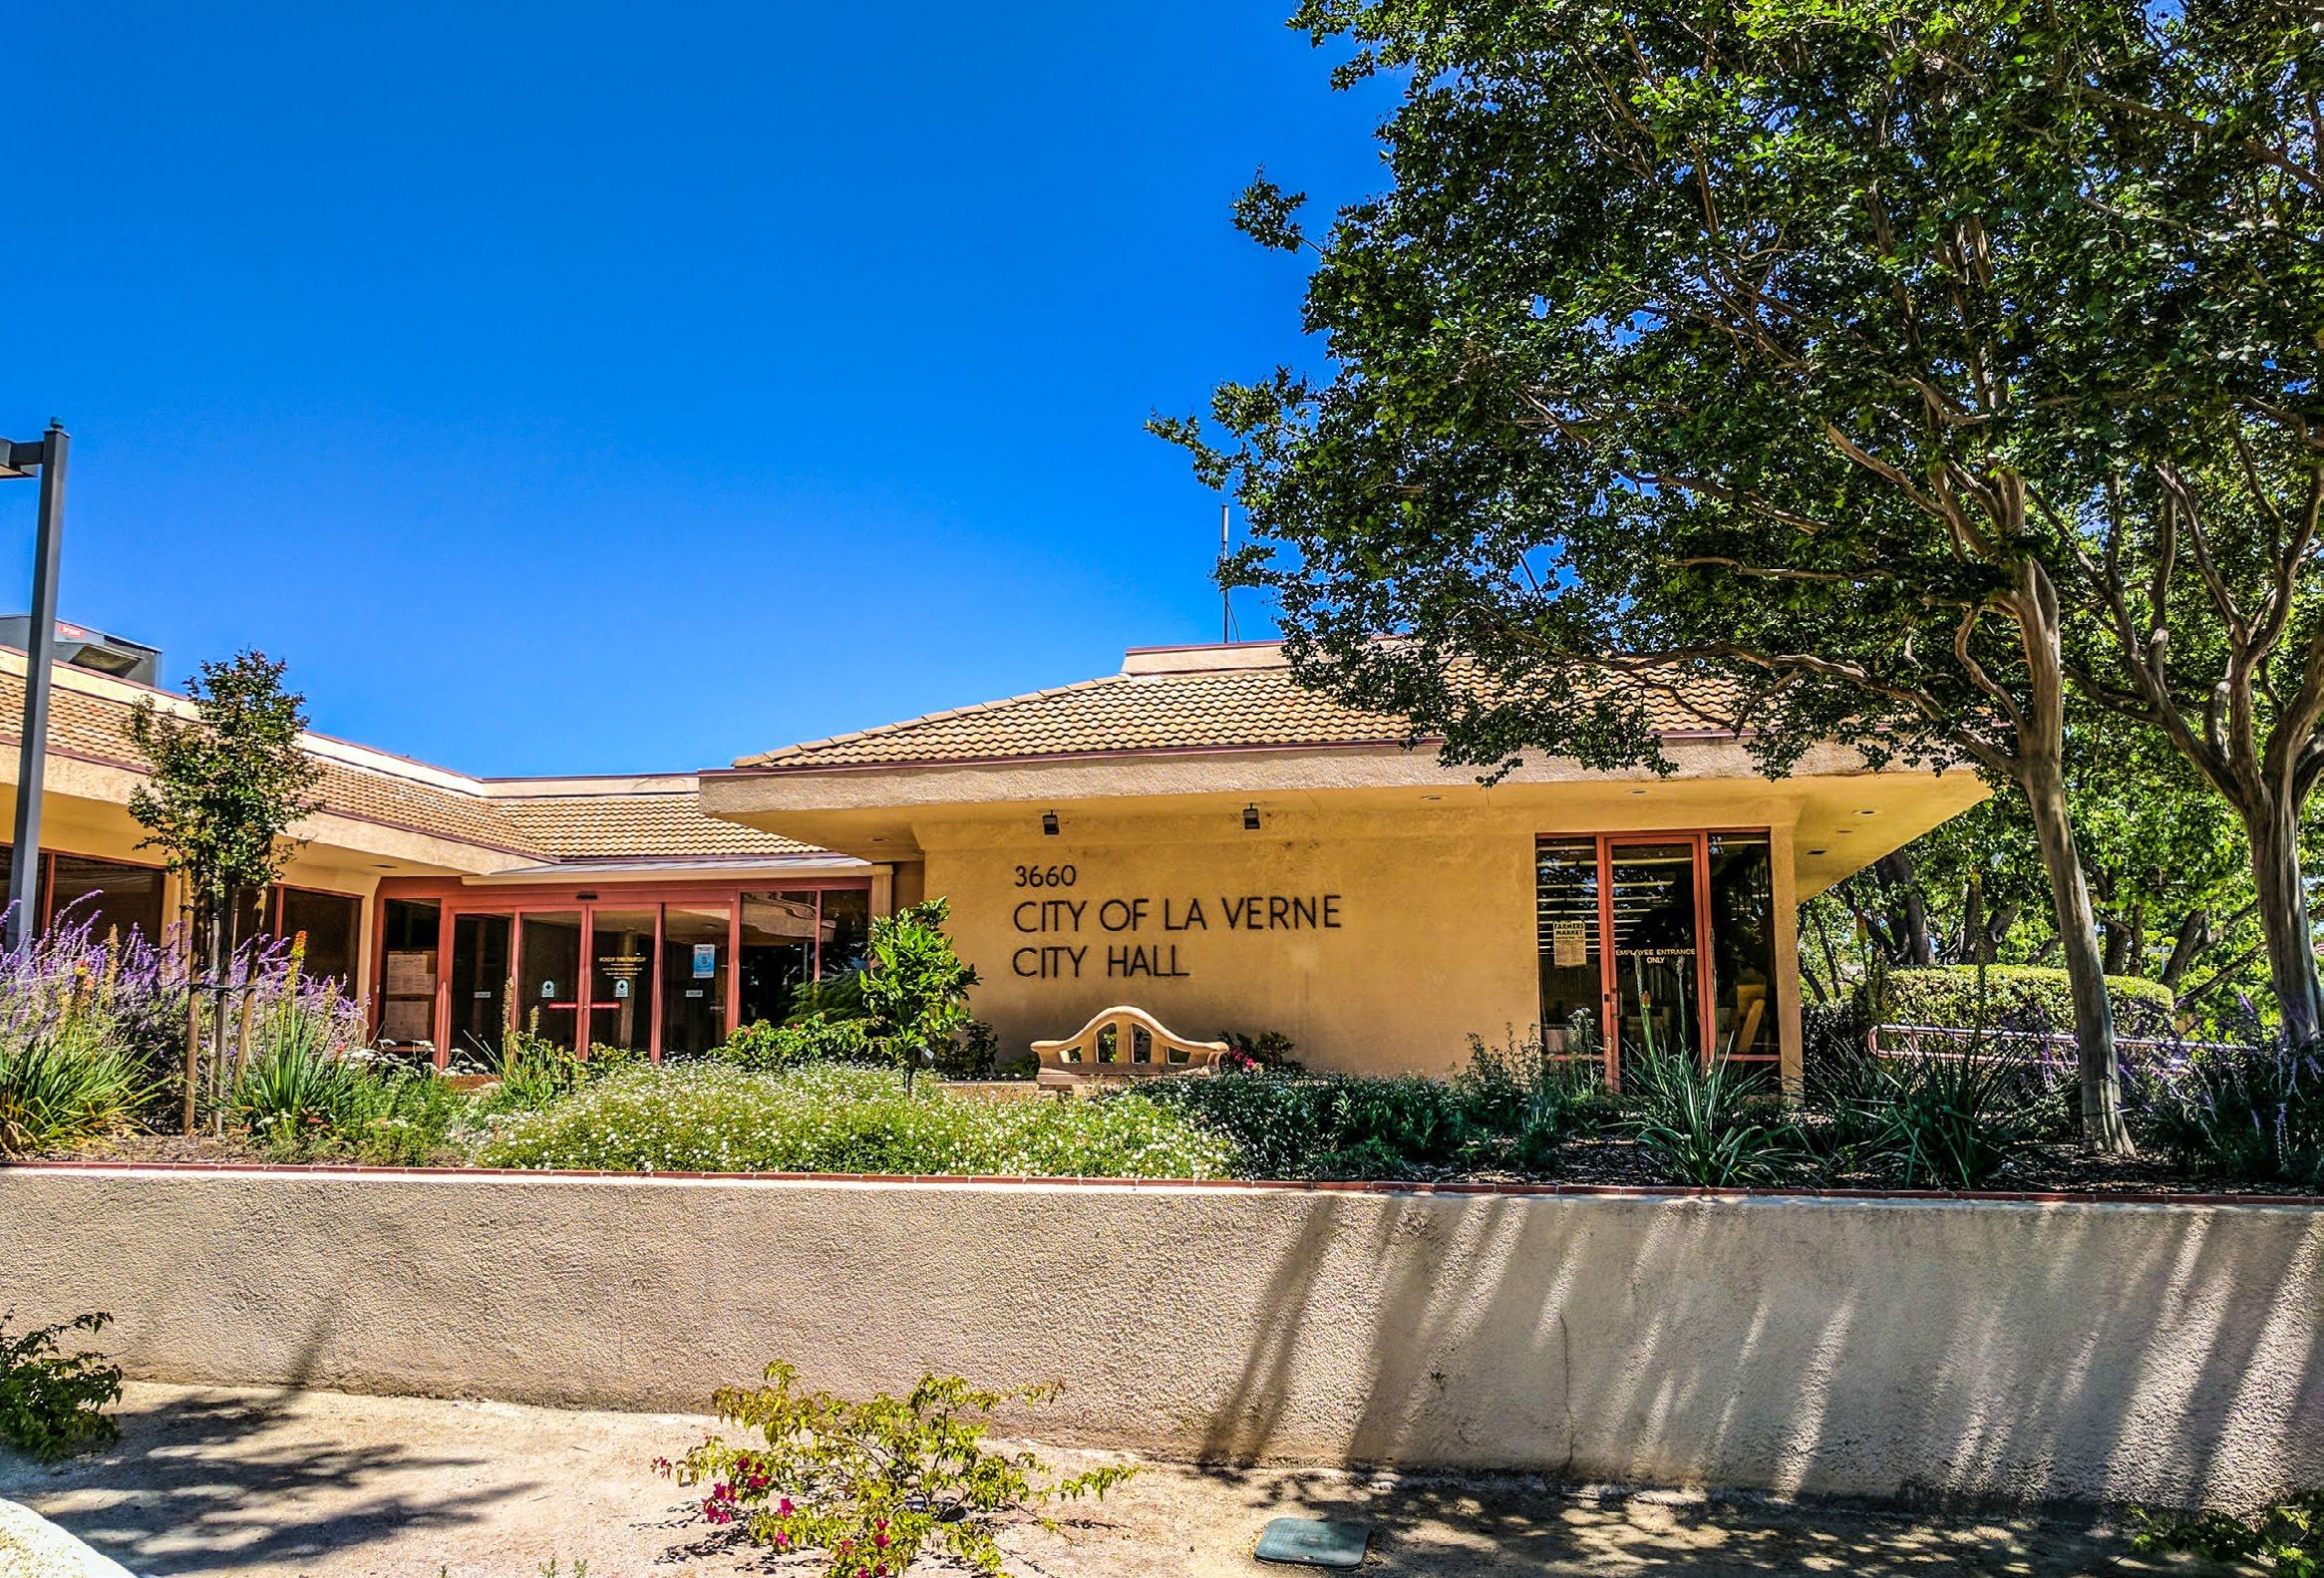
A statistically valid and community survey was conducted to collect input from residents and park users on the topics of city parks, recreational facilities, programs, and services. The survey questions were developed to provide the project team with information that would guide the development of recommendations and overall reflect the needs and desires of the La Verne community. The surveys were available in both English and Spanish from March to May 2025.
Statistically Valid “Invitation” Surveys Completed
796 Total Surveys Completed 631
+/- 3.9% Margin of Error
165 Open Link Surveys Completed
5,091 Surveys Mailed
Statistically Valid Sample: Paper surveys were mailed to a systematic random sample of residential addresses in La Verne, with the option to complete online through a password protected website (1 response per household).
The demographic profile of the invitation sample is compared to the known statistics of the City of La Verne using 2020 U.S. Census Data. Underlying data from the invitation survey is weighted by age, ethnicity, and whether children are present in the household, all to ensure appropriate representation in sample responses. The weighting process changed the results only slightly, but ultimately made the results more accurate and representative of the population.
Open Link Sample: Later, the same online survey was made available to all La Verne stakeholders, including non-residents (e.g., commuters, residents of nearby communities). The survey was promoted on social media, via flyers and banners, and at various community facilities to increase the reach of respondents.
Together, the two samples provide a useful source of community input on La Verne’s existing parks and recreation facilities and programming, and the desire for future improvements. A summary of the survey results is included in this chapter. Complete survey results can be found in Appendix A.
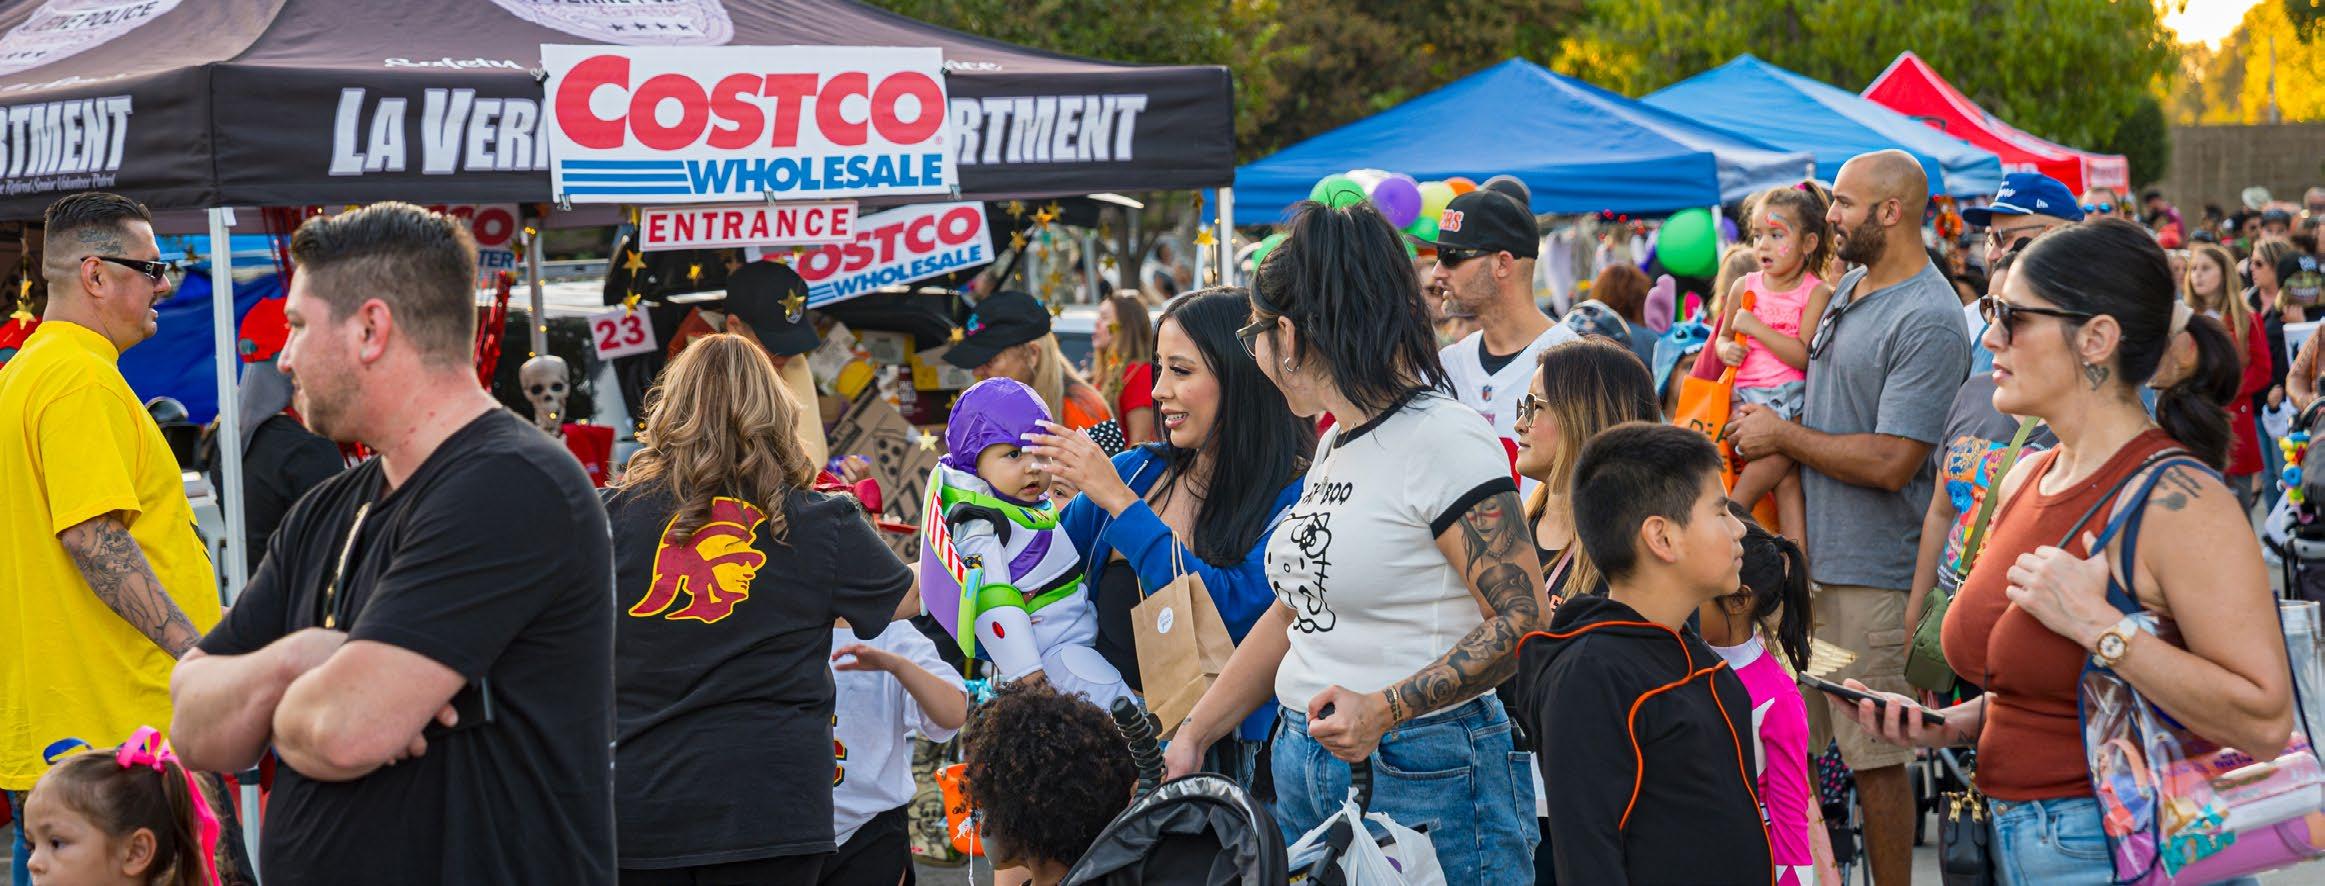
Key findings from completed statistically valid and open link surveys include:


» Most respondents are familiar with La Verne’s parks and recreation offerings. Among Invite respondents, 54% rated their familiarity as a 4 or 5, while familiarity was even higher among Open link respondents at 74%.
» Heritage, Las Flores, and Kuns Parks are the most frequently visited parks in La Verne.
» Most residents drive to parks, though many live within walking distance. Driving is the most common way residents travel to La Verne’s parks (52% Invite, 42% Open), yet a significant share, over one-third of respondents, typically walk, reflecting strong neighborhood access.
» Residents are generally satisfied with the La Verne parks and recreation system. Overall satisfaction was high, with average ratings of 4.0 or above across parks, special events, recreation programs/services, and recreation facilities for the Invite sample.
» Maintenance services receive high marks, especially from Invite respondents. Over 80% of Invite respondents were satisfied with public space upkeep, natural area management, and sports facility maintenance.
» Residents prefer a variety of communication methods, though effectiveness ratings differ. Preferences include seasonal brochures, email, and social media, suggesting value in a multichannel strategy.
» Parks and facilities viewed as important are generally meeting community needs, especially among Invite respondents. Neighborhood parks, community parks, and open space/trails were rated highest in importance and received strong satisfaction scores.
» Improved amenities and engaging activities are key to increasing park use.
» Top future priorities include trails, fitness programs, and amenities for families and youth. Youth programs and fitness/wellness programs rank as top priorities for 1 in 5 Invite respondents, while Open link respondents showed more variation with priorities.
» Residents view the parks and recreation system as central to La Verne’s community identity and quality of life.
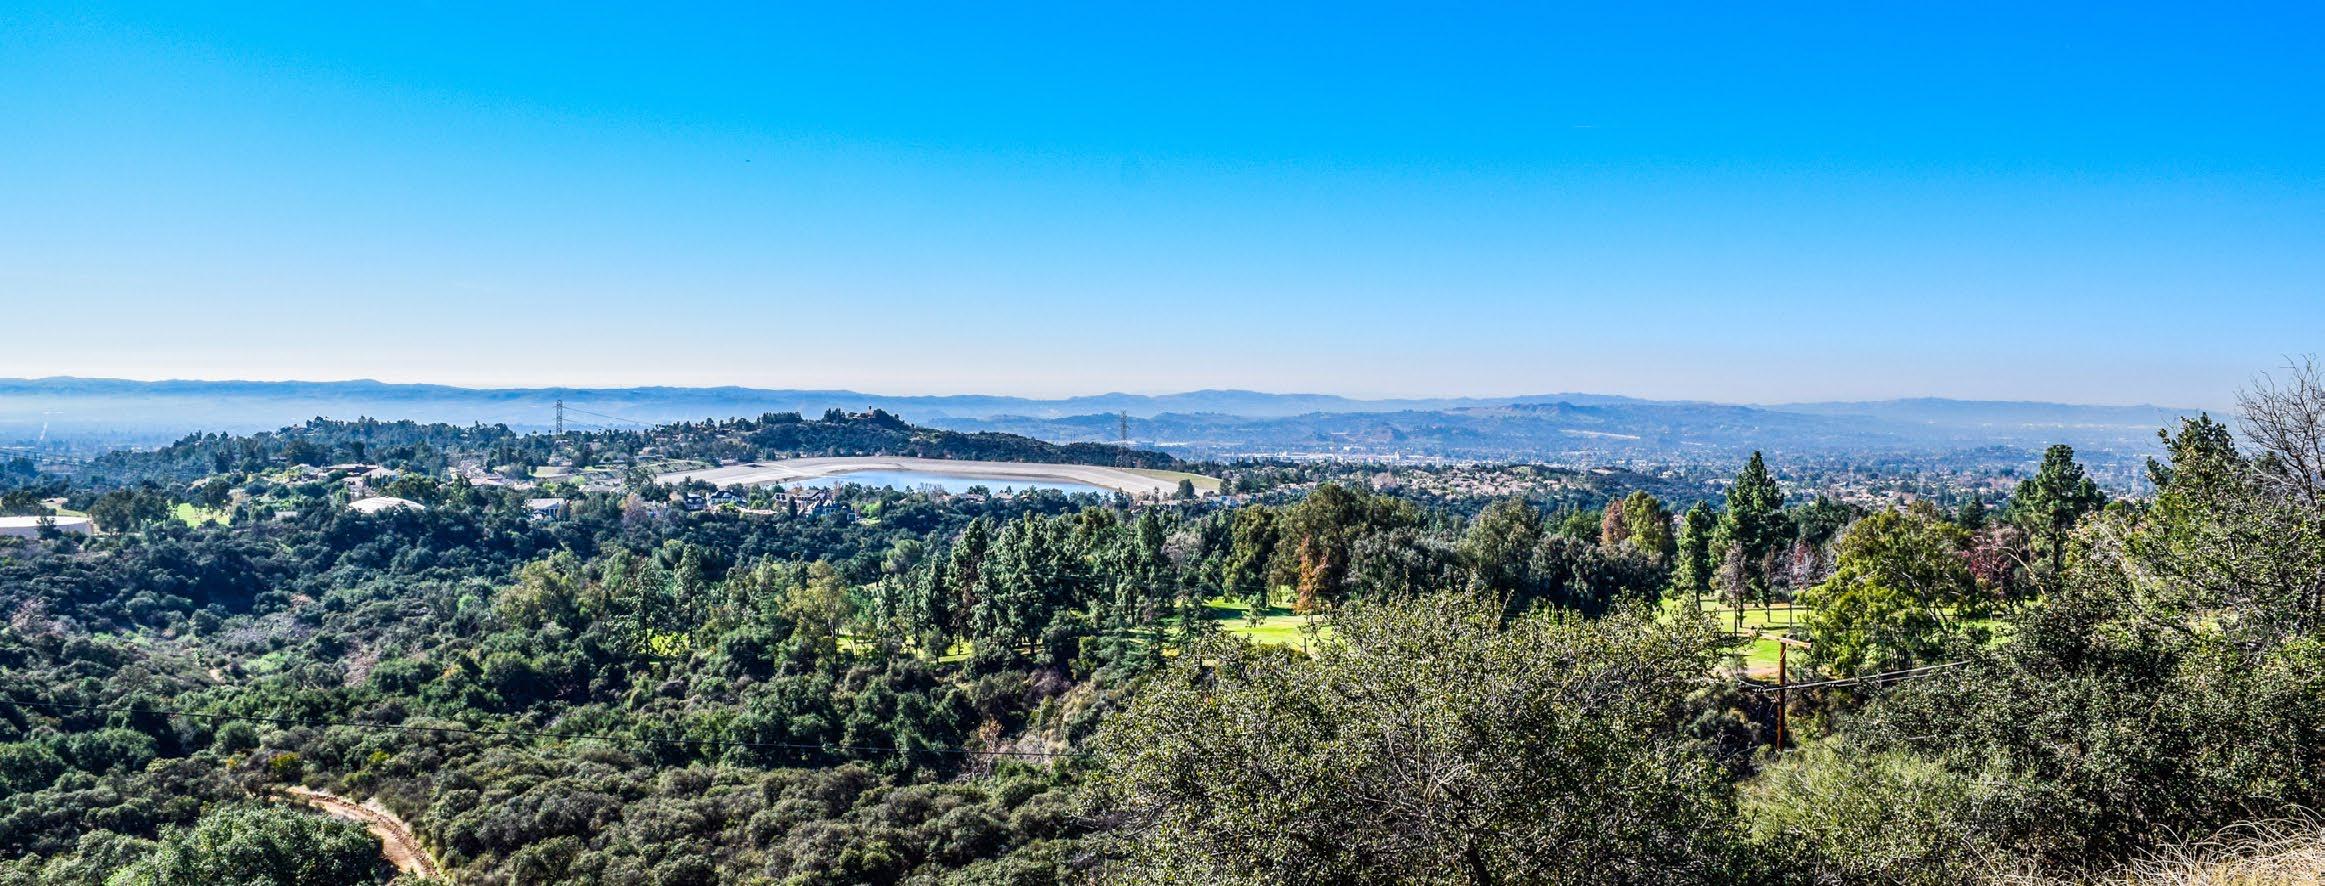
community improved were priorities for use, Invite maintenance of was the among respondents paved walking expressed programming, for both improvements and accessibility, and were overall, subset
improving
Figures 4-2 through 4-8 present snapshots of survey results from both the statistically valid survey sample and the open link survey sample.
Motor vehicles remain the most common way residents travel to parks in La Verne, used by 52% of Invite respondents and 42% of Open link participants. However, a notable share of the community particularly in the Open sample relies on active transportation methods such as walking, running, or rolling (35% Invite; 47% Open), signaling demand for pedestrian-friendly infrastructure and neighborhood access.

both or space/trails restrooms each rated 5) by respondents. also rank Invite among important five skate which average the responses.

widely more link as samples, respondents 59%
widely link as samples, respondents 59% as over low, games.
as over low, games.
both adding or space/trails restrooms each rated 5) by respondents. also rank Invite among important five skate which average the responses.

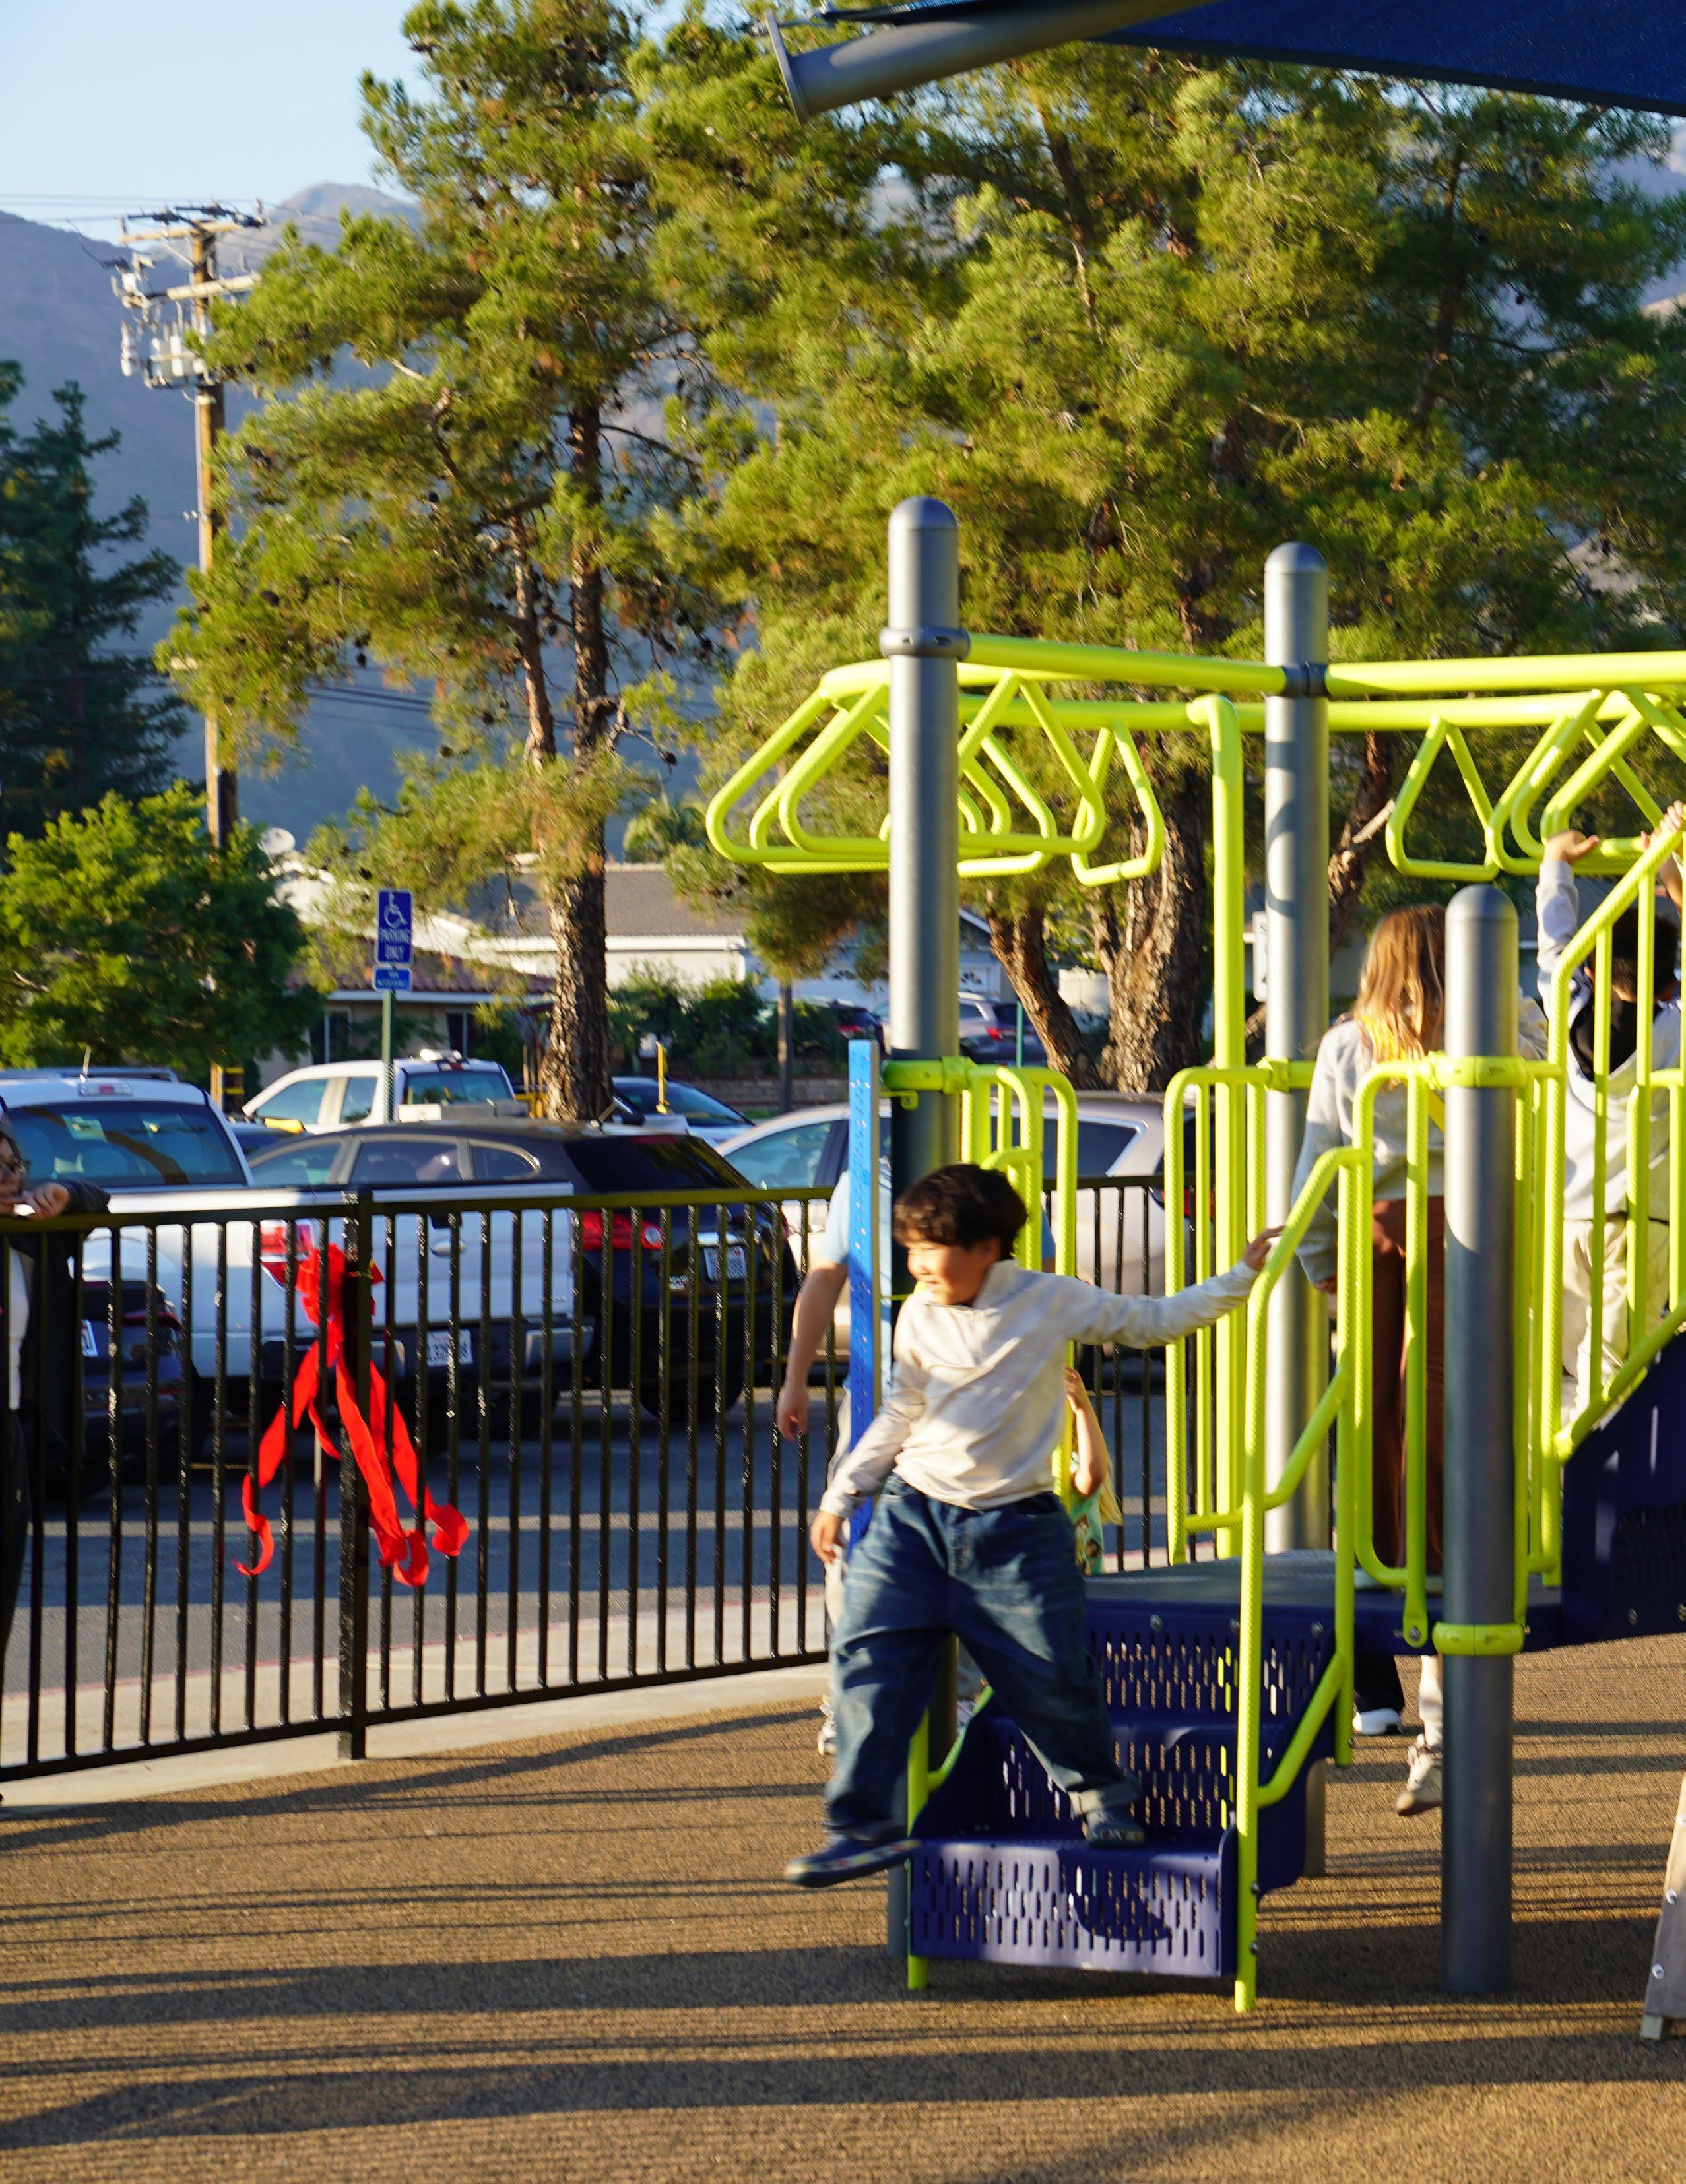
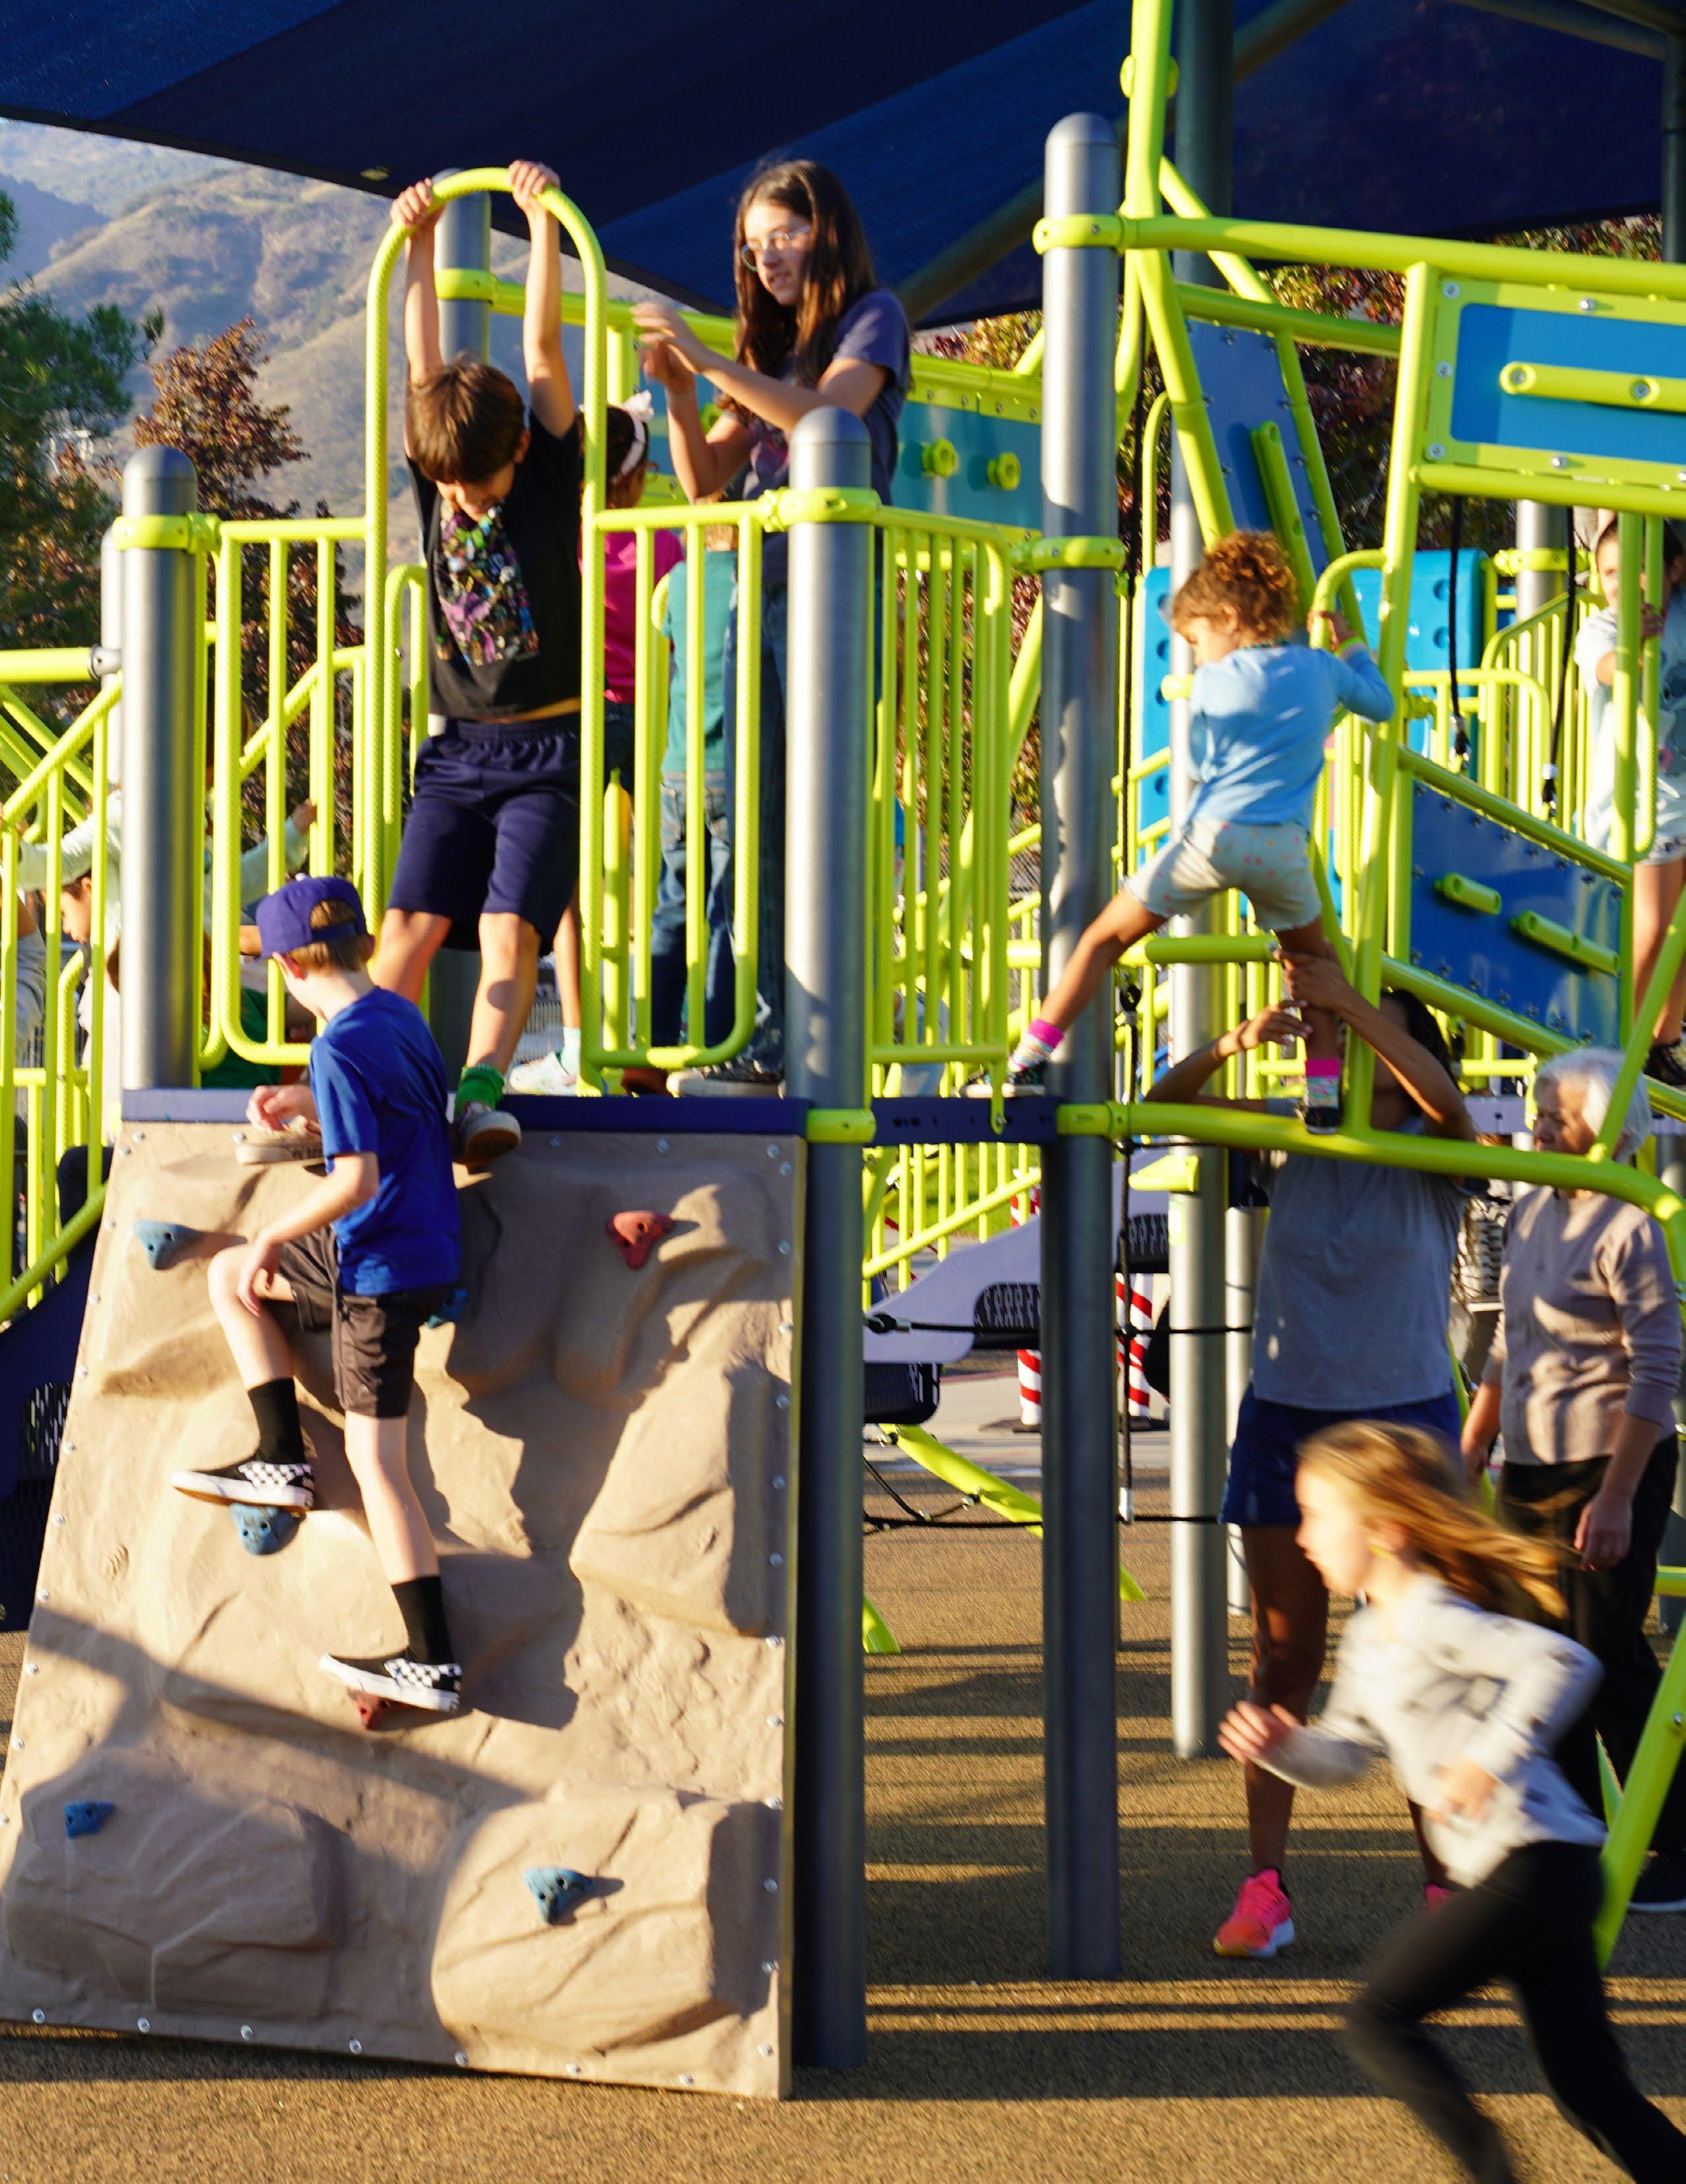
The recommendations in this Chapter are based on the findings from the existing conditions analysis, community engagement, and the comparative analyses described in the previous chapters of this Plan. These recommendations are intended to be consistent with the General Plan and build upon the work the City has completed since the previous Parks Master Plan (2006).

6.1 6.2 6.3
» Establishes 3 initiatives to help guide the City
» Each initiative contains a series of objectives
» Each objective contains a list of actions that can be completed to achieve each objective
» Recommendations for improvements to existing parks
» Identifies underutilized space at parks and recommends features for those areas
» Cost estimates for major park amenities can be found in Appendix C
» Combines the park-specific and citywide infrastructure recommendations
» Items are categorized into three tiers to help implementation
» Each item also points back to a objective from the plan initiatives
» Items recieved planning-level cost ranges to help understand general costs
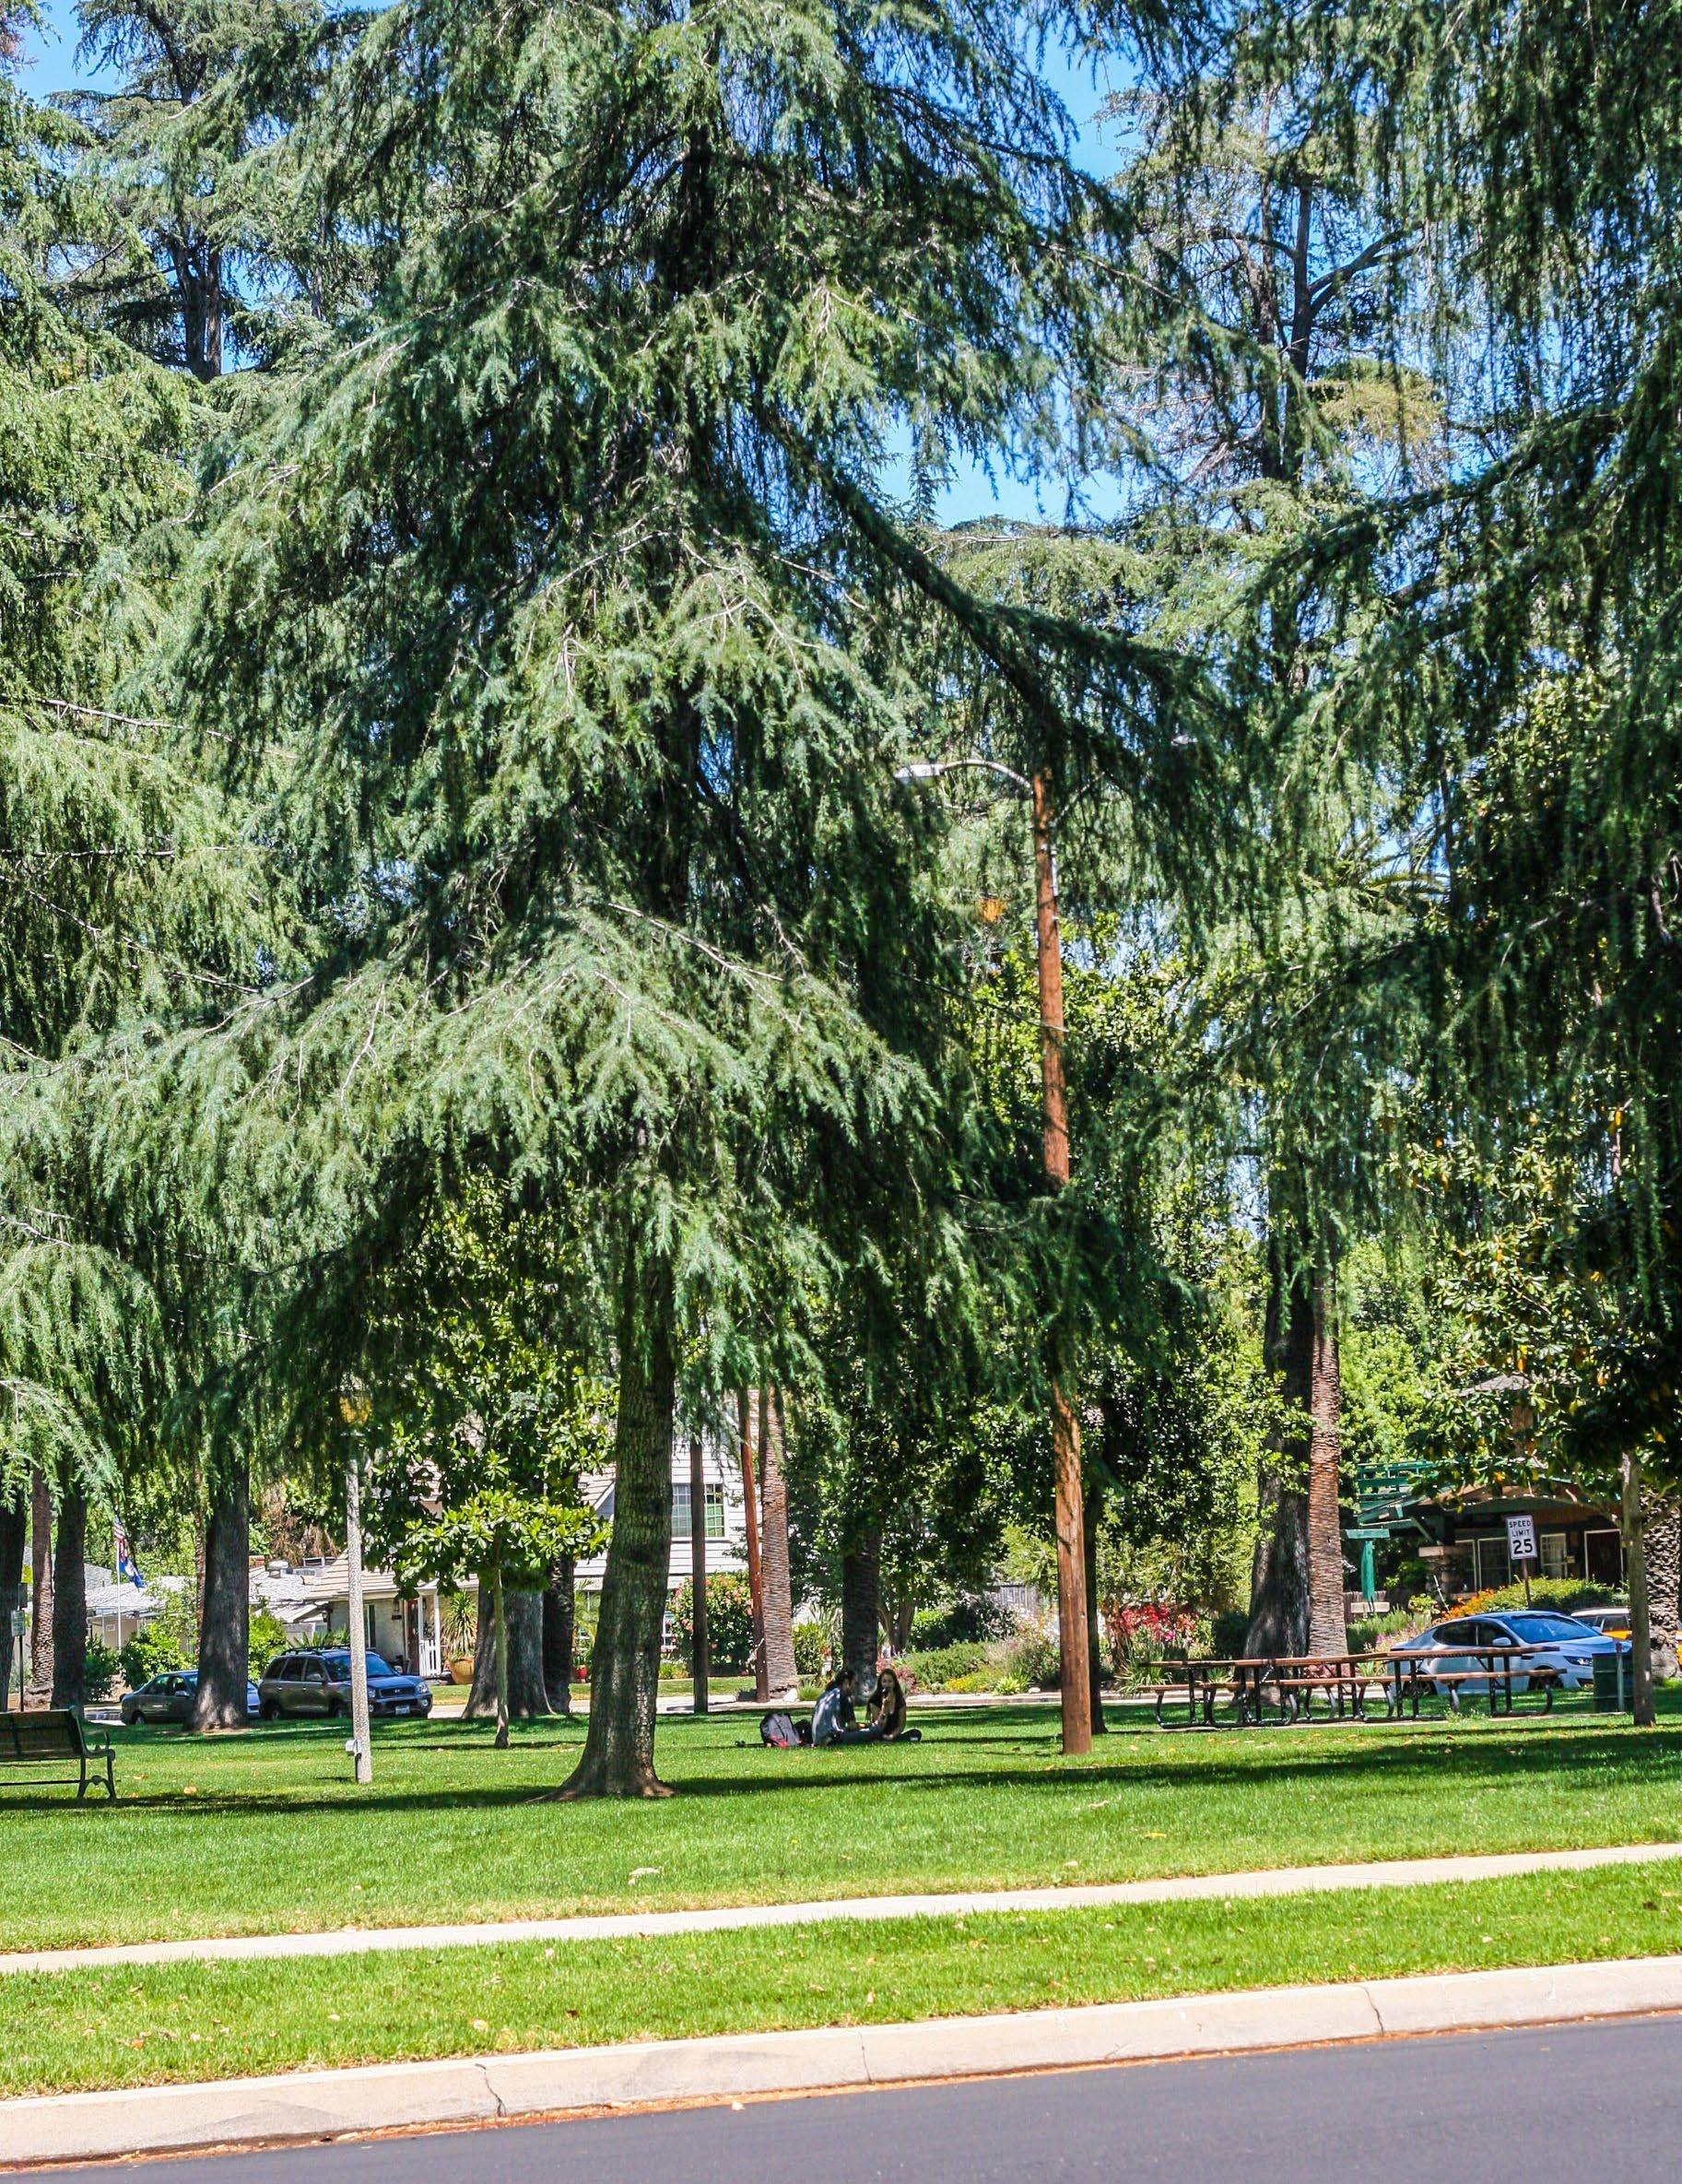
The three plan initiatives are aimed to provide the City topic areas for making improvements to the parks and recreation system in La Verne. Each initiative is followed by a series of objectives and action items to help achieve the goals. The initiatives, objectives, and action items are based on analysis findings, community engagement findings, staff needs, and the statistically-valid survey.
The Plan initiatives are meant to serve as a tool for the City to use as a living document, it allows the City to check-off items as they complete them, edit the timeline of items as priorities change, and adjust department responsibilities as roles shift.

The Enhanced Parks and Facilities initiative focuses on modernizing parks and community facilities by upgrading amenities, enhancing sports and recreation opportunities, reinvesting in gathering spaces, and preserving natural resources.
Initiatives represent an overarching topic related to parks and recreation.
Objectives provide direction to help create the positive change the City envisions.
Actions are well-defined steps needed to achieve objectives.
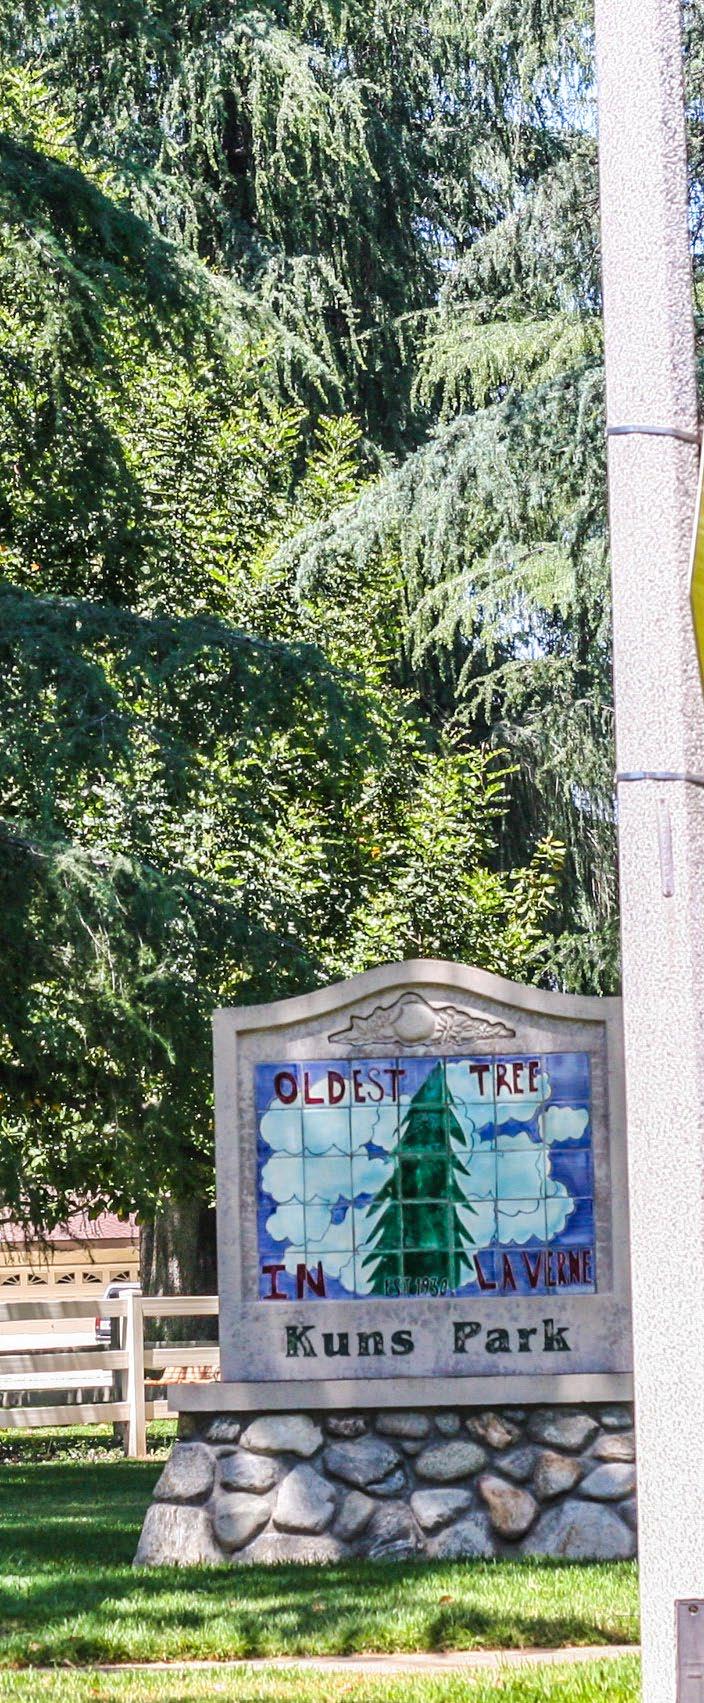
The Inclusive Access initiative aims to create more inclusive parks, recreation facilities, programs, and services to community members and visitors. Increase connections to parks and within parks. Create a more accessible atmosphere at parks and facilities.


The Community Pride initiative aims to enhance community identity by celebrating diversity, maintaining high quality parks, and expanding inclusive programs for all ages.
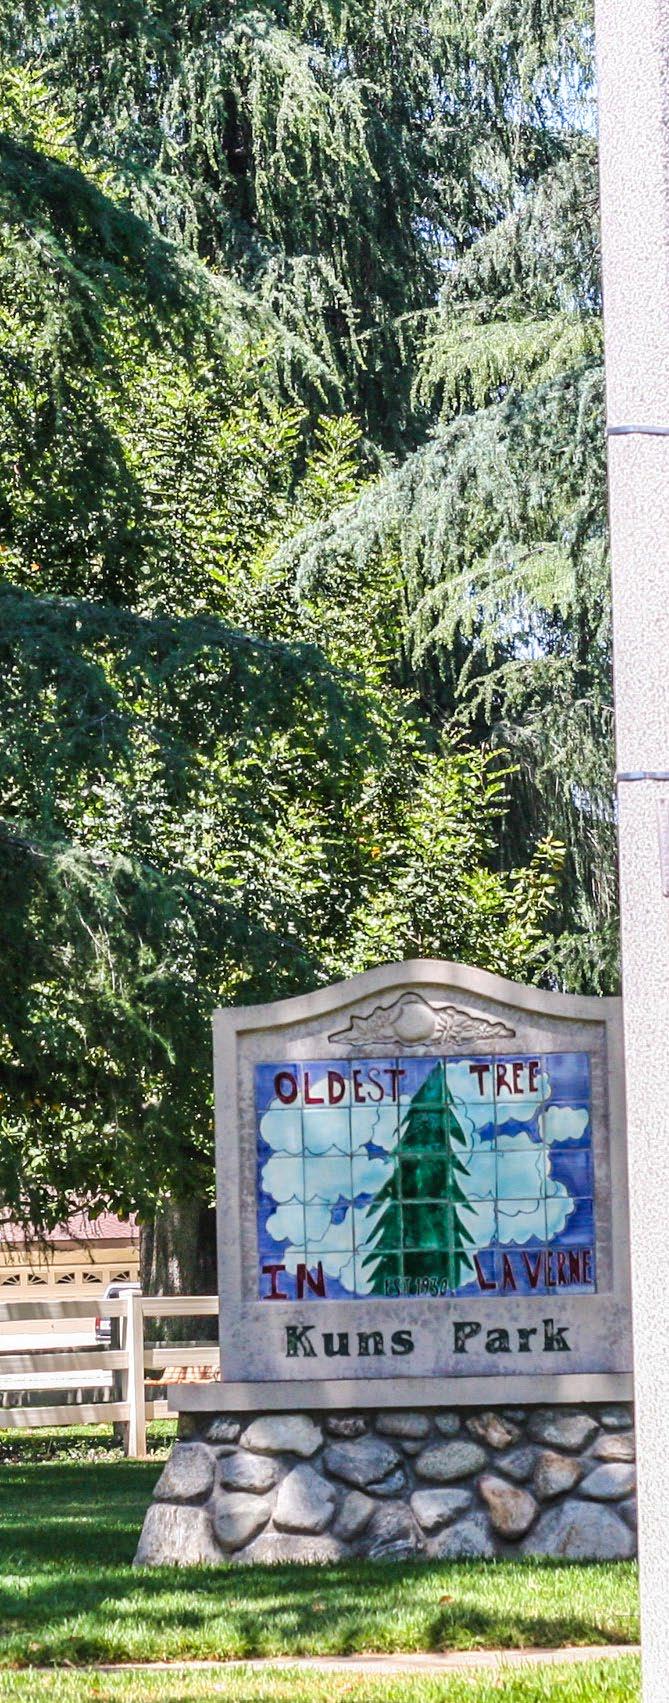
Action 1.1: Upgrade picnic areas with new shade structures, tables, and benches.
Action 1.2: Replace or upgrade aging park furnishings (benches, tables, BBQs, trash receptacles).
Action 1.3: Renovate outdated playgrounds, incorporating all-abilities features, unique themes, and inclusive designs.
Action 1.4: Improve general park beautification through enhanced landscaping, planting of shade trees, and aesthetic enhancements.
Action 1.5: Upgrade pedestrian-scale lighting throughout all parks.
Action 1.6: Develop full walking loops in parks, where appropriate.
Action 1.7: Update park wayfinding, educational, and how-to signage.

Action 1.8: Repave all parking lots that serve City parks.
Action 2.1: Remove soccer goalposts at parks to ensure more flexibility in sports programming.
Action 2.2: Construct additional outdoor athletic courts to meet growing demand, such as pickleball.
Action 2.3: Renovate sports fields with updated lighting, irrigation, turf, fencing, bleachers, and backstops to support community use and tournament play.
Action 2.4: Develop a multi-use sports court complex to accommodate a variety of athletic activities such as tennis and volleyball.
Action 3.1: Continue JUAs with the local school district.
Action 3.2: Re-establish JUA with Live Oak Park.
Action 3.3: Develop a new gymnasium at the Lutheran site to meet indoor recreation needs.
Action 3.4: Consider the addition of new amenities at existing City-owned properties, as shown in the opportunity areas in section 3.12 of this Chapter.
Action 3.5: Consider constructing a dedicated enclosed off-leash dog park.
Action 3.6: Construct a new park on the Lutheran site, funded and built by Lewis Homes.
Action 3.7: Renovate the existing community center to modernize its amenities and expand its programming potential.
Action 3.8: Consider construction of an amphitheater at a community park to be used for community events, concerts, movie nights, etc.
Action 3.9: Re-negotiate the La Verne Aquatic Center for expanded City hours for public access and programs or consider divesting in pool operations.

Action 4.1: Identify and preserve existing natural areas, including mature trees and open spaces, within parks, and future development sites.
Action 4.2: Integrate native landscaping and sustainable design into park renovation and development projects. Sustainable design elements can include, but are not limited to native and drought-tolerant landscaping, reflective roofs, solar panels, bioswales, permeable pavement, rain harvesting systems, reclaimed water, etc.
Action 4.3: Explore opportunities to establish community gardens at existing parks and recreation sites and/or identify potential locations for a community garden in higher-density areas with limited access to private outdoor spaces.
Action 4.4: Consider a volunteer stewardship program for community members to actively participate in the care and enhancement of parks, trails, and open spaces in La Verne. Volunteer events may include trash cleanups, weeding, tree planting, graffiti removal, etc.
Action 4.5: Identify parks and recreation facilities in greatest need of additional shade and develop a plan to increase shade through structures, where needed.
Action 4.6: Install interpretive signage with consistent branding and messaging at parks, trails, and open spaces to draw attention to and highlight the importance of La Verne’s natural habitats.


OBJECTIVE 1: PROVIDE AN EQUITABLE DISTRIBUTION OF PARKS OR RECREATION FACILITIES SO RESIDENTS CAN ACCESS A PARK OR FACILITY WITHIN A 15-MINUTE WALK.
Action 1.1: Increase walking and biking access to parks by implementing recommendations found in the 2021 Active Transportation Plan.
Action 1.2: Prioritize the addition of new parks and recreation facilities in underserved and high-density areas.
Action 1.3: Acquire new city-owned land to develop new parks that can close park access gaps.
Action 2.1: Maintain and improve sidewalks, curb ramps, crosswalks, bike lanes, traffic signal timing, etc. to enhance connections to city parks.
Action 2.2: Consider partnering with transportation agencies to prioritize transit routes to parks.
Action 2.3: Install wayfinding signage and trail markers to promote access to walking, biking, and hiking.

Action 3.1: Upgrade parks to meet or exceed ADA accessibility standards across all locations.
Action 3.2: Maintain bilingual (English/Spanish) signage and use clear, visual graphics to improve communication for all users.
Action 3.3: Partner with neighboring agencies and nonprofits to share resources and create regional programs for individuals with disabilities (e.g., adaptive sports leagues).
Action 3.4: Explore the feasibility of expanding park restrooms to include wheelchair-accessible and ADA-compliant, family-style restrooms to make it easier for caregivers to tend to individuals with special needs.
Action 3.5: Pilot accessible recreation programs and events for people with disabilities, monitor participation, and adapt based on feedback.
Action 3.6: Review existing special events through the lens of accessibility and inclusivity; make necessary adjustments to improve comfort and access for all participants.
Action 3.7: Explore the creation of a formal inclusion policy to guide equitable access to all programs and services, referencing NRPA best practices.
Action 3.8: Consider adding an additional inclusive and all-abilities play elements to existing playgrounds to ensure play opportunities for children of all abilities.
Action 4.1: Ensure programs, events, and park information is communicated in English and Spanish.
Action 4.2: Use additional platforms to share information about parks and recreation.
Action 4.3: Periodically survey residents and park users to understand the best approach to communications.
Action 4.4: Explore funding opportunities to ensure the production of seasonal brochures that inform residents of programs and services.
Action 4.5: Invest in marketing strategies to increase awareness and utilization for rental services.


Action 1.1: Maintain popular existing events while exploring opportunities to introduce new community-wide celebrations, cultural events, and seasonal festivals.
Action 1.2: Partner with local organizations and businesses to enhance programming variety and reach.
Action 1.3: Ensure events are inclusive and reflect the diversity of the community.
NEW INITIATIVES TO BUILD UPON COMMUNITY IDENTITY AT PUBLIC PARKS AND OTHER SPACES
Action 2.1: Create new public art initiative to hire local artists to paint murals on park buildings or other less than attractive equipment such as storage containers at parks like Lordsburg Park, Rustic Canyon Park, Oak Mesa Park, and Pelota Park.
Action 2.2: Design new park elements that preserve the distinctive character of La Verne.

AT THE HIGHEST QUALITY
Action 3.1: Prioritize preventative maintenance tasks and labor hours at high-use parks identified in the Prioritization Matrix of the Maintenance and Operations Assessment.
Action 3.3: Target below-average scored assets per asset condition assessment for replacement and/or repairs, such as restrooms, playgrounds, and sports courts.
Action 3.4: Improve maintenance practices, focusing on restroom cleanliness, trash pickup, and general park upkeep.
Action 3.5: Continue using a hybrid model of reduced maintenance frequency and contracted specialty work for low-traffic parks to free up staff hours for high-demand parks.
Action 3.6: Consider adding 1.0 FTE to the Public Works, Parks Division.
Action 3.7: City is encourages to develop a detailed Maintenance Management Program. This will allow the city fully understand daily, weekly, and seasonal maintenance operations. This will help to ensure public safety, maximize asset lifespan, reduce long-term repair costs, and maintain clean, welcoming spaces that foster community health.
Action 3.8: Consider growing the annual maintenance investment by at least $100,000–$150,000 to close funding gaps.
Action 3.9: City to assess maintenance operations every 2-3 years to identify new gaps and efficiencies.
Action 3.10: City is highly encouraged to transition away from hand-written reports to digital means of logging maintenance operations. By doing so, they will have clearer records that can be used for future assessments.

Action 4.1: Increase the number and variety of fitness and wellness programs, such as yoga, walking clubs, and nutrition workshops.
Action 4.2: Include e-sports and e-gaming programs to engage the youth population.
Action 4.3: Continue to partner with the local high school to expand teen programs, activities, and summer camps.
Action 5.1: Assess the feasibility of the department’s aquatics programs and services by evaluating either divesting or renegotiating the current pool agreement with the University of La Verne and BUSD.
Action 5.2: Update current partnership agreements with more accurate, consistent, and detailed clauses that include finite terms, annual review meetings, and permitted uses.
Action 5.3: Conduct cost-benefit analyses of each current partnership agreement, utilizing the Master Plan’s cost-of-service data to evaluate reciprocity and renegotiate financial terms, as needed.
Action 5.4: Create a process for both Parks Division and Recreation Division staff to jointly evaluate potential partnerships and external rental requests.

OPERATIONAL STRATEGIES TO SUPPORT PARKS AND RECREATION DEPARTMENT
Action 6.1: Establish operational policies and procedures to create more consistency in department and citywide operations.
Action 6.2: Encourage staff to use the Service Analysis Tool for the evaluation of department services.
Action 6.3: Consider having the Parks Division staff within the Parks and Recreation Department to continue collaborative and streamlined operations.
Action 6.4: Adopt a Financial Sustainability Policy.
Action 6.5: Provide additional staff resources and a dedicated budget for the City’s Homeless/Mental Health Program to be able to operate most efficiently and effectively.
Action 6.6: Consider adding 1.0 FTE for the Parks and Recreation Department due to current capacity and growing community demand and expectations.
Action 6.7: Complete an updated cost of service analysis in 24 months in order to begin to internal benchmarking efforts to improve cost recovery.
Action 6.8: Evaluate and implement multiple cost recovery strategies to meet the needs of the community.
Action 6.9: Reassign or divest the department’s nonparks and recreation services (including Passport Services and the Animal Services Program).
Action 6.10: Evaluate the overall resident and non-resident participation in department services and consider implementing resident and non-resident pricing in order to reach cost recovery goals.
Improving existing City parks is one of the top priorities of this Plan. This section takes a deep-dive into existing City parks and facilities and identifies recommendations based on key findings from analysis, community engagement, staff needs, and general best practices.
The opportunity area analysis determines underutilized areas within a park and suggests new park amenities that can potentially be suitable based on required space. Each park with one or more opportunity areas is shown with a key map alongside a table of recommended potential amenities.
The table identifies what kinds of amenities will fit in the opportunity areas based on square footage and dimensions. The amenities with an “x” indicate a need based on park amenity deficits, geographic distribution of park amenities identified during the analysis phase, community engagement feedback, and general best practices.
Parks also include specific recommendations such as upgrading, renovating, or replacing existing amenities and parkwide recommendations such as safety improvements and connectivity improvements.
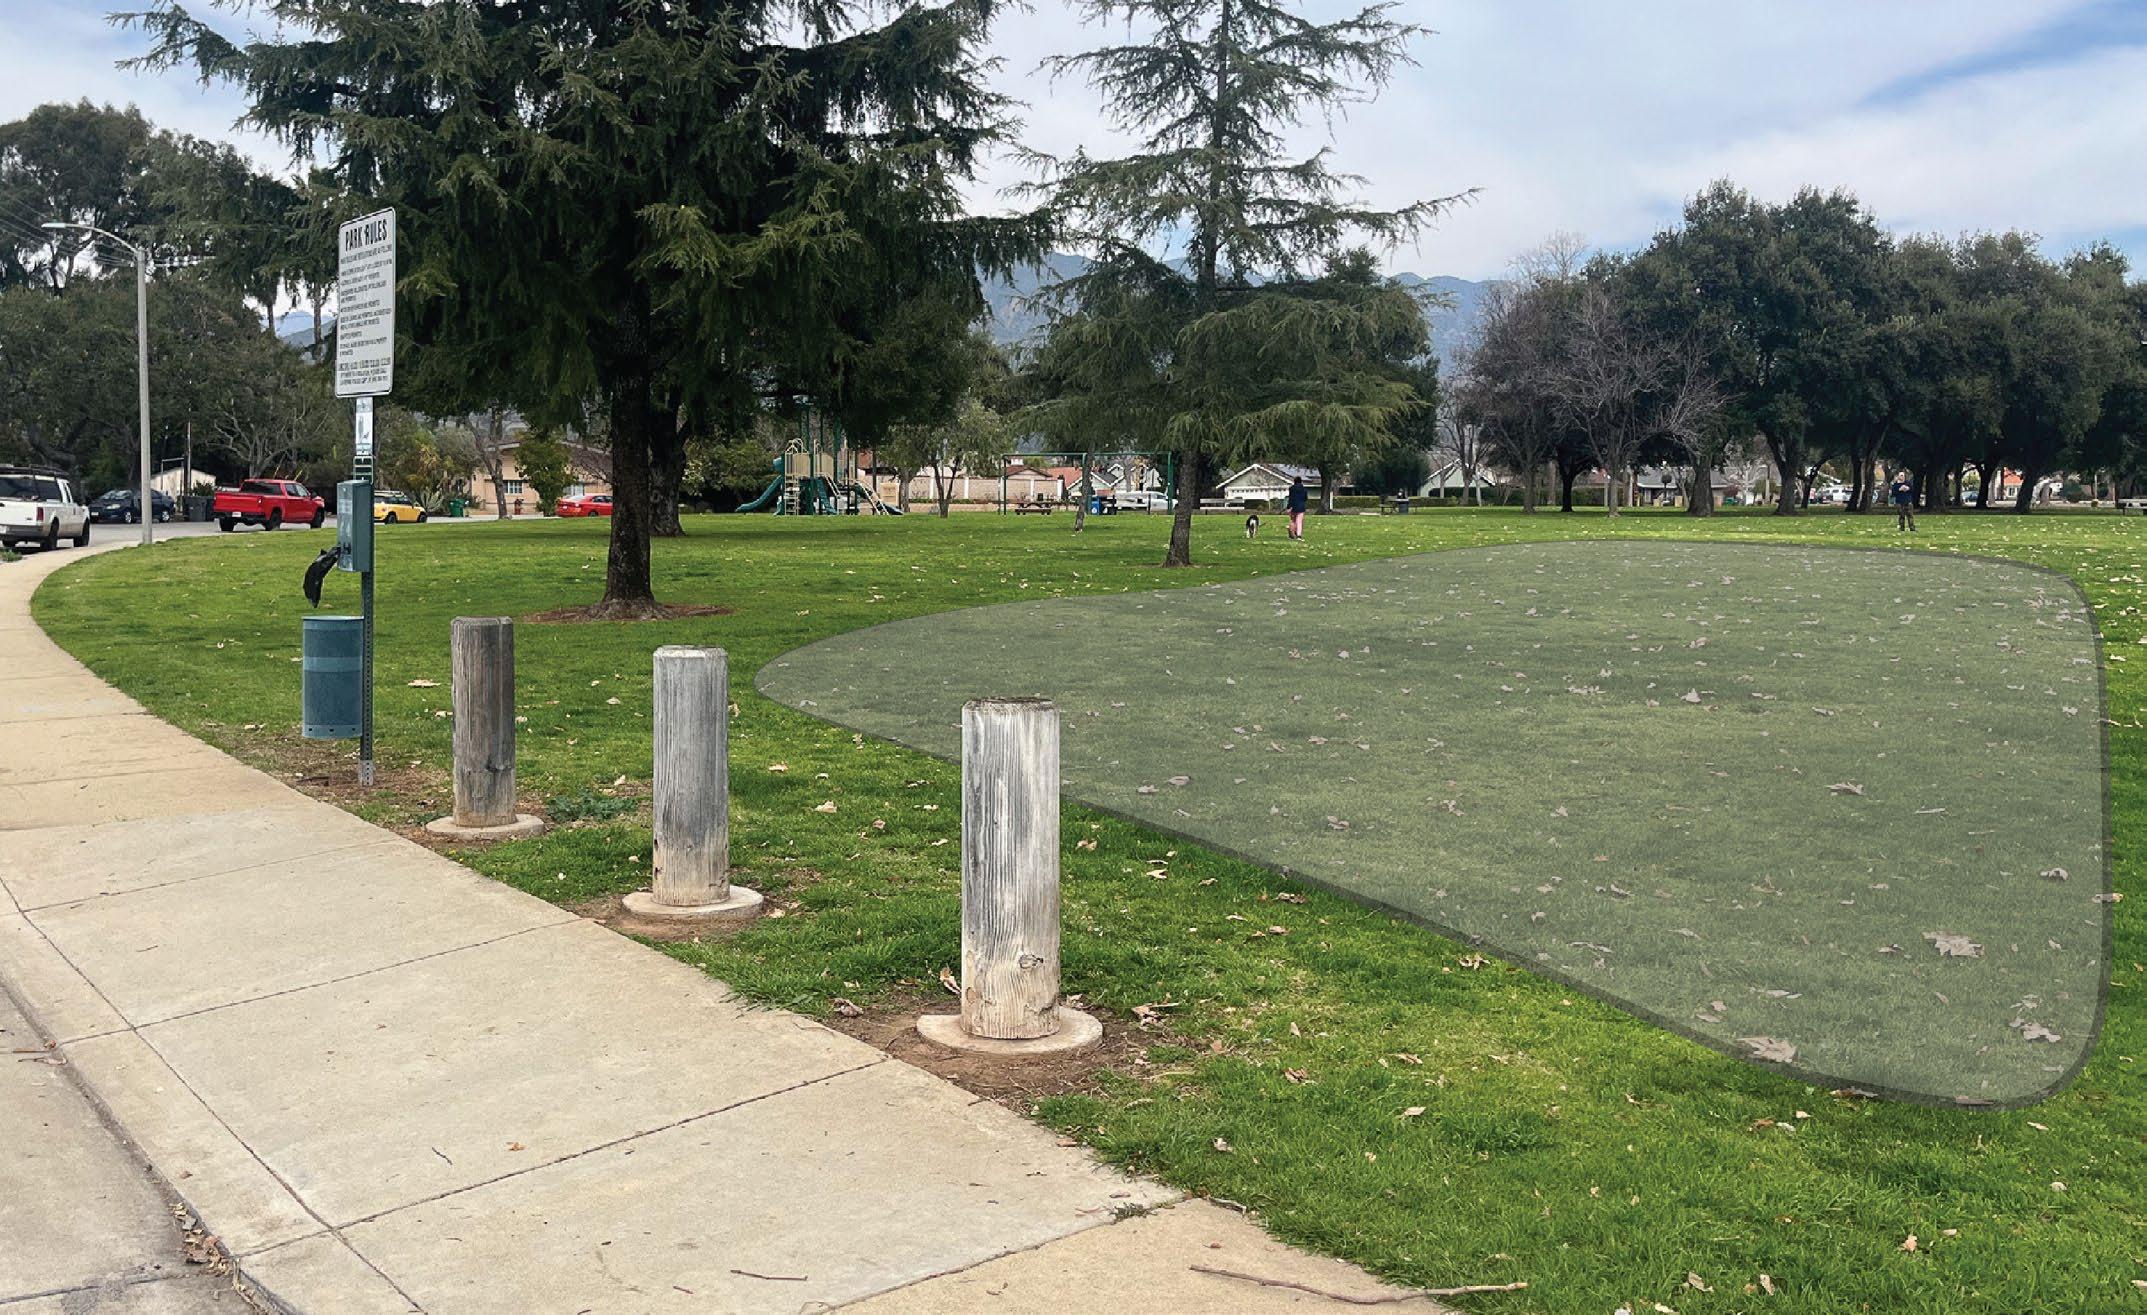



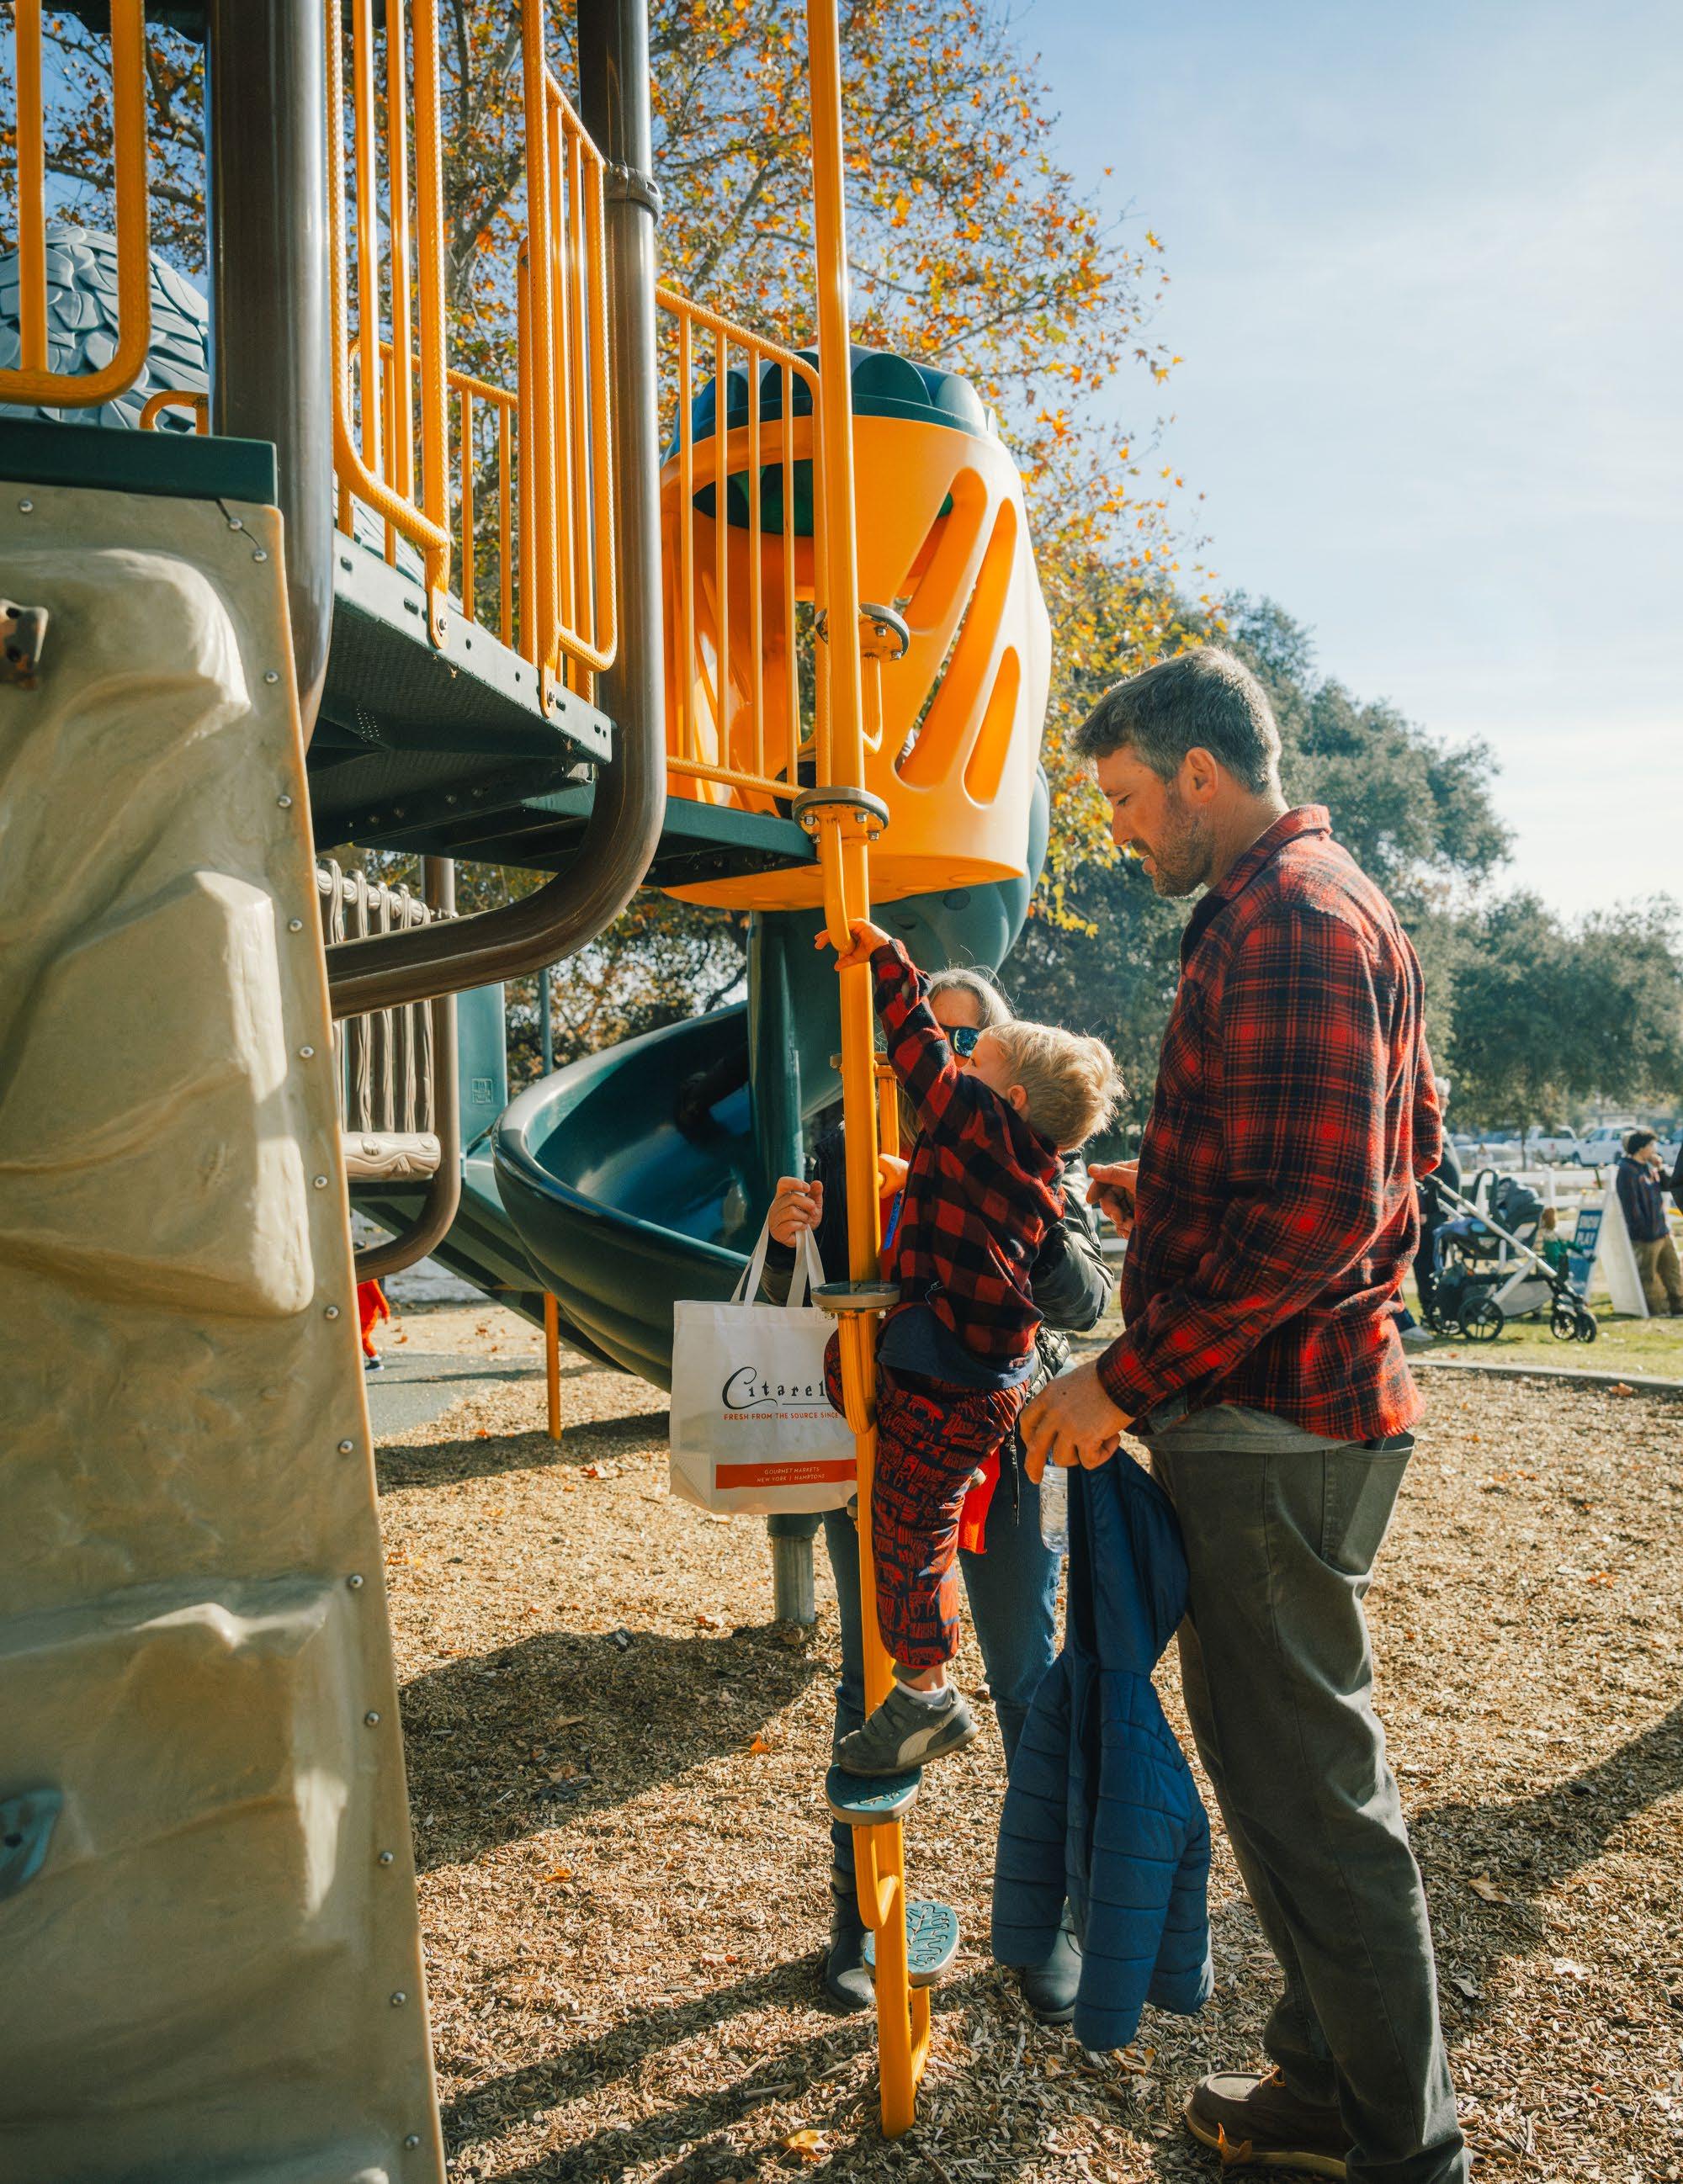
Stars within the tables represent amenities with strong support from workshop participants.
Park specific recommendations were presented during community workshop #2 and participants were given the opportunity to vote on which amenities they prefer to see in the infill areas. This feedback as summarized and represented on the opportunity area tables.
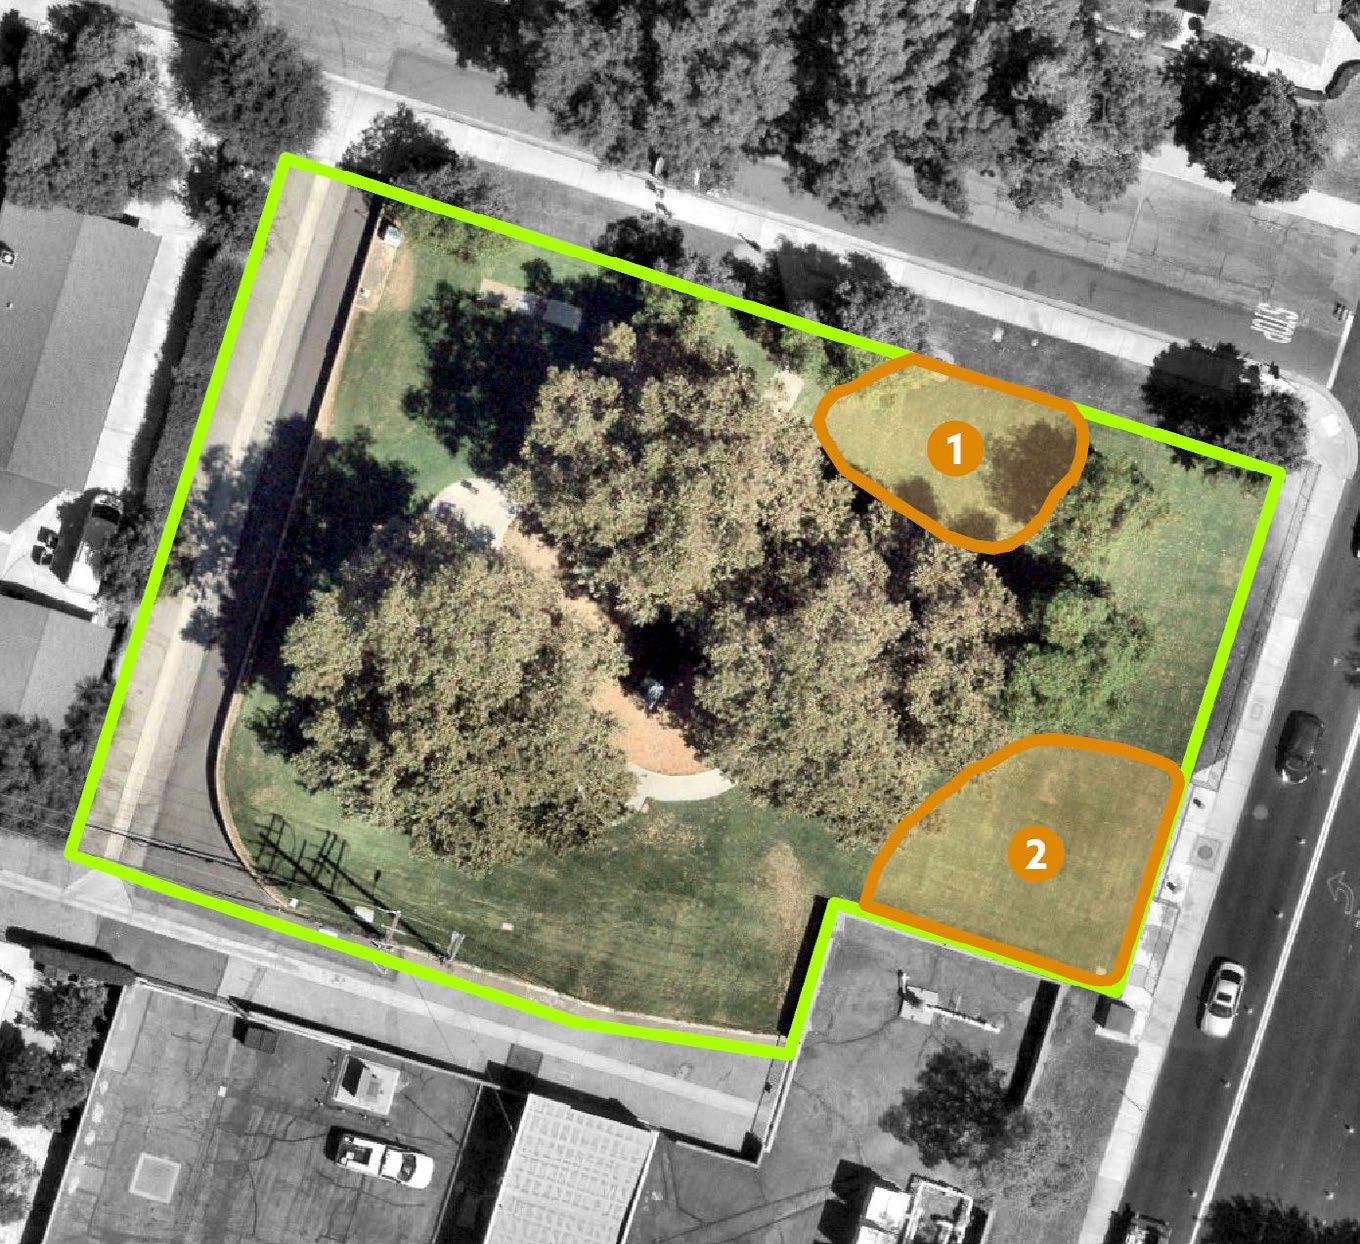
Park Boundary Infill areas
Recommended Recreation Amenities for Underutilized Park Space:
TABLE 6-1: Lincoln Park Recommended Amenities
Existing Conditions: Lincoln Park is a 0.6 acre mini park located on White Avenue and 6th Street. Existing amenities include a playground, a picnic table, and benches.
Planned Improvements: N/A
Park Recommendations:
1. Replace all picnic tables
2. Ensure adequate playground surfacing to meet ADA requirements
3. Consider adding additional pedestrian-scale lighting around walking path and playground
4. Renovate irrigation system
5. Install new recreation amenities that address deficits and community needs in underutlized park space
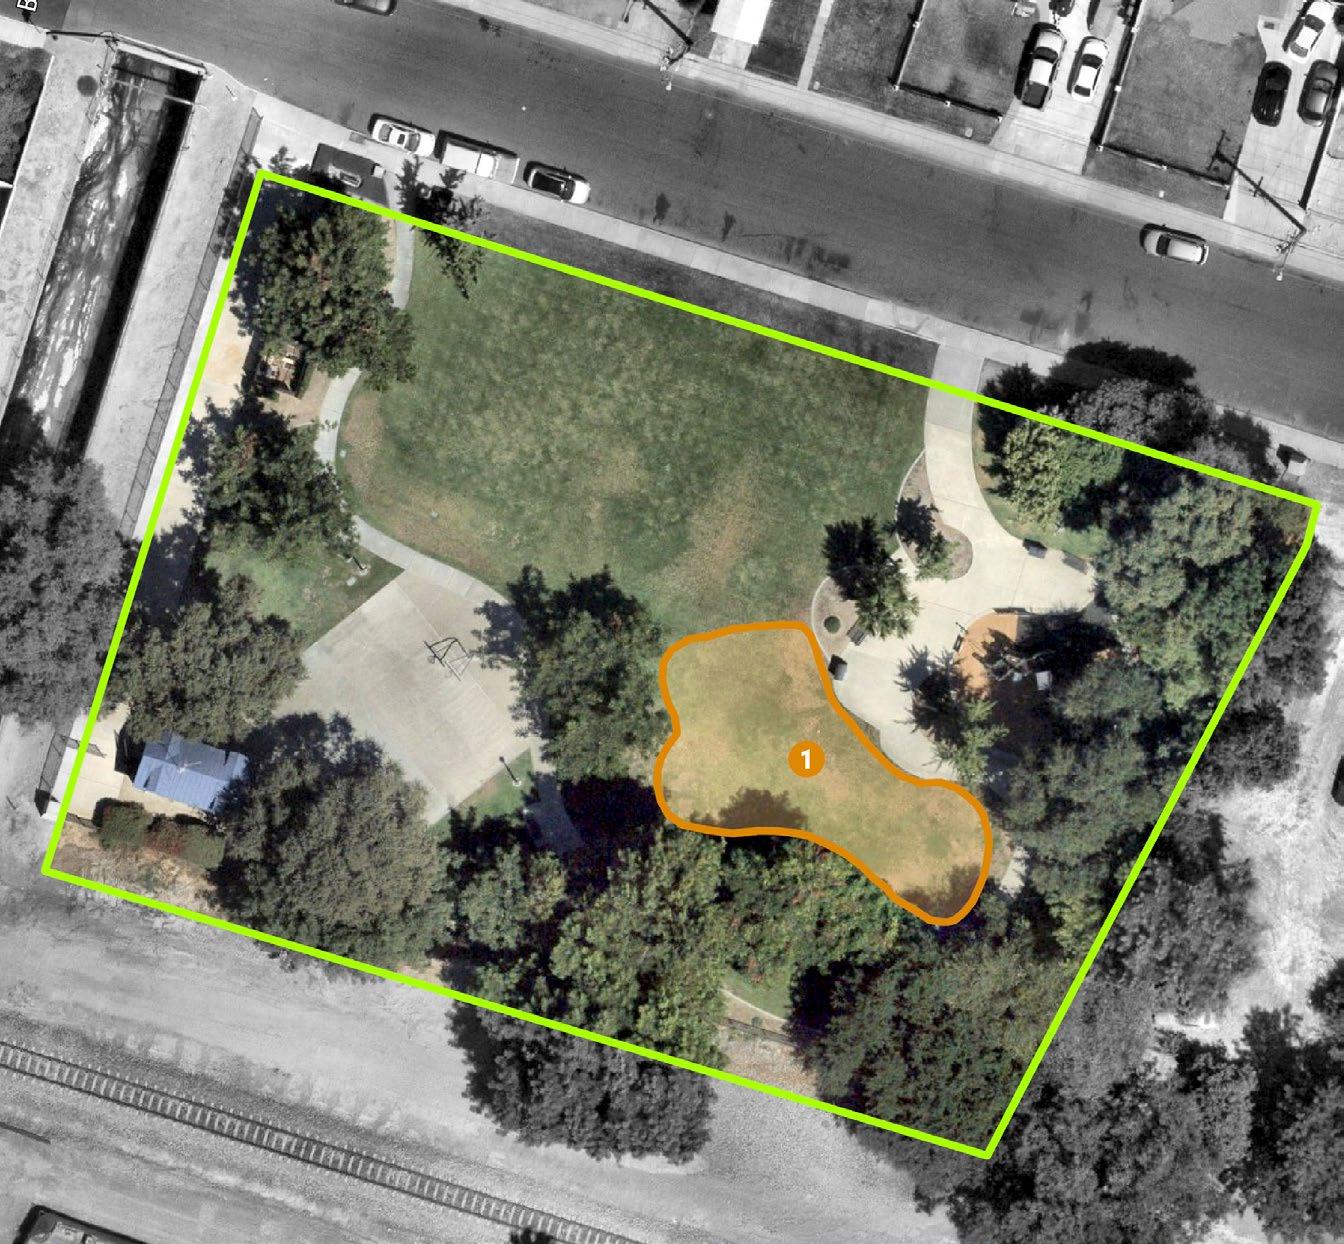
Recommended Recreation Amenities for Underutilized Park Space: TABLE 6-2: Lordsburg Park Recommended Amenities
Existing Conditions: Lordsburg Park is is 0.94 acre mini park located near Walnut Street and B Street. Existing amenities include a playground, half-basketball court, and benches.
Planned Improvements: N/A
Park Recommendations:
1. Upgrade the existing play structure with a modern design
2. Install play surfacing to improve ADA accessibility
3. Consider adding additional pedestrian-scale lighting
4. Install new recreation amenities that address deficits and community needs in underutlized park space
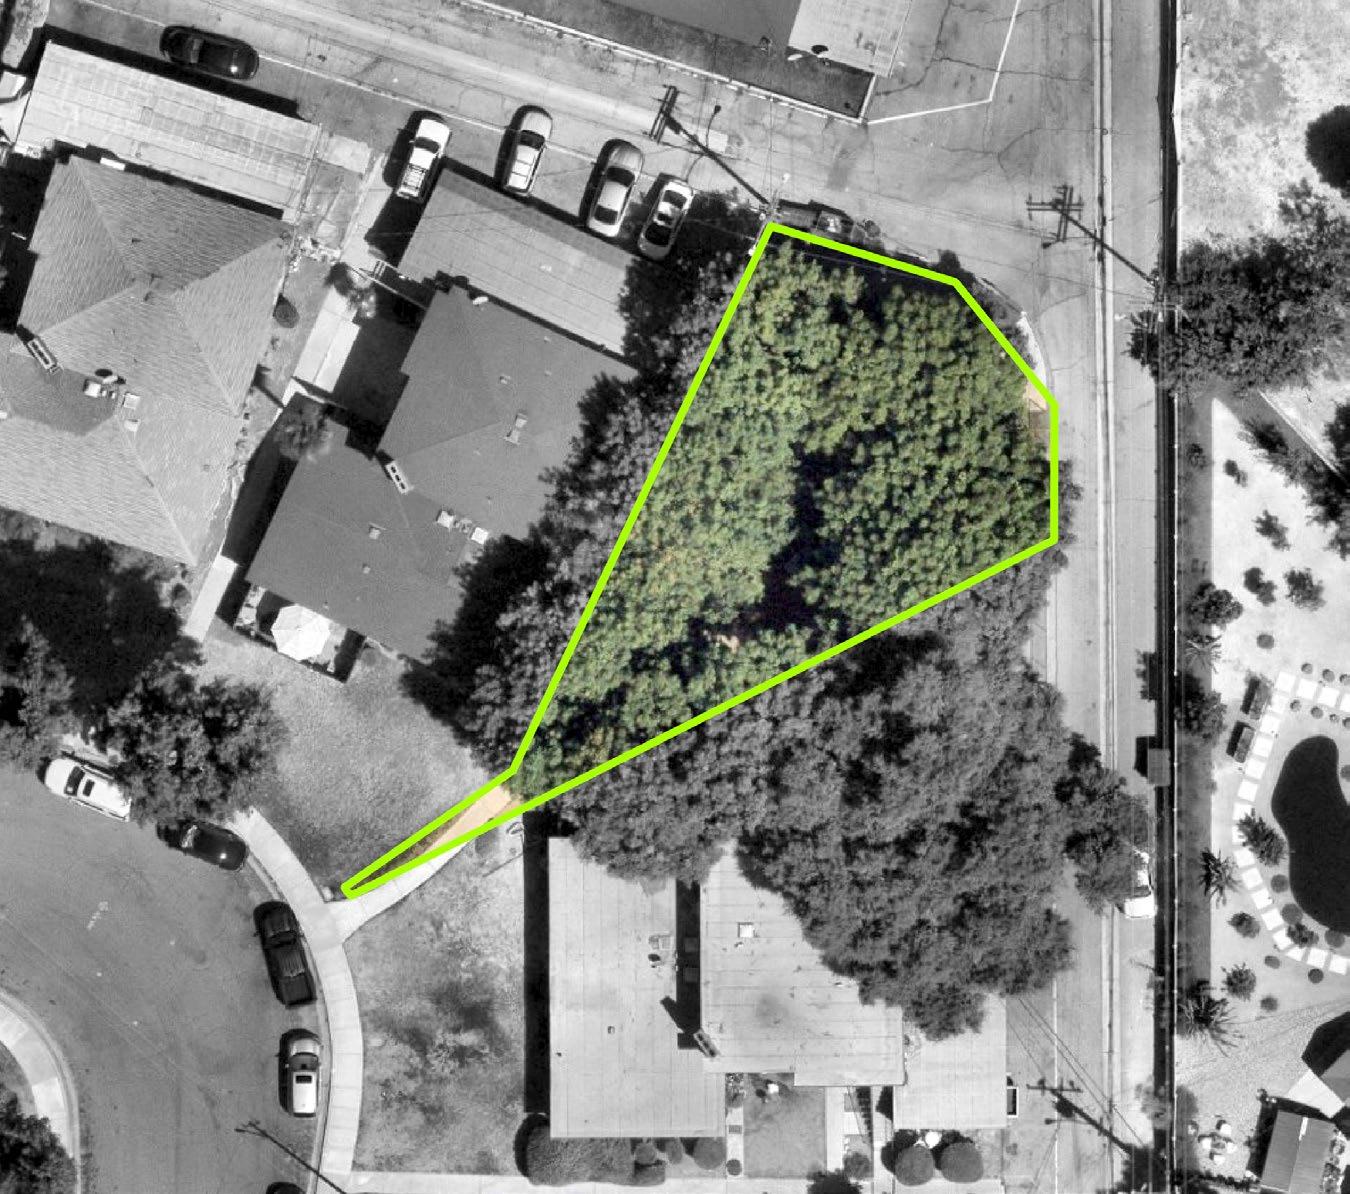
Recommended Recreation Amenities for Underutilized Park Space: N/A (no underutilized park space)
Existing Conditions: Price-Hayes Park is a 0.11 acres mini-park located near Price Drive and Columbia Drive. Existing amenities include a tot-lot and a bench.
Planned Improvements: N/A
Park Recommendations:
1. Replace aging play area with a new structure
2. Consider play surfacing to improve ADA accessibility
3. Replace existing bench
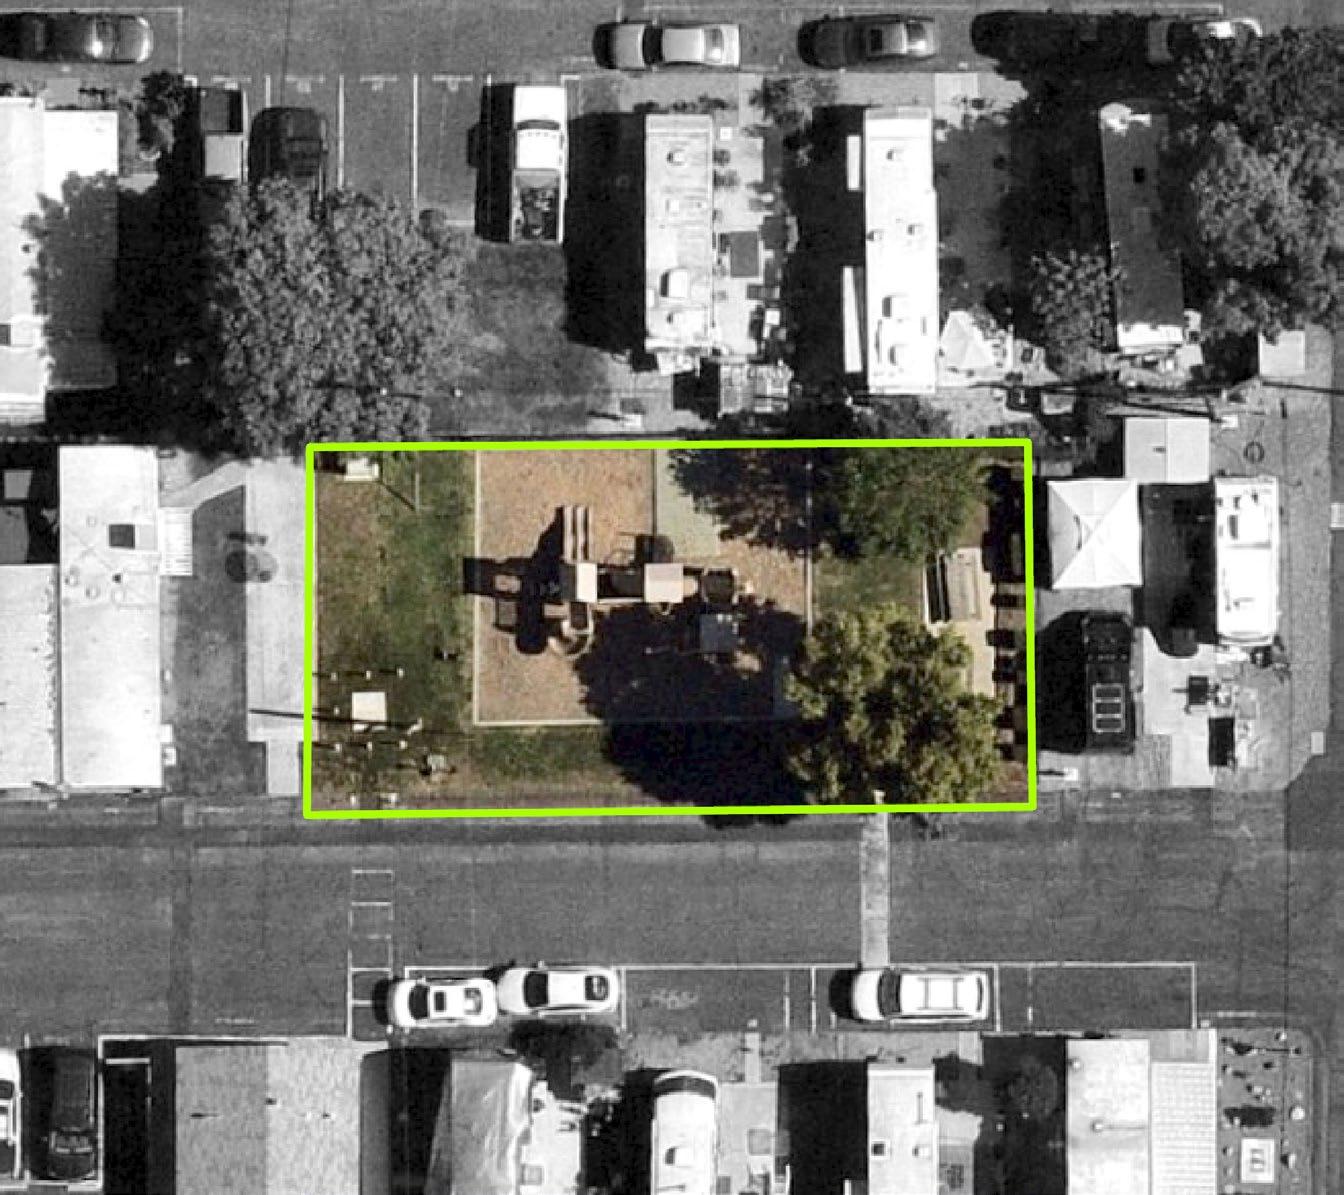
Existing Conditions: Valley Rancho Park is a 0.1 acre mini park located within the Valley Rancho Mobile Park near Arrow Highway and Fulton Road. Existing amenities include a playground and picnic tables.
Planned Improvements: N/A
Park Recommendations:
1. Replace aging play area with a new structure
2. Consider play surfacing to improve ADA accessibility
Recommended Recreation Amenities for Underutilized Park Space: N/A (no underutilized park space)
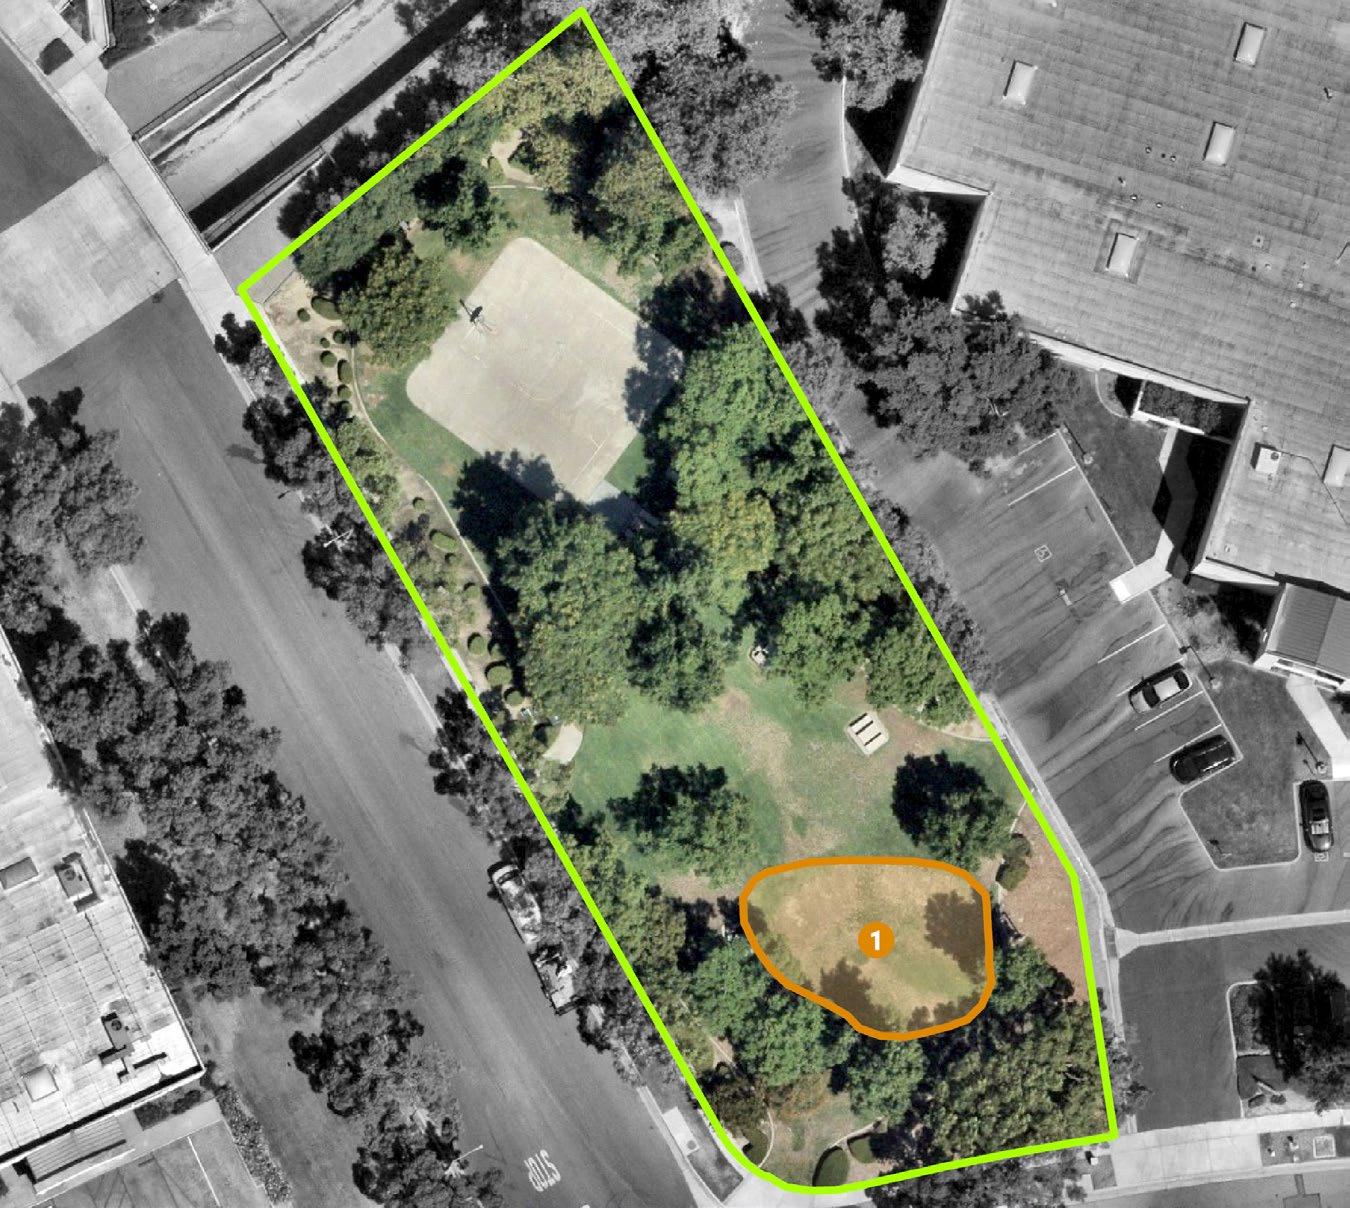
Park Boundary Infill areas
Recommended Recreation Amenities for Underutilized Park Space:
TABLE 6-3: Challenger Park Recommended Amenities
Picnic Areas (12+ people)
Games (Ping-pong, cornhole, etc.)
Existing Conditions: Challenger Park is a 0.6 acre mini-park located near Yeager Avenue and Wright Avenue. Existing amenities include picnic tables and half-court basketball.
Planned Improvements: N/A
Park Recommendations:
1. Replace picnic tables with ADA accessible picnic tables
2. Resurface basketball court and replace backboard
3. Consider installing a group picnic area in the underutilized park space
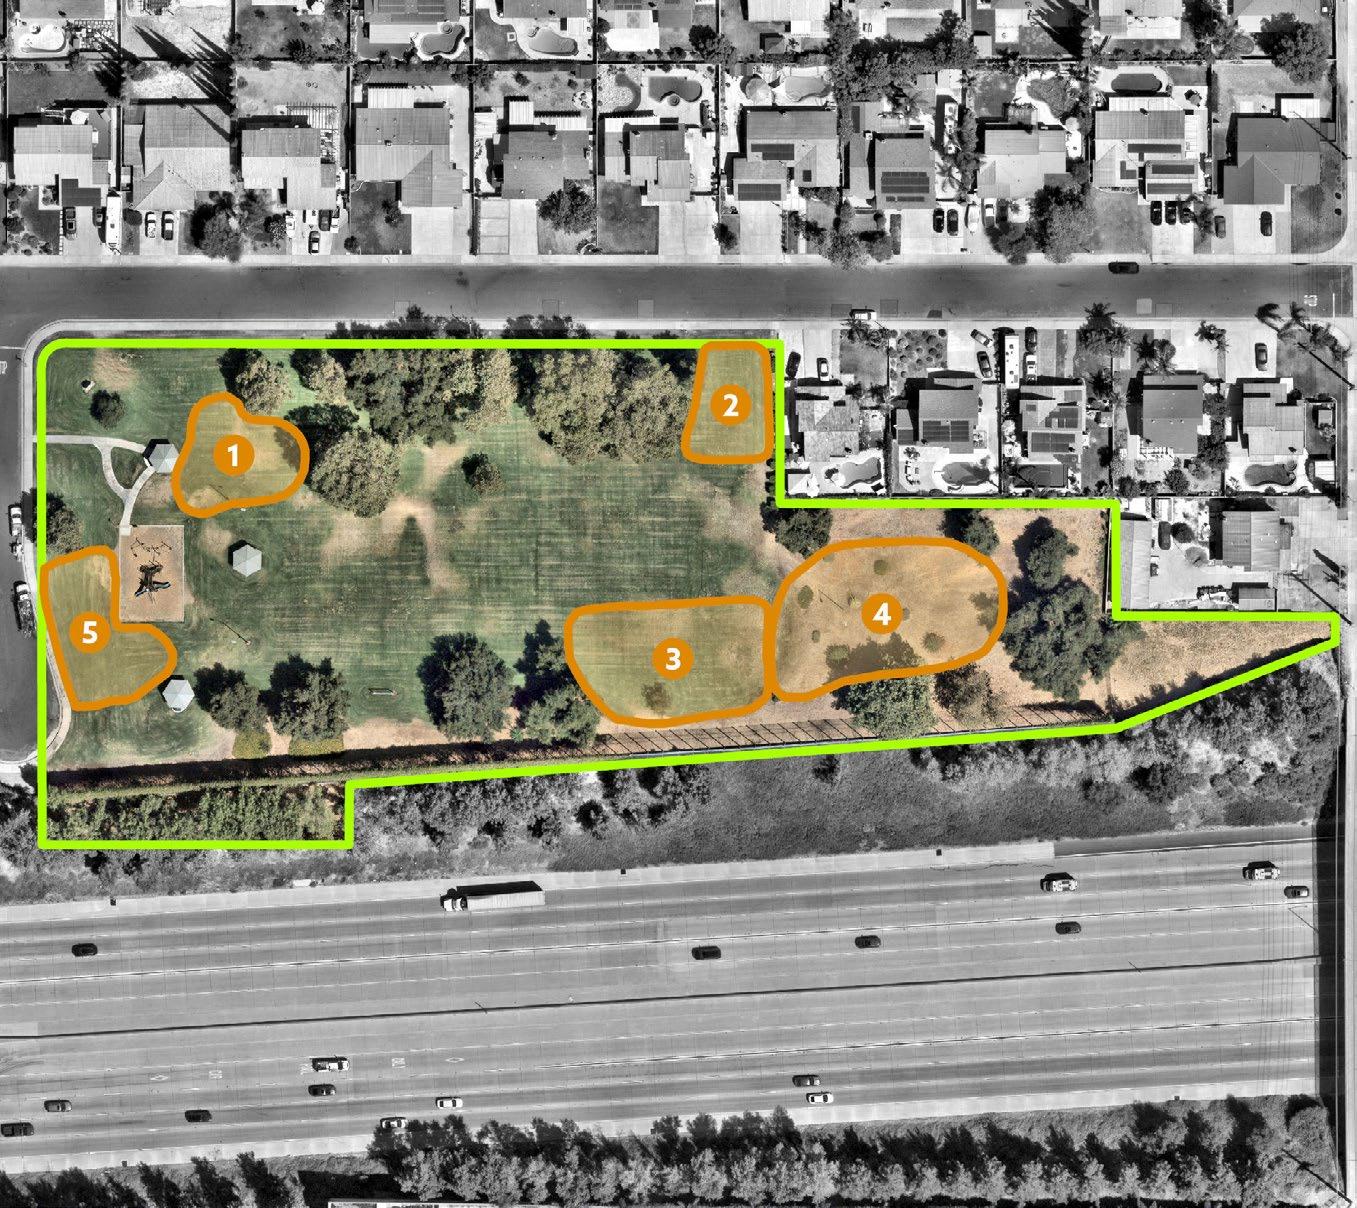
Park Boundary Infill areas
Recommended Recreation Amenities for Underutilized Park Space:
TABLE 6-4: Emerald Park Recommended Amenities
Existing Conditions: Emerald Park is a 3.88 acre neighborhood park located near Genesee Avenue and Emerald Avenue. Existing amenities include a playground and youth soccer field.
Planned Improvements: N/A
Park Recommendations:
1. Remove soccer goalposts to provide more flexibility with soccer recreation programming.
2. Install ADA walking paths to picnic areas
3. Install play surfacing to improve ADA accessibility
4. Consider adding a new dog park
5. Install new recreation amenities that address deficits and community needs in underutlized park space
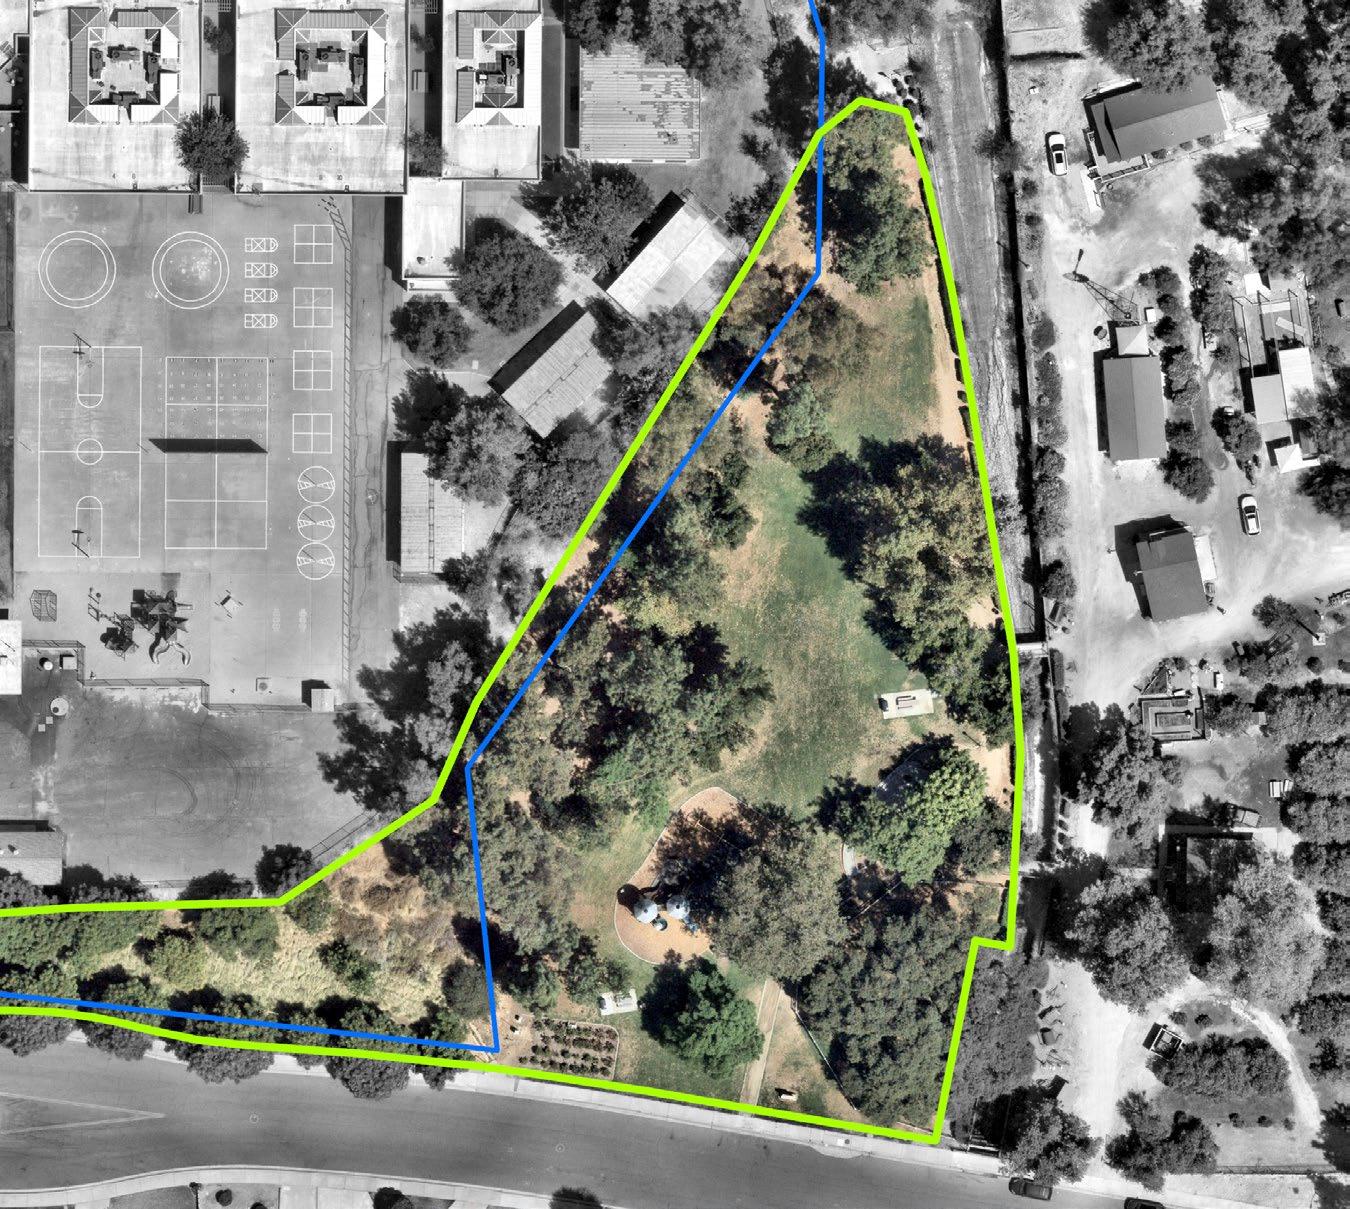
Recommended Recreation Amenities for Underutilized Park Space: N/A (no underutilized park space)
Existing Conditions: Heritage Park is a 1.81 acre neighborhood park located just south of Oak Mesa Elementary School near Wheeler Avenue and Via de Mansion. Amenities include a playground, picnic tables, gazebo, small stage, and rose garden. Adjacent to Heritage Park, is the historic Weber House and Sloan Barn, which are open to the public during select times for community events.
Planned Improvements: The City plans to renovate the gazebo to provide structural improvements.
Park Recommendations:
1. Replace aging play area with a new structure
2. Install play surfacing to improve ADA accessibility
3. Enhance connection to Oak Mesa Park
4. Evaluate fencing along school perimeter and consider replacing where needed
5. Consider paving walking paths to improve ADA access
6. Update Bridge and access points between foundation and park
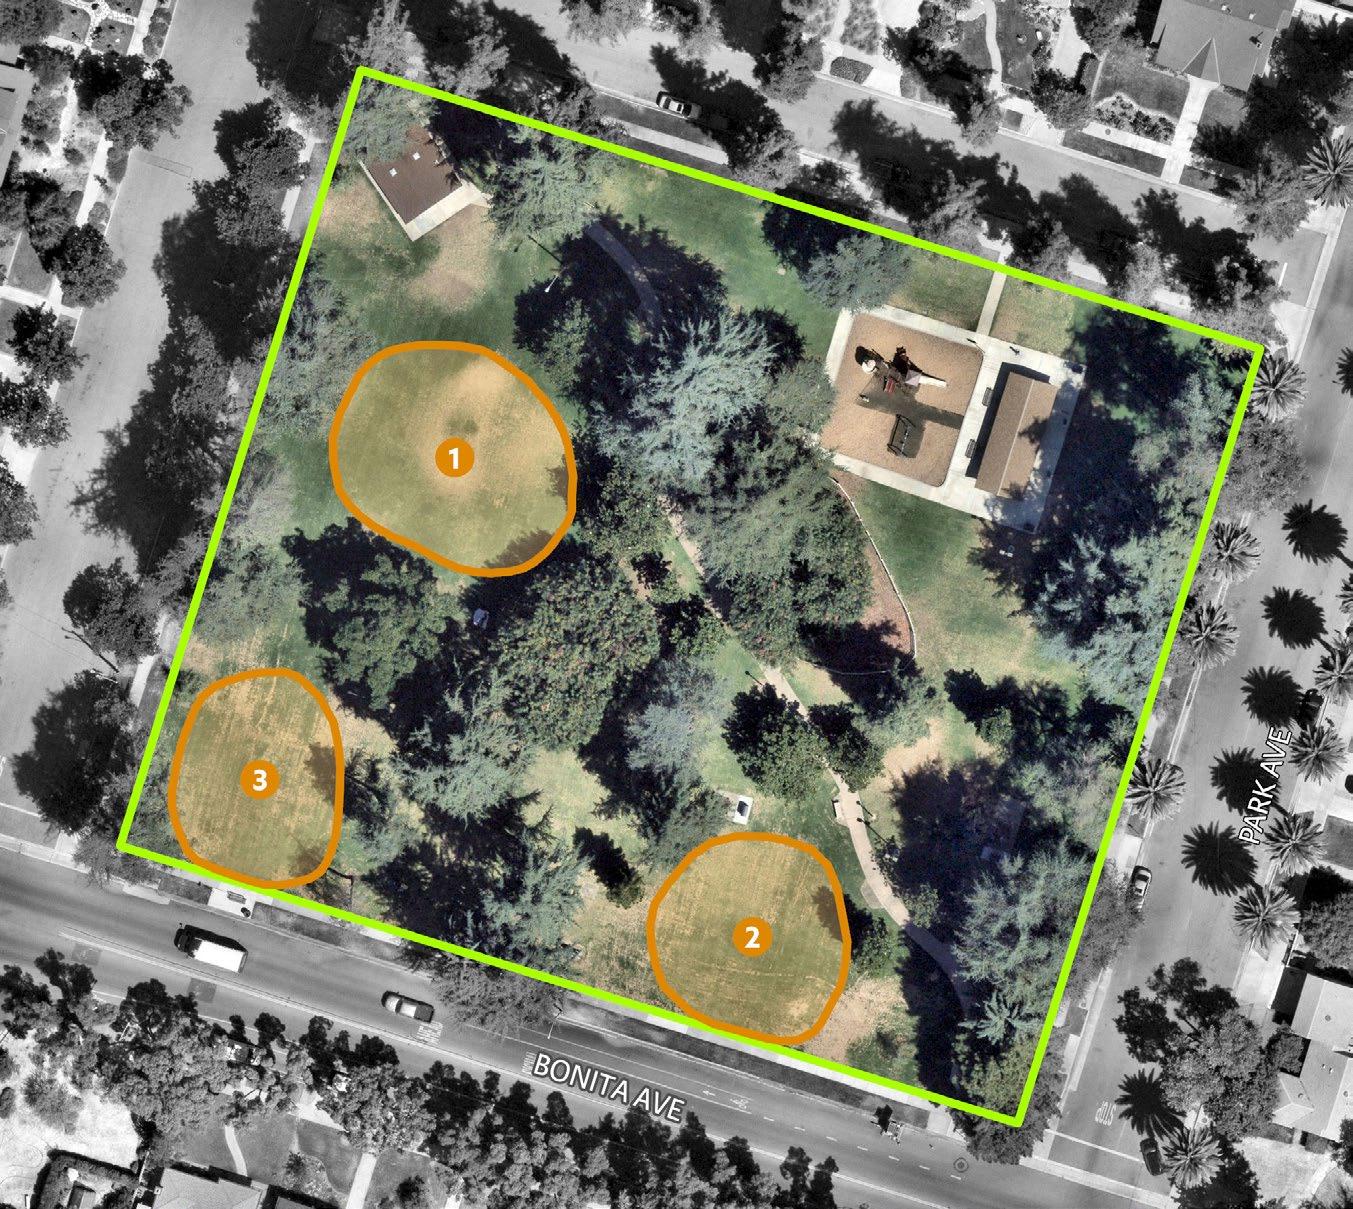
Recommended Recreation Amenities for Underutilized Park Space:
TABLE 6-5: Kuns Park Recommended Amenities
Existing Conditions: Kuns Park is a 2.36 acre neighborhood park located near Magnolia Avenue and 5th Street. Existing amenities include a playground, picnic shelter, barbecues, and restrooms. Kuns park is home to some of the oldest and most mature trees in La Verne.
Planned Improvements: The existing playground is slated for renovation in 2026.
Park Recommendations:
1. Install play surfacing to improve ADA accessibility
2. Consider adding pedestrian-scale lighting around existing and new walkways, play area, and any new amenities
3. Install fitness equipment
4. Install new recreation amenities that address deficits and community needs in underutlized park space
5. Renovate existing restroom
Park Boundary Infill areas
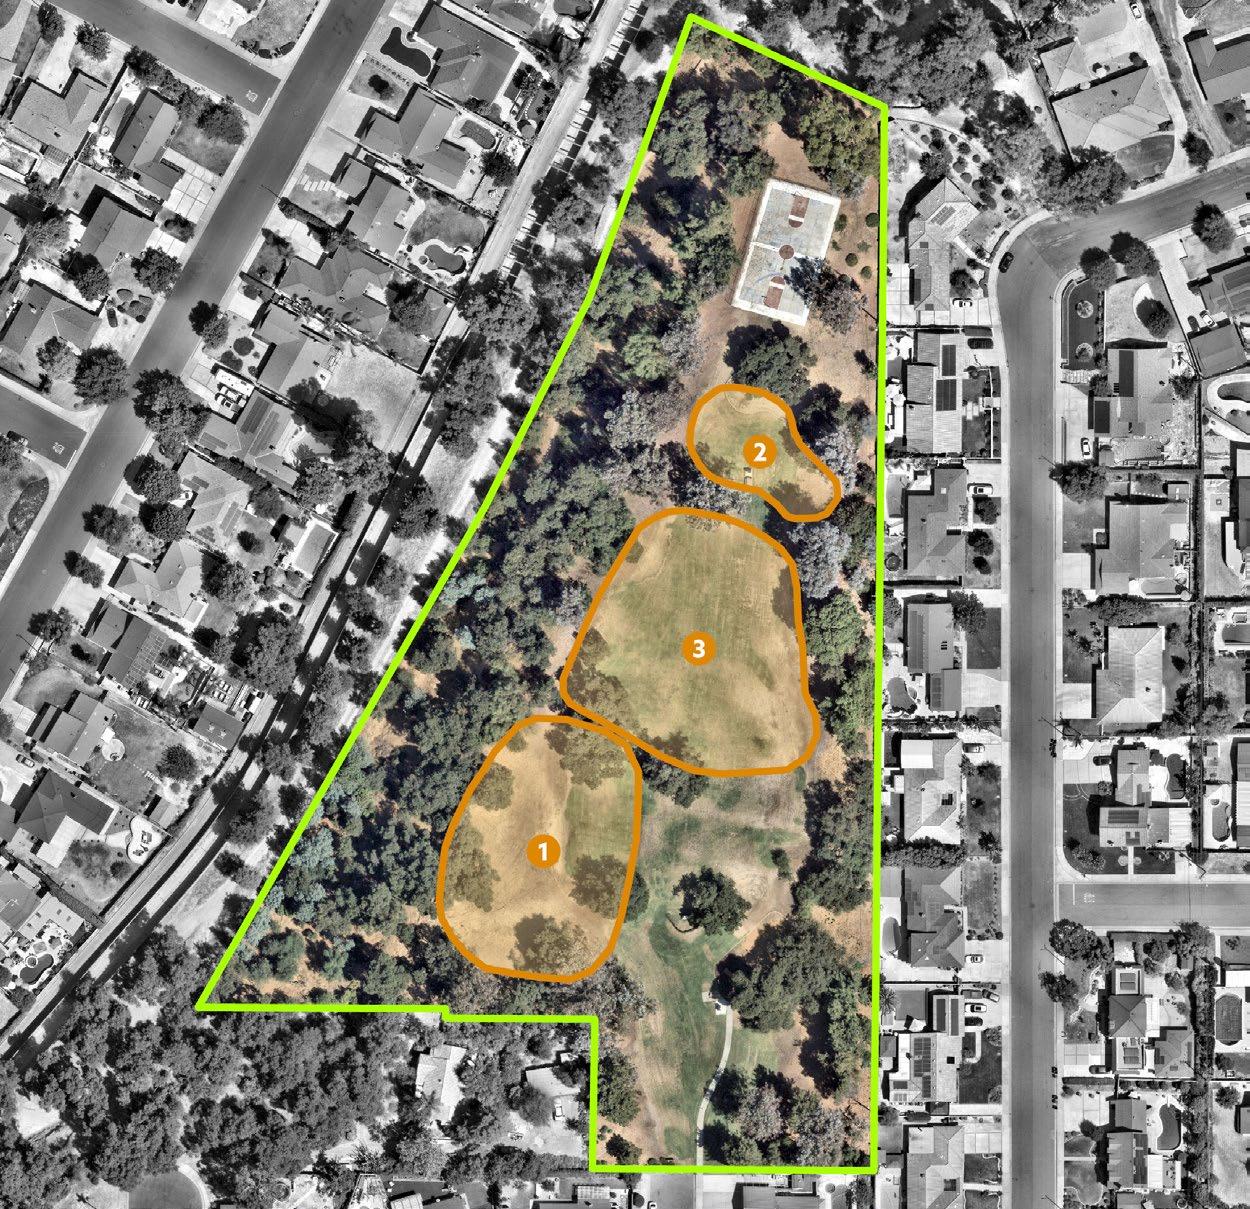
Recommended Recreation Amenities for Underutilized Park Space:
TABLE 6-6: Los Encinos Park Recommended Amenities
Group picnic Areas (12+ people)
Park Games (Ping-pong, cornhole, etc.)
Playground / Upgraded Playground
Replace existing Adventure Playground
1, 2, 3 Outdoor Exercise Area/Fitness Trail 500-2,000 2, 3 Walking Loop varies* Throughout Dog Park / Dog Run
Existing Conditions: Los Encinos Park is a 5.94 acre neighborhood park located in the northern area of the city near Chamber Avenue and Cabot Lane. Existing amenities include a playground, basketball court, picnic tables, and barbecues.
Planned Improvements: N/A
Park Recommendations:
1. Construct ADA walking loop to each park amenity and surrounding access points
2. Install pedestrian-scale lighting throughout park
3. Update basketball court by adding a new surface, hoops, fencing, and seating
4. Consider paving northeast park entrance to improve ADA accessibility
5. Update picnic areas with new tables, trash receptacles, and ADA access
6. Replace aging play area with a new structure
7. Install play surfacing to improve ADA accessibility
8. Consider adding a new dog park
9. Install new recreation amenities that address deficits and community needs in underutlized park space
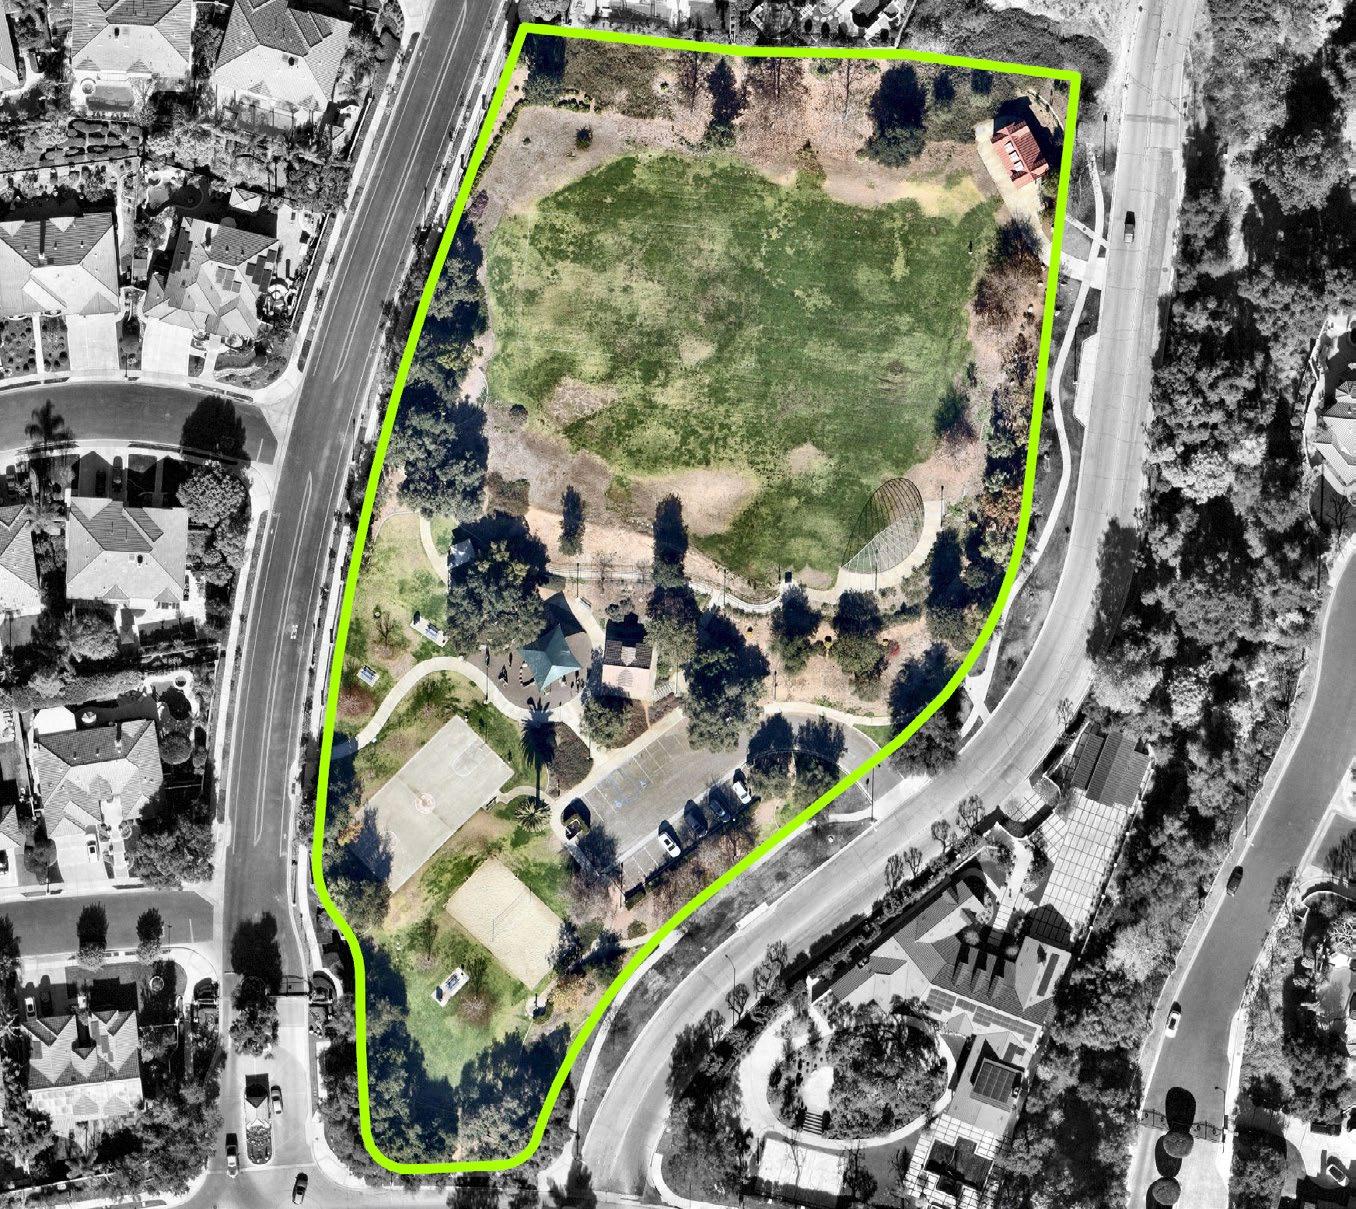
Recommended Recreation Amenities for Underutilized Park Space: N/A (no underutilized park space)
Existing Conditions: Lowell Brandt Park is a 4.61 acre neighborhood park located in the northern area of the City near Golden Hills Road and Stephens Ranch Road. Existing amenities include a playground, basketball court, volleyball court, picnic tables, restrooms, a soccer field, and baseball backstop.
Planned Improvements:
1. New basketball court lighting in 2026
Park Recommendations:
1. Resurface basketball court
2. Add field lighting to north athletic field
3. Renovate restroom
4. Renovate north athletic field by improving irrigation and grass
5. Add spectator seating to north athletic field
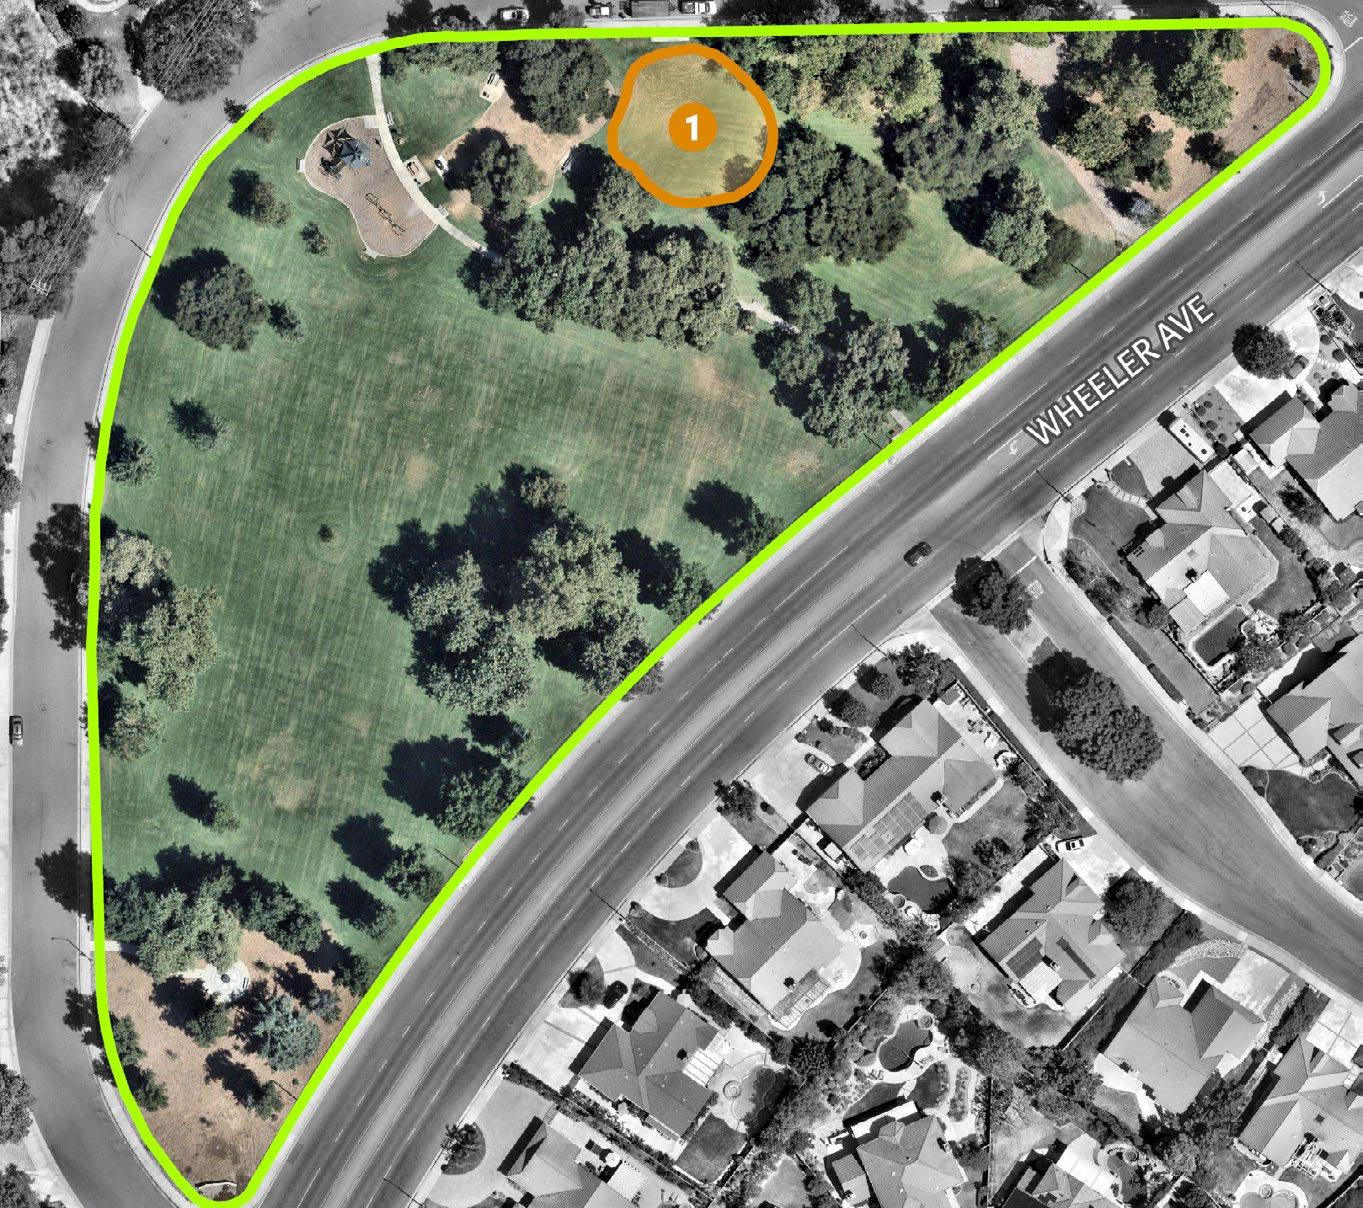
Park Boundary Infill areas
Recommended Recreation Amenities for Underutilized Park Space:
TABLE 6-7: Mills Park Recommended Amenities
Games (Ping-pong, cornhole, etc.)
Exercise Area/Fitness Trail
Existing Conditions: Mills Park is a 7 acre neighborhood park located in the northern area of the City near Wheeler Avenue and Old Wheeler Road. Existing conditions include a playground and picnic tables.
Planned Improvements: N/A
Park Recommendations:
1. Install fitness equipment along walking loop
2. Replace aging picnic tables
3. Replace fencing along Wheeler Avenue
4. Consider adding play surfacing to improve ADA accessibility
5. Install new recreation amenities that address deficits and community needs in underutlized park space
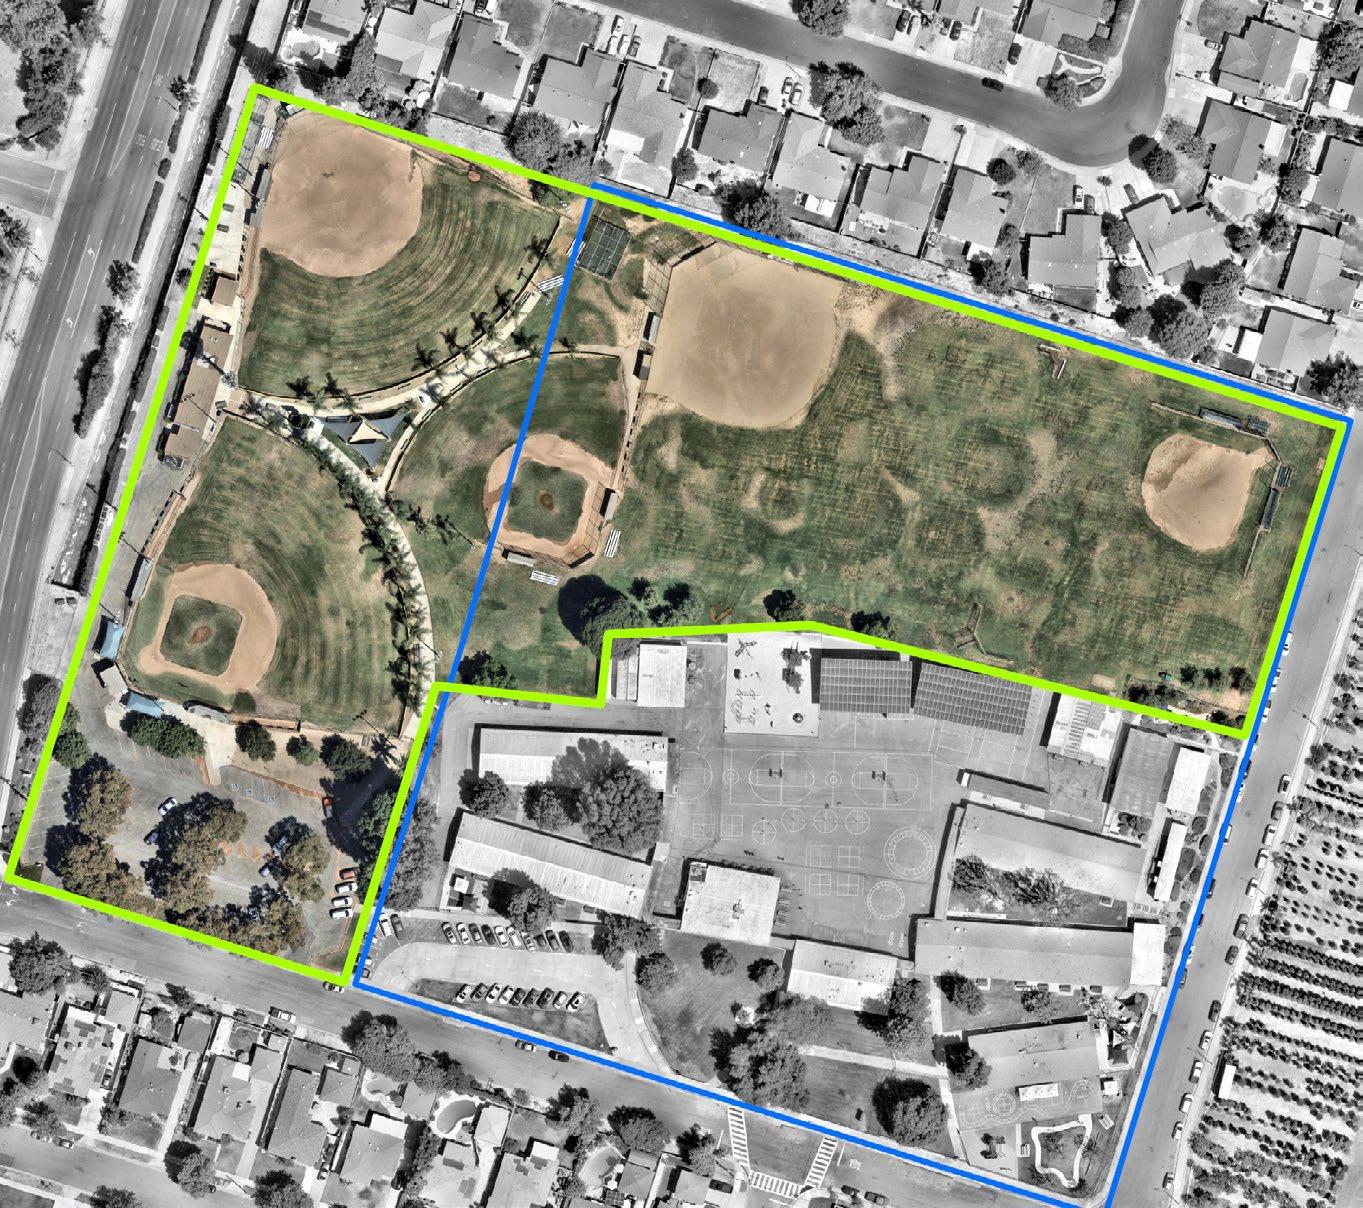
Recommended Recreation Amenities for Underutilized Park Space: N/A (no underutilized park space)
Existing Conditions: Pelota Park is a 8.1 acre community park located in the southern area of the city near Wheeler Avenue and Holly Oak Street. The park is a joint-use facility shared by the City and the local school district, situated adjacent to Grace Miller Elementary School. Existing amenities include baseball and softball fields, a shaded picnic area, concession stand, and restrooms. The roof was replaced at this park in 2025.
Planned Improvements: N/A
Park Recommendations:
1. Renovate restroom
2. Install updated sports field lighting
3. Replace aging light poles
4. Consider adding new backstops
5. Replace all picnic tables with new ADA-accessible tables
6. Install shade structures to dugouts on City property
7. Work with school district to install shade structures to dugouts on school property
8. Work with school district to add new benches/spectator seating
9. Work with school district to slurry and re-strip parking lot
10. Replace existing storage buildings
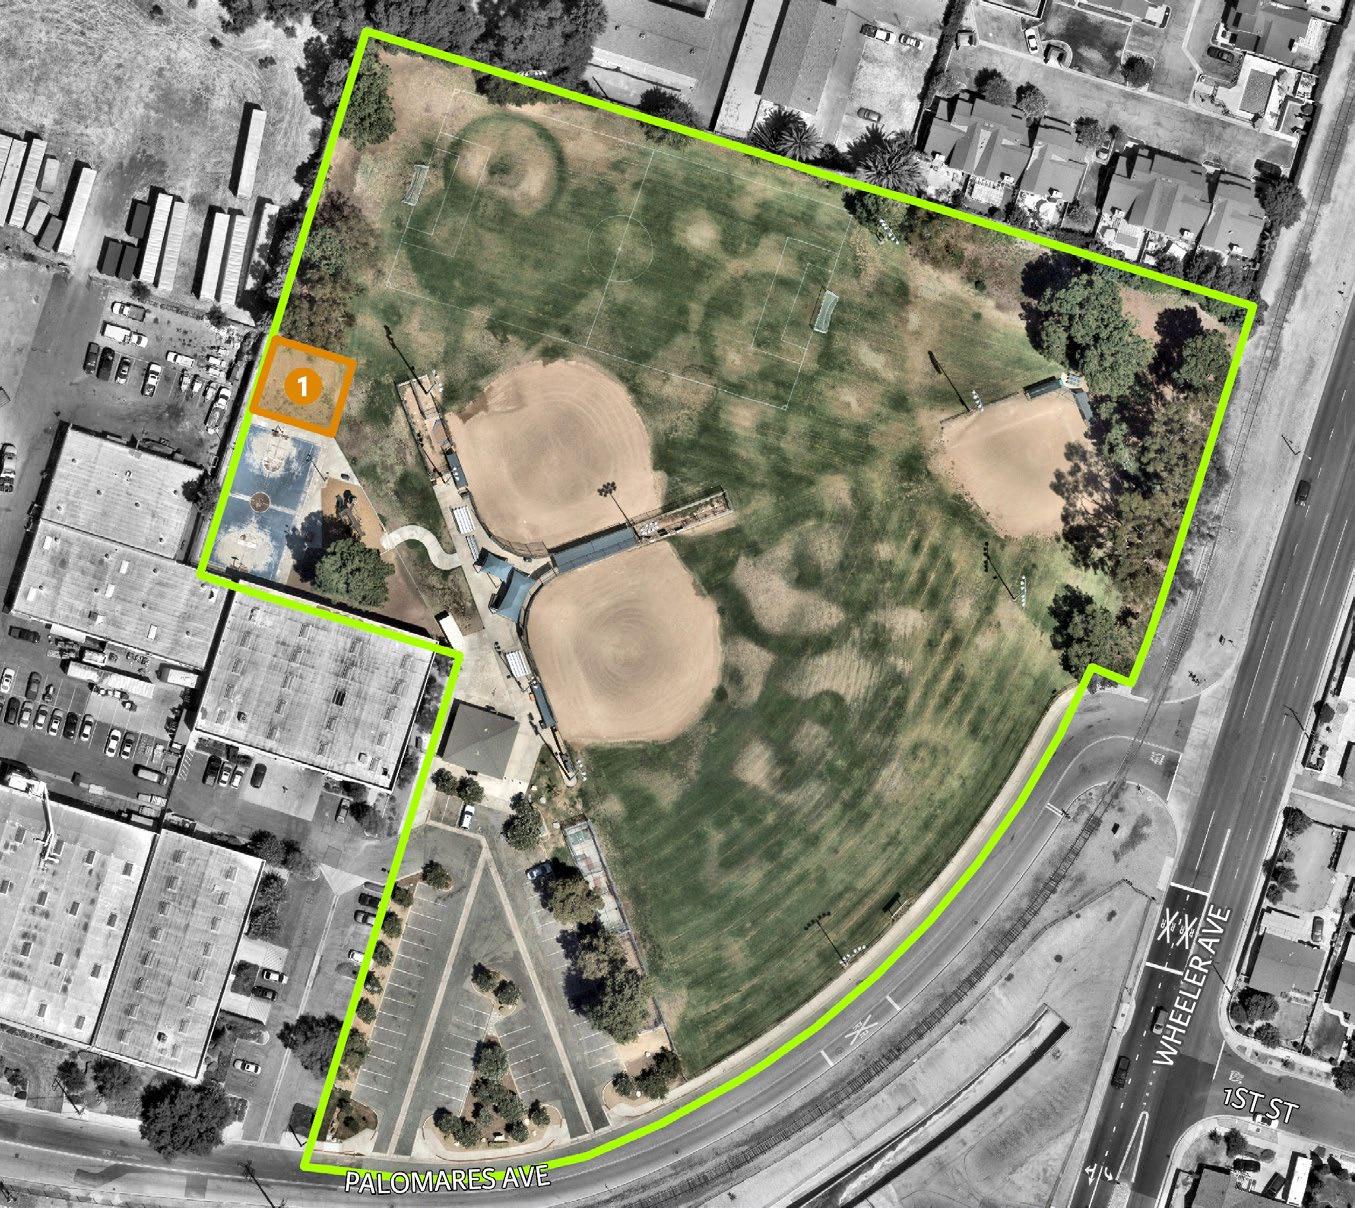
Recreation Amenities for Underutilized Park Space:
Existing Conditions: Wheeler Avenue
Park is a 6 acre neighborhood park located in the southern area of the city near Palomares Avenue and Wheeler Avenue. Existing amenities include a playground, softball fields, a basketball court, picnic tables, and restrooms.
Planned Improvements: N/A
Park Recommendations:
1. Renovate backstops, field lighting, dugouts, and fencing
2. Renovate restroom
3. Consider adding picnic areas
4. Resurface and renovate basketball court
5. Replace all picnic tables with new ADA-accessible tables and add new ones, where applicable.
6. Install play surfacing to improve ADA accessibility
7. Install new recreation amenities that address deficits and community needs in underutlized park space
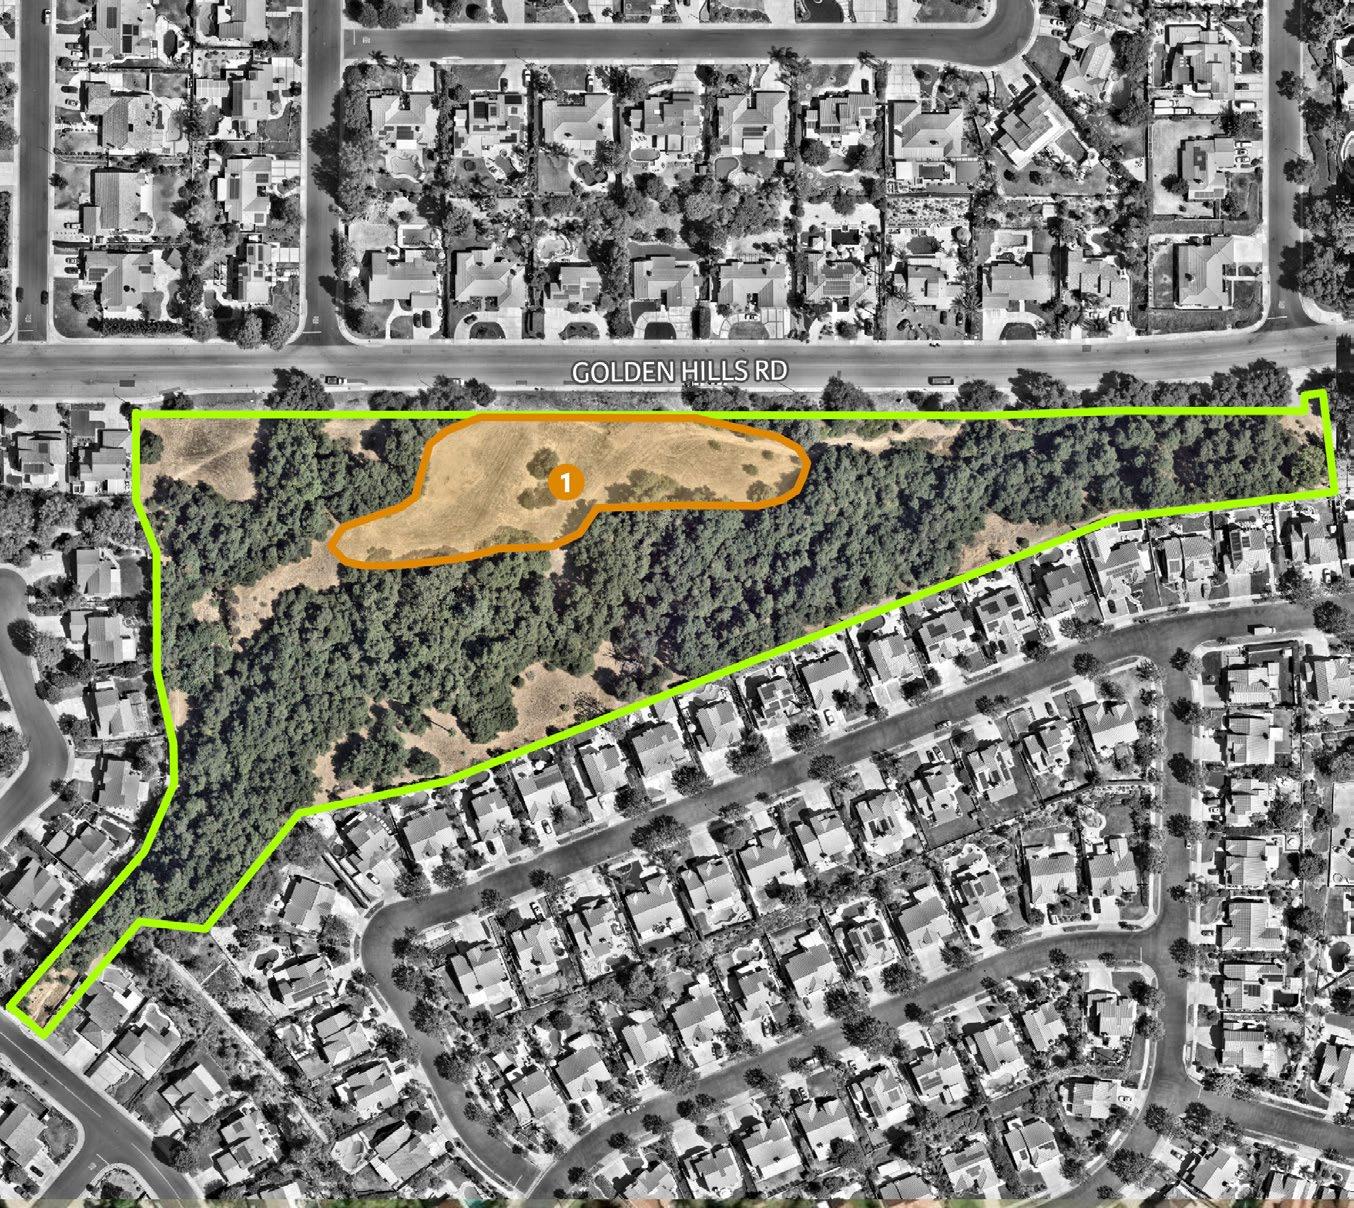
Park Boundary Infill areas
Recommended Recreation Amenities for Underutilized Park Space:
TABLE 6-9: Golden Hills Wilderness Park Recommended Amenities
Existing Conditions: Golden Hills Wilderness Park is a 9.3 acre regional park located in the northern area of the city near Golden Hills Road and Roble Lane. Existing amenities include picnic tables and nature trails. This park contains many mature trees, which provides habitat to local flora and fauna, the city aims to minimize future impacts, where possible.
Planned Improvements: N/A
Park Recommendations:
1. Replace stairs to improve park access
2. Address erosion issues
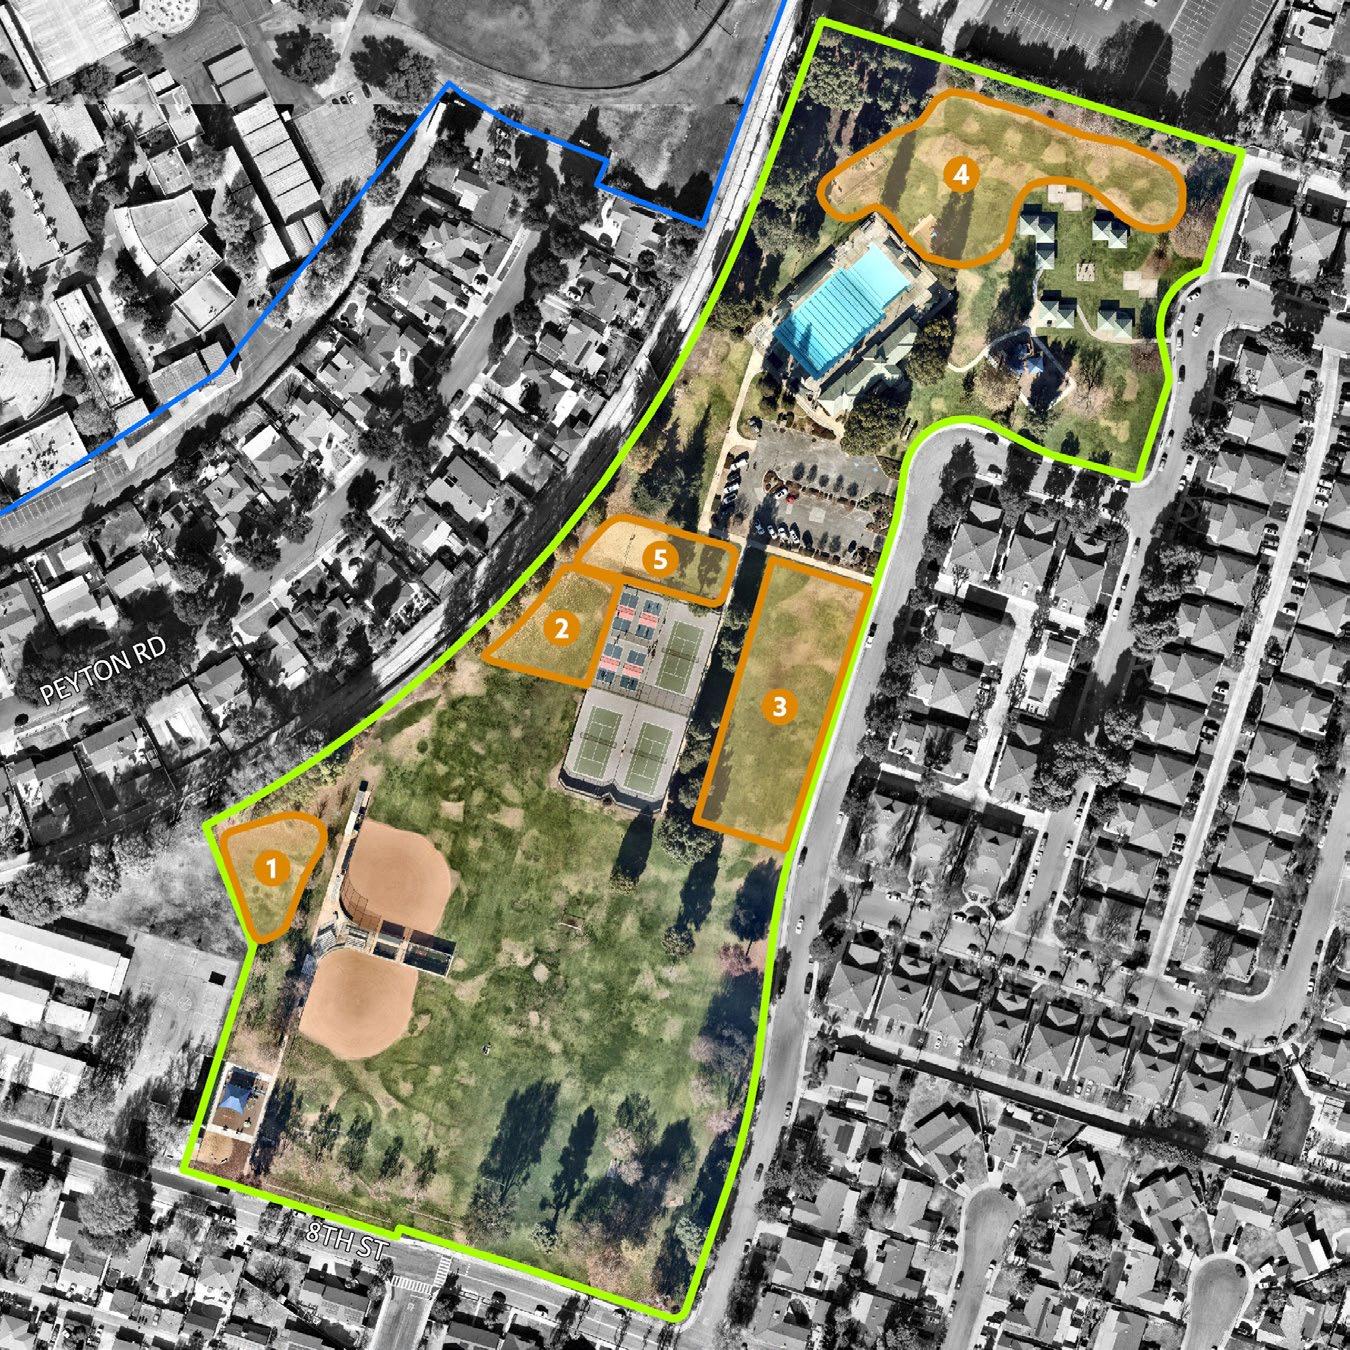
Recommended Recreation Amenities for Underutilized Park Space: TABLE 6-10: Las Flores Park Recommended Amenities
Existing Conditions: Las Flores Park is a 16.3 acre community park located in the southern area of the city near Boiling Avenue and 8th Street. Existing amenities include a swimming pool, 2 playgrounds, a tot-lot, shaded picnic areas with barbecues, softball fields, tennis courts, pickleball courts, restrooms, volleyball court, horseshoe, and soccer fields.
Planned Improvements: N/A
Park Recommendations:
1. Renovate/redesign picnic area
2. Install concrete walking loop
3. Install fitness equipment along walking loop
4. Replace all picnic tables with new ADA-accessible tables and add new picnic tables, where applicable
5. Renovate existing park restroom attached to the Aquatic Center
6. Install new recreation amenities that address deficits and community needs in underutlized park space
Aquatic Center Recommendations:
1. Work with University and School District to renovate Aquatic Center restrooms
2. Work with University and School District to replace Aquatic Center fencing
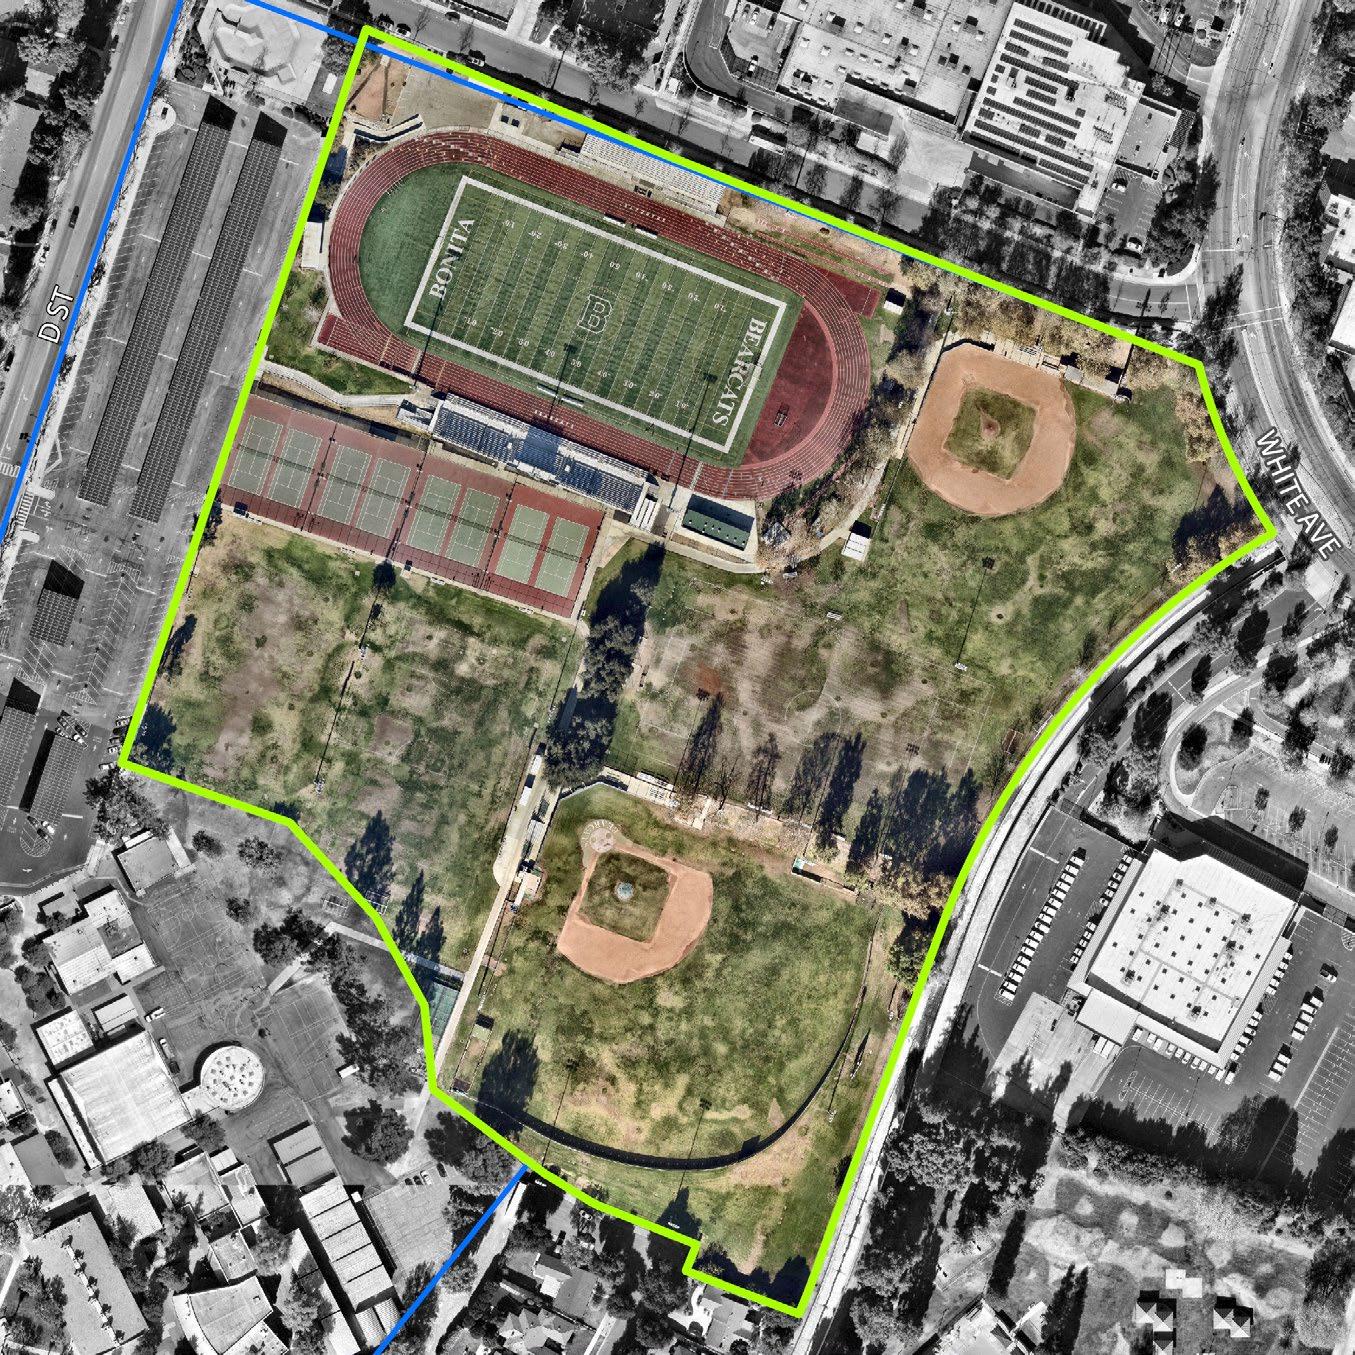
Existing Conditions: La Verne Sports Park is a 19.6 acre community park located central to the city near D Street and Durward Way. Existing amenities include a football stadium, a running track, tennis courts, baseball fields, soccer fields, and restrooms. This park is a joint-use facility shared with the school district and is located on the campus of Bonita High School.
Planned Improvements: N/A
Park Recommendations:
1. Upgrade tennis court, soccer, and baseball/softball field lighting
2. Work with school district to upgrade stadium lighting
3. Work with school district to replace site furnishings in fair and poor condition
4. Work with school district to complete annual field leveling
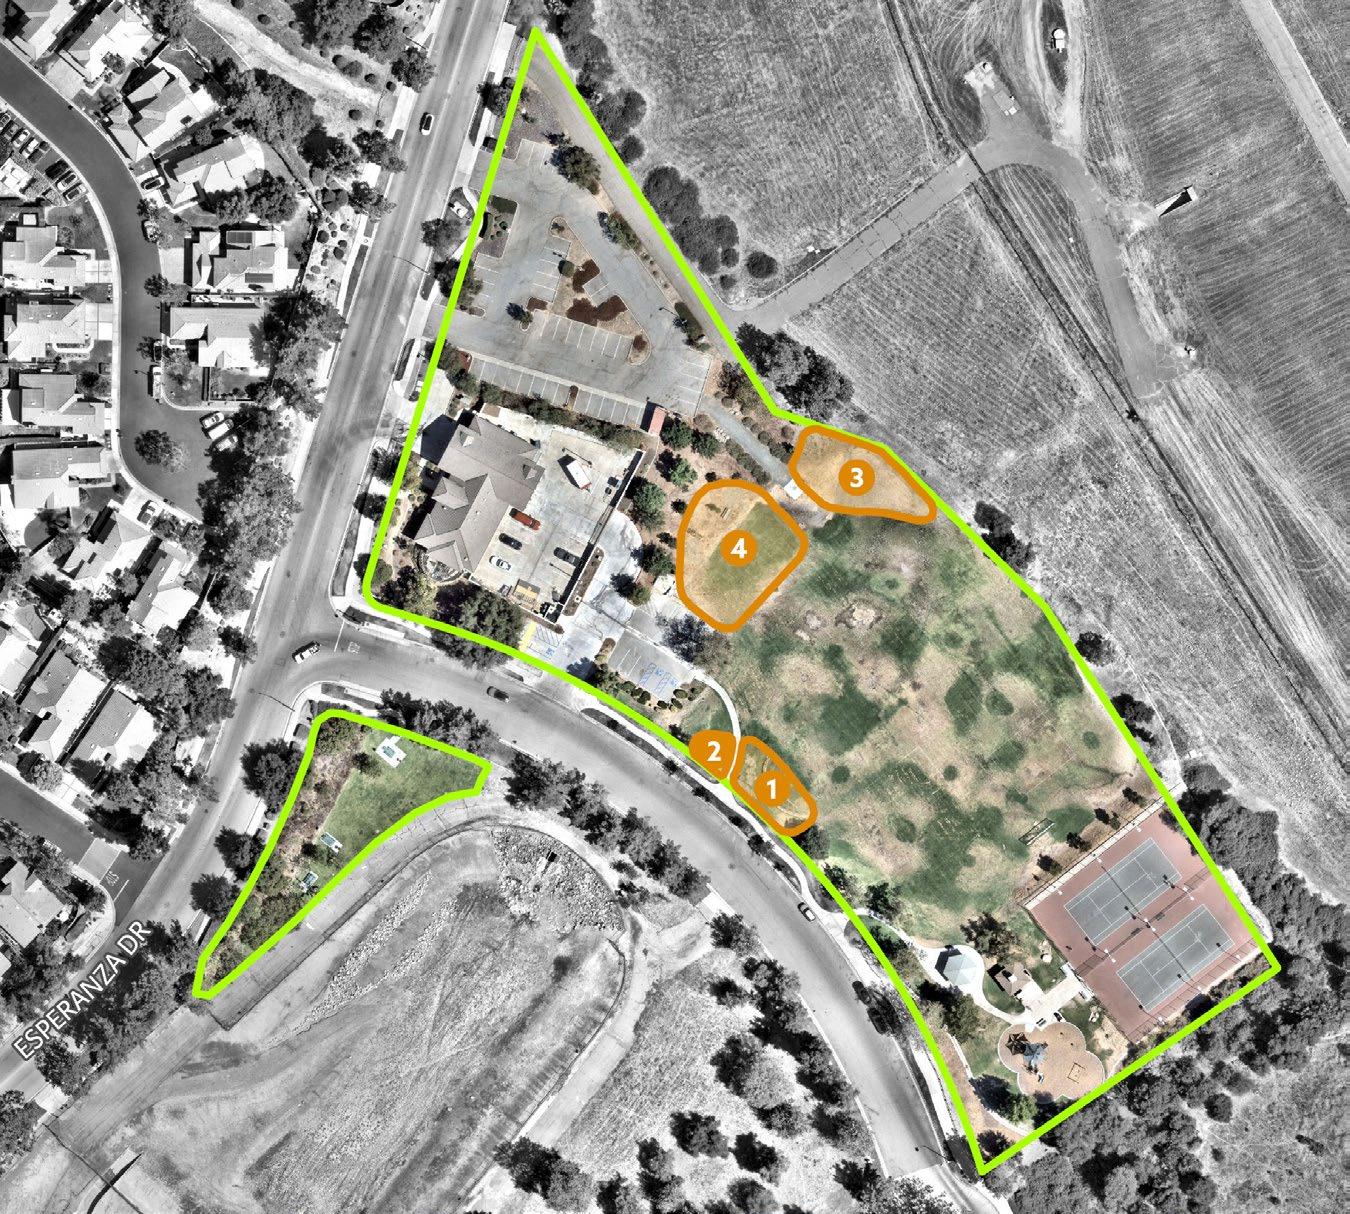
Recreation Amenities for Underutilized Park Space:
Existing Conditions: Live Oak Park is a 4.3 acre neighborhood park located in the northern area of the city near Esperanza Drive and Shemiran Street. The park operates under a joint-use agreement with the Metropolitan Water District and is located adjacent to the Live Oak Reservoir. Existing amenities include a soccer field, baseball backstop, tennis courts, a playground, picnic shelter, picnic tables, and a restroom.
Planned Improvements: N/A
Park Recommendations:
1. Install rubber play surfacing to improve ADA accessibility
2. Renovate existing restroom
3. Replace fencing and lighting at tennis courts
4. Remove permanent goalposts and backstop to provide more flexibility with soccer programming
5. Install concrete walking loop
6. Install fitness equipment along walking loop
7. Create entrance and path from north parking lot to the park
8. Coordinate with Metropolitan Water District of Southern California to extend park lease agreement
9. Install new recreation amenities that address deficits and community needs in underutlized park space
10. Add a new baseball field
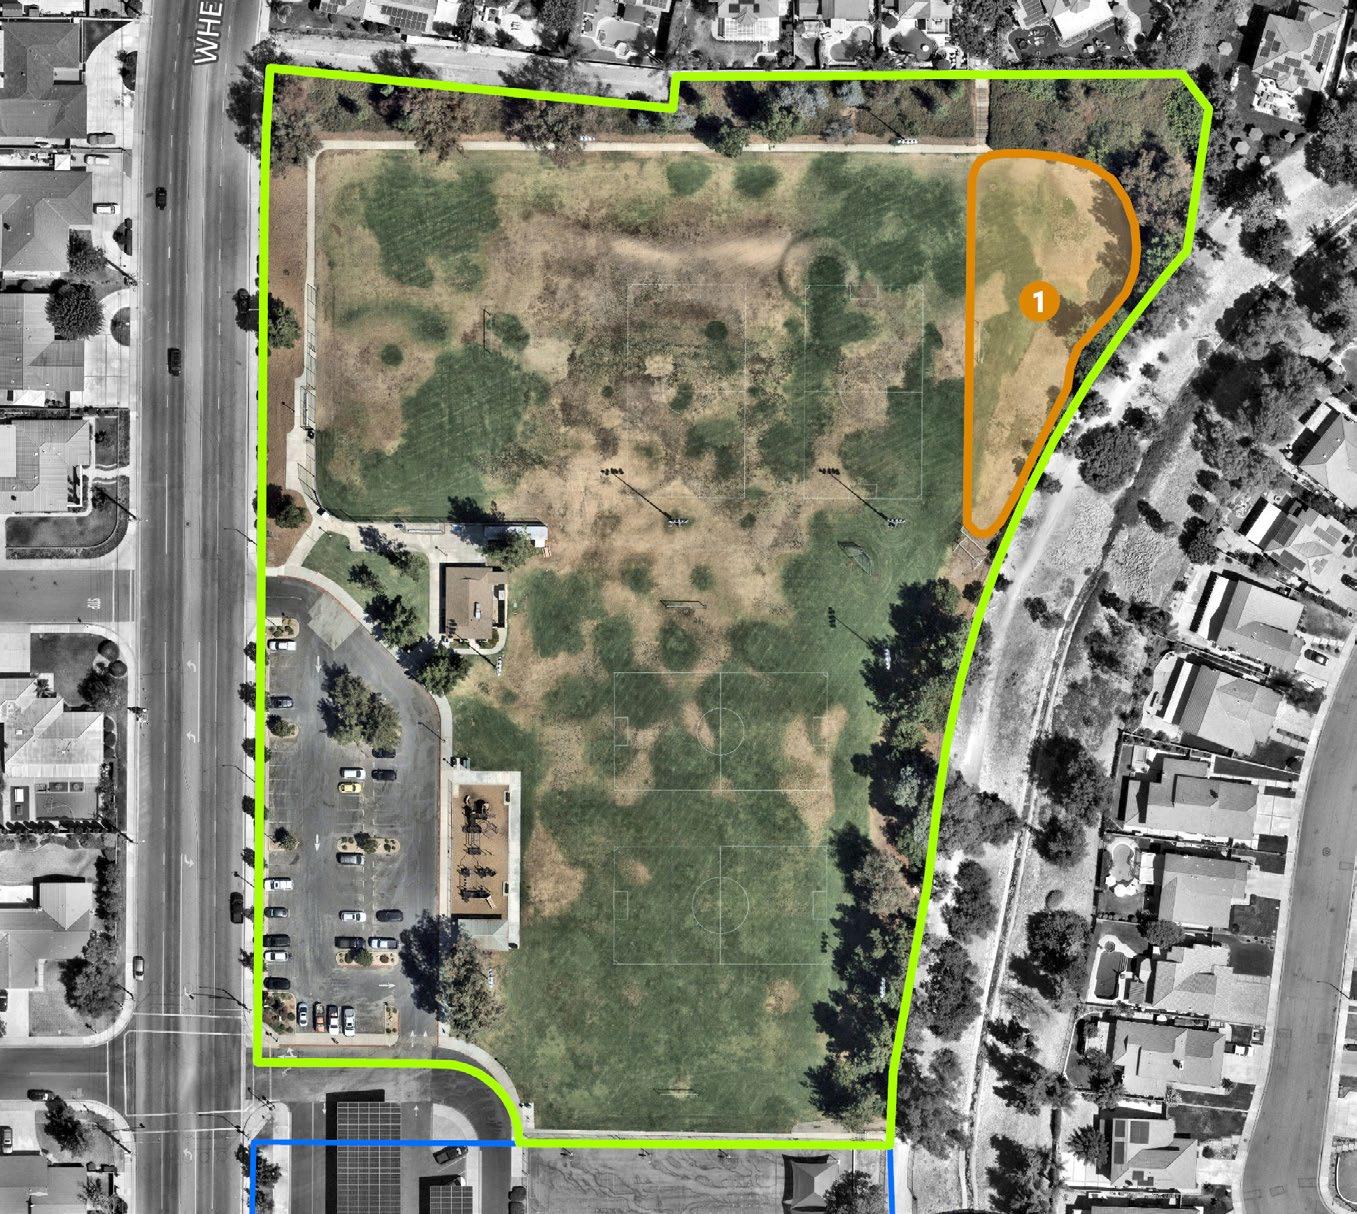
Existing Conditions: Oak Mesa Park is a 7.3 acre neighborhood park located on Wheeler Avenue and Oak Mesa Drive. It is a joint-use park between the City and the local school district. It’s existing amenities include a playground, which was renovated in 2025, a picnic shelter, soccer fields, a baseball backstop, restrooms, and a small community room used for City programs. The City also has use of the basketball courts located on the school property.
Planned Improvements: N/A
Park Recommendations:
1. Update all sports facilities (lights, turf, remove permanent goalposts, etc.)
2. Renovate existing restroom
3. Consider renovation of the Indoor facility to accommodate additional programs
4. Work with school district to slurry and re-strip parking lot
5. Work with school district to install new recreation amenities that address deficits and community needs in underutlized park space
6. Work with school district to install concrete bollards to prevent vehicle access on fields
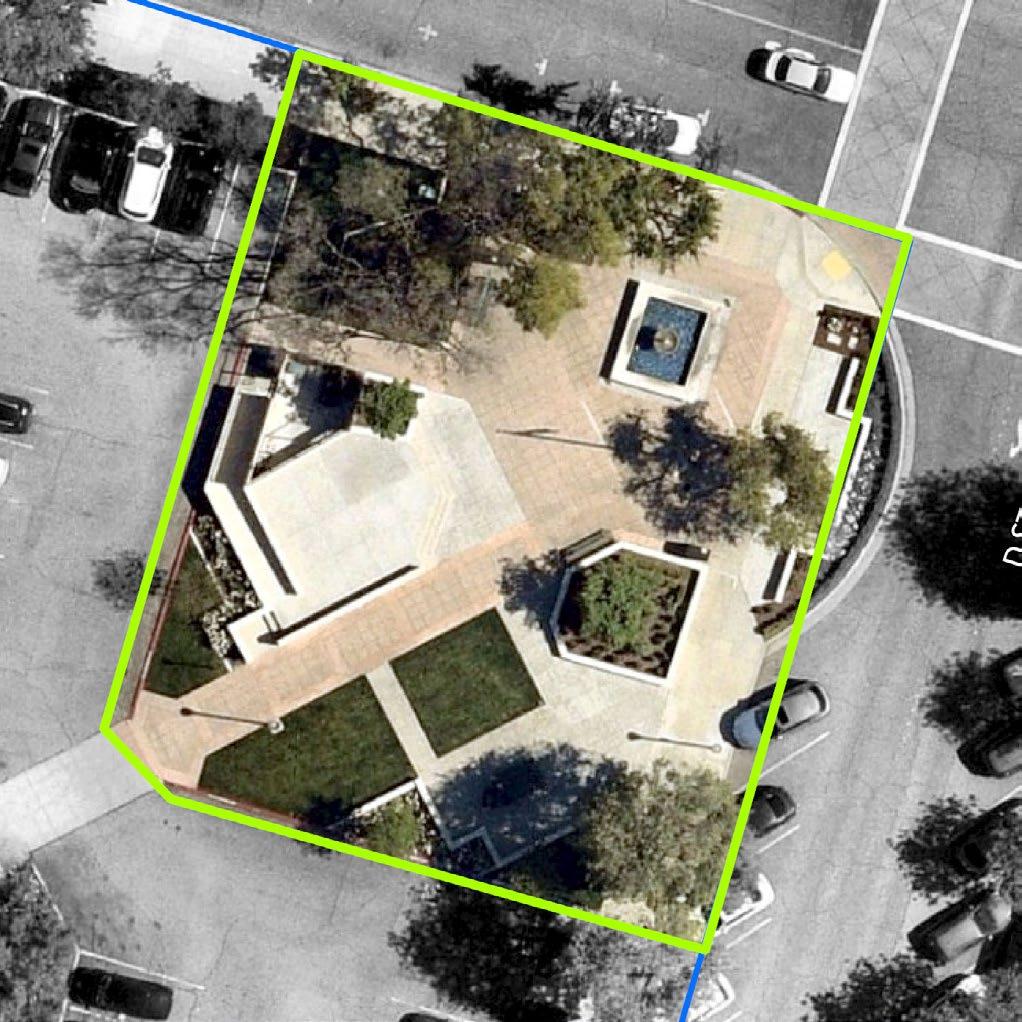
Existing Conditions: Mainiero Square is a 0.2 acre plaza located near D street and 3rd Street in Downtown La Verne. Existing amenities include a fountain, benches, and a small stage.
Planned Improvements: N/A
Park Recommendations: N/A
Recommended Recreation Amenities for Underutilized Park Space: N/A (no underutilized park space)
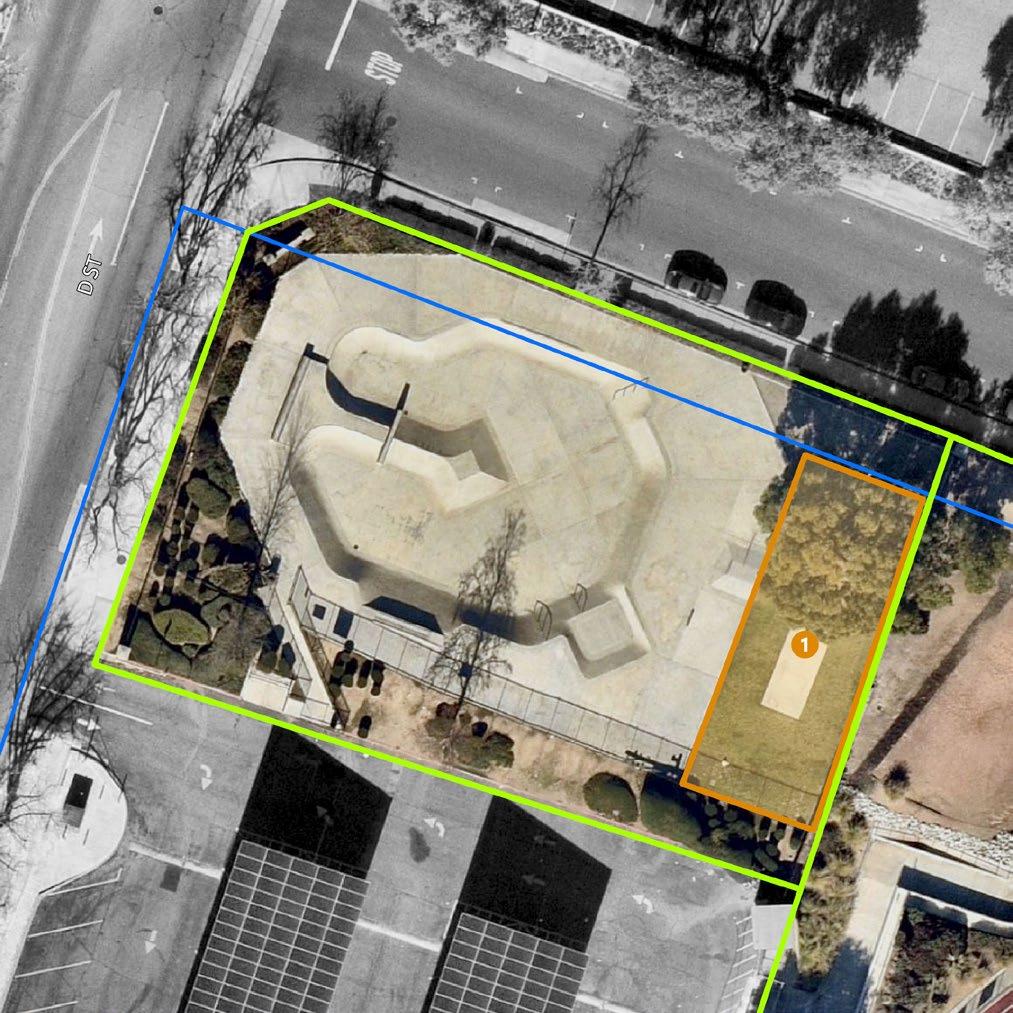
Park Boundary
School Boundary Infill areas
Existing Conditions: La Verne Skate Park is a 0.5 acre mini park located near D Street and Durward Way, adjacent to La Verne Sports Park. No other amenities are present other than the skate park.
Planned Improvements: N/A
Park Recommendations: N/A
Recommended Recreation Amenities for Underutilized Park Space:
TABLE 6-13: La Verne Skate Park Recommended Amenities
AMENITY TYPICAL
Group Picnic Areas (12+ people)
500-1,500 1
The following list of projects are citywide park infrastructure-related projects. They include citywide park improvements that may be applicable for most city parks or recommendations for future parks or facilities no specific to a existing park.
1. Conduct annual baseball and soccer fields leveling
2. Explore feasibility of the addition of a new baseball field
3. Install master valves and flow sensors at all parks
4. Leverage the amenity condition assessment to track the age and condition of playgrounds to develop a replacement schedule
5. Leverage the amenity condition assessment to track the age and condition of assets to develop a replacement schedule
6. Explore the feasibility of adding a new multi-generational community center to expand senior and youth programming
7. Develop new park and indoor facility at the former Lutheran High School site
8. Update and rebrand all park wayfinding, educational , and how-to signage.
9. Identify trail and access improvements
10. Upgrade park and field lighting
11. Park and facility ADA improvements
12. Add/Update/Replace trash cans and trash enclosures
13. Slurry and re-stripe park and facility parking lots
The City has plans to collaborate with the developer who has purchased the former Lutheran High School Site to set aside a portion of the land to build a community park space. Amenities and facilities for this space are still to be determined.
Several amenities and facilities are recommended at this potential community space including, an indoor gymnasium, multi-purpose field, all-inclusive playground, walking path, and picnic areas.
If developed into a park space, it will help fill a park accessibility gap in the center-east portion of La Verne.
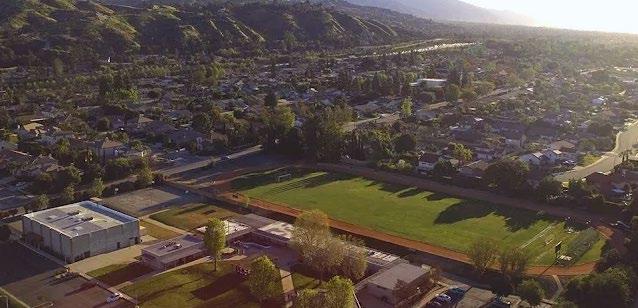
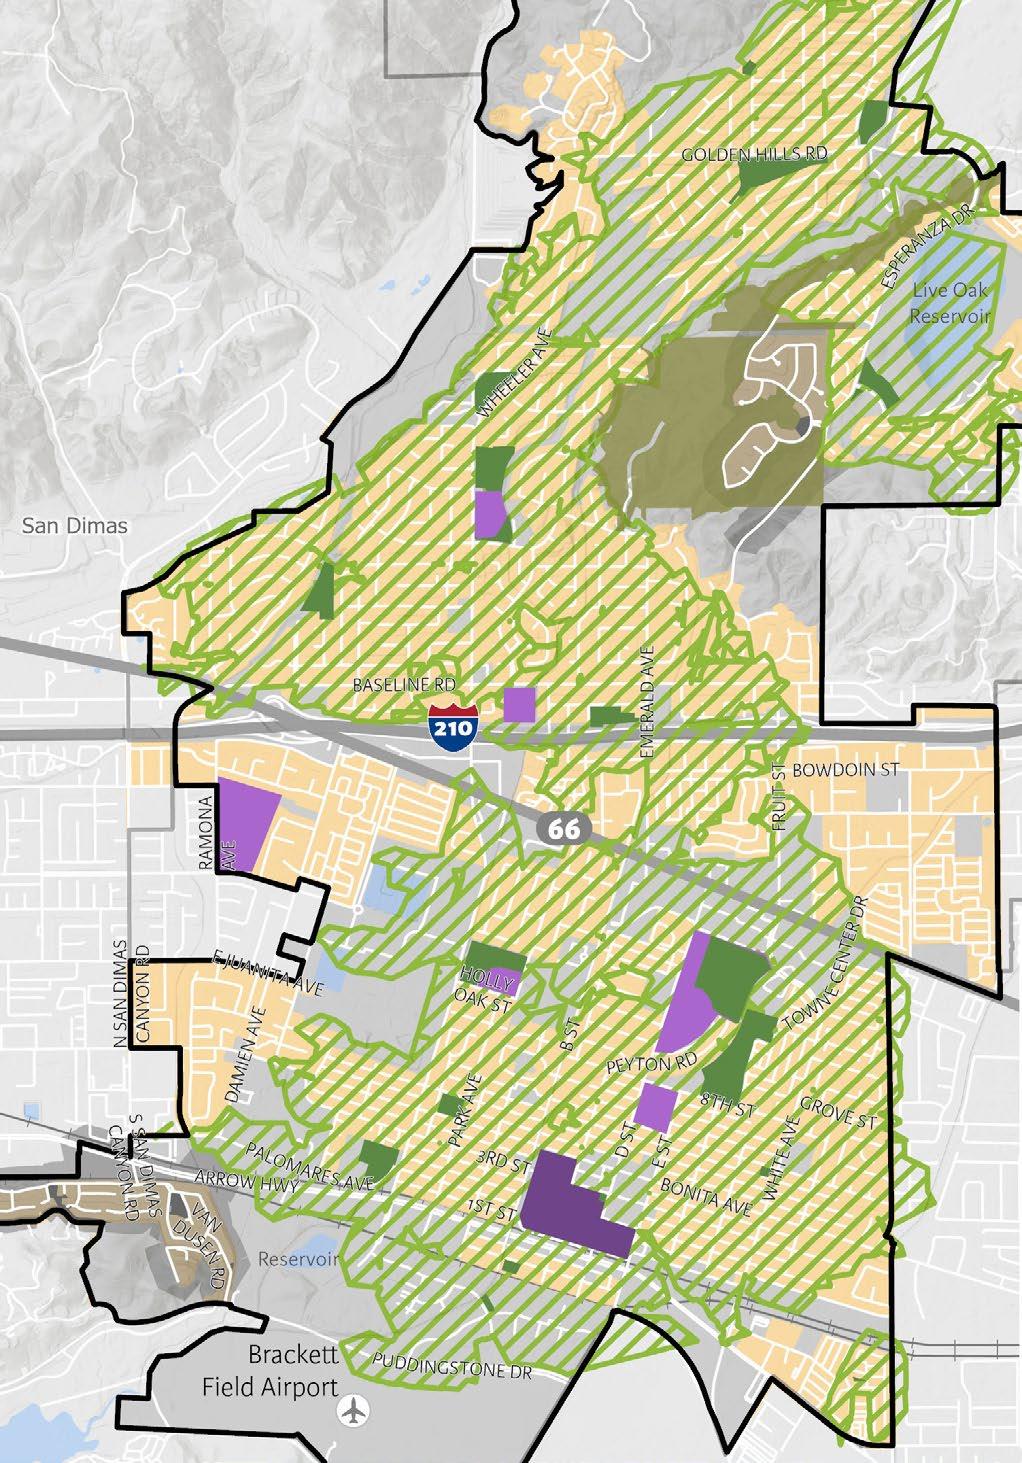
The Capital Improvement Plan (CIP) serves as a living document for City staff to track park improvements and new park-related infrastructure projects. The City is encouraged to use it as a tool to cross off projects as they are completed as well as to add new projects as new needs are identified over the next decade. The CIP combines all major elements of this comprehensive master planning-process to ensure current and future City staff and elected officials have the needed information to make informed decisions.
Each recommended item references corresponding objectives listed under the Plan’s initiatives (found in section 5.2 of this plan) as well as the source to help justify its inclusion in this CIP. Planning-level cost ranges are also included to help the City gauge general costs of each item. Lastly, items that help address a citywide recreation deficit that was previously identified in Chapter 2 of this plan are highlighted. The full CIP table can be found in Appendix B.
The CIP is comprised of the following elements: park name, recommended item, priority tier and timeline, maintenance considerations, source of recommendation, Plan objectives it supports, planning-level typical costs of each item, and if it address an amenity deficit. The following section described each of these elements in more detail.
Tier 1: Essential improvements focus on deferred maintenance projects and lifecycle replacement of existing amenities within a park utilizing current funding sources
Tier 2: Ideal improvements utilize reallocated or new funding sources to implement capital projects that enhance or replace existing park facilities.
Tier 3: Visionary improvements focus on the complete renovation of existing parks or the development of new parks and/or recreation facilities funding through new or additional revenue sources, including grants, donations, partnerships, or taxes.
Timeline
Short: Projects to be completed within 0-3 years
Mid: Projects to be completed within 3-10 years
Long: Projects to be completed within 10-20 years
Maintenance Considerations
Minimal Cost Savings- Capital improvements that incrementally reduce ongoing operating expenses over time by lowering labor, energy, water, maintenance, or replacement costs. These investments typically modernize aging assets, improve efficiency, or consolidate operations, resulting in modest net annual savings to the City’s operating budget once implemented.
Neutral Costs- Capital improvements that do not materially change annual operating costs compared to current conditions. While these projects may enhance functionality, safety, accessibility, or user experience, they are designed to be operationally sustainable within existing staffing and budget levels.
Increases Costs- Capital improvements that add new facilities, amenities, or service expectations, resulting in higher ongoing operating and maintenance costs. These projects typically require additional staffing, utilities, programming support, lifecycle maintenance, or contracted services to operate at an acceptable level.
Source Identifies where the project was derived from.
Cost Range
Planning-level cost estimate ranges are based on recently-completed work throughout California, research, trends, best practices. Costs ranges do consider estimated soft costs such as escalation/inflation, permits, design, etc. Actual costs will need to be determined on an individual basis once the City selects a project and a consultant to create actual designs that costs estimates can be based off of.
Recreation Amenity Deficit
Identifies if the project would help add a new park amenity which the City has been identified being in a decifit based on NRPA guidelines.
TABLE 6-14: Example from CIP
Sources:
» The Aspen Institute. Project Play. State of Play 2024 Trends in Youth Play Report. Retrieved from: www.projectplay. org/state-of-play-2024
» National Recreation and Park Association. Mental Health Benefits of Parks and Recreation. Retrieved from: www. nrpa.org/publications-research/park-pulse/mental-health-benefits-of-parks-and-recreation
» National Recreation and Park Association. Top Trends in Parks and Recreation for 2025. Retrieved from: www.nrpa. org/parks-recreation-magazine/2024/december/top-trends-in-parks-and-recreation-2025
» National Recreation and Park Association. Top Trends in Parks and Recreation for 2024. Retrieved from: www.nrpa. org/parks-recreation-magazine/2024/january/top-trends-in-parks-and-recreation-for-2024
» National Recreation and Park Association. Top Trends in Parks and Recreation for 2023. Retrieved from: www.nrpa. org/parks-recreation-magazine/2023/january/top-trends-in-parks-and-recreation-for-2023
» Outdoor Industry Association. 2025 Outdoor Participation Trends Report. Retrieved from: www.oia.outdoorindustry. org/resource/2025-outdoor-participation-trends-report-exec-summary
» Recreation Management Magazine. State of the Industry Report 2025. Retrieved from: www.recmanagement.com/ state-industry
» Sports & Fitness Industry Association. Topline Participation Report 2024. Retrieved from: sfia.org/resources/ sfias-topline-participation-report-shows-strong-positive-trends-across-multiple-sports-and-fitness-categories-2/