
Dallas-Fort Worth Industrial Market | Q4 2024

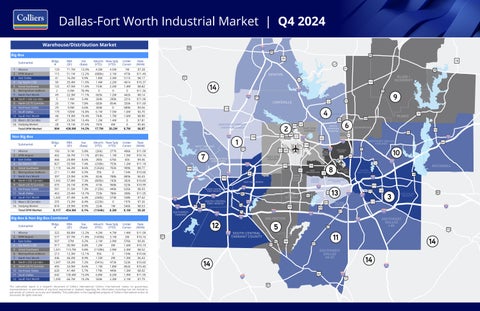
1Alliance12971.7M13.0%4.3M4.5M1M$7.28
2DFWAirport11551.1M12.2%(680k)2.1M473k$11.49
3EastDallas4116.2M9.9%1.8M2.3M511k$8.17
4FarNorthI-35E9035.4M11.0%1.4M2.2M461k$10.37
5GreatSouthwest12247.5M11.6%153k2.2M1.4M$8.82
6Metropolitan-Addison20.9M76.4%000$11.36
7NorthFortWorth4922.3M11.1%665k1.2M442k$8.14
8NorthI-35ECorridor51.4M5.4%264k290k221k$11.06
9NorthUS75Corridor207.7M7.8%683k854k339k$11.69
10NortheastDallas299.9M0.6%304k0689k$9.56
11SouthDallas179105M16.8%6.1M7.5M1.6M$6.70
12SouthFortWorth4819.3M19.4%744k1.7M1.6M$8.90
13WestI-30Corridor4723.5M13.4%1.2M1.4M0$7.81
14OutlyingMarket2819.1M31.6%747k4M0$5.00
Total DFW Market 904430.9M14.2%17.7M30.2M8.7M$6.87
Submarket
1Alliance1939.1M5.8%(26k)277k406k$11.09
2DFWAirport46236.7M11.1%(813k)1.1M1.5M$10.16
3EastDallas46620.8M8.6%285k676k65k$9.36
4FarNorthI-35E82755.5M7.4%(239k)753k1.2M$11.18
5GreatSouthwest1,11966.2M8.6%(1262k)702k909k$8.77
6Metropolitan-Addison21111.4M6.9%95k0134k$10.66
7NorthFortWorth39723.9M6.9%824k788k889k$6.43
8NorthI-35ECorridor1,54257.8M7.3%(805k)183k302k$10.60
9NorthUS75Corridor47526.1M8.9%415k968k523k$10.99
10NortheastDallas59131.5M7.3%(125k)449k626k$8.93
11SouthDallas46325.4M10.7%725k786k308k$11.05
12SouthFortWorth1,24247.4M6.4%(240k)574k538k$7.62
13WestI-30Corridor25513.2M8.4%(223k)0197k$7.26
14OutlyingMarket87429.9M8.9%224k1M540k$8.53
Total DFW Market 9,117454.9M8.1%(1164k)8.3M8.1M$9.38
1Alliance32280.8M12.2%4.2M4.7M1.4M$11.09
2DFWAirport57787.7M11.8%(1493k)3.1M2M$10.16
3EastDallas50737M9.2%2.1M2.9M576k$9.36
4FarNorthI-35E91790.9M8.8%1.2M3M1.6M$10.19
5GreatSouthwest1,241113.7M9.8%(1109k)2.9M2.3M$8.52
6Metropolitan-Addison21312.3M12.1%95k0134k$10.66
7NorthFortWorth44646.2M8.9%1.5M2M1.3M$6.43
8NorthI-35ECorridor1,54759.2M7.2%(541k)473k523k$10.60
9NorthUS75Corridor49533.9M8.6%1.1M1.8M862k$10.45
10NortheastDallas62041.4M5.7%179k449k1.3M$8.92
11SouthDallas642130.4M15.6%6.8M8.2M1.9M$11.05
12SouthFortWorth1,29066.7M10.2%504k2.3M2.1M$7.79
13WestI-30Corridor30236.6M11.6%995k1.4M197k$7.26
14OutlyingMarket90249M17.7%972k5M540k$7.37
Submarket
Dallas-Fort Worth Industrial Market | Q4 2024
Bldgs # RBA (SF) Vac (Rate) Absorb (YTD) NewSply (YTD) Under Constr Rate (NNN)
1Alliance742.6M4.8%62k00$11.85
2DFWAirport2127.5M7.3%(33k)00$14.89
3EastDallas1904.5M4.8%(81k)00$12.95
4FarNorthI-35E32311.6M6.3%(15k)47k146k$14.18
5GreatSouthwest30310.2M6.7%(236k)00$11.23
6Metropolitan-Addison2338M9.7%(57k)043k$12.82
7NorthFortWorth752.7M3.0%46k28k0$12.22
8NorthI-35ECorridor67818.3M6.9%(233k)136k0$16.76
9NorthUS75Corridor45116.4M7.2%39k94k261k$13.86
10NortheastDallas2978.3M4.0%(82k)0160k$10.44
11SouthDallas1464M1.0%61k00$15.00
12SouthFortWorth3218.8M3.6%(92k)34k33k$14.37
13WestI-30Corridor701.9M1.8%8k0014OutlyingMarket1423M6.2%45k75k101k$20.49 Total DFW Market 3,515107.8M6.0%(570k)413k 744k $13.96
Submarket
Bldgs # RBA (SF) Vac (Rate) Absorb (YTD) NewSply (YTD) Under Constr Rate (NNN)
1Alliance101.5M0.0%263k263k02DFWAirport244.3M17.5%0003EastDallas646.3M2.2%902k766k0$9.50
4FarNorthI-35E736.5M7.6%(123k)92k67k$8.57
5GreatSouthwest7613.8M0.8%39k00$8.50
6Metropolitan-Addison211.4M3.2%(11k)00$12.20
7NorthFortWorth627.6M0.5%165k045k$6.86
8NorthI-35ECorridor1087.3M1.2%369k00$11.41
9NorthUS75Corridor6410.9M2.3%552k512k32k$20.00 10NortheastDallas787.5M1.4%(46k)00$5.50
11SouthDallas9414.2M3.9%(30k)00$3.95
12SouthFortWorth11111.4M0.4%624k594k1.4M$11.50
13WestI-30Corridor311.7M14.6%(98k)00$4.95
14OutlyingMarket19120.4M4.0%711k25k402k$6.89
Total DFW Market 1,007114.8M3.2%3.3M2.3M1.9M$7.00
Submarket-
Bldgs # RBA (SF) Vac (Rate) Absorb (YTD) NewSply (YTD) Under Constr Rate (NNN)
1Alliance40684.9M11.8%4.6M5M1.4M2DFWAirport81399.5M11.7%(1526k)3.1M2M3EastDallas76147.8M7.9%2.9M3.7M576k4FarNorthI-35E1,313109M8.5%1M3.1M1.8M5GreatSouthwest1,620137.7M8.7%(1450k)2M2.3M6Metropolitan-Addison46721.7M10.6%27k0177k7NorthFortWorth58356.5M7.5%1.7M2M1.4M8NorthI-35ECorridor2,33384.8M6.7%(404k)609k523k9NorthUS75Corridor1,01061.2M7.1%1.7M2.4M1.2M10NortheastDallas99557.2M4.9%50k449k1.5M11SouthDallas882148.6M14.1%6.8M8.2M1.9M12SouthFortWorth1,72286.8M8.2%1M2.9M3.5M13WestI-30Corridor40340.2M11.2%904k1.4M197k14OutlyingMarket1,23572.5M13.4%1.7M5.1M1MTotal DFW
14,5431,108M9.8%19.3M41.1M19.5M -