3 minute read
Mapping heat vulnerability nationwide


KER partners with U.S. Census Bureau to build data tool for reducing heat related deaths
In the early days of the COVID-19 pandemic, pundits and politicians referred to it as an equalizer, a disease that couldn’t be evaded through power or privilege. Experts quickly pointed out that pandemics typically worsen existing health disparities. This one was no different.
Advertisement
No shock or stressor affects all communities equally, but what if decision-makers were able to see which neighborhoods are most vulnerable?
Last summer the U.S. Census Bureau released a dashboard called Community Resilience Estimates (CRE) that maps the prevalence of risk factors like poverty, age, disability and lack of internet access by census tract.

The current version of the Census Bureau's Community Resilience Estimates dashboard maps risks factors like poverty, disability and lack of internet access.
But not all shocks have the same risk factors. Our team reached out to work with them to create a more targeted version of this tool, one that maps vulnerability to extreme heat.
“A CRE for heat aims to help with planning to reduce and prevent heat related illness and death,” said R. Chase Sawyer, branch chief of survey analytics for the U.S. Census Bureau. We quickly suggested including housing data in the estimate. “We know from our research that the type of housing one lives in has a dramatic impact on their exposure and thus their resilience to extreme heat,” said executive director Patricia Solís.
“Among outdoor heat associated deaths, nearly half are people experiencing homelessness; among indoor heat associated deaths, a disproportionate number live in older mobile homes.
“This connection between heat and housing insecurity is a threat multiplier but also a potential solutions multiplier. We can address heat health by addressing built environment needs.”
While the Census Bureau already collects data on housing type, they don’t track environmental risk factors for heat. KER GIS analyst Abdulrahman “Al” Alsanad is helping them blend data from other sources with their internal datasets, a method widely used by researchers in the academic and private sector, but not yet common in federal agencies because of the challenges of ingesting data from many sources.
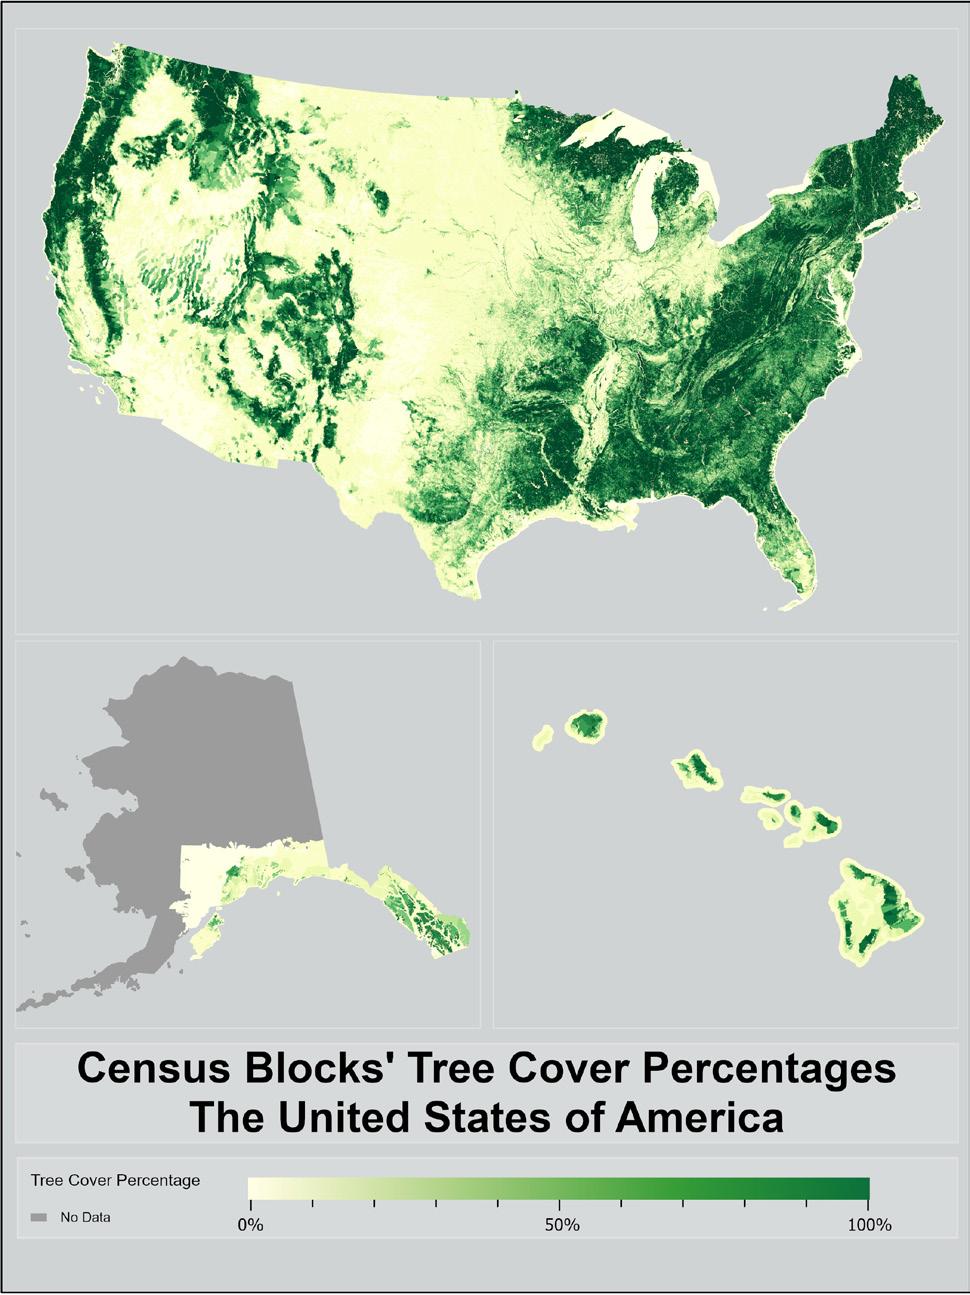
“Temperature layers were hard to process for the whole country, so we talked about creating a tree cover layer and decided to start with that instead,” said Alsanad. Using spatial data from the U.S. Forest Service and GIS software, he mapped tree canopy cover by census block for all 50 states.

This map shows tree canopy cover for each census block in the U.S., one environmental factor that contributes to heat resilience.
Abdulrahman "Al" Alsanad / Knowledge Exchange for Resilience
When complete, this dashboard will help stakeholders and decision-makers across the country target resources, information and interventions to the neighborhoods that are most at-risk in extreme heat. The tool may also serve as a pilot for future Census CREs that map vulnerability to other shocks and stresses.
— R. Chase Sawyer, Branch Chief of Survey Analytics, U.S. Census Bureau
Explore the current version of the Census Bureau’s Community Resilience Estimates at https://bit.ly/census-CRE