Page 01 / 06 Investor Brief · 2024–2030
Global Portable-Charging Outlook
Power Bank Market.
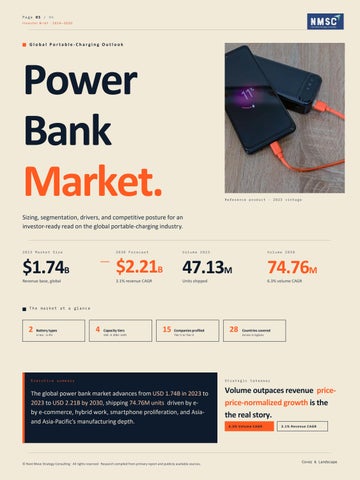
Reference product · 2023 vintage
Sizing, segmentation, drivers, and competitive posture for an investor-ready read on the global portable-charging industry.
2023 Market Size
2030 Forecast
Volume 2023
Volume 2030
$1.74B
$2.21B 47.13M
74.76M
Revenue base, global
3.1% revenue CAGR
6.3% volume CAGR
Units shipped
The market at a glance
2 Battery types Li-Ion · Li-Po
Executive
4 Capacity tiers
≤5K → 20K+ mAh
15 Companies profiled Tier-1 to Tier-3
summary
The global power bank market advances from USD 1.74B in 2023 to 2023 to USD 2.21B by 2030, shipping 74.76M units driven by eby e-commerce, hybrid work, smartphone proliferation, and Asiaand Asia-Pacific's manufacturing depth.
© Next Move Strategy Consulting · All rights reserved · Research compiled from primary report and publicly available sources.
28 Countries covered Across 4 regions
Strategic takeaway
Volume outpaces revenue priceprice-normalized growth is the the real story. 6 . 3 % V ol um e C AG R
3 . 1 % R ev enue C AG R
Cover & Landscape
Page 02 / 06 Sizing & Forecast
Section
·
Quantitative
frame
Sizing the ramp.
Headline read
+58% more units by 2030 2030 on +27% more revenue.
Revenue rises steadily while unit volumes accelerate a sign of pricing compression and category democratization across every geography profiled.
Trajectory
·
2023
→
2030
A category doubling its tape-out. Revenue · USD billion Volume vs. revenue gap
2023 actual
$1.74B
2030 forecast +3.1% CAGR
$2.21B
Volume compounds 2x faster than revenue through through 2030. 2024 baseline
2030 forecast
Unit volume · millions
2023 actual
47.13M
2030 forecast +6.3% CAGR
74.76M
Volume index
Revenue index
Five things the data says
01
Volume outruns revenue Unit shipments compound at 6.3% more than 2× the 3.1% revenue CAGR as ASPs soften ASPs soften under category commoditization.
02
A clear US$ 470M net add USD 1.74B → 2.21B adds roughly USD 470M of incremental annual revenue by 2030 incremental, not cumulative.
03
Coverage spans 28 countries 15 companies profiled across four regions; the free customization window converts into converts into another 80 hours of analyst time.
04
Capacity-tier mix
Mid-capacity 5–10K and 10–20K mAh mAh carry the demand curve. Up to 5,000 mAh
15%
5,001 – 10,000 mAh
38%
10,001 – 20,000 mAh
34%
Above 20,000 mAh
13%
Pricing pressure is structural Margins migrate up the value chain; differentiation moves to fast-charging, GaN, graphenegraphene-enabled cells, and integrated cable/stand SKUs. Insight
Travelers, gamers, and field professionals pull 20K+ mAh demand — and the high-capacity slice is the fastest-growing tier of the four.
Source · Next Move Strategy Consulting, Power Bank Market Report (2024–2030).
Market sizing
Page 03 / 06 Drivers & Opportunities
Where the growth comes from. from. 02
DRIVER
Hybrid work models
E-commerce penetration
39% of knowledge workers hybrid globally; 71% in the U.S. workforce.
A USD 6.3 trillion global e-commerce market 21.2% of retail funnels buyers toward Amazon, Alibaba, AliExpress, and eBay, where power banks move on price, ratings, and SKU variety. 03
$6.3T
21.2%
Devices, not just phones Rising 5G, wearables, earbuds, and laptops keep the multimulti-port fast-charge format essential.
04
Graphene battery tech Higher conductivity, longer life a future-forward differentiator currently surfacing across R&D.
Travelers, gamers, field pros pull pull 20K+ mAh. High-capacity power banks are the fastest-growing tier — users are willing to pay a to pay a premium for fast-charging, integrated cables, and laptop-grade output. output. Fast char ging
I nte gr ate d cable s
65W+ o utput
High-growth segments to watch
Segment A
Wireless & MagSafeMagSafe-compatible compatible Premium replacement cycle for iPhone and flagships; rising attach rates as Qi standards mature.
Segment B
Segment C
Segment D
Solar & rugged
15–65W PD output
Multi-port 3–5 port
Outdoor, travel, and emergency kits kits small base, but a premium SKU SKU family on Amazon and Alibaba. Alibaba.
Laptop-and-tablet charging directly directly cannibalizes replacement AC AC adapters at modest price premium. premium.
Households and shared workspaces workspaces the multi-device use case case densifies repeat purchase.
Drivers & Opportunities
Page 04 / 06 Competitive Landscape
15
companies
profiled
·
3
tiers
·
3
strategic
plays
A crowded field, tiered by by reach.
How to read
Tier-1 owns brand & reach; Tier-2 supplies premium tech; Tier-3 wins on price and availability.
Tier-1 anchors own recognizable brands. Tier-2 specialists push capacity and tech. Tier-3 Tier-3 challengers compress price. Tier
1
·
Anchor
brands
Recognizable, global, R&D-backed.
Anker
Xiaomi
Samsung
Anker Innovations
Xiaomi Corporation
Samsung Electronics
Premium charging specialist; ranked #1 in 2019 and the global the global benchmark.
High-volume value-tier king; the Redmi line anchors ecommerce share.
Flagship-bundle play; integrates with Galaxy accessories accessories ecosystem.
Tier 2 · Specialists
Premium tech, design-forward, retail-anchored.
Belkin
Philips
Lenovo
Aukey
Belkin International
Koninklijke Philips
Lenovo Group
Aukey Technology
Tier
3
·
Challengers
Category specialists winning on price, segments, or regional depth.
Veger
Baseus
UGREEN
ADATA
Veger Power
Baseus
UGREEN Limited
ADATA Technology
ASUS
Omnicharge
Polyconcept
Ambrane
ASUSTeK Computer
Omnicharge
Polyconcept N.A.
Ambrane India
Recent strategic plays (2023)
May · 2023
Aug · 2023
Dec · 2023
Xiaomi Redmi Power Bank
Anker 335 Power Bank
OnePlus × Sharge POUCH
10,000 mAh · dual USB-C and micro-USB · two-way fastfast-charging
3-in-1 power bank, charger, and cable, born from OnePlus OnePlus Power of Community Pr oduct launch · 2 2 9 C N Y / ~ USD 3 1
Pr od u ct la u n ch · v a lu e tie r
Tiering is editorial — drawn from product portfolio, geographic reach, and report mentions; not a market-share ranking.
C o- cr e a tion · community colla b
Competition
Page 05 / 06 Regional Opportunities
Where
to
lean
in
first
Asia-Pacific owns the curve. North America pulls America pulls it. Three regions, three plays — APAC for scale, North America for fast-charging growth, and Europe & RoW for design-led for design-led premium adjacencies.
Region
01
Highest absolute share
Asia-Pacific Manufacturing heartland, domestic consumption, and an e-commerce commerce flywheel the dominant region for the category. Global revenue share
~49% Singapore
India
Japan
Region 03
North America
Europe & RoW
5G, wearables, hybrid work — premium fast-charge formats.
Mature, design-led, and ESG-conscious conscious consumers.
Projected CAGR
Hot pocket
5.2%
Premium fast-charge charge
Countries profiled
Key markets
U.S.
Key countries profiled
China
Region 02
South Korea
Indonesia
Canada
15–65W PD output
Mexico
Australia
U.K.
Germany
France
Spain
Nordics
UAE
Italy
Taiwan
Investor read-across
APAC · Scale lever
NA · Tech-driven
EU & RoW · Premium
Manufacturing depth + + 49% share = cost base + base + demand sink in in one region.
5G and wearables drive drive the upgrade to highhigh-wattage output.
ESG- and designconscious buyers reward reward sustainability story.
Premium fast-charge and laptop-grade adapters replace the legacy Amazon-basics purchase cycle.
Regional shares per Next Move Strategy Consulting report; NA CAGR 5.2% (2024–2030); 28 countries covered across 4 regions. regions.
Recyclable cells, graphene R&D, and modular accessories accessories should land first here.
Regional
Page 06 / 06 Connect
Thank you.
Reference · minimalist Xiaomi form-factor
Built to be carried the global power bank bank purchase cycle keeps accelerating. accelerating.
Follow
in
f
Next
Move
Strategy
Consulting
LinkedIn linkedin.com/company/next-move-strategyconsulting
Follow
Follow
facebook.com/Next-Move-Strategy-Consulting
Phone
+1 857 758 5017
YouTube
Watch
youtube.com/channel/UCJuVRxfBo-Dsog7BgDE4uPQ
info@nextmsc.com Official Website
nextmsc.com
X
◯
Follow
twitter.com/nextmsc
Follow
instagram.com/nextmsc
Call to action Request the complete report →
Request the complete report →
© Next Move Strategy Consulting · All rights reserved
Thank You