5 minute read
3.2 Procedures in Data Analysis

by Kigatei

interpretation in order to arrive at the meaning. For example, in quantitative research, data analysis consists of measurements in numerical values from which descriptions such as mean, mode, range andstandard deviations are made. These data can be put into some order and further divided into two groups: discrete data or continuous data. Discrete data are countable data, e.g. the number of notable items produced during a day’s production. Continuous data are parameters (variables) that are measured and are expressed on a continuous scale, e.g. the height of a person. The analysis of quantitative data varies from simple to more elaborate analysis techniques. The analysis varies with the objectives of the experiment, its complexity and the extent to which conclusion can be easily reached. Data analysis in quantitative research depends on the type of study such as: Correlation study, Prediction study, Causal-comparative research etc. The research analyst breaks down data into constituent parts to obtain answers to research questions (problem statements) and to test research hypotheses.
It is only after the interpretation of analyzed data that answers to problem questions are arrived at. Therefore we have to analyze the data first and then explain the result. That is, interpret the results of the analysis done. All we are saying is that, we have to categorize the data, order the data, manipulate the data and summarize the data to obtain answers to the questions. So, it means that the purpose of analysis is to reduce the data to intelligible and interpretable form so that the relations of research problems can be studied and tested.
Advertisement
To do all this we need to make use of statistics since the primary purpose of statistics in research is to manipulate and summarize the numerical data and the results obtained, compared with chance expectations. That is, the researcher must have hypothesized that styles of leadership affect group participation in certain ways. The researcher plans an experiment, executes the plan, and gathers data from the subjects. If the research question is: “How do styles of leadership affect group-member participation?” the researcher must put down analysis paradigms or models even when working on the problem and hypotheses.
The interpretation takes the results of analysis, makes inferences pertinent to research relations studied, and draws conclusions about the relations, searching for their meaning and implications, (Kerlinger, 2004). There are many kinds of statistical analysis and presentations available and we cannot discuss them all in details here.
3.2 Procedures in Data Analysis
MadhuBala, of Indira Gandhi National Open University,( 2005) discussed the following process for data analysis. “Once you have selected the topic of the research and have gone through the process of literature survey, established your own focus of research, selected the research paradigm and methodology, prepared your own research plan and have collected the data; the next step is analysis of the data collected, before finally writing the research report.
o Data analysis is an ongoing activity, which not only answers your question but also gives you the directions for future data collection. Data analysis procedures (DAP) help you to arrive at the data analysis. The uses of such procedures put your research project in perspective and assist you in testing the hypotheses with which you have started your research. Hence with the use of DAP, you can: convert data into information and knowledge, and explore the relationship between variables. o Understanding of the data analysis procedures will help you to appreciate the meaning of the scientific method, hypotheses testing and statistical significance in relation to research questions realise the importance of good research design when investigating research questions have knowledge of a range of inferential statistics and their applicability and limitations in the context of your research be able to devise, implement and report accurately a small quantitative research project be capable of identifying the data analysis procedures relevant to your research project show an understanding of the strengths and limitations of the selected quantitative and/or qualitative research project demonstrate the ability to use word processing, project planning and statistical computer packages in the context of a quantitative research project and report be adept of working effectively alone or with others to solve a research question/ problem quantitatively. The literature survey which you carried out guides you through the various data analysis methods that have been used in similar studies. Depending upon your research paradigm and methodology and the type of data collection, this also assists you in data analysis. Hence once you are aware of the fact that which particular procedure is relevant to your research project, you get the answers to:
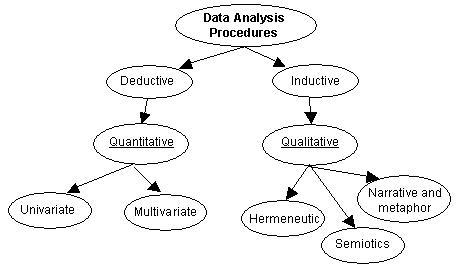
What kinds of data analysis tools are identified for similar research investigations? and What data analysis procedures should you use for your purpose? o There are numerous ways under which data analysis procedures are broadly defined. The following diagram, FigA3 makes it clear.
Fig A3
(Adopted from Wikipedia-2010 on Data Analysis Procedure)
There are, in fact, a number of software packages available that facilitate data analysis. These include statistical packages like SPSS, SAS, and Microsoft Excel etc. Similarly tools like spreadsheets and word processing software are multipurpose and very useful for data analysis. Apart from data analysis procedures, there is another factor which is secondary analysis of qualitative data. People generally believe in the universal notion that “one can prove anything with statistics. ” This is only true if we use data analysis procedures improperly. There are some points that people often overlook while doing data analysis, and also the way(s) people sometimes “bend the rules” of statistics to support their viewpoint. The following website discusses them very clearly. Taking examples from medicine, education, and industry, it discusses the different ways in which you can make sure that your own statistical procedures are clear and accurate. Since data analysis involves uncovering the structures underlying it, (Kombo and Tromp,2006), it means that extracting important information, variables and detecting any anomalies will help very much in testing the underlying assumptions, thus giving the analysis a meaningful interpretation.