Kiawah Island Property Report A
K I A W A H
I S L A N D
R E A L
January - September 2026 Results
|
E S T A T E
P U B L I C A T I O N
kiawahisland.com
|
843.396.1522
total properties closed
K E Y
total Island-wide inventory*
264
(end of Q3 each year)
total dollar volume
$754M
(+12% from Q3 2025)
single-family home median price
$3.9M
(+19% from Q3 2025)
2026
=
93
2025
=
141
2024
=
126
2023
=
123
2022
=
102
2021
=
homesite median price
84
2020
=
260
$945K
2 019
=
449
2 01 8
=
489
villa & cottage median price
2 017
=
5 37
$820K
2 016
=
538
(-10% from Q3 2025)
(-8% from Q3 2025)
O B S E R V AT I O N S :
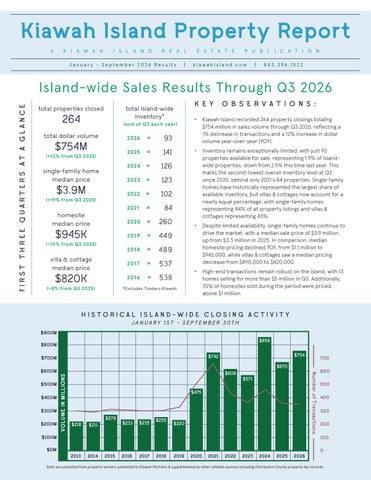
• Kiawah Island recorded 264 property closings totaling
$754 million in sales volume through Q3 2026, reflecting a 1% decrease in transactions and a 12% increase in dollar volume year-over-year (YOY).
• Inventory remains exceptionally limited, with just 93
properties available for sale, representing 1.9% of Islandwide properties, down from 2.9% this time last year. This marks the second-lowest overall inventory level at Q3 since 2020, behind only 2021’s 84 properties. Single-family homes have historically represented the largest share of available inventory, but villas & cottages now account for a nearly equal percentage, with single-family homes representing 44% of all property listings and villas & cottages representing 43%.
• Despite limited availability, single-family homes continue to drive the market, with a median sale price of $3.9 million, up from $3.3 million in 2025. In comparison, median homesite pricing declined YOY, from $1.1 million to $945,000, while villas & cottages saw a median pricing decrease from $890,000 to $820,000.
• High-end transactions remain robust on the Island, with 13 homes selling for more than $5 million in Q3. Additionally, 70% of homesites sold during the period were priced above $1 million.
*Excludes Timbers Kiawah
HISTORICAL ISL AND-WIDE CLOSING ACTIVITY JANUARY 1ST - SEPTEMBER 30TH
$900M $859
$800M
$500M $400M $300M $200M
700
$670 $608
Number of Transactions
$600M
$754
$742
$700M
VOLUME IN MILLIONS
FIR ST THREE QUAR TER S AT A GL ANCE
Island-wide Sales Results Through Q3 2026
$571
$475
$279 $218
$211
$233
$235
$255
$220
$100M
600 500 400 300 200 100
$0M 2013
2014
2015
2016
2017
2018
2019
2020
2021
2022
2023
2024
2025
2026
0
Data accumulated from property waivers submitted to Kiawah Partners & supplemented by other reliable sources including Charleston County property tax records.
Kiawah Island Property Report | January - September 2026 Results THROUGH Q3 2026 KIAWAH ISLAND CLOSINGS SNAPSHOT 2025 Properties Closed Volume
Properties Closed Volume
VILLAS & COTTAGES
264
-1%
$753,612,000
+12%
103
100
-3%
$129,236,000
$116,323,000
-10%
$890,000
$820,000
-8%
Average Price
$1,255,000
$1,163,000
-7%
116
132
+14%
Volume
$467,599,000
$600,623,000
+28%
Median Price
$3,248,000
$3,853,000
+19%
Average Price
$4,031,000
$4,550,000
+13%
Properties Closed HOMESITES
266 $670,164,000
Median Price
Properties Closed HOMES
% of Change
47
32
-32%
Volume
$73,329,000
$36,666,000
-50%
Median Price
$1,050,000
$945,000
-10%
Average Price
$1,560,000
$1,146,000
-27%
30.5 1.4 56 3.2 4.8 2.5 58 8 +
ALL TRANSACTIONS
2026
All dollar figures have been rounded to the nearest thousand. Excludes Bulk Sales. Includes The Cape and Timbers Kiawah Sales.
FIRST THREE QUARTERS 2026 ISLAND-WIDE INVENTORY* 8% (374)
ES
C OT TAG
+4443
V
I
S &
A LL
3.2% = 12
S
T
ES
2.5% = 40
*Excludes Timbers Kiawah Sales
1.4%
O
T
G
1.4% = 41
59% (2,861)
H
S
CO
ME
&
A
33% (1,626)
4,861 TOTAL UNITS ON KIAWAH ISLAND
LE-FAMIL Y
A M I LY H O
VILLAS
43%* (40)
44% (41)
ITES
NG
E-F
JUST 1.9% OF ISLAND-WIDE PROPERTIES ARE LISTED AND AVAILABLE FOR PURCHASE
MES
SI
GL
93 ACTIVE LISTINGS AT END OF Q3 2026
IN
13% (12)
HO
E
M
2.5%
S
M
O
ITE
S
H
ES
3.2%
Kiawah Island Property Report | January - September 2026 Results FOR-SALE ISLAND-WIDE INVENTORY COMPARISON 2025
2026
TOTAL $
$202M
$309M
$378M
$464M
$500M
$420M
HOMES
$110M
$237M
$236M
$330M
$309M
$263M
VILLAS & COTTAGES
$44M
$23M
$62M
$55M
$109M
$96M
HOMESITES
$51M
$48M
$80M
$80M
$80M
$61M
TOTAL #
84
102
123
126
141
93
HOMES
29
51
55
64
67
41
VILLAS & COTTAGES
16
15
40
36
54
40
HOMESITES
39
36
28
26
20
12
7%
10%
25%
HOMES SOLD = 40
< $2M = 4
$2M - $4.99M = 23 $5M - $9.99M = 10
> $10M = 3
HOMESITES HOMESITES
2026
2025
2024
2025
2026
2024 2022 2025 2023 2026
2023
2026
2025
2024 2022 2025 2023 2026 2024
2023
2022
GLE-FAMILY HOMES SOLD SINGLE-FAMILY HOMES SOLD
$1.00M
100 75
INGLE-FAMILY HOMES SOLDHOMES SOLD SINGLE-FAMILY
2026
2025
2024 2022 2025 2023 2026 2024
ILLAS & COTTAGES SOLD VILLAS & COTTAGES SOLD
2023
$1.25M
MP
2022
$1.50M $500
MP
VILLAS & COTTAGES VILLAS &SOLD COTTAGES SOLD
$1.75M $750
Price In Millions MP
$2.00M $1.00M
AP
$2.25M $1.25M
$4.75M $4.50M $4.25M $4.00M $3.75M $4.75M $3.50M $4.50M $3.25M $4.25M $3.00M $4.00M $2.75M $3.75M $2.50M $3.50M $2.25M $3.25M $2.00M $3.00M $2.75M $2.50M
Price In Millions
$2.50M $1.50M
19%
1 Bedroom = 10 2 Bedroom = 7
3 Bedroom = 16 4 Bedroom = 3
10%
AP
$1.75M
275 250 225 200 175 275 150 250 125 225 100 200 75 175 50 150 25 125
VILLAS & COTTAGES SOLD = 36*
$300 *Includes The Cape and Timbers Kiawah Sales
$4.75M 275 $4.50M $4.25M 250 SINGLE-FAMILY HOMES SINGLE-FAMILY HOMES $4.00M 225 Average Price (AP) vs. Median Average Price (AP) vs. Median Price (MP) vs. Units Sold $3.75M 200 Price (MP) vs. Units Sold $4.75M $3.50M 175 $4.50M 275 $3.25M 150 $4.25M 250 $3.00M 125 $4.00M 225 $2.75M 100 $3.75M 200 $2.50M 75 $3.50M 175 $2.25M 50 $3.25M 150 $2.00M 25 $3.00M 125 $2.75M 100 $2.50M 75 $2.25M AP MP
$750
$450
$300
Price In Millions Price In Millions
$1.00M
$600
$450
AP
$2.00M
MP
50
MP
75
$2.25M
AP
100 0
$2.50M
Price In Thousands Price In Thousands MP
125 25
$1.75M $2.50M $1.50M $2.25M $1.25M $2.00M $1.00M $1.75M $750 $1.50M $500 $1.25M
0
$600
$750
Average Price (AP) vs. Median Average Price (AP) vs. Median Price (MP) vs. Units Sold Price (MP) vs. Units Sold
AP
150 50
AP MP
175 75
Price In Thousands Price In Thousands
200 100
Price (MP) vs. Units Sold
25
$750
$1.35M
$1.20M $1.80M 44% $1.05M $1.65M $900 $1.50M $750 $1.35M $600 $1.20M $450 $1.05M $300 $900
SINGLE-FAMILY HOMES SINGLE-FAMILY HOMES
VILLAS & COTTAGES VILLAS & COTTAGES
$2.50M 200 VILLAS $2.25M 175 & COTTAGES VILLAS & COTTAGES Average Price (AP) vs. Median Average Price (AP) vs. Median $2.00M 150 Price (MP) vs. Units Sold
50
$1.20M $600 $300 $900
2024 2022 2025 2023 2026 2024
2026
2025
2025 2023 2026 2024
2024 2022
0
Average Price (AP) vs. Median Average Price (AP) vs. Median Price (MP) vs. Units Sold Price (MP) vs. Units Sold
125
UNDEVELOPED HOMESITES SOLD UNDEVELOPED HOMESITES SOLD
2026
2025
2024 2022 2025 2023 2026 2024
2023
2023
2022
0
25
$1.35M $750
MP
50
100
75
$900 $1.50M
$1.05M $450
MP
75
2023
1000
2022
300 0
125 25
2022
150 50
2022
400 100
$1.05M $1.65M
MP
175 75
125 225 100 200 75 175 50 150 25 125 0 100
AP
200 100
500 200
Price (MP) vs. Units Sold Price (MP) vs. Units Sold $1.20M 150 $1.80M
AP MP
TOTAL UNITS SOLD TOTAL UNITS SOLD
225 125
$1.50M
Price In Thousands Price In Thousands
150
600 300
Price In Thousands Price In Thousands
175
400
28%
$1.65M
$1.65M
200 $1.50M HOMESITES HOMESITES Average Price (AP) vs. Median $1.35M 175 Average Price (AP) vs. Median
AP
200
9%
$1.80M
$1.80M
Through Third 225Quarter225
500 UNITS SOLD TOTAL TOTAL UNITS SOLD
200
UNDEVELOPED HOMESITES SOLD UNDEVELOPED HOMESITES SOLD
TRANSACTION TRENDS ON KIAWAH ISLAND
AP
TOTAL UNITSTOTAL SOLD UNITS SOLD
Average Price (AP) vs. Median Average Price (AP) vs. Median Price (MP) vs. Units Sold Price (MP) vs. Units Sold
AP
0
2024
600
0
5
2023
TOTAL UNITSTOTAL SOLD UNITS SOLD
00 0 00 0 00 0 0 0 0 0
0
2022
All dollar figures have been rounded to the nearest million.
00
5
2021
58%
00
0
10+58+257n 28+19+449n 30+60+10n ISLAND-WIDE Q3 2026 SALES
Through Third Quarter 2021 - 2026
30%
HOMESITES SOLD = 10*
60%
< $1M = 3
$1M - $1.99M = 6
> $2M = 1
*Excludes Bulk Sales
Kiawah Island Property Report | January - September 2026 Results KIAWAH ISLAND REAL ESTATE SALES DATA President Dan Whalen's Note:
KIAWAH ISLAND
Kiawah Island Real Estate (KIRE) closed 165 properties totaling $573 million through Q3, representing 76% of the Island’s total sales volume. Compared to the same period last year, KIRE closed nearly an nearly identical number of properties, while dollar volume increased by $69 million year-over-year, reflecting continued appreciating property values.
REAL ESTATE'S HISTORY
Single-family home inventory remains limited at just two and a half months of supply, well below the five to seven months typically associated with a balanced market. Demand for properties above $5 million remains strong, with six KIRE closings in September alone. Through the third quarter, KIRE has closed 37 of the 42 Island-wide transactions in this price range. Constrained inventory continues to create favorable conditions for sellers, with the potential for even further property value appreciation if supply remains limited. For property owners considering selling, our team can help navigate current market conditions, evaluate your property’s value, and develop a tailored marketing approach. Please don’t hesitate to reach out to us with any questions.
CLOSED TRANSACTIONS BY SELLING AGENCY
OF CLOSING ACTIVITY THROUGH Q3 YEAR
PROPERTIES
DOLLAR VOLUME
2 026
16 5
$ 573 M
2 02 5
16 6
$ 5 04 M
2 02 4
2 42
$ 674 M
2 023
188
$468M
2 02 2
21 8
$434M
2 021
372
$ 5 49M
2 02 0
255
$ 3 42 M
2 019
13 5
$142 M
2 01 8
137
$1 8 0 M
2 017
147
$173 M
2 016
16 0
$198 M
2 01 5
1 57
$2 29M
2 014
13 6
$16 4 M
2 013
155
$170 M
Through Third Quarter 2026* Property Type
KIRE
AE
PHX
CAR
ADDL O/S
TOTAL
HOMES
97
14
11
1
9
132
< $2M
6
3
4
0
2
15
$2M - $4.99M
54
11
4
1
5
75
$5M - $9.99M
30
0
3
0
1
34
> $10M
7
0
0
0
1
8
HOMESITES
23
0
2
1
6
32
< $1M
9
0
2
1
5
17
$1M - $1.99M
11
0
0
0
1
12
> $2M
3
0
0
0
0
3
VILLAS & COTTAGES*
44
21
2
1
14
82
1 Bedroom
17
7
0
0
6
30
2 Bedroom
15
9
0
0
4
28
3 Bedroom
8
4
1
1
4
18
4 Bedroom+
4
1
1
0
0
6
Total Closed Transactions
164
35
15
3
29
246
*Excludes Timbers Kiawah Sales. KIRE: Kiawah Island Real Estate, AE: Akers Ellis, PHX: Pam Harrington Exclusives, CAR: Carolina One, ADDL O/S: Additional Outside Sales
1 Kiawah Island Parkway • Kiawah Island, SC 29455 | k i a w a h i s l a n d . c o m | 8 4 3 . 396 . 1 5 2 2 Please email RealEstateInfo@Kiawah.com with any questions or to request clarification. Data was accumulated from property waivers submitted to Kiawah Partners and supplemented by other reliable sources including Charleston County property tax records.