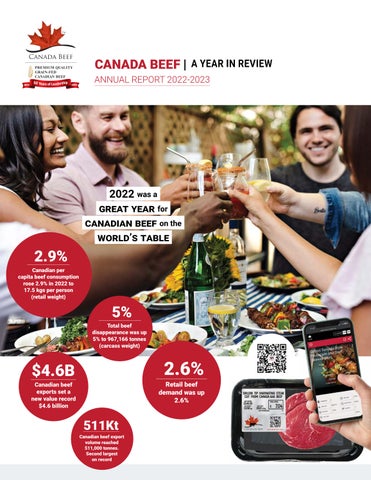
4 minute read
market performance indicators

canadian retail beef demand index (index 2000=100) canadian beef & veal exports, top ten unit value markets 2012 vs 2022
Canadian Beef
Advertisement
Demand
Canadian Beef & Veal Exports, Top Ten Unit Value Markets
Canadian Beef & Veal Exports, Top Ten Unit Value Markets
Canadian Beef & Veal Exports, Top Ten Unit Value Markets
Canadian Beef & Veal Exports, Top Ten Unit Value Markets
Total Beef and Veal Imports by Volume Canadian Beef and Veal Domestic Disappearance vs Export 22 22 12 13 14 15 16 17 18 19 20 21
Canadian Beef & Veal Exports, Top Ten Unit Value Markets
Netherlands
Total
Total Beef and Veal Imports by Volume Canadian Beef and Veal Domestic Disappearance vs Export 12 13 14 15 16 17 18 19 20 21 canadian beef & veal domestic disappearance vs export canadian beef & veal exports, top ten markets by volume 2012 vs 2022
Canadian Beef & Veal Exports, Top Ten Volume Markets
Canadian Beef & Veal Exports, Top Ten Volume Markets
Canadian Beef & Veal Exports, Top Ten Volume Markets
US JapanMexicoSouthKorea VietnamHongKongPhilippines AngolaSaudiArabia Taiwan
Netherlands US JapanMexicoSouthKorea VietnamHongKongPhilippines AngolaSaudiArabia Taiwan
Top
Top 12 Markets
12 13 14 15 16 17 18 19 20 21 22 Source: Canfax Source: Statistics Canada, AAFC Source: Statistics Canada, AAFC Source: Statistics Canada Source: Statistics Canada Source: Statistics Canada ‘000 tonne ‘000 tonne $/kg ‘000 tonne 0 30 60 90 120 150 22 0 30 60 90 120 150 FRESH/CHILLED FROZEN PROCESSED 12 13 14 15 16 17 18 19 20 21 22 DOMESTIC DISAPPEARANCE EXPORTS 0 500 1,000 1,500 2,000 0 5 10 15 20 25 2012 2022 2012 2022 2021 2022 0 50 100 150 200 250 300 350 400 CHUCK LOIN BRISKET FLANK/PLATE HIP RIB 30% 19% 7% 13% 8% 23% 23% 30% 21% 7% 12% 7% 2012-2022 Canadian Beef Demand Index
Total Beef and Veal Imports by Volume Canadian Beef and Veal Domestic Disappearance vs Export 22 22 12 13 14 15 16 17 18 19 20 21 Netherlands US JapanMexicoSouthKorea VietnamHongKongPhilippines AngolaSaudiArabia Taiwan SaudiArabia Italy SwedenLuxembourg Spain BelgiumSwitzerland France Iraq 12 13 14 15 16 17 18 19 20 21 22 Source: Canfax Source: Statistics Canada, AAFC Source: Statistics Canada, AAFC Source: Statistics Canada Source: Statistics Canada Source: Statistics Canada 22 ‘000 tonne ‘000 tonne $/kg ‘000 tonne 0 30 60 90 120 150 22 0 30 60 90 120 150 FRESH/CHILLED FROZEN PROCESSED 12 13 14 15 16 17 18 19 20 21 22 DOMESTIC DISAPPEARANCE EXPORTS 0 500 1,000 1,500 2,000 0 5 10 15 20 25 2012 2022 2012 2022 2021 2022 0 50 100 150 200 250 300 350 400 CHUCK LOIN BRISKET FLANK/PLATE HIP RIB 30% 19% 7% 13% 8% 23% 23% 30% 21% 7% 12% 7% 2012-2022 Canadian Beef Demand Index
12 Markets exports by primal cuts based on value, top 10 markets 2021 vs 2022
Exports
12 13 14 15 16 17 18 19 20 21 22 Source: Canfax Source: Statistics Canada, AAFC Source: Statistics Canada, AAFC Source: Statistics Canada Source: Statistics Canada Source: Statistics Canada ‘000 tonne ‘000 tonne $/kg ‘000 tonne 0 30 60 90 120 150 22 0 30 60 90 120 150 FRESH/CHILLED FROZEN PROCESSED 12 13 14 15 16 17 18 19 20 21 22 DOMESTIC DISAPPEARANCE EXPORTS 0 500 1,000 1,500 2,000 0 5 10 15 20 25 2012 2022 2012 2022 2021 2022 0 50 100 150 200 250 300 350 400 CHUCK LOIN BRISKET FLANK/PLATE HIP RIB 30% 19% 7% 13% 8% 23% 23% 30% 21% 7% 12% 7% Canadian Beef Demand Index
12 13 14 15 16 17 18 19 20 21 22 Source: Canfax Source: Statistics Canada, AAFC Source: Statistics Canada, AAFC Source: Statistics Canada Source: Statistics Canada Source: Statistics Canada ‘000 tonne ‘000 tonne $/kg ‘000 tonne 0 30 60 90 120 150 22 0 30 60 90 120 150 FRESH/CHILLED FROZEN PROCESSED 12 13 14 15 16 17 18 19 20 21 22 DOMESTIC DISAPPEARANCE EXPORTS 0 500 1,000 1,500 2,000 0 5 10 15 20 25 2012 2022 2012 2022 2021 2022 0 50 100 150 200 250 300 350 400 CHUCK LOIN BRISKET FLANK/PLATE HIP RIB 30% 19% 7% 13% 8% 23% 23% 30% 21% 7% 12% 7% Canadian Beef Demand Index
Total Beef and Veal Imports by Volume Canadian Beef and Veal Domestic Disappearance vs Export 12 13 14 15 16 17 18 19 20 21 Netherlands US JapanMexicoSouthKorea VietnamHongKongPhilippines AngolaSaudiArabia Taiwan SaudiArabia Italy SwedenLuxembourg Spain BelgiumSwitzerland France Iraq 12 13 14 15 16 17 18 19 20 21 22 Source: Canfax Source: Statistics Canada, AAFC Source: Statistics Canada, AAFC Source: Statistics Canada Source: Statistics Canada Source: Statistics Canada ‘000 tonne ‘000 tonne $/kg ‘000 tonne 0 30 60 90 120 150 22 0 30 60 90 120 150 FRESH/CHILLED FROZEN PROCESSED 12 13 14 15 16 17 18 19 20 21 22 DOMESTIC DISAPPEARANCE EXPORTS 0 500 1,000 1,500 2,000 0 5 10 15 20 25 2012 2022 2012 2022 2021 2022 0 50 100 150 200 250 300 350 400 CHUCK LOIN BRISKET FLANK/PLATE HIP RIB 30% 19% 7% 13% 8% 23% 23% 30% 21% 7% 12% 7% CANADA BEEF
12 Markets
Michael Shittu Vice President, Finance and Operations
TOTAL REVENUE $13,390,11 1
TOTAL REVENUE $13,390,111
GOVERNMENT OF CANADA CAP $1,714,665
DOMESTIC BEEF CHECK-OFF: TRANSFERS FROM AGENCY MARKETING $9,648,412
AMORTIZATION OF DCC $203,657
GOVERNMENT OF ALBERTA EMD $275,577
IMPORT LEVIES $1,127,288
PUBLIC AND STAKEHOLDER ENGAGEMENT $248,920
OTHER INCOME: $171,592
TOTAL EXPENSES $13,554,223
MARKETING: GENERIC BEEF $1,370,223
TOTAL EXPENSES $13,554,223
PUBLIC AND STAKEHOLDER ENGAGEMENT $335,704
BEEF CHECK-OFF BOARD OF DIRECTORS
(MARKETING COMMITTEE) $28,348
MARKETING: BRANDED BEEF $11,819,948
These charts represent information from the 2022/2023 audited financial statement of the Canadian Beef Cattle Research, Market Development and Promotion Agency.
Generic Export Program Investment By Market
EMERGING MARKETS $171,619 (PROJECTS 11)
JAPAN $849,691 (PROJECTS 37)
MEXICO & LATIN AMERICA $695,208 (PROJECTS 43)
SOUTH KOREA $341,169 (PROJECTS 18)
CHINA & HONG KONG $254,882 (PROJECTS 25)
TAIWAN & SOUTHEAST ASIA $317,030 (PROJECTS 17)
JAPAN $42,657 (PROJECTS 10 )
EUROPE $82,821 (PROJECTS 10 )
SOUTHEAST ASIA $102,487 (PROJECTS 8)
MEXICO $52,628 (PROJECTS 2) stay connected with canada beef
Canada Beef is committed to keeping producers and stakeholders informed about the domestic and international market development and promotion activities undertaken to increase demand for Canadian beef while ensuring the maximum value for producer dollars.
Here are two ways to help you stay connected:
Canada Beef Performs
Subscribe to our free monthly e-newsletter delivered directly to your inbox. You’ll learn about:
• International market statistics, and updates and information on tradeshows, promotions and events
• Domestic market updates including activities and resources
• Canadian Beef Centre of Excellence news and developments

• Digital and Consumer marketing team project updates and information
• Health and Nutrition team news and developments
Subscribe today at www.canadabeef.ca/canadabeefperforms
CDNBEEFPERFORMS.CA
The Canadian Beef Performs website provides information for meat professionals in the retail, foodservice and processing sectors. Check out Canadian Beef Information Gateway updates, industry statistics, and cooking and cutting videos for home and professional chefs and butchers, courtesy of Canada Beef and the Canadian Beef Centre of Excellence.