5 minute read
An analysis of key barriers to health care access based on experiences


In the following table, red numbers indicate the top three specialties identified in each county
categorization.
Table 19. Most Needed Specialties by County Categorization – Healthcare Responses
Frontier Rural DenselySettled Rural SemiUrban Urban Total
Cardiology Dentistry General Surgery Family Practice/Primary Care
29.7% 21.6% 17.1% 16.0% 13.9% 42 18.8% 5.4% 17.1% 16.0% 22.2% 32 15.6% 24.3% 17.1% 12.0% 11.1% 32
12.5% 29.7% 22.9% 20.0% 11.1% 36
Hematology Internal Medicine
1.6% 0.0% 2.9% 4.0% 0 3 3.1% 21.6% 0.0% 8.0% 8.3% 15
Nephrology
9.4% 13.5% 5.7% 16.0% 5.6% 19 Neurology 7.8% 13.5% 22.9% 28.0% 2.8% 26 Obstetrics & Gynecology 15.6% 16.2% 25.7% 20.0% 13.9% 35 Oncology 17.2% 16.2% 8.6% 4.0% 5.6% 23 Ophthalmology 6.3% 0.0% 5.7% 8.0% 2.8% 9 Pediatrics 7.8% 16.2% 14.3% 0.0% 8.3% 19 Podiatry 9.4% 8.1% 0.0% 12.0% 5.6% 14 Rehabilitation Therapy 4.7% 10.8% 5.7% 12.0% 8.3% 15
None of these specialties
6.3% 0.0% 2.9% 4.0% 0.0% 6
are offered Total in each group 64 37 35 25 36
Note: Percentages are reflective of the percent of respondents from a given county categorization; not the percentage based on the total number of respondents for each prompt.
An analysis of key barriers to health care access based on experiences
Not having some specialties available (46.2%) was indicated most often by healthcare respondents as
being the biggest barrier to accessing care for their patient, followed by transportation (29.4%). Other
barriers that came up were related to workforce challenges and costs.
Table 20. Barriers to Accessing Care – Healthcare Respondents
Barriers
Some specialties are not available in our facility Transportation to our location Interpretation Services are not always available
Percent Respondents
46.2%
29.4% 15.7%
The number of physicians available to take appointments Hours of Operation Some patients have insurance that we do not accept It is difficult to get an appointment (e.g., length of time from scheduling to actual appointment date) Sliding scale payment options are not available 15.2%
13.2% 12.2%
9.6%
1.5%
Other, please specify 9.1%
Table 21. Other Barriers to Accessing Care – Healthcare Respondents (n=13)
Barriers
Workforce challenges (lack of other providers, no doctor on staff, etc.)
Percent Respondents
23.1%
Cost 23.1%
Distance/transportation Lack of funding Lack of broadband coverage Patients not showing up for scheduled appointments and losing that time for other patients Some clients are not within the county we serve 15.4% 7.7% 7.7%
7.7%
7.7%
Difficulty in scheduling with preferred provider, others available sooner 7.7% Rural attitude about preventative care 7.7% No money from Medicaid for the waiting list 7.7% Telehealth, particularly for mental health, was facilitated via waivers during COVID, however, has since contracted 7.7% Lack of insurance 7.7% Knowledge deficits 7.7% Other unknown reasons 7.7%
Spanish was the language most commonly spoken within healthcare facilities (76.6%), which is
consistent with Census data. Other languages mentioned (n=21) include American Sign Language (n=4),
Burmese (n=3), Filipino (n=3), and Somali (n=3). Other languages with two or fewer responses included:
Low German, Guatemalan, Polish, Chuukese, Samoan, Nepali, and Marshall Islands.
Table 22. Top languages other than English that are used/spoken most often within healthcare facilities.
Percent Respondents
Spanish Vietnamese 76.6% 10.2%
German Arabic Korean Swahili Chinese French Russian Hindi Tagalog Laotian Other, please specify 9.6% 5.1% 3.0% 3.0% 1.5% 1.5% 1.0% 0.5% 0.5% 0.5% 12.2%
Given that language is a persistent barrier mentioned related to accessing care, healthcare respondents
were asked about the amount of material provided to patients in other languages. Most respondents answered, “most of them” (32.0%) or “some of them” (29.4%). When asked about the top methods used to meet the interpretation/translation needs of patients with language barriers, over half (58.9%) of respondents indicated using phone/video line interpretation services.
2.0% 29.4% 32.0% 10.7% 5.6%
None of them Some of them Most of them All of them Provided upon request
Amount of Patient Resources Provided in More Than One Language (N=157)
Phone/video line interpretation
Patient brings their own interpreter
Bilingual staff pulled from another position 58.9%
38.6%
34.5%
Respondents were also asked about materials being provided in braille, and over half (55.3%) indicated
that none of their materials were provided in braille. “Barriers related to written communication are
ultimately associated with lower quality of care and poor health outcomes (CMS Office of Minority
Health, n.d).” Accessibility for patients who are visual-impaired is important for health equity and
promoting inclusion. Providing documents in an accessible format can empower patients in their
healthcare experiences and decision making.
55.3% 14.2% 1.5% 0.0% 8.1%
None of them Some of them Most of them All of them Provided upon request
Video line sign language interpreters or personal interpreters were among the top methods used to
meet the needs of deaf, hard of hearing, or nonverbal patients.
Top three methods of meeting interpretation/translation needs for those who are deaf, hard of hearing, or nonverbal
Video line sign language interpreter 31.0%
Patient brings their own interpreter
Contract with a sign language interpreter 17.3% 31.0%
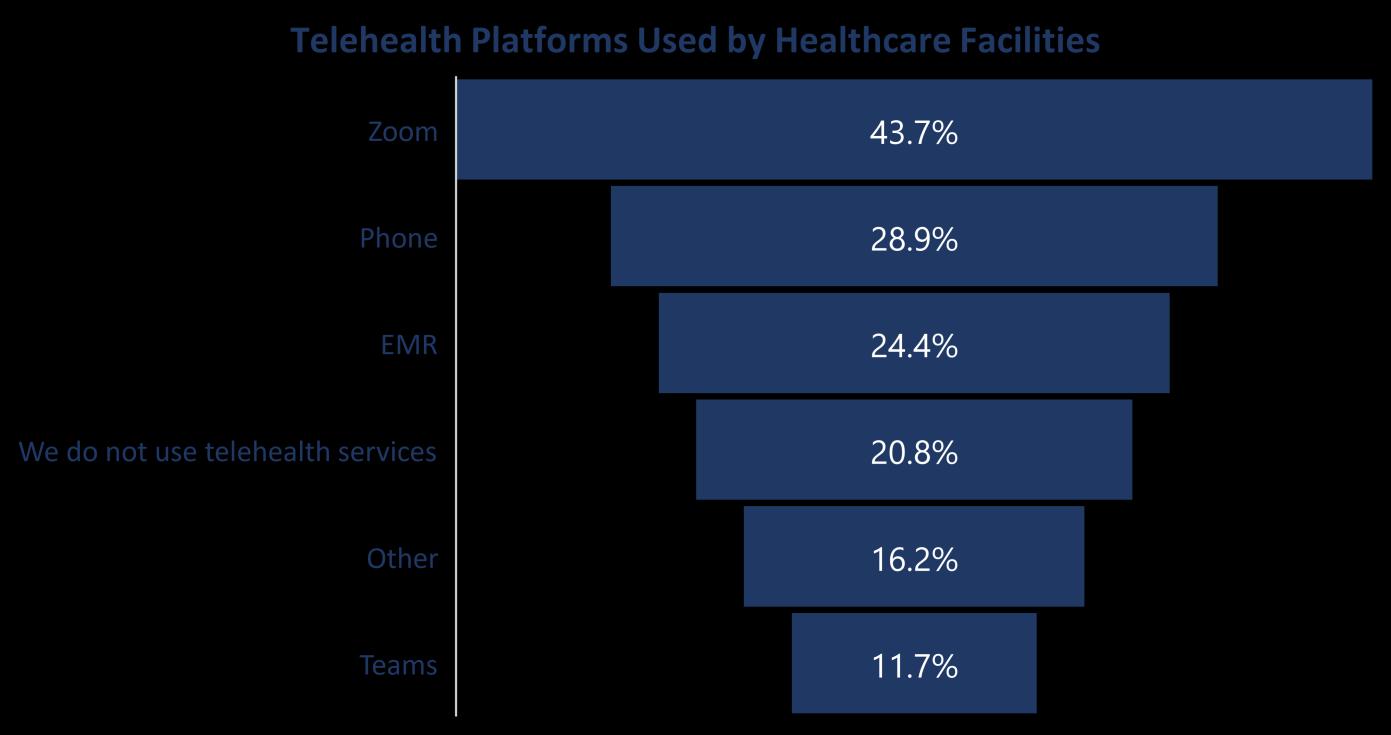
Telehealth
Most of the telehealth services provided by participating healthcare respondents were provided using
Zoom (43.7%) or Phone (28.9%). About a quarter of respondents (24.4%) mentioned using EMR
platforms (n=29). EMR platforms identified include: EClinical Works (58.9%, n=17), Cerner (27.6%, n=8),
Athena Health (24.1%, n=7), Azalea Health (13.8%, n=4), and EPIC (6.9%, n=2). Aprima, Doxy.me, Intergy
by Greenway, Meditech, and Suncoast all had 1 response each or 0.5% of responses. The platforms
mentioned most often included FreeState, Doxy, Google Meet, and Facetime, all receiving 10.3% of
responses. Other responses included: Updox, Star Leaf, and V See. Additional Telehealth data is included
in the next section of this report.