4 minute read
Gini Coefficient and The Lorenz Curve | Q


Y S A E U Q Q U E A S Y
Gini Coefficient and The Lorenz Curve
Advertisement
S o n i a W o n g
Gini coefficient is a measure of distribution of income across a population developed by an Italian statistician Corrado Gini in 1912. It is used to measure income inequality among a population (it can also be used to measure wealth inequality). The coefficient ranges from 0 to 1 (or 0% to 100%) with 0 representing perfect equality and 1 representing perfect inequality. As of 2020, South Africa had the highest income inequality, with a Gini coefficient of 0.63, whereas Slovakia had the lowest income inequality, with a Gini coefficient of 0.23.
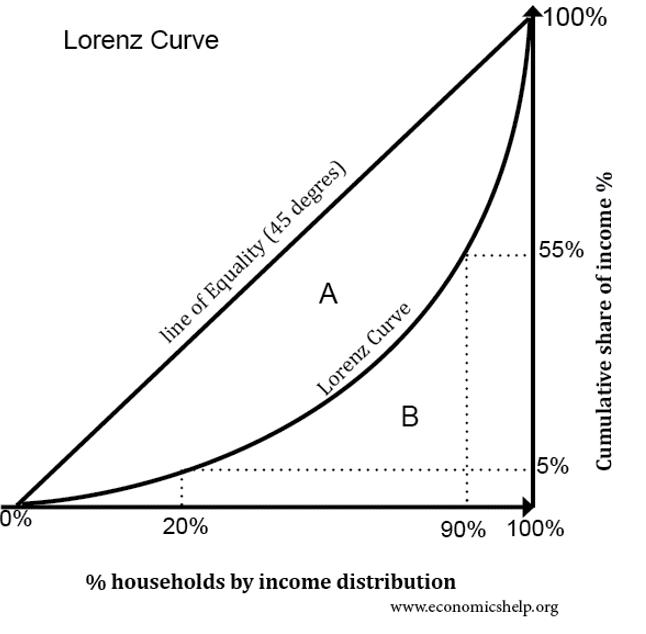
The Gini coefficient is based on the Lorenz Curve, and was developed by an American economist Max Lorenz in 1905. The Lorenz curve is a graphical representation of the cumulative income distribution. The % of households by income distribution (lowest income to highest) is plotted on the x-axis, and the cumulative % of income is plotted on the y-axis.
The Lorenz Curve
The Lorenz Curve shows the distribution of income (or wealth) among a given population and can be defined as if, the poorest 100x % of the population owns 100y % of the wealth, where
In a society where the distribution of income is perfectly equal, the Lorenz curve would approach the line.
So,
In the opposite extreme where one person in the society receives all the income, for all and . There is zero area under the
curve, so
Gini Coefficient
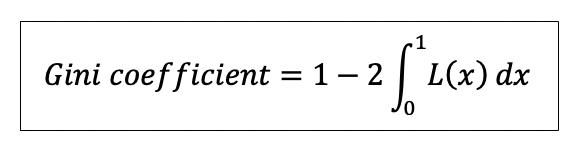
The Gini coefficient, G, is defined as the ratio of the area enclosed by the functions x and L(x) to the area of the large triangle under the curve
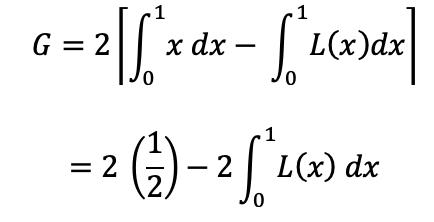
G can be expressed as
The denominator is the area of the triangle under
Therefore, the formula for G reads Arriving at the formula:
Gini Coefficient by Country
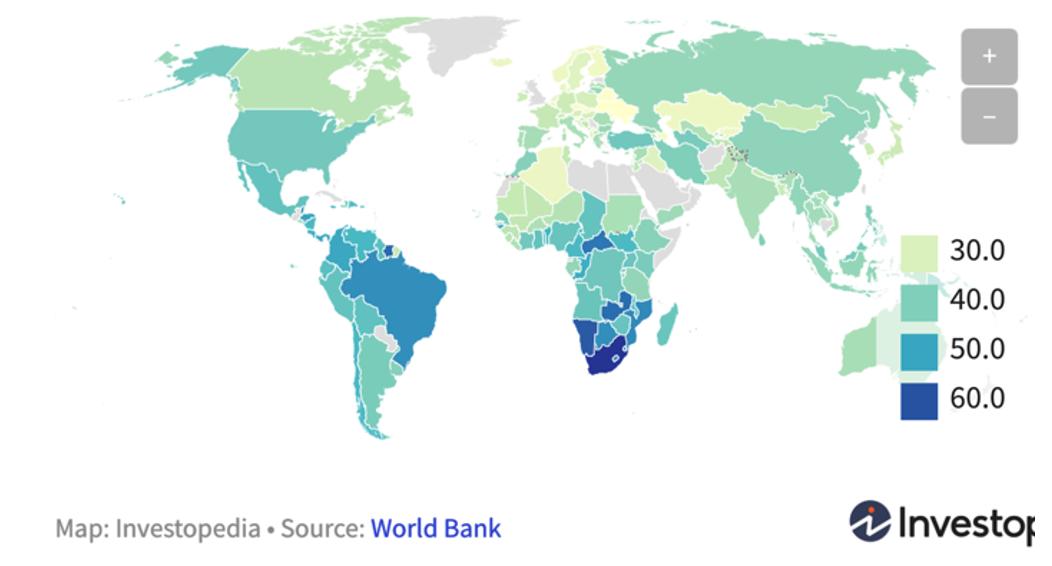
Some of the world’ s poorest country have some of the world’ s highest Gini coefficients, meaning high income inequality (e.g. Central African Republic has a Gini coefficient of 0.61). While many of the wealthiest high income country have some of the lowest Gini coefficient, meaning low income inequality (e.g. Denmark with a Gini coefficient of 0.29). However, there are also exceptions such as the USA which has a high GDP per capita, but also a relatively high Gini coefficient of 0.42.
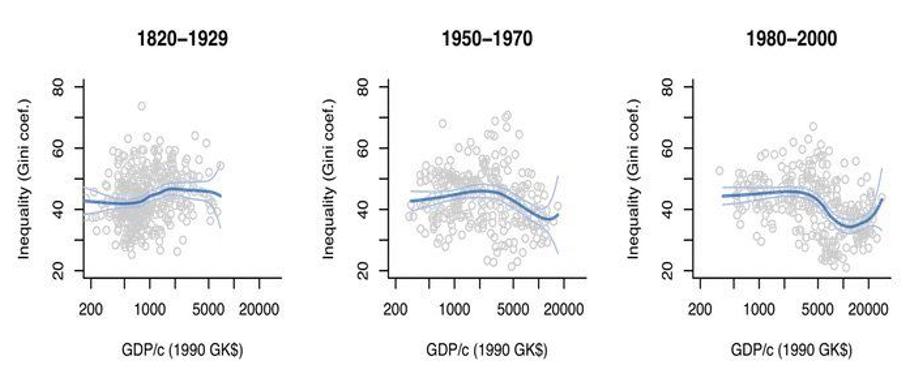
Therefore, the relationship between income inequality and GDP/capita is not perfectly negatively correlated. In fact, the relationship between these two factors has varied over time. According to Michail Moatsos of Utrecht University and Jeory Baten of Tuebingen University, inequality from 1820 to 1929 increased slightly then levelled off as GDP per capita rose above a certain threshold. Then, from 1980 to 2000, inequality decreased with higher GDP per capita, but then curved back up sharply.
Limitations of the Gini Coefficient
The accuracy of the Gini coefficient depends on the reliability of GDP and income data. Usually, GDP and income data is never absolutely accurate as informal economies are present which are not accounted. The accuracy also depends on the level of development of a country as the informal sector tends to be more prominent and represent a larger proportion (almost 90% of employment) of the true economic production in developing, low income countries. This means that the Gini coefficient of measured incomes will overstate true income inequality.
Another limitation of the Gini coefficient is that it does not reveal other information about the data. Information such as the distribution of incomes across age, race, or social group and demographic changes of the population are not reflected. Countries with high dependency ratios: high numbers of elderly people with main sources of income as pensions or high numbers of student are likely to have higher levels of income inequality as measured by the Gini coefficient. Furthermore, since Gini coefficient is a relative measure, it fails to capture absolute differences in income. It is possible therefore for the Gini coefficient of a country to rise due to increasing income inequality among the population, while there is actually a decrease in the number of people in extreme poverty.
Overall, while the Gini coefficient, does have limitations that may affect its reliability and accuracy, it serves as a very useful universal measure for income inequality, allowing comparisons between countries around the world.
Written by Sonia Wong
References:
http://chanoir.math.siu.edu/courses/140/Gi niIndex.pdf https://corporatefinanceinstitute.com/reso urces/knowledge/economics/ginicoefficient/ https://www.maa.org/sites/default/files/pdf /upload _ library/2/Jantzen-2013.pdf https://corporatefinanceinstitute.com/reso urces/knowledge/economics/ginicoefficient/ http://www.hsrc.ac.za/en/review/hsrcreview-november-2014/limitations-of-giniindex https://www.investopedia.com/terms/g/gi ni-index.asp 14