
8 minute read
Non fatal injuries


Work-related injuries
The Labour Force Survey is HSE’s preferred data source for non-fatal injuries. The latest estimates show that in Construction there were: • 61,000 cases of non-fatal work-related injury • 27% resulted in an over seven days absence
Advertisement
Source: LFS, estimated annual average 2017/18-2019/20
Construction compared to industries with similar work activities
Source: LFS, estimated annual average 2017/18-2019/20 • Around 2.8% of workers in this sector suffered from an injury. • This is statistically
significantly higher
than the all industry rate.
Changes over time

Source: LFS, grouped by 3 years, estimate annual average 2002/03 – 2019/201
Work-related injuries
Supporting information around work-related injuries is available from RIDDOR reporting#. In Construction there were: • 4,526 non-fatal injuries to employees reported by employers under RIDDOR in 2019/20p. • 1,663 (37%) were specified injuries## and 2,863 (63%) were over seven-day injuries.
Source: RIDDOR, 2019/20
Main accident kinds for the latest three years (2017/18 – 2019/20)
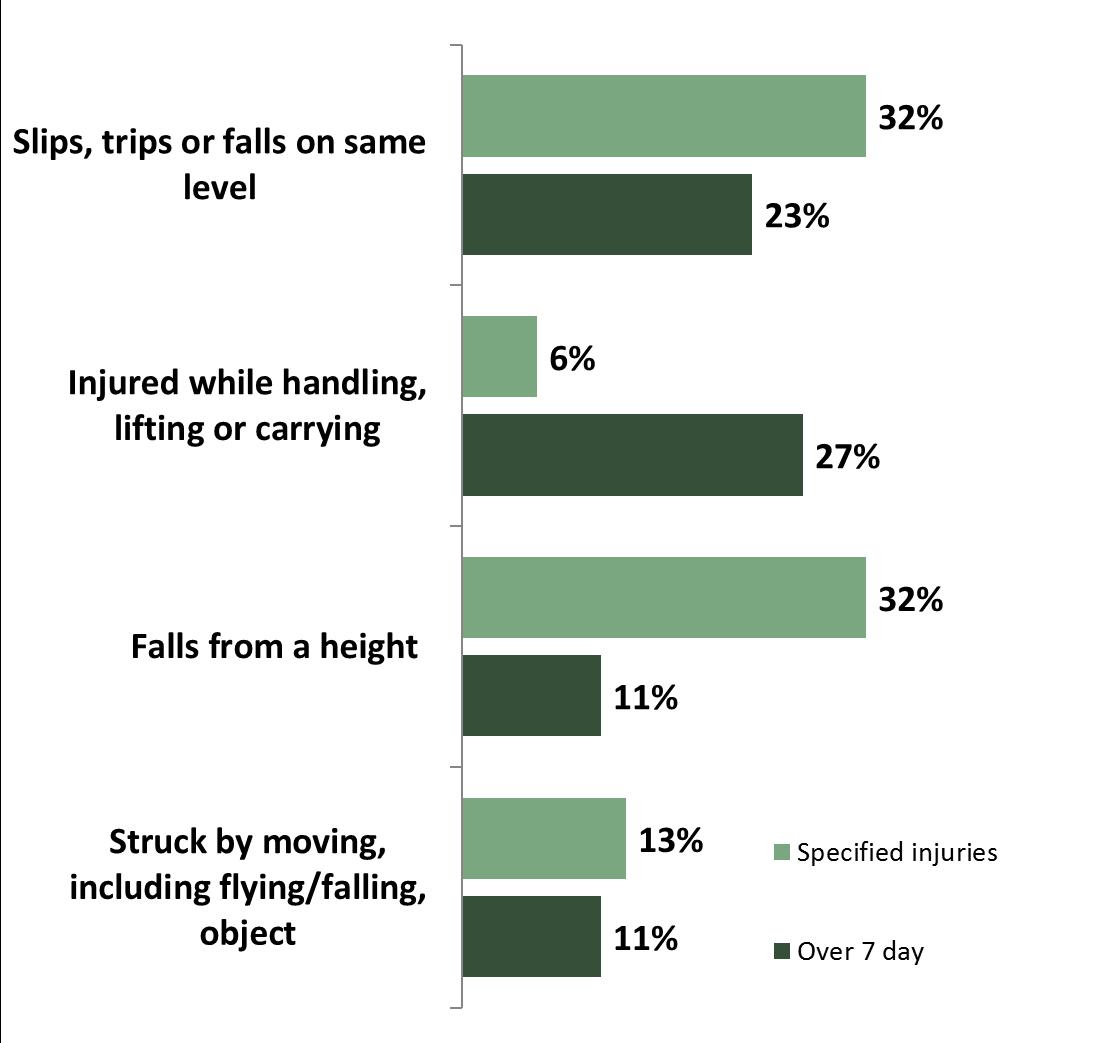
Source: RIDDOR, 2017/18 - 2019/20. #The LFS gives the best indication of the scale of workplace injury within the sector. RIDDOR provides additional information for non-fatal injuries but needs to be interpreted with care since it is known that non-fatal injuries are substantially under-reported, especially for the self-employed. Possible variations in reporting rates both between industries and over time make comparisons difficult. However, RIDDOR can be used for analysis at a detailed level not available through the LFS, for example, around the kind of incident. ##For the full list of specified injuries, see www.hse.gov.uk/riddor/reportable-incidents.htm
Workplace risks
European Union Occupational Health Agency survey 2014#
Percentage of workplaces in the Construction sector reporting the presence of workplace risks##

• Physical risks were more commonly reported than pyschosocial risks • !lthough ‘machines or tools’ was the top risk, accidents with machinery account for between 2-6% of reported fatal and non-fatal injuries • The main psychosocial risks related to dificult customers and time pressure
# A 2014 survey, commissioned by the European Union Occupational Safety and Health Agency (in collaboration with the Health and Safety Executive), explored the extent that various risks are present in the workplace (regardless of whether the risk is under control), as reported by the person who knows most about safety and health in the workplace. The chart shows the extent of these various risk factors in workplaces in the Agriculture, forestry and fishing sector in the UK. Full details of the UK results, including measures of how risks are managed within the sector can be found at www.hse.gov.uk/statistics/oshman.htm. The source is known as ESENER 2014 ## For workplaces with five or more employees reporting the presence of various workplace risks, regardless of whether risk is under control.
Economic cost of workplace injury and new cases of work-related ill health in Construction
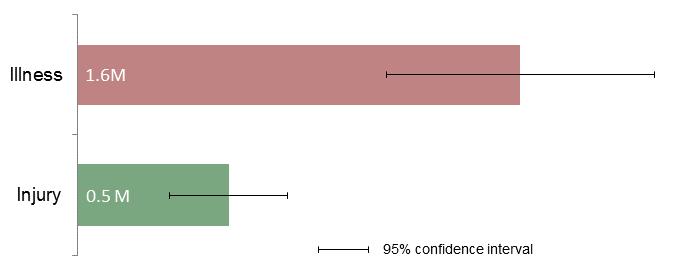
Source: HSE Costs to Britain, 2018/19. • The total cost in 2018/19 is estimated at £1.2 billion,

(95% confidence interval £963 M – £1,476 M) • This accounts for 8% of the total cost across all industries
Workplace injury and ill health impose costs: both financial (for example in terms of lost output and healthcare costs) and non-financial (the monetary valuation of the human cost of injury and illness in terms of loss of quality of life, and for fatalities, loss of life). Taken together, this gives the total economic cost to society. This cost is shared between individuals, employers and government/taxpayers.
Working days lost
Source: LFS, estimated annual average 2017/182019/20 In Construction around 2.1 million working days (full-
day equivalent) were lost each year between 2017/18 and 2019/20 due to: • workplace injury (25%) and • work-related illness (75%).
• That is equivalent to around 0.97 working days lost per worker and is not significantly different to the average days lost per worker across all industries (0.98 days).
Enforcement notices issued by HSE to businesses in this Sector, 2019/20p
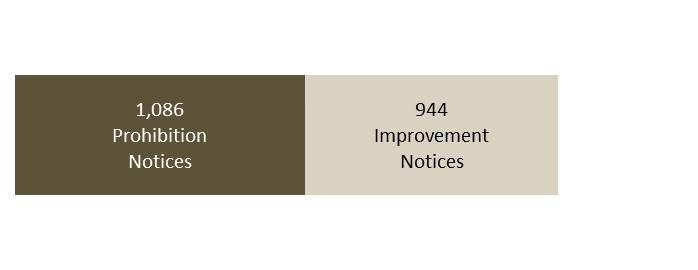
In 2019/20p there was 1 additional deferred prohibition notice which is not included in the above
Provisional figures for 2019/20p show a total of 2,031 notices issued by HSE inspectors in Construction. • Prohibition notices issued in the Construction Sector account for around 56% of the total prohibition notices issued by HSE in 2019/20p • There has been a decrease in the number of notices issued compared to the previous year (2,969 in 2018/19).
There were 143 prosecution cases# led by HSE or, in Scotland, the Crown Office and Procurator Fiscal where a verdict was reached in 2019/20p, resulting in: • 137 (96%) with a conviction for at least one offence; • £8.3 million in total fines averaging over £60,000 per conviction. o In 2018/19 there were 157 cases resulting in 146 convictions (93%); this led to £18.5 million total fines and average fines of around £126,000.
Source: HSE Enforcement Data
HSE and local authorities are responsible for enforcing health and safety legislation. For the most serious offences, inspectors may serve improvement notices and prohibition notices and they may prosecute (or in Scotland, report to the Crown Office and Procurator Fiscal Service (COPFS) with a view to prosecution).
#Cases refer to a prosecution against a single defendant. The defendant may be an individual person or a company. There may be one or more breach of health and safety legislation (offences) in each case.
The Labour Force Survey (LFS): The LFS is a national survey run by the Office for National Statistics of currently around 33,000 households each quarter. HSE commissions annual questions in the LFS to gain a view of self-reported workrelated illness and workplace injury based on individuals’ perceptions. The analysis and interpretation of these data are the sole responsibility of HSE. • Self-reported work-related illness: People who have conditions which they think have been caused or made worse by their current or past work, as estimated from the LFS. Estimated total cases include long-standing as well as new cases. New cases consist of those who first became aware of their illness in the last 12 months. • Self-reported injuries: Workplace injuries sustained as a result of a non-road traffic accident, as estimated by the LFS. Specialist physician surveillance schemes (THOR): Cases of work-related respiratory and skin disease are reported by specialist physicians within The Health and Occupation Reporting network (THOR) surveillance schemes. Ill health assessed for disablement benefit (IIDB): New cases of specified ‘prescribed diseases’ (with an established occupational cause) assessed for compensation under the Industrial Injuries Disablement Benefit scheme. RIDDOR: The Reporting of Injuries, Diseases and Dangerous Occurrences Regulations, under which fatal and defined non-fatal injuries to workers and members of the public are reported by employers. Certain types of work-related injury are not reportable under RIDDOR, hence excluded from these figures. Particular exclusions include fatalities and injuries to the armed forces and injuries from work-related road collisions. HSE Costs to Britain Model: Developed to estimate the economic costs of injury and new cases of ill health arising from current working conditions. The economic cost estimate includes estimates of financial (or direct) costs incurred (either in terms of payments that have to be made or income/output that is lost) and the monetary valuation of the impact on quality and loss of life of affected workers.
HSE Enforcement data: The main enforcing authorities are HSE and local authorities. In Scotland, HSE and local authorities investigate potential offences but cannot institute legal proceedings and the Crown Office and Procurator Fiscal Service (COPFS) makes the final decision whether to institute legal proceedings and which offences are taken. Enforcement notices cover improvement, prohibition and deferred prohibition. Offences prosecuted refer to individual breaches of health and safety legislation; a prosecution case may include more than one offence. Where prosecution statistics are allocated against a particular year, unless otherwise stated, the year relates to the date of final hearing with a known outcome. They exclude those cases not completed, for example adjourned. Rate per 100,000: The number of annual workplace injuries or cases of work-related ill health per 100,000 employees or workers. 95% confidence interval: The range of values within which we are 95% confident contains the true value, in the absence of bias. This reflects the potential error that results from surveying a sample rather than the entire population.
Statistical significance: A difference between two sample estimates is described as ‘statistically significant’ if there is a less than 5% chance that it is due to sampling error alone.
For more information, see www.hse.gov.uk/statistics/sources.pdf
The data in this report can be found in the following tables:
Tables
Work-related illness
lfsillind THORR04 THORR05 THORS04 THORS05 CAN05 IIDB01 DC01 lfsillocc
Web Address (URL)
www.hse.gov.uk/Statistics/lfs/lfsillind.xlsx www.hse.gov.uk/Statistics/tables/thorr04.xlsx www.hse.gov.uk/Statistics/tables/thorr05.xlsx www.hse.gov.uk/Statistics/tables/thors04.xlsx www.hse.gov.uk/Statistics/tables/thors05.xlsx www.hse.gov.uk/Statistics/tables/can05.xlsx www.hse.gov.uk/Statistics/tables/iidb01.xlsx www.hse.gov.uk/Statistics/tables/dc01.xlsx www.hse.gov.uk/statistics/lfs/lfsillocc.xlsx
Workplace injuries
lfsinjind lfsinjocc RIDIND RIDKIND RIDHIST RIDFATAL www.hse.gov.uk/Statistics/lfs/lfsinjind.xlsx www.hse.gov.uk/statistics/lfs/lfsinjocc.xlsx www.hse.gov.uk/Statistics/tables/ridind.xlsx www.hse.gov.uk/Statistics/tables/ridkind.xlsx www.hse.gov.uk/Statistics/tables/ridhist.xlsx www.hse.gov.uk/Statistics/tables/ridfatal.xlsx
Costs to Britain of workplace injury and illness
COST_Tables1819 www.hse.gov.uk/Statistics/tables/costs_tables1819.xlsx
Enforcement
Notices Prosecutions www.hse.gov.uk/Statistics/tables/notices.xlsx www.hse.gov.uk/Statistics/tables/prosecutions.xlsx
Other tables can be found at:
www.hse.gov.uk/Statistics/tables/index.htm
National Statistics status means that statistics meet the highest standards of trustworthiness, quality and public value. They are produced in compliance with the Code of Practice for Statistics, and awarded National Statistics status following assessment and compliance checks by the Office for Statistics Regulation (OSR). The last compliance check of these statistics was in 2013.
It is Health and Safety Executive’s responsibility to maintain compliance with the standards expected by National Statistics. If we become concerned about whether these statistics are still meeting the appropriate standards, we will discuss any concerns with the OSR promptly. National Statistics status can be removed at any point when the highest standards are not maintained, and reinstated when standards are restored. Details of OSR reviews undertaken on these statistics, quality improvements, and other information noting revisions, interpretation, user consultation and use of these statistics is available from www.hse.gov.uk/statistics/about.htm
An account of how the figures are used for statistical purposes can be found at www.hse.gov.uk/statistics/sources.htm.
For information regarding the quality guidelines used for statistics within HSE see www.hse.gov.uk/statistics/about/quality-guidelines.htm
A revisions policy and log can be seen at www.hse.gov.uk/statistics/about/revisions/ Additional data tables can be found at www.hse.gov.uk/statistics/tables/.
General enquiries: Statistician Arran.Cleminson@hse.gov.uk
Journalists/media enquiries only: www.hse.gov.uk/contact/contact.htm
© Crown copyright If you wish to reuse this information visit www.hse.gov.uk/copyright.htm for details. First published 11/20
