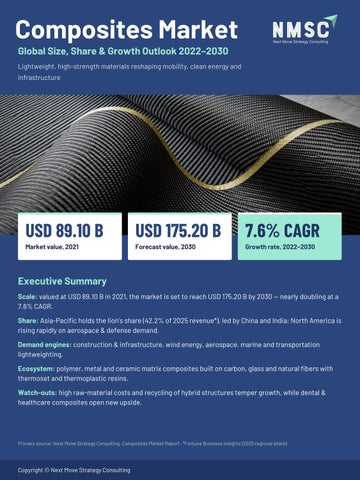
Composites Market Global Size, Share & Growth Outlook 2022–2030 Lightweight, high-strength materials reshaping mobility, clean energy and infrastructure
USD 89.10 B
USD 175.20 B
7.6% CAGR
Market value, 2021
Forecast value, 2030
Growth rate, 2022–2030
Executive Summary Scale: valued at USD 89.10 B in 2021, the market is set to reach USD 175.20 B by 2030 — nearly doubling at a 7.6% CAGR. Share: Asia-Pacific holds the lion’s share (42.2% of 2025 revenue*), led by China and India; North America is rising rapidly on aerospace & defense demand. Demand engines: construction & infrastructure, wind energy, aerospace, marine and transportation lightweighting. Ecosystem: polymer, metal and ceramic matrix composites built on carbon, glass and natural fibers with thermoset and thermoplastic resins. Watch-outs: high raw-material costs and recycling of hybrid structures temper growth, while dental & healthcare composites open new upside.
Primary source: Next Move Strategy Consulting, Composites Market Report · *Fortune Business Insights (2025 regional share)
Copyright © Next Move Strategy Consulting
Market Landscape A USD 175 B opportunity by 2030 — demand nearly doubles at a 7.6% CAGR Market Size (USD Billion)
Regional Share, 2025*
Global composites market, 2021 vs. 2030
Global revenue: USD 95.7 B
175.20
APAC 42.2%
42.2% APAC
+7.6% CAGR
N. America 29.7% Europe 23.3% MEA 3.1% LatAm 1.8%
89.10
Asia-Pacific · USD 40.4 B — largest and fastestgrowing region North America · USD 28.42 B — aerospace & defense pull Europe · USD 22.27 B — EV-led lightweighting
2021
2030
Segment Leaders — share of global revenue, 2026 estimate* By matrix
By manufacturing process
By application
Polymer matrix composites
Hand lay-up
Automotive
74.65%
52.50%
32.20%
Industry Ecosystem — from fiber to end-use 1 · Fibers Carbon fiber Glass fiber Natural fiber Others
2 · Resins Thermoset Polyester · Vinyl ester · Phenolic Thermoplastic SFT · LFT · CFT
3 · Processes Lay-up Filament winding Injection molding Pultrusion Compression molding Resin transfer molding
4 · Applications Transportation Aerospace & defense Wind energy Construction Electrical & electronics Pipes & tanks · Marine
Sources: Next Move Strategy Consulting (market size, CAGR, segmentation) · *Fortune Business Insights (2025 regional values, 2026 segment shares)
Copyright © Next Move Strategy Consulting
Growth Drivers & Opportunities Lightweighting, clean energy and infrastructure renewal compound demand Lightweighting in mobility CAFE and EU CO₂ rules push OEMs to composites; 100+ car models specify CFRP parts.
Aerospace & defense Over 50% of the Airbus A350 XWB is composite, vs. 2– 5% in older fleets.
High-Growth Segments — CAGR Aerospace composites 2025–30
12.0%
Automotive carbon-fiber composites 2025–33
8.9%
Carbon-fiber composites 2025–33
7.8%
Total composites market 2022–30
7.6%
Wind energy incentives Tax incentives favour carbon-fiber composites for long, slender turbine blades.
Infrastructure & marine Corrosion and rot resistance win in construction, water & sewage projects and yachts.
Regional Opportunity Map — market value 2025 (USD B)*, bubble size ∝ value
Europe
North America
Asia-Pacific
22.27
28.42
40.40
23.3%
29.7%
42.2%
EV lightweighting
Aerospace & defense pull Latin America 1.71 · 1.8%
Middle East & Africa 2.94 · 3.1%
Largest & fastest-growing
Country outlook, 2026 (USD B)*
U.S. 25.35
China 18.26
India 11.29
Germany 7.75
U.K. 5.95
Japan 5.17
Sources: Next Move Strategy Consulting; *Fortune Business Insights; MarketsandMarkets (aerospace composites); Grand View Research (carbon-fiber composites)
Copyright © Next Move Strategy Consulting
Competitive Scenario A fragmented field led by integrated fiber majors and specialty innovators Leading Companies
Competitive Positioning Matrix
End-market breadth: niche → broad industrial
VOLUME LEADERS
Toray Industries SGL Carbon SE Mitsubishi Chemical Dentsply Sirona
ADVANCED INTEGRATORS Toray Industries
Owens Corning
Teijin
Hexcel
IDC Composite International Inc. Zeus Industrial Products Inc.
Mitsubishi Chemical SGL Carbon
Owens Corning The 3M Company Royal DSM N.V. Kulzer GmbH
Syensqo
Also profiled*: Teijin, Hexcel, Syensqo (Solvay), Huntsman
REGIONAL FABRICATORS
SPECIALTY INNOVATORS
Exel Group
The 3M Company Dentsply Sirona
Veplas
Kulzer
Market Structure Fragmented overall — global and regional players compete on R&D and long-term supply contracts. Carbon fiber is concentrated — precursor capex
Technology intensity: general-purpose → high-performance
and aerospace certification raise entry barriers.
Indicative, qualitative positioning based on portfolio and end-market focus
Key Strategies — expansion, partnerships & M&A, product innovation Capacity Expansion
Partnerships & M&A
Product Innovation
JUL 2023
JAN 2019
OCT 2020
Toray adds 74,000 sq ft at its
Teijin extends carbon-fiber supply
Morgan Hill, CA site
to Bombardier for the A220 until
shade-matching composites
OCT 2023
2025
DEC 2023
Toray expands carbon-fiber
SEP 2019
Teijin launches Tenax carbon fiber
capacity in France
INEOS acquires Ashland’s entire
from ISCC PLUS-certified
composites business
sustainable feedstock
MAR 2021
MAR 2024
APR 2024
Boeing’s Aurora Flight Sciences adds ~50,000 sq ft for composites
3M and Alvant join forces on metal matrix composites for electric
Kulzer launches Venus Diamond
Toray launches Cetex TC915 PA+ thermoplastic composite
machines
Sources: Next Move Strategy Consulting (key players, 3M–Alvant, Kulzer); *Fortune Business Insights; Grand View Research (Toray, Teijin, market concentration)
Copyright © Next Move Strategy Consulting
Strategic Outlook Where value will be created — and the risks to price in
USD 86.1 B
12.0%
~90%
Incremental market value, 2021– 2030
Aerospace composites CAGR, 2025–2030
UK composite waste sent to landfill
Restraints & Risks
Emerging Opportunities
Costly inputs: fibers, resins and graphene keep composite prices high
Healthcare: dental fillings and restorative composites create lucrative openings
Recycling: heterogeneous hybrid structures are hard to recover, putting end-of-life waste under scrutiny
Sustainability: bio-based resins, recycled carbon fiber and flax, hemp & jute fibers
Capex: RTM and pultrusion need specialised equipment, limiting cost-sensitive uptake Trade: U.S.–China tensions may suppress growth
Automation: AFP, RTM and 3D printing cut cost, cycle time and waste New energy: hydrogen pressure tanks and EV battery enclosures High-temp aerospace: ceramic matrix composites are the fastest-growing matrix
Tailored Implications Investors
Internal Strategy Teams
B2B Decision-Makers
Favour carbon-fiber and aerospace exposure — the 12.0% CAGR segment
Build recycling and circularity capability ahead of lifecycleassessment scrutiny
Hedge fiber and resin volatility with multi-year supply agreements
Balance APAC scale with North America’s defense-led growth
Shift toward thermoplastics and automated processes
Qualify recycled and bio-based grades early
Screen targets for rawmaterial cost pass-through
Secure long-term OEM supply contracts, as leaders do
Judge total lifecycle value — weight, corrosion, maintenance — not unit price
Sources: Next Move Strategy Consulting (market size, restraints, healthcare); Fortune Business Insights (recycling, trends); MarketsandMarkets (aerospace); Grand View Research
Copyright © Next Move Strategy Consulting
Thank You Connect with us for in-depth insights and strategic guidance
Talk to our analysts about market sizing, segment forecasts, regional opportunities and competitive benchmarking for the global composites market.
Click here for the complete report →
Click here for the complete report →
Official Website
Contact Number
www.nextmsc.com
+18577585017
info@nextmsc.com
Follow Us
YouTube
Full report: nextmsc.com/report/composites-market Next Move Strategy Consulting
Copyright © Next Move Strategy Consulting