64 minute read
Summary...............................................................................................................................................45


Housing Subsidies
Investing into solutions like tenant-based rental assistance (TBRA) is one of the fastest ways to increase affordable housing units. Construction, acquisition, and rehabilitation can take years and be costly. Many different funding sources are required to make those projects work, while TBRA is already an existing line item. Additionally, rural areas do not typically have as much access to affordable housing funding as urban areas. Below are just a few examples of funding for housing subsidies providing scattered-site housing. Tenant-Based Rental Assistance through HOPWA (TBRA) – Funding is provided to an eligible client and the client selects a housing unit of their choice. HUD’s HOPWA Rental Assistance Guidebook offers an excellent look into designing an effective TBRA program. While TBRA currently exists in the continuum of services, it should be expanded to serve a broader population with high housing needs and no income. Rapid Re-Housing (RRH) – RRH is an intervention designed mostly for people experiencing literal homelessness. It provides a combination of short-term rental assistance and support services to help exit households out of homelessness quickly. RRH can be provided by multiple funding streams, including Continuum of Care Program, Emergency Solutions Grant, HOME-TBRA, Supportive Services for Veteran Families, and local government general revenue. RRH rolled out on a federal level in 2009 and has since become a nationwide best practice. When households are offered quick returns to stable housing and support services, they become more economically self-sufficient than if they were to remain homeless. Permanent Supportive Housing (PSH) – PSH is an intervention that provides longer-term supports, including both financial assistance to make housing affordable and intensive case management to ensure high acuity consumers are able to stabilize in housing. PSH can be funded a variety of ways, including site-based housing (described below), master leasing, HOPWA TBRA, HOME-TBRA, local government general revenue, and Continuum of Care Program. PSH is an evidence-based intervention demonstrating that people with long periods of housing instability and a disability(ies) have improved health and housing outcomes when provided with stable housing and comprehensive support services. Scattered-site housing provides an opportunity for consumers to integrate more fully into the community and be connected into their local neighborhood. Scattered-site housing is considered a best practice for people with disabilities as site-based housing is less integrated and can marginalize communities.
Advertisement
Site-Based Housing
Site-based housing refers to multi-family style properties, where there are many units in one area and tenants in the program are living in one site or complex. Site-based housing is obtained through constructions, acquisition, or rehabilitation and is most often financed through local, state, and federal sources. An overview of how these sources can be utilized for rental is listed below.
Community Development Block Grant (CDBG) – CDBG is a HUD-administered federal program. Funds may be provided as a subsidy to housing developers. HUD provides CDBG grants on a formula basis directly to urban counties and larger cities, and to state governments to award on a competitive basis to non-entitlement communities. Eligible activities include acquisition, rehabilitation and, in limited circumstances, new construction. HOME Investment Partnerships Program (HOME) – HOME is a HUD-administered federal program that provides funding for local communities to provide affordable housing for low- and very low-income residents. HOME funds can provide construction or acquisition/rehabilitation subsidies for affordable housing developers and tenant-based
rental assistance. The recent American Rescue Plan Act provided an additional $5 billion in HOME funding to be utilized for the following eligible activities:
•Production or Preservation of Affordable Housing •Tenant-Based Rental Assistance
•Supportive Services, Homeless Prevention Services, and Housing Counseling •Purchase and Development of Non-Congregate Shelter
These HOME-ARP funds present an incredible opportunity to create a new source of for either TBRA for PLWHA and/ or development of affordable housing. These funds are targeted towards people experiencing homelessness and prioritize those most in need. Low Income Housing Tax Credits (LIHTC) – LIHTC are provided by the federal government to rental housing developers in exchange for a commitment to provide affordable rents and are usually sold to investors to raise project equity. In North Carolina, LIHTC are awarded by the North Carolina Housing Finance Agency and owners must agree to a period of affordability between 15 and 30 years for families and individuals with incomes at or below 80% of the local median income. In South Carolina, LIHTC are awarded by the South Carolina State Housing Finance & Development Authority (SC Housing). USDA Rural Housing Service (RHS) – RHS loans provide financing for multifamily properties and group homes in rural areas in exchange for ensuring the units are affordable to low- and moderate-income families. Project-based rental assistance may also be provided. Other Financing Both the NC and SC Housing Finance Agencies provide opportunities for supportive housing, rural development, and small rental developments. Nonprofits can often get interest-free loans and technical assistance from these agencies for the development process. Financial institutions with federal funding for affordable housing can provide reasonable loans to help nonprofits and developers access capital for affordable housing developments. If not already an experienced developer, nonprofits should secure a development partner in order to complete the project more successfully.
Community Land Trusts
A Community Land Trust (CLT) refers to the vehicle of separating land from building (house) for the purpose of transferring title to the property without selling the land. Fundamentally, CLTs keep housing permanently affordable. CLTs are a way for communities to control land and development. They are typically nonprofit organizations and can develop affordable rental and cooperative housing projects. CLTs are typically geared toward homeownership. With assistance from the local government in identifying land, nonprofits are at the helm of making CLTs work. CLTs across the country have partnered with organizations to target specific groups, such as people with disabilities or those in need of supportive housing. By partnering with a CLT, CCP could gain a development partner and ensure long term affordability, while the CLT could gain a source of funding and a partner with a deep knowledge of helping at-risk individuals. West Side Community Land Trust could serve as an opportune partner to help CCP move into rental development or help PLWHA move on into homeownership.
Zoning Regulations
Local government partners are critical to the production of affordable housing. Not only are they a conduit for funding, but local governments also set the rules for community development. Local zoning ordinances can enhance affordability and offer a significant path to expanding the production of affordable housing. Zoning can make it more difficult to construct housing, reducing the supply and driving up the cost of development. Reducing burdensome zoning regulations and allowing more types and sizes of housing in more areas lowers the cost of housing. As is evident by the sizable deficit, the private market does not always provide the housing for low-income households most in need. Inclusionary zoning is one way local governments can ensure that apartments being developed set aside affordable housing units to those most in need, across a range of incomes. In addition to inclusionary zoning, the Urban Institute provides two community examples of density bonuses which incentivize the production of affordable housing in exchange for increases in allowable building heights – Austin, Texas and Arlington, Virginia. Both the City of Charlotte and Mecklenburg County demonstrated commitment to expanding affordable housing initiatives. Zoning provides a great vehicle to create inclusive communities. 2. Provide Deeper, Longer-Term Housing Subsidies
Limited economic mobility is a factor for many PLWHA and their families living within CCP’s coverage area. Table 9: Common Occupations provides an analysis of data from the Bureau of Labor Statistics, identifying the top 15 occupations in the region, including the three most common jobs: Retail Salespersons, Fast Food and Counter Workers, and Cashiers. It is important to note these three most common jobs have some of the lowest wages. To prevent cost burden and not exceed spending more than 30% of income toward housing costs, these most common occupations are limited by maximum rents between $565-$471 per month, far below actual rents.
The situation is even more dire for households who rely on benefits from the Social Security Administration, which is discussed in more detail in Table 8: Maximum Rent Based on 2021 Social Security Benefits. Such income limitations, especially for persons reporting no income in the consumer survey, prevent households from preparing for an unexpected expense. Without a financial safety net to cover security deposits, high utility/water bills, medical expenses, or other housing-related costs, households in the region are vulnerable to a housing crisis. While HOPWA assistance provides for these costs for many households, there remains a great need for short- and longer-term solutions. Housing assistance and supports providing deeper, long-term subsidies would enable PLWHA to regain housing stability and offer the opportunity for improved economic mobility.
Many of these individuals and families, who are simultaneously managing medical needs, would benefit from longterm deep-end subsidies that can stabilize the household and avoid future housing crises from occurring. Subsidies such as Permanent Support Housing (PSH) provide housing in conjunction with supportive services. While Public Housing Authorities (PHAs) administer Housing Choice Vouchers, special purpose voucher programs, and projectbased and/or affordable housing, creating partnerships between the network of CCP service providers and PHAs can help consumers “move on” from other service-based housing projects or apply for a Housing Choice Voucher when lotteries/wait lists open. With this proactive coordination, persons served in the region who require longterm housing assistance can receive the hands-on assistance to apply and obtain housing subsidies outside of the HOPWA program. Expanding the existing TBRA program should be considered as this was repeatedly mentioned
as a critical resource in stabilizing consumers long-term. Current and expanded TBRA funding, move-on strategies, and strengthened partnerships with organizations with long-term subsidies will help low-income PLWHA with the greatest housing instability stabilize.
3. Improve System-Wide Coordination
Consumer and provider survey respondents, along with interviewed staff, express that better coordination between support, medical, and housing services is a significant need for PLWHA in the region. Coordination needs improvement to reduce fragmentation and adequately address the needs of the persons served within the region. In addition to developing increased coordination among HOPWA providers, coordination needs to be improved system-wide among a variety of providers: medical care, employment supports, transportation, behavioral health care, and community-based supports. Incorporating navigation tools and cross-training opportunities will better help providers and consumers navigate the systems responsible for managing and equitably distributing resources. As it stands, while providers are assessing consumer’s housing situation, they are not tracking the consumer at a system-wide level. Improving system-wide tracking and coordination of services will benefit the CCP network’s ability to offer the right services at the right time, which aids in preventing duplication of services, in addition to taking an interdisciplinary approach to service and care coordination. Housing navigation specialists may already exist within the specific region or county, and with these experts already established, CCP can create partnerships with established resources to train network staff, update and increase participation in landlord databases, and develop a region-wide, multi-system strategy that will improve the housing navigation needs of HOPWA consumers. In the absence of established resources of this kind, existing positions (e.g., case managers) can be re-purposed to increase the focus on system-wide navigation. Strategically enhancing the coordination among network providers and external systems will create the opportunity to maximize the distribution and utilization of HOPWA resources.
Develop a Resource Collaborative A resource collaborative brings agencies serving a specific population together to identify and discuss resources, troubleshoot service gaps, and circulate best practices in service delivery. The interviews revealed that most agencies do not have a formalized method of gathering or distributing resources among staff, training in best practices was limited, and agencies did not work together as needed. A resource collaborative will bring together at least one representative from each agency, in a geographic way that makes sense, to ensure coordination is being maximized in order to benefit PLWHA. Connection to the Continuum of Care
Another area of improvement identified through the interviews, was coordination with the Continuum of Care (CoC). Most agencies were somewhat familiar with the CoC and their process of assisting people experiencing homelessness, but rural areas demonstrated they were less familiar with the resources available. This is not unusual given the lack of homeless resources in rural areas. However, even an annual training from the CoC to HOPWA providers on the process would be a good start. CoCs often have committees and governing boards where HOPWA providers could get more involved. Affordable Housing Resource Guide Affordable housing can be complex to navigate, especially to providers who have not worked in the field very
long. Consumers are often required to find their own housing because case managers are ill-equipped to help them navigate opportunities. An affordable housing resource guide could offer an overview of the different types of housing assistance, inside and outside of HOPWA, and detail where affordable housing resources are in each community. This guide is not meant to be an all-encompassing guide to where to find landlords, but rather a basic guide to understanding subsidized, tax credit, special needs, and other housing opportunities.
Access to permanent supportive housing and other permanent housing subsidies would benefit PLWHA. Consumers and providers alike echo broader trends in the region, which is that a significant number of persons receiving services do not earn enough income to obtain or maintain housing. Households with the lowest incomes often have the greatest housing needs. Among the consumers who participated in the Housing Needs Assessment Survey, 15.8% reported being currently homeless; staying at an emergency shelter, a transitional housing project for homeless individuals or families, or experiencing unsheltered homelessness and sleeping in places not meant for human habitation. Roughly 58.6% of the respondents also self-disclosed having experienced homelessness, either currently or in the past.
Housing instability has costly repercussions. Further increasing coordination among the Homeless Continuums of Care (CoC), in addition to Public Housing Authorities (PHAs), can be a means to advocate for PLWHA who have long histories of homelessness, housing instability, and acute service needs. Persons served by CCP’s network may overlap into other networks, such as behavioral health, criminal justice, domestic violence, and child welfare. Working in coordination with this broader network and prioritizing acute, overlapping households for affordable housing is fiscally and socially beneficial. Screen in Households with the Greatest Need
Currently, some HOPWA programs are looking for signs of stability in a household to indicate they will be able to sustain the housing opportunity given prior to providing assistance. However, there is no evidence that one household will maintain housing stability over another. For example, households with no income will often have less access to a housing subsidy because they might not be considered sustainable. This results in people with the greatest need and lowest incomes being unable to obtain housing. These households are often the most impacted from housing instability and will be unable to access housing resources anywhere else. Once housed, people are more likely to access treatment, find employment, find childcare, adhere to medical care, and access behavioral health services. Screening households into HOPWA housing programs regardless of income offers the opportunity to everyone to have access to an improved quality of life, better health, and economic stability. Partner with Community Services People with the greatest housing needs often have high service needs as well. In order to expand HOPWA housing assistance, services such as behavioral health should be sought out in the community. While there is a great shortage of behavioral health services in most communities, partnerships should be pursued to the extent possible to take the burden off HOPWA funding. PLWHA who have access to health insurance, Medicaid, or services through other community-based programs should be accessing those community services as a priority or in conjunction with HOPWA support services.
Barriers to obtaining and maintaining housing are reported consistently among consumers and providers, which includes availability and affordability of units, poor credit, rental/eviction history, criminal background, eligibility for subsidy programs, lack of transportation, and lack of sustainable employment. Renters are also challenged by landlords who will not accept vouchers (income source discrimination) and apartments charging additional movein costs. Using the data projections to identify population growth in rural and urban areas as illustrated in Table 4: Projected Population Growth, CCP can work with local governments with an emphasis on entitlement communities or state funding for non-entitlement communities to use community development resources to improve public services and housing. This may include strategies to address transportation needs, social services, short-term housing subsidies aimed at hard to housing populations, move-in expenses such as security and utility deposits, landlord incentives, and supportive services. Landlord Engagement and Incentives Landlord engagement strategies and incentives have proven to be very effective in helping case managers and consumers identify housing quicker, increase landlord partnerships, and overcome significant housing barriers. Landlord engagement strategies include housing location, housing navigation, and financial incentives to minimize the risk to the landlord. Housing location staff have a primary responsibility of identifying housing in the community that will work with people with housing barriers. This is a shift from housing location being a case manager’s or consumer’s sole responsibility. Similarly, housing navigation is the work that is done with a household prior to them moving in to the housing. Everything from inspection to lease-up. Housing location and navigation help speed up the process of finding the household housing and minimizes the likelihood that the consumer might be unsuccessful in finding housing and negotiating with a landlord. Landlord incentives include things like a risk mitigation fund, extra security deposits, and signing bonuses. As was highlighted in the interviews, surveys, and focus groups, many households have significant barriers like poor credit history, criminal history, and evictions. These barriers can be an immediate turn-off to landlords, but financial incentives can make up the difference. Existing providers, such as Socialserve’s Housing CLT, already employ best practices in landlord engagement and incentives. Strengthening those partnerships will make certain PLWHA are being assisted to find housing as efficiently as possible
4. COMMUNITY CHARACTERISTICS
CCP’s coverage area is comprised of both rural and urban areas within the 10-county region, including all but 1 county in the Charlotte MSA (Anson is excluded). This needs assessment considers the unique characteristics that comprise the service region. It is important to note that each municipality served under the HOPWA program has their own funding to address the needs of their residents and those resources may be used to further leverage the HOPWA funding through housing and services in each community. Looking at the community characteristics by demographic category in comparison to the overall population and number of PLWHA helps illustrate the common themes, overarching needs, and elements available to further augment the scope of services provided by the current system of care.
CCP COVERAGE AREA PROFILE
Table 1: CCP Coverage Area Profile

4.1. Cases of HIV/AIDS and Growth at the County Level
The Number of PLWHA in the 10-county region continues to increase, as demonstrated by Figure 2: HIV/AIDS Population in the 10-county Area, which illustrates the total area real and projected number of PLWHA in the area. Between 2018 (the last year where data is available) and 2038, the number of Persons Living with HIV or AIDS in the service region is projected to increase by 91%. Based on the 2018 American Census Survey (ACS) population of the 10-county region, an estimated 10,192 persons, or .41% of the total regional population, are living with HIV or AIDS today
AIDSVu, 2018
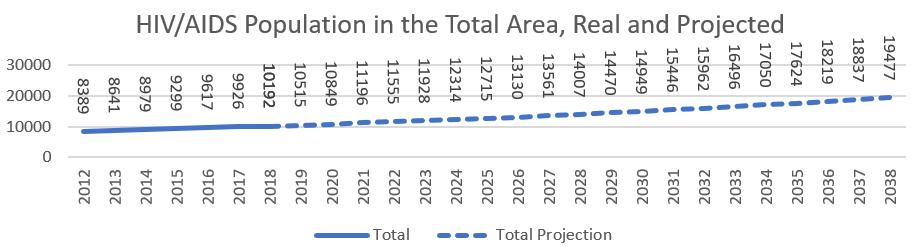
Figure 2: HIV/AIDS Population in the 10-county Area
The CCP coverage area sits on the edge of a larger region (stretching from Fayetteville, NC to north Florida in the south and central Alabama to the west) where HIV/AIDS cases are extremely high. To the north and west of Charlotte HIV/ AIDS cases are far lower. This holds within the region, where Mecklenburg and Gastonia have extremely high cases per 100,000, while Iredell, to the north has far lower cases of incidence.

Source: AIDSVu Figure 3: Cases per County in the Region around Charlotte, NC
Mecklenburg County, NC, the most populous among the 10 counties served by the CCP coverage area, accounts for both the largest incidence of new cases (26.7 new cases per 100,000 people) and the largest total of cases of HIV/AIDS totaling 6,963 persons in 2018. The county’s high rate of HIV/AIDS incidence along with its far larger population means that the county represents about two-thirds of all HIV/AIDS cases in CCP’s coverage area. At a rate of 15 new cases per 100,000 persons, Gaston County has the second highest rate of new cases, as well as the second largest population of PLWHA (783 people). While population size correlates with a higher overall population of people with HIV/AIDS, Gaston County has only the fourth largest overall population in the region.
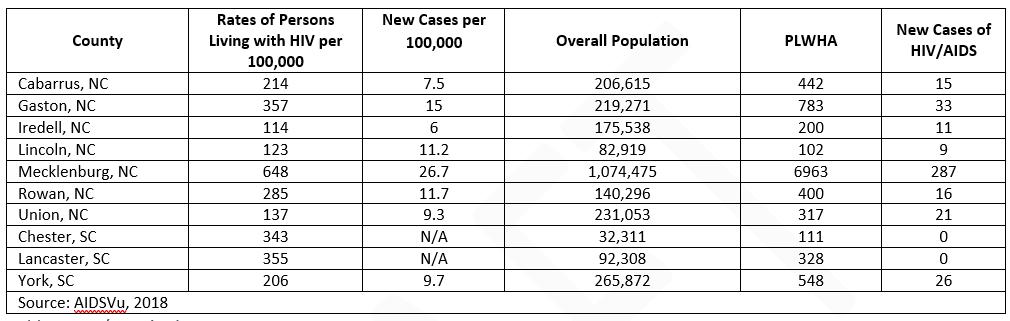
Table 2: HIV/AIDS in the CCP Area
4.2. HIV/AIDS in Mecklenburg
AIDSVU, a partnership of Emory University’s Rollins School of Public Health, Gilead Sciences, Inc., and the Center for AIDS Research at Emory University, provides a more in-depth breakdown for Mecklenburg County than the other nine counties in the region. The following section lays out those maps and statistics and discusses how generalizable they are to the entire 10-county area. Mecklenburg is compared to the US as a whole and to the South (defined by the US Census as Alabama, Arkansas, Delaware, the District of Columbia, Florida, Georgia, Kentucky, Louisiana, Maryland, Mississippi, North Carolina, Oklahoma, South Carolina, Tennessee, Texas, Virginia, and West Virginia) to see similarities and differences that might affect the demographics of those with HIV/AIDS in the surrounding areas. In Mecklenburg, the highest concentration of HIV/ AIDS is in downtown and northwest Charlotte. Four zip codes: 28208, 28202, 28204, and 28206 fall within AIDSVu highest bracket with over 1,733 cases per 100,000 people. Cases of HIV/AIDS drop near the edges of the county, particularly in the far north and south of the county where there are 90% fewer cases per 100,000 people in the 28078, 28031, 28036, 28277, and 28270 zip codes.
AIDSVu, 2018 Figure 4: HIV/AIDS by Zip Code in Mecklenburg County

Across the US and in the South, the vast majority (three-fourths) of people with HIV/AIDS are men. This holds true in Mecklenburg, where 73.6% of people with HIV/AIDS are men. It is likely that this is similar across the 10-county region.
Sex/Gender of People Living with HIV/AIDS
Source AIDSVu, 2018 Figure 5: Sex/Gender of People Living with HIV/AIDS in Mecklenburg, US, and Region

The most significant difference between Mecklenburg, the US as a whole, and the South is that 70.8% of those living with HIV/AIDS in the county are Black/African American, compared to 40.6% of people living with HIV/AIDS in the US and 53.3% in the South. Mecklenburg has a higher concentration of Black/African American residents (33%) compared to the 19.3% in the South as a whole and 13.4% in the country as whole. This data suggests a particular concentration in Mecklenburg’s low-income Black communities. According to UNAIDS, the US has a concentrated HIV epidemic, primarily among men who have sex with men (MSM) and injection drug users in economically disadvantaged urban areas. In Charlotte, this describes the areas directly north northwest of the center city, and to a less extent in the east of the county. In all likelihood, the other nine counties with lower black/African American populations regress closer to the regional mean of 53.3% of HIV/AIDS cases for African Americans and, similarly, cases are most likely concentrated in regional centers, like Gastonia.
Race/Ethnicity of People with HIV/AIDS
Source: AIDSVu, 2018 Figure 6: Race/Ethnicity of People with HIV/AIDS

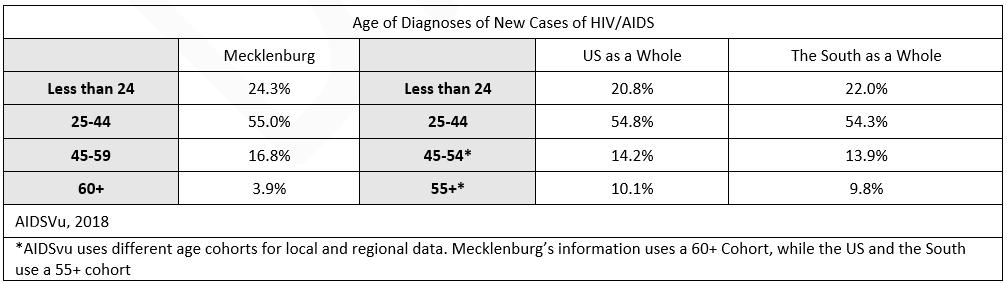
The age of first diagnosis for HIV/AIDS holds relatively steady between Mecklenburg, the US as a whole, and the South. Fifty-five percent (55%) of Mecklenburg’s new diagnosis are for people between 25-44, mirroring the larger areas. Twenty-four percent (24%) of new cases were for people under 24 years of age, slightly higher than the US as a whole.
Age Of Diagnosis Of New Cases Of HIV/AIDS
Table 3: Age of People with HIV/AIDS in Mecklenburg, US, and Region
4.3. Population
The total regional population steadily increased between 2010 and 2019. Between 2019 and 2040, the population is anticipated to increase by 55.85% from roughly 2.52 million to 3.93 million across the 10-county area. The three counties with the most significant population increases are Lancaster County, SC projected to increase by 84.46%, York County, SC where the population is expected to increase by 70.95%, and Union County, NC where it is anticipated to grow by 66.70% (though all from far lower base populations than Mecklenburg which is anticipated to have the largest growth in real numbers). The three counties experiencing the lowest or negative population growth are Chester County, SC where the population is expected to decrease by .97%, Rowan County, NC projecting a population increase of only 9.37%, and Gaston County, NC where there is an anticipated population increase of 23.94%.
Real Populations and Projections
Table 4: Projected Population Growth

Population growth, in conjunction with disease incidence per 100,000, is one of the primary indicators of the probability of new HIV/AIDS cases. As populations grow, the real number of people experiencing HIV/AIDS will increase as well if the incidence rate stays constant. If current rates stay constant, thousands of new people will be diagnosed with HIV/ AIDS in the region as the population increases. Population growth is also tied to the government services required to serve people with HIV/AIDS. Local jurisdiction plan infrastructure and transportation improvements to support and respond to population growth are important factors in access to housing and supportive services. The projection predicts continued growth in rural and suburban areas, which means community needs will change and CCP will have to serve more people in less urban areas. Population growth can result in increased federal funding for HOME Investment Partnership and Community Development Block Grant (CDBG) funding to improve access to housing and public services for low- and moderate-income households which can be blended with HOPWA funding to augment the housing and service needs for PLWHA in the service region.
Population: Mechlenburg and All other Counties Projections
Source: Census Bureau, American Community Survey, 2019 5 Year Estimates. Projections by the Florida Housing Coalition Figure 7: Population and Population Projections

4.4. Age
As shown in Table 3: Age of People with HIV/AIDS in Mecklenburg, US, and Region, nearly 80% of people diagnosed with HIV/AIDS are under 45. Not pictured in the graph, most older adults diagnosed with HIV/AIDS are late diagnoses, and thus most likely contracted HIV/AIDS at a younger age. As the coverage area ages, and particularly more rural parts of the coverage area that are aging more quickly, new cases will likely decline as a share of total population.

Table 5: Age and Age Projections
The age projections for the 10-county area estimates that persons under the age of 20 years will grow by only 24.76%. This indicates a slowing birth rate that will impact household size and the future labor force, as well as leaving fewer people
in the age cohorts most likely to contract HIV/AIDS. The most significant category in which populations is projected to increase between 2019 and 2040 are persons aged 65 and older, projected to grow by 160.71%. At the current growth rate, these retirement age adults will outnumber children by 2040. The 44-64 age group is projected to grow by 67.87% in Mecklenburg County, the second highest growth rate. As a community ages, housing needs change: with fewer families with children the area needs fewer large homes, while more retirees require age friendly designs and more walkability. The growth for persons aged 20-44 was projected at 29.75% in the region. This rate, only slightly higher than the growth in the youth population, suggests relatively low in-migration for these young workers. Persons aged 20-44 years comprise the largest share of population of all age categories today and, even with a far lower growth rate, are still forecast to be the largest group in 2040.
Total Area: Household Size
Source: Census Bureau, American Community Survey, 2019 5 Year Estimates. Projections by the Florida Housing Coalition Figure 8: Total Area: Household Size

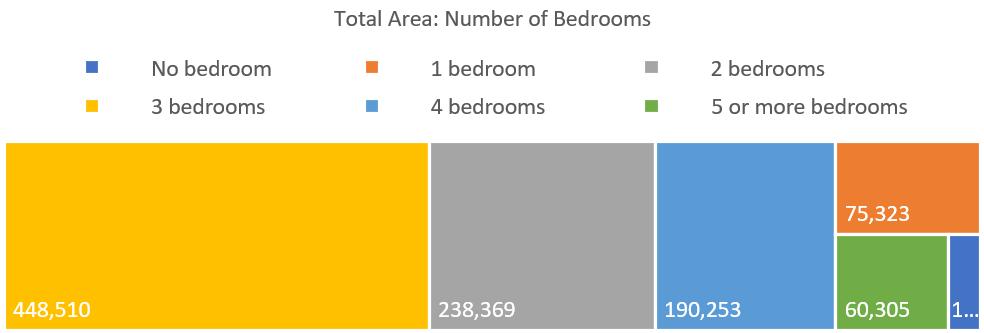
As the area ages, the need for larger homes will decline. Already, most households in the area are two or fewer people, while most homes have three or more bedrooms. Fewer children will lead to smaller households. To ensure that housing is affordable and better serves changing demographics, local governments will need adjust zoning laws to allow smaller units, which are now banned in most residential areas in the region, and increase density to allow more, smaller units in less auto dependent neighborhoods.
Total Area: Number of Bedrooms
Source: Census Bureau, American Community Survey, 2019 5 Year Estimates. Projections by the Florida Housing Coalition Figure 9: Total Area: Number of Bedrooms In interviews and discussions with CCP, local housing authorities, and emergency shelters for homeless persons, housing professionals that work with PLWHA have noted the need for smaller units. These organizations are, in order to serve their population, looking for single bedroom units to house their mostly one and two-person households and having difficulty finding available smaller units. In order to house people, these organizations are having to providing larger units for these households, driving up costs. There is demand for these units that the market is not serving because of local zoning regulations.
As the overall population continues to age, PLWHA who are elderly and aging (a growing share of people with HIV/AIDS as treatment extends the lifespan of people with the disease) will need access to age-specific supports through communitybased service providers, further supplementing resources offered through the HOPWA program. This pivot to prioritize elderly services in conjunction with HIV/AIDS services includes resources to help persons age in place. This can include inhome care, financial assistance such as rent or mortgage assistance to supplement monthly benefits, and home modifications such as ramps or grab bars. 4.5. Area Income
Incomes in the 10-county MSA are projected to rise, with a declining number of low-income households ($35,000 annually), dropping far faster than the inflation from 26.46% of the population in 2019 to 10.13% in 2040. Incomes tend to rise as inflation decreases the real value of the dollar, but incomes in the Charlotte area are increasing more quickly than inflation. Alternatively, the number of households in the highest income band, earning $150,000 or greater is anticipated to increase from 14.50% of the population to 47.23% of the overall population, further widening the income disparity. By 2040, it is anticipated that there will be a significant increase of persons within the 44-64 years of age range, which is a factor contributing to the increased income. As a generalization, the households within this age range have moved beyond entry level jobs to high-level, wellpaying career roles. With the decrease in persons under the age of 20 living in the region, this also impacts the number of households made up of persons in the two lower income bands. TOTAL AREA INCOME PROJECTIONS
Table 6: Total Area Income Projections
Source: Census Bureau, American Community Survey, 2019 5 Year Estimates. Projections by the Florida Housing Coalition Figure 10: Income Group Projections, Total Area

INCOME GROUP PROJECTIONS

4.6. Median Income
According to the 2019 5-Year ACS Estimates among the 10 counties, the median incomes range from $80,033 in Union County, NC to $42,442 in Chester County, SC. Renter households have significantly lower median incomes in comparison to the homeowners within the same counties. As an example, Lancaster County, SC’s median renter household has an income of $27,483 compared to the median owner income of $68,015. While low income is usually defined from the “all households median income,” far lower renter incomes may mean that the majority of renters qualify as low income, and a broad swath of the population may lack access to affordable housing. Among consumers served with HOPWA housing assistance, 91% were at 30% of the area median income or below demonstrating that the people with the lowest incomes have very high housing needs. The high cost of getting into rental housing, including a security deposit and first/last month’s rent, serves as an additional barrier to housing stability and further limits housing choice.
TOTAL AREA: MEDIAN INCOME BY TENURE

Source: Census Bureau, American Community Survey, 2019 5 Year Estimates. Figure 11: Total Area: Median Income by Tenure
The most significant economic disparity between renter and owner households exists in Union County where there is a difference between tenures of $45,559 annually. Conversely, Rowan County renters and owners have less significant income disparity with a difference of $27,637 in annual median income. Owner households with a mortgage pay higher housing costs but are able to build and tap into equity. Additionally, owner households without a mortgage pay far lower housing costs than any other group.
DIFFERENCE IN MEDIAN INCOME BY TENURE
County
Difference Between Owner and Renter Median Incomes County
Difference Between Owner and Renter Median Incomes

Table 7: Difference in Median Income by Tenure
To further illustrate financial limitations for persons with disabilities, which includes many PLWHA, Table 8: Maximum Rent Based on 2021 Social Security Benefits details the 2021 Social Security benefit amount and the maximum rent based on 30% of the monthly income for benefit recipients. This snapshot further emphasizes that economic disparity between owner households and persons who rely on benefits and are in desperate need of affordable housing options.

Table 8: Maximum Rent Based on 2021 Social Security Benefits
Both providers and consumers who participated in the Housing Needs Assessment Survey identified income as the most significant barrier when trying to obtain independent, permanent housing. While 42.0% of consumers surveyed report earning employment income, 39.1% rely on Supplemental Security Income (SSI) or Social Security Disability Insurance (SSDI) as their primary income source. 4.7. Employment and Top Occupations
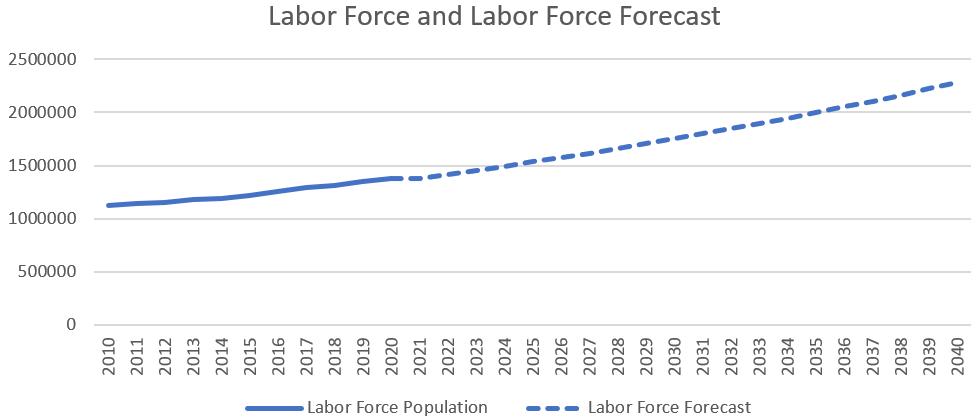
The labor force between the years of 2020 to 2040 is projected to grow slowly while the share of population in the labor force is projected to decline as people age.
Labor Force and Labor Force Forecast
Source: U.S. Bureau of Labor Statistics. Labor Force Projections. Figure 12: Labor Force and Labor Force Forecast

To better understand the economic factors affecting housing affordability at a neighborhood level, the map on the left provides income, employment rate, and cost burden at the Census tract level. Click on the map to see where people can and cannot afford housing in the CCP coverage area.
Source: US Census, 2019 5-Year ACS | Interactive Map 1: Economic Maps


OCCUPATIONS

Occupation data is only available at the MSA level, rather than for the 10-county area. In the Charlotte MSA, Retail salesperson is the most common occupation. If a retail salesperson works full time at 40 hours per week, 50 weeks a year, their annualized income supports a monthly rental amount of $565, which is 30% of their gross income toward housing expenses. The lowest paid workers among the top 15 occupations are Fast Food and Counter Workers, accounting for 2.94% of all workers. Their annualized earnings of $18,820 support a maximum monthly rent of $471 to ensure these households are not cost burdened. Fast food workers must either live with another worker or work multiple jobs to afford even low-cost housing in the MSA. General Operations and Managers are the highest paid common occupation, accounting for 1.57% of all workers in the MSA and earning an estimated $108,280 annually if they work full time, allowing them to afford a home far above the median. Nine of the 15 most common jobs pay less than $15 an hour.
15 Most Common Occupations in the Charlotte MSA and Median Wages
Table 9: Common Occupations

OPPORTUNITY ATLAS
The Opportunity Atlas provides in depth analysis of the way that the places we live impact our long-term economic opportunity. Tracking households over decades, the Atlas looks at how kids’ Census track of origin relates to their income at 35. By clicking here or on the image to the right, you can see the areas of the city that promote or discourage economic success for low-income children in the
Source: Opportunity Atlas, 2020 10-county area. Opportunity Interactive Map 2: Opportunity Atlas for the Region in the 10-county area is concentrated in a few Census tracts, primarily in the southeast portion of Mecklenburg County and in and around Huntersville. In the areas in the north of Mecklenburg where HIV/AIDS cases are high, opportunity for low-income children is extremely low.

4.8 Race and Ethnicity
As of 2019, White alone persons comprise the majority of the total area population, accounting for 61.10% of the population, but account only for only a small minority (14.82%) of HOPWA households served with housing assistance during the 20192020 fiscal year (Figure 6: Race/Ethnicity of People with HIV/AIDS). The White alone population is projected to grow through 2040 but decrease as a share of the population as the Hispanic, Asian, and other race(s) increase dramatically. Other races include two or more races, a growing category as Americans become more likely to marry outside of their racial group. Black/ African American persons are the second most represented racial group in the service area, accounting for 22.21% of the population. Current trends point to a slowly growing Black population, increasing by an estimated 378,665 persons (23.89%) by 2040. However, persons who are Black or African American account for 84.64% of HOPWA households served with housing assistance during the 2019-2020 fiscal year in all counties; again, roughly in line with the race/ethnicity of people with HIV/AIDS in Mecklenburg County outlined in Figure 6: Race/Ethnicity of People with HIV/AIDS. The most significant projected population increase is anticipated among Asian persons, increasing from 3.71% to 10.56% of the area population. Persons who are Hispanic living in the service region are anticipated to increase from 10.20% in 2019 to 14.09% in 2040.

Table 10: Demographic Changes to Race and Ethnicity
As the racial and ethnic composition of the region is changing, HOPWA service providers may seek out opportunities to improve cultural and linguistic service provision. Providing services in a person’s home language can help the consumer better communicate their needs to best address preventing the spread of HIV/AIDS and supporting PLWHA. When services are provided in a way that aligns with the consumer’s cultural identity, this can help them navigate complexity of personal support systems in addition to community and medical services that help PLWHA live independently and maintain their housing.
RACE: TOTAL AREA
Source: US Census, ACS 5-Year Estimates, Various Years. Projections by the Florida Housing Coalition. Figure 13: Race Projections in the Total Area


Source: Census Bureau, American Community Survey, 2019 5 Year Estimates. Interactive Map 3: Race and Ethnicity in the Service Area INTERACTIVE TABLEAU MAPS
To provide a more in depth look at the geography of race in the 10-county area, interactive Tableau maps were created for each Census tract in the region. The interactive maps can be accessed by clicking this link or by clicking on the picture to the left.

4.9. Sex/Gender
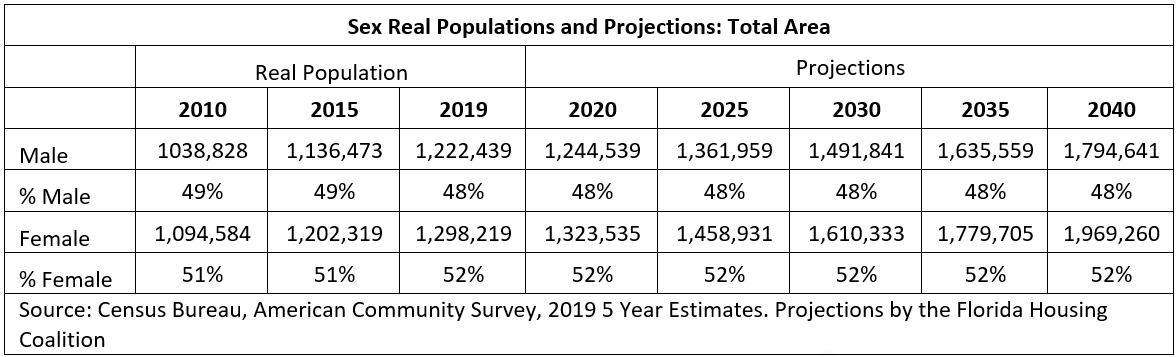
According to the Census Bureau, the total CCP coverage area population in 2019 was 52% female and 48% male. These numbers have shown very little change over the last decade, and 2040 projections estimate the same sex ratio. Among the 371 HOPWA eligible consumers served in the 2019-2020 operating year, 63.34% identified as male, 35.04% as female, and 1.62% individuals identify as transgender (all from male to female). Similarly, consumers served were 38% female and 61% male in the 2018-2019 operating year. 73.6% of PLWHA in Mecklenburg County and 74% in the South are male. This may suggest that males are underserved by HOPWA services, or females may be more likely to accept help and/or may have higher levels of need.
TOTAL AREA GENDER PROJECTIONS
Table 12: Sex/Gender and Projections
4.10. Health Insurance Access
Access to health insurance is key for identifying and treating HIV/AIDS. Unfortunately, healthcare coverage is not uniform. While only 10.8% of people lack any health insurance in the MSA, an inverted U-shaped area above and around downtown Charlotte boasts far higher numbers of uninsured individuals. People in these areas are less likely to seek testing or to be able to afford treatment. As shown in Figure 4: HIV/AIDS by Zip Code in Mecklenburg County, these same areas have far higher rates of HIV/AIDS than the surrounding zip codes and counties. Click here or on the picture below to see the percent uninsured in the CCP coverage area.

Source: US Census, 2019 5 Year ACS | Interactive Map 4: Rate of Un-insurance
5. INTERSECTION OF PERSONS WITH HIV/AIDS AND THE HOUSING CRISIS RESPONSE SYSTEM
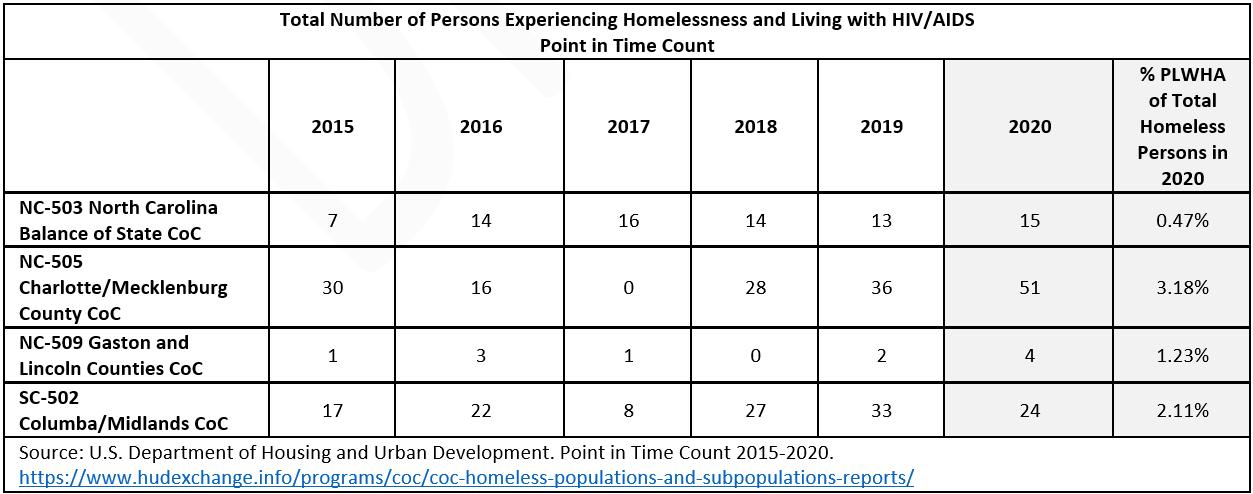
There are four lead agencies that are responsible for applying for and passing-through funding to a coordinated network of direct service providers for homeless specific housing and services within the 10-county region. These coordinating agencies, known as homeless Continuums of Care (CoCs), are NC-505 Charlotte/Mecklenburg County CoC, NC-503 North Carolina Balance of State CoC (Union, Cabarrus, Rowan, and Iredell Counties), NC-509 Gaston and Lincoln Counties, and SC-502 Columba/Midlands CoC. In addition to annual reporting based on the number of persons experiencing homelessness, the CoCs are also responsible for conducting the annual Point in Time Count (PIT Count) to capture a snapshot of persons experiencing sheltered and unsheltered homelessness over a one-day period every year in January. The data collected from the PIT Count in January 2020 exhibits low numbers of PLWHA who are also experiencing homelessness. Among the total number of persons experiencing homelessness in each of the four CoCs, NC-505 Charlotte/ Mecklenburg has the highest rate of persons overlapping, with 3.18% of the total homeless individuals self-disclosing a HIV/ AIDS diagnosis. The lowest rate of homeless persons who are also reporting having HIV or AIDS is within the NC-503 North Carolina Balance of State CoC which is responsible for preventing and ending homelessness in very rural areas of North Carolina. People with HIV/AIDS are disproportionately likely to be experiencing homelessness but represent a relatively small portion of the overall population of homeless persons. In January 2018, HUD required that all CoCs have a coordinated process, often referred to as coordinated entry, to assess and prioritize homeless households for housing and services. This is an opportunity for increased collaboration among the CoC and HOPWA providers to identify consumers experiencing literal homelessness and coordinate housing and service provision among both systems, and ensure households are prioritized for housing based on the CoC’s coordinated entry system. Strategically identifying contributions from both the CoC and HOPWA programs can maximize resources and address housing need among the most vulnerable consumers overlapping into publicly funded systems.
Total Number of Persons Experiencing Homelessness and Living with HIV/AIDS Point in Time Count
Table 13: Total Number of Persons Experiencing Homelessness Living with HIV/AIDS
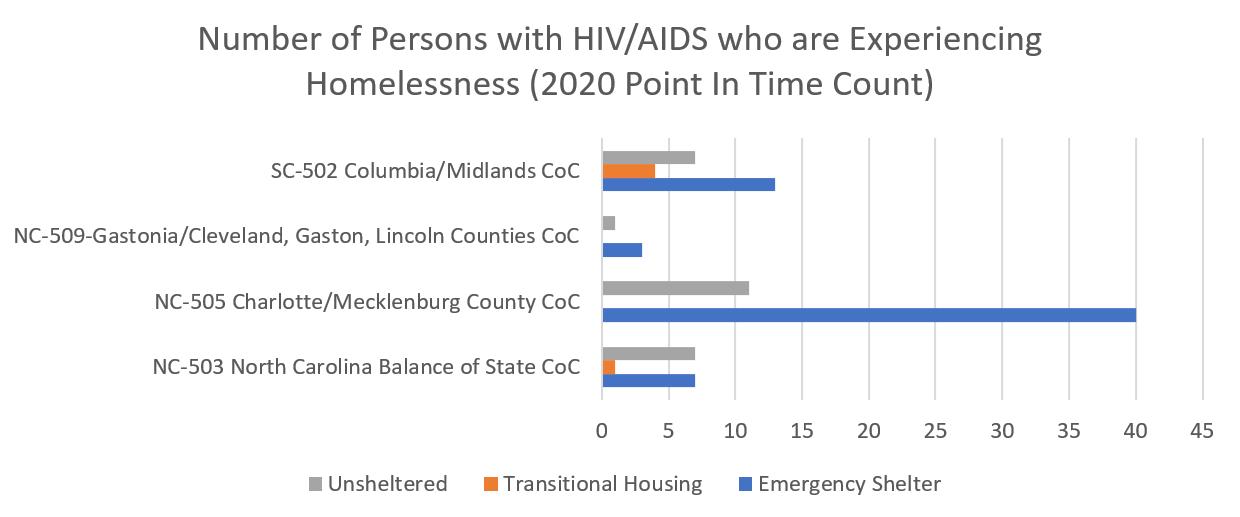
Although the PIT Count relies on self-disclosure, the Count provides a snapshot of the potential number of PLWHA and experiencing homelessness across the region on any given night. The NC-505 Charlotte/Mecklenburg CoC reports the highest numbers of PLWHA experiencing unsheltered homelessness in the 2020 Point in Time Count, which reflects both its larger population and higher rate of HIV/AIDS.
As stated previously, 15.8% of consumers who participated in the Housing Needs Assessment Survey reported being currently homeless, staying at an emergency shelter or transitional housing, or experiencing unsheltered homelessness and sleeping in places not meant for human habitation. Roughly 58.6% of the respondents also self-disclosed having experienced homelessness, either currently or in the past. Although persons doubled up, couch surfing, or paying out of pocket for a hotel/motel room do not meet HUD’s definition of literally homeless, people living in these circumstances are at an elevated risk of homelessness. These at-risk households, while they may have a roof over their head, are in temporary living situations without a lease of their own.
Number Of Persons With HIV/Aids Who Are Experiencing Homelessness (2020 Point In Time Count)
Figure 14: U.S. Department of Housing and Urban Development. 2020 Point in Time Count


HOPWA Contributions Toward Ending Homelessness
Figure 15: U.S. Department of Housing and Urban Development. HOPWA Grant Performance Profile. 2015-2020.

CoCs are tasked with prioritizing the most vulnerable persons with the longest homeless histories and most acute service needs. The HOPWA program partners with local governments and the CoC in order to provide permanent supportive housing to 45 individuals, with the goal of addressing chronic homelessness among PLWHA. These vouchers receive their referrals from the Mecklenburg CoC coordinated entry system and are consistently full demonstrating more need than availability. Out of the 371 assisted with HOPWA housing assistance during the 2019-2020 operating year, 25 (6.7%) were staying in a place not meant for human habitation, and 16 (4.3%) were in emergency shelter. Persons experiencing chronic homelessness, due to the number and depth of services they needs, often benefit from the combination of a housing subsidy and supportive services related to that person’s disabling condition or housing stabilization needs. Providers in focus groups and interviews disclosed they often have no resources when trying to refer consumers to homeless services. They also reported a lack of availability of emergency services like shelter and transitional housing. They are experiencing that consumers experiencing homelessness are often falling out of services. Providers had mixed feedback on the ease of utilizing their local coordinated entry system. Each of the 4 CoCs have their own system which can cause confusion to providers serving consumers who overlap CoCs. To reduce fragmentation when serving overlapping populations, increased coordination among service systems can positively impact persons served by linking and referring consumers to the right intervention which can provide the most appropriate unique services to support that individual.
The following section provides an overview of the housing market in the CCP coverage area and the Charlotte MSA. While this data is broad and may not directly detail the situation of PLWHA (who generally make far lower incomes and face higher levels of discrimination than most individuals) it is important to understand the types of housing units available, the median and fair market price of those units, how many new units have been permitted compared to rising population, and the gap between affordable and available units and low income households. This section begins to describe trends more fully explored in the housing needs assessment survey. 6.1. MSA Total Housing Units by Type
The vast majority (79.6%) of housing units in the service region are single family homes, with the majority of these being single family detached homes. Single family detached homes tend to be more expensive than other types of homes and do not provide the same density that allows car free access to services and amenities.

Table 14: Total Area Housing by Type
6.2. Housing Permits Over Time (2010-2020)
Housing is a basic need but also a commodity: as market demand increases, prices go up and developers construct more housing. Thus, brisk housing construction is a sign of rising housing prices. One way to track this is using the number of housing permits issued. After the Great Recession, housing permits in the Charlotte MSA plummetted. While permits have steadily increased since, housing permits are still far below the levels set before the Great Recession and seemed to have plateaued over the last few years, particularly for multi-family housing developments. New housing developments have fallen far below the number of homes that would need to be constructed to match population growth and household formation over the last decade.
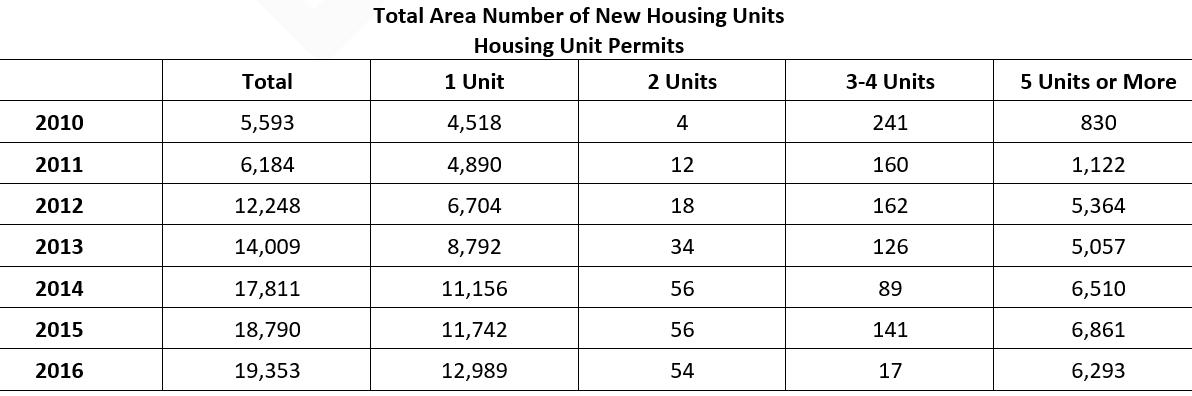

Table 15: Homes Permitted by Type (2010-2020) Source: US Census, Building Permit Survey

6.3. Affordable and Available Rental Unit Gap
An interesting way to measure the affordability of housing is the rental gap: how many low-income renters are there compared to homes that are affordable to them and which someone of a higher income is not already renting. In the Charlotte-ConcordGastonia MSA there are 60,675 rental households making less than 30% AMI with only 20,130 homes affordable and available to them. This produces a gap of 40,545. For households making below 50% AMI, that gap increases to 45,867 homes.

Table 16: Housing Gap
6.4. MSA Fair Market Rent, Median Rent, and Median Owner Costs by Mortgage Status
Fair Market Rent (FMR, set at 40th percentile of rent prices in the area) is used as a benchmark for what a low-income family should reasonably expect to pay and is used to set payment standards for various HUD programs offering housing assistance. Below are the 2020 FMRs for various home sizes.
There is a huge jump between the FMR for a 2-bedroom and a 3-bedroom, while little difference between 0- through 2-bedroom units. HOPWA providers interviewed pointed to a shortage of smaller units as driving up costs and forcing consumers to pay for more housing than they need.
Table 17: Fair Market Rent
Below are the 2019 1-Year American Community Survey estimates for the median price of housing in the Charlotte MSA. Homeowners with a mortgage pay the highest overall housing costs ($1,430), while homeowners without a mortgage pay over $1,000 less ($401). Renters pay $1,077 – far above the rents affordable for most common jobs (Table 9: Common Occupations).
Median Housing Costs by Housing Tenure
Table 18: Median Housing Costs by Tenure

While the housing gap in the Charlotte MSA is not as high as many more expensive coastal cities, it faces similar problems of rising demand without a corresponding increase in supply. As shown in Table 20: Survey, Housing Costs, most of the PLWHA that participated in the survey had housing costs at or below market rate rents. Low-income people like the majority of PLWHA must compete in the same housing market and, as population continues to rise faster than new homes are constructed, will face higher housing prices and require deeper subsidies.
7. HOUSING NEEDS ASSESSMENT SURVEYS
7.1. Consumer Housing Needs Assessment Survey
To capture direct feedback about housing needs from consumers in the service region, the Housing Needs Assessment Survey invited persons with HIV/AIDS or interacting with the HOPWA system to provide insight about their real-life experiences, further contributing to the comprehensive housing needs assessment in the CCP coverage area. The far-reaching impact of COVID-19 was evidenced by the 35.7% of respondents who listed COVID-19 as impacting their housing. Eighty-nine (89) consumers completed the survey. Respondent highlights from the Housing Needs Assessment Survey include: • 80.9% of respondents live in Mecklenburg County • 15.8% reported experiencing an episode of literal homelessness or staying in transitional housing for homeless individuals and families at the time of the survey • 86.84% pay less than $1,000/month in rent • 71.1% do not receive any help to pay for housing The Housing Needs Assessment Survey collected information from a diverse group of survey participants. Respondent demographic information includes persons of Hispanic or Latino/a/x ethnicity (5.9%); persons who are Black or African American (80.9%), White or Caucasian (10.3%), and persons who are Indian/Black African and Spanish American. These numbers roughly match the racial and ethnic breakdown of those served by the HOPWA program. The sex/gender breakdown saw persons who identify as transgender (1.5%), non-binary (1.5%), gender non-conforming (2.9%) in addition to female (50.0%) and male (47.1%) respondents, a disproportionately high number of females. The most represented age group completing the survey are persons between ages 55-64 years old, accounting for 32.4% of the participants. The second most prevalent age group are persons age 45-54 years (23.5%) and third are persons age 35-44 years (19.1%). Respondents shared additional information about their housing needs, available in the Appendix.
People are homeless because they lack a home. It is valuable to identify among the survey respondents who is experiencing a housing crisis or who has experienced an episode in their past. While supportive services are often an important component of obtaining and retaining housing, it is the housing itself that resolves the homeless episode. Among the respondents that completed Question 13: “Have You Ever Been Homeless,” 41.4% report never having experienced homelessness, 12.9% report that they are currently experiencing homelessness, 11.4% of those who answered report that they experienced homelessness within the last year but were not currently without a home, and 34.3% report to have experienced homelessness over one year ago. Identifying the contributing factors to homelessness, respondents expressed their experiences and various challenges when trying to obtain their own housing, which includes 48.57% of the respondents reporting not having enough or no income and 34.3% expressing that poor credit history is a barrier to securing housing. Persons who replied “other” included additional comments describing challenges including substance use, long waiting lists, lack of support and assistance obtaining long-term housing, and difficulty finding affordable housing.
Identified as a barrier contributing to obtaining housing, limited or no income directly correlates to the need for affordable housing. The most prevalent income source among respondents is earned income from employment, accounting for 42.0% of survey participants. The second most common income source among persons who completed the survey is Supplemental Security Income (SSI)/Social Security Disability Insurance (SSDI) which is received by 39.1% of the respondents. The third most common response regarding household income is no income, accounting for 11.6% of respondents. Respondents’ households are comprised of one-person (60.7%), two-person households (24.6%), three-person households (4.9%), and four-person households (9.8%). No households of five or more persons were identified based on survey responses.

Table 19: Survey, Challenges Experienced
Q19. Income Sources for Entire Household
Figure 16: Survey, Income Source

Limited financial mobility severely impacts one’s housing choice. The largest plurality of households receiving income received between $0 and $1,000, 44.3% of the responses. The next income group was households with incomes between $1,000 and $1,999 per month, accounting for 37.7% of the responses. Households whose income ranges between $2,000 and $3,999 during a month period accounted for 16.39% of the responses. Only 1.6% of households surveyed had income exceeding $4,000 monthly.

Table 20: Survey, Housing Costs
Households reported how much they are paying for their current housing situation, as shown in Table 20: Survey, Housing Costs. To prevent housing cost burden, housing expenses should not exceed 30% of the monthly income. As an estimate (not including utilities), the household group earning up to $1,000 per month should not exceed a monthly rent of $300 to prevent cost burden. The second most prevalent cohort of households earning between $1,000 and $1,999 should not exceed $600, if assessing maximum rent based on $1,999. To prevent cost burden, households whose income ranges between $2,000 and $3,999 during a month period should aim at monthly rent of $1,200.

While 22.4% of respondents do receive some type of rental assistance, 71.1% do not receive any help. No respondents are receiving a Housing Choice Voucher through the Public Housing Authority and 9.2% are receiving rental assistance specific to persons living with HIV or AIDS.
Q 4. Current Living Situation
Figure 17: Survey, Current Living Situation

Accounting for a significant portion of the respondents, 30.3% report that they are living in their own rental apartment/ house/trailer/condo. The next most prevalent living situations include living with others and assisting with paying the rent or mortgage, which accounts for 19.7% of respondents; 9.2% of respondents are living with others but not paying rent or mortgage; and 7.9% of respondents own a house/trailer/condo.

Table 21: Survey, Considered Moving The survey data demonstrates that respondents are maintaining consistency in their housing placement, with 68.4% of persons reporting staying in their current living situation between 1-5 years and 37.1% of respondents reporting that have not considered moving. Those staying in their current living situation for less than on year account for 30.3% of respondents. Respondents who moved zero times in the past five years account for 39.5% of those who answered and 35.5% moved between one and two times in the last five years. Only 5.3% of respondents report moving more than four times to different housing in the past five years. Less than half (37.1%) of respondents are happy in their living situation and 42.9% of respondents report feeling safe in their current living situation. Alternatively, 31.4% of respondents report that they are not happy at all with their current living situation and 14.3% report not feeling safe at all where they live. Table 24: Receiving HOPWA Assistance provides details, listing the reasons why respondents have considered moving. Additional feedback from respondents concerning problems that cause potential relocation included not having enough money to move into another place, currently living in an unhealthy situation, issues with privacy and stability, and one person shared that they are currently living in their car. Respondents are most commonly living alone, accounting for 38.2% of persons who participated in the survey, followed by 36.8% of respondents who report living with their family (spouse, partner, children, grandparents, siblings, etc.). Roughly 14.5% of respondents are living with a roommate(s) who are not family. Among the respondents who self-disclosed whether they have received HOPWA assistance, 54.3% report to have never received HOPWA assistance and 22.9% have received HOPWA assistance. Respondents also described assistance through the Ryan White Program and receiving HOPWA longer than one year ago. Persons who are unsure as to whether or not they ever received HOPWA account for 17.1% of respondents. Figure 17: Provider Housing Needs Assessment Survey identifies which HOPWA assistance survey/program participants received. Forty-five percent of respondents reported receiving short-term/emergency rent, mortgage, or utility assistance (STRMU) and 35.0% received on-going/long-term or transitional monthly rental assistance. The full consumer Housing Needs Assessment Survey is located in Appendix B. 7.2. Provider Housing Needs Assessment Survey
The Provider Housing Needs Assessment Survey solicited feedback from a breadth of service providers in various roles who serve persons in each county within the CCP coverage area. Among the respondents, 78.1% of the organizations represented serve one or more rural county(s), exhibiting a comprehensive perspective of the housing needs across the service region. While respondents ranged in roles from senior leadership to direct services, Case Manager/Support Service Workers accounted for the largest share of respondents (32.4%). The majority of organizations represented by respondents are HOPWA-funded (70.6%) and/or Ryan White funded (73.5%).
Respondent’s Organization/Industry Type
Figure 18: Provider Housing Needs Assessment Survey

The respondents are overwhelmingly serving persons living with HIV or AIDS, which accounted for 97.1% of those surveyed, and address co-existing needs by providing services to the following populations who overlap into the HOPWA service system:
• People experiencing homelessness or housing instability (67.6%) • People with disabilities (55.9%) • Youth (Under 25) (50.0%) • Veterans (47.1%) • People over 62 years of age (55.9%) • Low-income residents (70.6%) • People with a substance use disorder and/or mental health diagnosis (64.7%) • Individuals returning from jail or prison (47.1%) The survey respondents are experienced in providing services to persons living with HIV or AIDS who often have co-occurring needs relating to housing and supportive services. The most represented barriers in the significant barrier category identified

by the respondents are lack of affordable housing stock (81.2%) and the issue that the demand for housing assistance is greater than what can be offered with the available funding (71.9%). These two barriers are also the most represented among all categories in Question 6, emphasizing that providers are lacking the resources, both financial assistance and physical housing stock, to address the needs of persons served. This is further magnified by the identified common barriers to obtaining housing in Question 10 with 96.9% of respondents who pinpoint affordability and 93.8% of respondents associating consumers lack of income as prohibitive to securing housing.

Table 22: Survey, Barriers Identified
Additional feedback from the survey respondents includes immediately assessing consumers for economic hardship to quickly remove the barriers, eliminating the barriers “we” create, and providing transitional housing and education about maintaining housing stability. Providers recognize that consumers who are over income cannot be assisted, even when it is a one-time hardship. Although so many of the persons served within the CCP coverage area need housing, providers cannot help everyone. Housing program restrictions or eligibility requirements are also recognized as a significant barrier (65.6%), further highlighting the challenges of serving persons in need of assistance. Survey respondents further describe the lack of transportation in rural areas as a significant barrier, recognized by 56.3% of respondents. Furthermore, the three following barriers each individually collected 53.1% of responses in the significant barrier category: (1) the service area has limited programs to help PLWHA with no income, (2) there is a lack of job training resources and income support, and (3) lack of understanding to navigate housing assistance.

Table 23: Survey, Significant Needs Collecting the most responses in the significant need category, 56.3% of the respondents identify the need for improved coordination among providers to help maximize resources and improve knowledge. Similarly, and recognized as the second most significant need capturing 53.3% of the responses, is the need for improved local government coordination related to housing programs. Throughout the survey, providers demonstrated the significant need of exit strategies to non-HOPWA funded permanent housing programs and tools and training to help providers better navigate housing assistance, with both of these needs individually accounting for 46.9% of the responses in that category. The distribution of HOPWA vouchers appears to have no responses in any need category, possibly highlighting the effectiveness of the service and utilization rates as it is currently administered

Figure 19: Housing Needs Figure 18: Housing Needs emphasizes the need for Permanent Supportive Housing (PSH) for PLWHA. PSH is ranked the most important need based on the number of responses in each importance category and collecting the fewest number of responses in the least important category. The second most important need, as identified by participating providers, is the need for Emergency Housing, accounting for 35.5% of the responses in the most important category. Eviction prevention and short-term rental subsidies account for the most responses in the least important category. The full provider Housing Needs Assessment Survey is located in Appendix C.
8. HOUSING & SUPPORTIVE SERVICES for PLWHA
8.1. Existing Housing Supports and Services Structure
Q 17. You responded that you have received HOPWA assistance. What types of HOPWA assistance have you received?
Table 24: Receiving HOPWA Assistance
Housing and supportive services are offered to persons living with HIV or AIDS by various contracted direct service providers across the region. CCP is the project sponsor acting as a conduit to coordinate funding, passing it through to an organized network of providers while simultaneously operating the Regional Housing Partnership, LLC to further advance the organization’s mission and ensure all housing and service gaps are filled for persons living with HIV or AIDS. While urban areas may organically offer ease of access to resources due to public transportation, proximity of providers, and expanded housing choice, rural areas may lack those qualities, creating additional hurdles for low income households with severe service needs. CCP utilizes a broad network of providers to ensure each county in the CCP coverage area is covered to provide a service array to meet the needs of both urban and rural counties. This regional approach adopted by CCP helps prevent the spread of HIV and AIDS by providing compassionate and consumer-driven services to those most impacted by HIV and AIDS.


Table 25: Carolinas CARE Partnership Contracted Provider Service Array
The services provided by regional subcontracted partners are short term rent assistance, mortgage and utility assistance, supportive services – intensive residential end-of-life care, residential substance abuse treatment, permanent housing placement, facility-based housing operating expenses, emergency shelter, housing information services, housing case management, mental health services, transportation services, tenant-based rental vouchers and resource identification activities.
HOPWA Households Access to Care and Support
Figure 20: U.S. Department of Housing and Urban Development. HOPWA Performance Profile. City of Charlotte, NC, 2015-2020.
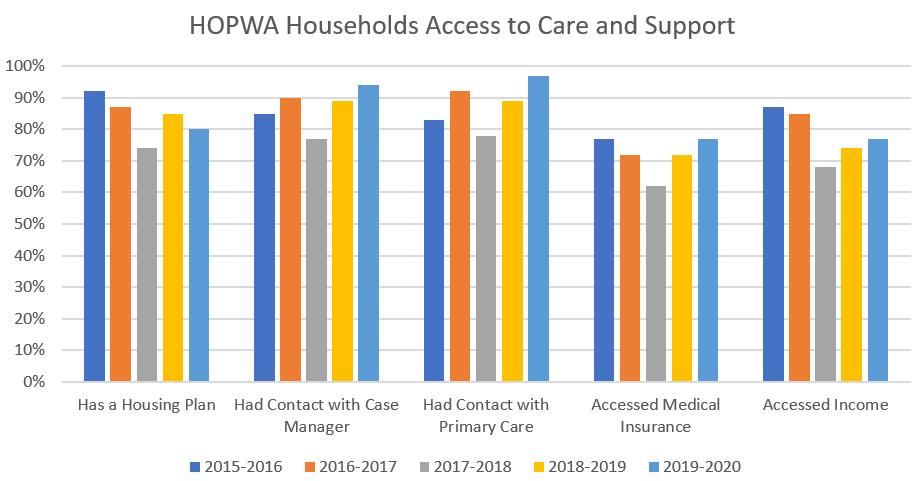
Households participating in HOPWA-funded services have, over a five-year reporting period, demonstrated increased access of primary care and case management services. The percentage of households with a housing plan have fluctuated, with a decrease of this service since 2015. As consumers who participated in the Housing Needs Assessment Survey emphasized the need of assistance with securing housing, the foundation of this support is developing a housing plan based on the consumer’s housing needs. Therefore, increasing access to housing plan development services will contribute to addressing the unique housing needs of HOPWA participants.
8.2. Use of Housing Services
CCP and its provider network are serving 40.6% more consumers in the 2019-2020 operating year than in the 2015-2016 operating year. As the increase occurred in the operating year prior to COVID-19, it can be assumed that the need for housing assistance is not a direct result of the pandemic.
Housing Information Services
Figure 21: U.S. Department of Housing and Urban Development. HOPWA Performance Profile. City of Charlotte, NC, 2015-2020

Other than the CCP allocation of $107,431.57 in operating year 2015-2016 for Housing Development activities that funded facility-based units being developed with capital funding buy not yet opened, no additional funding has been dedicated to this activity since. However, CCP’s increase in housing assistance and services shows the need for Tenant-Based Rental Assistance, Short Term Rent, Mortgage and Utility Assistance (STRMU), Permanent Housing Placement Services, and Supportive Services.
Type of Activity
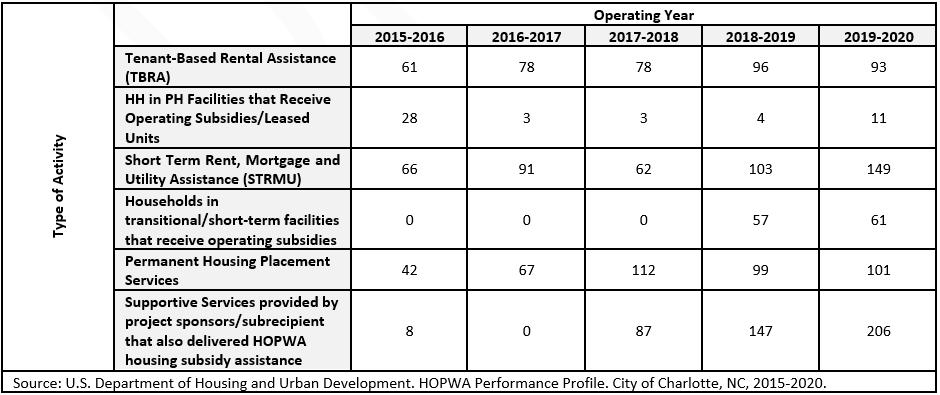
Table 26: Activities
Although the funding allocated to Resource Identification to establish, coordinate, and develop housing assistance resources has increased by 162.2% since 2015, there was a decrease of $37,324 between operating years 2018-2019 and 2019-2020. Feedback from the survey respondents, both providers and consumers, highlight the importance of resource identification and the lack of housing resources. Increasing access and provision of resource identification is a housing need in the CCP coverage area.

Figure 22: U.S. Department of Housing and Urban Development. HOPWA Performance Profile. City of Charlotte, NC, 2015-2020.
Increasing development of housing plans and funding for Resource Identification are essential components that support HOPWA consumers. With the foundation of housing stability, HOPWA consumers and providers can then shift focus from the housing crisis to addressing medical needs and other services available through community-based organizations.
9. SUMMARY
This needs assessment has identified several housing needs of PLWHA and provided recommendations and strategies for addressing these housing needs. PLWHA repeatedly face barriers trying to find suitable, affordable housing. Even if housing that is affordable is identified, there are often personal barriers like poor credit history, criminal history, lack of transportation, insufficient income, and past evictions that prevent people from moving forward. This report identifies 5 key recommendations and several strategies to address these housing needs. While it is not possible to implement every strategy in a timely manner, it is recommended that the planners and decision-makers for the HOPWA program look at adopting a handful of strategies over the next 3-5 years to increase affordable housing opportunities for PLWHA. The need continues to rise. The City of Charlotte, CCP, and the larger provider network have many strengths to implement these strategies. The providers’ survey demonstrated diverse geographic coverage, indicating PLWHA have at least one HIV-related resource in each county. Providers also range in type of organization and size which can lead to increased outreach to PLWHA who may not access traditional HIV organizations and providers. A large amount of HOPWA assistance is currently targeted toward TBRA. This allows for long-term housing stability and support services. The TBRA program boasts many success stories of long-term stability and upward economic mobility. Interview and survey participants were eager to provide input and are committed to meeting the housing needs of PLWHA. A strong backbone agency like CCP and dedicated providers, combined with public and private resources, can lead the community forward to ensure stable housing is for all. When consumers thrive, communities thrive. We would like to thank the many consumers who contributed their valuable feedback via surveys and interviews. We would also like to thank the following organizations for engaging and providing input throughout this process.
Mecklenburg County RAO Community Health Carolinas CARE Partnership Statesville Housing Authority House of Mercy Positive Wellness Alliance
Salvation Army Center of Hope Time Out Youth Affinity Health Atrium ID Consultants
Kintegra Health City of Charlotte Regional Housing Partnerships Gastonia Housing Authority Rowan Helping Ministries RAIN Dudley’s Place Nside Out Excellence
Bradley Reid Corporation ROOF Above Socialserve
NCAAN
Supportive Housing Communities Quality Home Care CREW Project Anuvia Prevention & Recovery Center Mcleod Addictive Disease Center North Carolina Balance of State CoC Charlotte/Mecklenburg CoC
TABLE OF INTERACTIVE MAPS
Interactive Map 1: Economic Maps........................................................................................................................25 Interactive Map 2: Opportunity Atlas for the Region................................................................................................27 Interactive Map 3: Race and Ethnicity in the Service Area.........................................................................................29 Interactive Map 4: Rate of Un-insurance.. ...............................................................................................................30 TABLE OF FIGURES Figure 1: HOPWA CAPER. City of Charlotte, NC. Operating year 07/01/2019-06/30/2020.......................................3 Figure 2: HIV/AIDS Population in the 10-county Area.............................................................................................. 15 Figure 3: Cases per County in the Region around Charlotte, NC.............................................................................. 15 Figure 4: HIV/AIDS by Zip Code in Mecklenburg County........................................................................................ 17 Figure 5: Sex/Gender of People Living with HIV/AIDS in Mecklenburg, US, and Region............................................ 17 Figure 6: Race/Ethnicity of People with HIV/AIDS................................................................................................... 18 Figure 7: Population and Population Projections.....................................................................................................20 Figure 8: Total Area: Household Size..................................................................................................................... 21 Figure 9: Total Area: Number of Bedrooms............................................................................................................ 21 Figure 10: Income Group Projections, Total Area....................................................................................................23 Figure 11: Total Area: Median Income by Tenure.....................................................................................................24 Figure 12: Labor Force and Labor Force Forecast....................................................................................................25 Figure 13: Race Projections in the Total Area...........................................................................................................28 Figure 14: U.S. Department of Housing and Urban Development. 2020 Point in Time Count......................................32 Figure 15: U.S. Department of Housing and Urban Development. HOPWA Grant Performance Profile. 2015-2020. ..............33 Figure 16: Survey, Income Source .........................................................................................................................39 Figure 17: Survey, Current Living Situation..............................................................................................................40 Figure 18: Provider Housing Needs Assessment Survey ..........................................................................................42 Figure 19: Housing Needs ...................................................................................................................................44
Figure 20: U.S. Department of Housing and Urban Development. HOPWA Performance Profile. City of Charlotte, NC, 2015-2020.........................................................................................................................46 Figure 21: U.S. Department of Housing and Urban Development. HOPWA Performance Profile. City of Charlotte, NC, 2015-2020.........................................................................................................................47 Figure 22: U.S. Department of Housing and Urban Development. HOPWA Performance Profile. City of Charlotte, NC, 2015-2020. .......................................................................................................................48 TABLE OF TABLES
Table 1: CCP Coverage Area Profile....................................................................................................................... 14 Table 2: HIV/AIDS in the CCP Area........................................................................................................................ 16 Table 3: Age of People with HIV/AIDS in Mecklenburg, US, and Region................................................................... 18 Table 4: Projected Population Growth................................................................................................................... 19 Table 5: Age and Age Projections .........................................................................................................................20 Table 6: Total Area Income Projections ..................................................................................................................22 Table 7: Difference in Median Income by Tenure.....................................................................................................24 Table 8: Maximum Rent Based on 2021 Social Security Benefits...............................................................................24 Table 9: Common Occupations............................................................................................................................26 Table 10: Demographic Changes to Race and Ethnicity...........................................................................................28 Table 11: Race and Race Projections.......................................................................................................................29 Table 12: Sex/Gender and Projections ..................................................................................................................30 Table 13: Total Number of Persons Experiencing Homelessness Living with HIV/AIDS................................................ 31 Table 14: Total Area Housing by Type ....................................................................................................................34 Table 15: Homes Permitted by Type (2010-2020)....................................................................................................35 Table 16: Housing Gap ........................................................................................................................................35 Table 17: Fair Market Rent.....................................................................................................................................35
Table 18: Median Housing Costs by Tenure............................................................................................................36 Table 19: Survey, Challenges Experienced .............................................................................................................38 Table 20: Survey, Housing Costs...........................................................................................................................39 Table 21: Survey, Considered Moving....................................................................................................................40 Table 22: Survey, Barriers Identified.......................................................................................................................43 Table 23: Survey, Significant Needs.......................................................................................................................44 Table 24: Receiving HOPWA Assistance................................................................................................................45 Table 25: Carolinas CARE Partnership Contracted Provider Service Array..................................................................46 Table 26: Activities...............................................................................................................................................47
U.S. Department of Housing and Urban Development (HUD). www.hudexchange.info/programs/hopwa National AIDS Housing Coalition. Housing is Healthcare. http://nationalaidshousing.org/housing-and-health/ National Health Care for the Homeless Council. 2011. Homelessness & Health: What’s the Connection? http://www.nhchc. org/wp-content/uploads/2011/09/Hln_health_factsheet_Jan10.pdf U.S. Department of Housing and Urban Development. HUD Awards and Allocations. www.hudexchange.info/grantees/ allocations-awards
Housing Opportunities for Persons with AIDS (HOPWA) Program. Consolidated Annual Performance and Evaluation Report (CAPER). City of Charlotte, NC. Operating year 07/01/2019-06/30-2020. U.S. Department of Housing and Urban Development. HOPWA Performance Profile. City of Charlotte, Operating Year 2015-2020.
National Low Income Housing Coalition. The Gap Report-North Carolina, 2019. Available at: https://reports.nlihc.org/ gap/2019/nc U.S. Department of Housing and Urban Development. HOPWA Rental Assistance Guidebook. https://files.hudexchange. info/resources/documents/HOPWARentalAssistanceGuidebook.pdf North Carolina Housing Finance Agency. Available at: https://www.nchfa.com/rental-housing-partners/rental-developers/ rental-development-financing-options/low-income-housing-tax-credits SC Housing. Available at: https://www.schousing.com/Home/HousingTaxCredits Urban Institute. How Communities Are Rethinking Zoning to Improve Housing Affordability and Access to Opportunity. Centers for Disease Control and Prevention. Communities in Crisis: Is There a Generalized HIV Epidemic in Impoverished Urban Areas of the United States. Paul Denning and Elizabeth DiNenno, 2019. Available at: https://www.cdc.gov/hiv/ group/poverty.html#1 Social Security Administration. 2021 Social Security Changes Fact Sheet. Available at: https://www.ssa.gov/news/press/ factsheets/colafacts2021.pdf Housing Opportunities for Persons with AIDS (HOPWA) Program. Consolidated Annual Performance and Evaluation Report (CAPER). City of Charlotte, NC. Operating year 07/01/2019-06/30-2020. Housing Opportunities for Persons with AIDS (HOPWA) Program. Consolidated Annual Performance and Evaluation Report (CAPER). City of Charlotte, NC. Operating year 07/01/2019-06/30-2020. Housing Opportunities for Persons with AIDS (HOPWA) Program. Consolidated Annual Performance and Evaluation Report (CAPER). City of Charlotte, NC. Operating year 07/01/2019-06/30-2020. Housing Opportunities for Persons with AIDS (HOPWA) Program. Consolidated Annual Performance and Evaluation Report (CAPER). City of Charlotte, NC. Operating year 07/01/2019-06/30-2020. U.S. Department of Housing and Urban Development. HOPWA Performance Profile. City of Charlotte, Operating Year 2015-2016.