NNAP
RCPCH Audits
National Neonatal Audit Programme
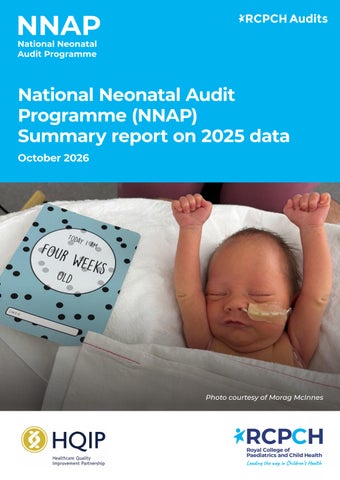
National Neonatal Audit Programme (NNAP) Summary report on 2025 data October 2026
Photo courtesy of Morag McInnes
RCPCH Royal College of Paediatrics and Child Health
NNAP
National Neonatal Audit Programme
Summary report on 2025 data About this report
3
Results at a glance
4
Key findings & recommendations
6
1. Partnership in care
6
2. Neonatal care processes
9
3. Outcomes of neonatal care
11
NNAP governance Further details of the NNAP governance structure and membership of the NNAP Project Team, Project Board and
Front cover photo courtesy of Morag McInnes
Methodology and Dataset Group are available at: www.rcpch. ac.uk/work-we-do/quality-improvement-patient-safety/ national-neonatal-audit-programme/governance-delivery
Skin to skin and holding Isla out of her cot was so important for us all. We even managed to mark some milestones whilst doing it.
Further information: Further information about the background, aims, and scope of the NNAP is available at: www.rcpch.ac.uk/about-nnap
© 2026 Healthcare Quality Improvement Partnership (HQIP) Published by RCPCH October 2026. Cite as: National Neonatal Audit Programme (NNAP) Summary report on 2025 data. RCPCH: London, 2026. The Royal College of Paediatrics and Child Health is a registered charity in England and Wales (1057744) and in Scotland (SCO38299).
2
National Neonatal Audit Programme Summary report on 2025 data
About this report This report summarises key messages and national recommendations on NNAP measures, based on data relating to babies cared for in neonatal units in England, Scotland, Wales and the Isle of Man between 1 January and 31 December 2025. A line-of-sight table describing the evidence base for this report’s recommendations is available at: www.rcpch.ac.uk/resources/NNAPsummary-report-2025-data. Further information about the background, aims, and scope of the NNAP is available at: www.rcpch.ac.uk/about-nnap
How to use additional NNAP resources: Extended analysis report The NNAP 2025 data extended analysis report, available at: www.rcpch.ac.uk/resources/NNAP-summary-report-2025-data provides results for each NNAP measure by unit type, by neonatal network, and overall. Use this report to: •
understand the results for each measure in more detail, compare performance at unit and network level, and identify where improvement is needed
•
access recommended next steps for services seeking improvement, with links to further resources and case studies.
NNAP Online NNAP Online, available at: www.rcpch.ac.uk/resources/NNAPdashboards provides full annual results at unit and network level, interactive reporting tools and unit posters. Use this dashboard to access spine plots summarising your unit or network’s performance across NNAP metrics. We recommend these plots for accountability reporting.
Public Access Dashboard The Public Access Dashboard, provides provisional monthly updated time-series results. Neonatal services and networks can use a restricted access version (Restricted Access Dashboard). Available at: www.rcpch.ac.uk/resources/NNAP-dashboards
Further resources Further data about maternity and perinatal services is available from the National Maternity & Perinatal Audit (NMPA) and Mothers and Babies: Reducing Risk through Audits and Confidential Enquiries across the UK (MBRRACE-UK). The NMPA measures aspects of maternity and neonatal care provided by NHS maternity services in England, Scotland and Wales. MBRRACEUK conducts national surveillance and investigates the deaths of women and babies who die during pregnancy and shortly afterwards. RCPCH &Us seeks and shares the views of children, young people, parents and carers to influence and shape health policy and practice. Use RCPCH &Us resources to support your improvement activities: www.rcpch. us/our-resources/.
Data outliers Neonatal services identified as outliers should use this information to review the causes of outlier status and stimulate quality improvement. See outlier analysis on NNAP Online: www.rcpch.ac.uk/resources/NNAP-dashboards
NNAP unit posters NNAP unit posters communicate selected NNAP results for a neonatal unit to parents and families. They should not be used for accountability reporting. Available at: www.rcpch.ac.uk/resources/NNAP-dashboards
NNAP for parents and families Further information about the NNAP for parents and families is available at: www.rcpch.ac.uk/your-babys-care
3
NNAP
National Neonatal Audit programme
Results at a glance The National Neonatal Audit Programme (NNAP) assesses whether babies admitted to neonatal units receive consistent high-quality care and identifies areas for improvement. This poster summarises both the combined national and network level results based on NNAP data relating to babies receiving neonatal care in England, Scotland, Wales and the Isle of Man from January-December 2025. Results displayed in the horizontal pink bars show the range of neonatal network proportions (lowest and highest) and the pink circles shows the overall audit results. A green arrow, whether pointing up or down denotes a positive change compared to the previous year, whereas a red arrow, pointing up or down denotes a negative change.
Partnership in care Parent consultation within 24 hours 94.5% of 56,127 parents had a documented consultation with a senior member of the neonatal team within 24 hours of their baby’s admission.
87.8%
Parent inclusion in consultant ward rounds
94.5%
38% of 748,398 baby care days had a consultant-led ward round with at least one parent included.
97.8%
14 DAYS
75.0%
81.8%
88.4%
AT DISCHARGE
0.9% increase from previous year (2024: 80.9%)
70.7%
88.3%
72.5%
82.9%
92.3%
50.3% of 10,983 mothers of babies born at less than 34 weeks’ were 46.4% given a full course of antenatal steroids in the week prior to delivery.
50.3%
61.9%
83.4%
91.7%
80.4%
88.1%
70.7% of 11,120 babies born at less than 34 weeks’ received their mother’s milk at discharge. 2% increase from previous year (2024: 68.7%)
Medical follow up at two years 80.5% of 3,712 babies born at less than 30 weeks’ had a documented medical follow up at the right time.
60.6%
Breastmilk feeding at discharge
Breastmilk feeding at 14 days of life 81.8% of 11,211 babies born at less than 34 weeks’ received their mother’s milk at 14 days of life.
59.9%
2% increase from previous year (2024: 36%)
0.3% decrease from previous year (2024: 94.8%)
WITHIN
38%
26.4%
Neonatal nurse staffing 73.4%
80.5%
82.9% of 126,898 nursing shifts were staffed according to recommended levels.
87.6%
2% increase from previous year (2024: 78.5%)
1.4% increase from previous year (2024: 81.5%)
Neonatal care processes Antenatal steroids
Perinatal optimisation composite 25.4% of 12,704 babies received all appropriate measured elements of optimal perinatal care.
17.5%
25.4%
30.2%
2.9% increase from previous year (2024: 22.5%)
1.6% decrease from previous year (2024: 51.9%)
Antenatal magnesium sulphate 88.3% of 3,681 mothers of babies born at less than 30 weeks’ were given antenatal magnesium sulphate.
86.4%
Born in a centre with a NICU
88.3%
NICU
1.6% increase from previous year (2024: 86.7%)
3.2% increase from previous year (2024: 73.6%)
70.5%
4.2% increase from previous year (2024: 79.2%)
Normal temperature on admission
Deferred cord clamping 76.8% of 12,663 babies born at less than 34 weeks’ had their cord clamped at or after one minute.
83.4% of 1,859 babies born at less than 27 weeks’ were born in a centre with a NICU on site.
92.3%
73.0%
76.8%
83.9%
80.4% of 12,727 babies born at less than 34 weeks’ were admitted 74.6% with a temperature within the recommended range of 36.5°C-37.5°C. 2.5% increase from previous year (2024: 77.9%)
Note that all previous years’ results in the 2025 report use the latest metric definitions, methodology and data (as of March 2025) to ensure figures are comparable between years. For this reason, results from previous years may not match previously published NNAP annual results.
4
© 2026 Healthcare Quality Improvement Partnership (HQIP)
WITHIN
2
DAYS
Breastmilk feeding in first 2 days of life
Outcomes of neonatal care
73.5% of 12,531 babies born at 61.2% less than 34 weeks’ received their mother’s milk in the first 2 days of life.
73.5%
83.6%
Complications of prematurity composite
4.7% increase from previous year (2024: 68.8%)
57.9% of 6,456 babies born at less 51.4% than 32 weeks had no reported serious complication of prematurity.
On-time screening for retinopathy of prematurity (ROP) 84.4% of 6,518 eligible babies were screened on time for ROP.
72.6%
84.4%
91.1%
63.2%
40.5%
46.1%
2.4%
5.3%
7.7%
3.4%
5.7%
8.7%
2.5%
4.8%
8.2%
1.3% increase from previous year (2024: 56.6%)
Bronchopulmonary dysplasia (BPD)
4.5% increase from previous year (2024: 79.9%)
40.5% of 6,986 babies born at less than 32 weeks developed BPD or died.
Non-invasive breathing support 52.8% of 6,568 babies born at less than 32 weeks’ received only noninvasive breathing support in the first seven days of life.
57.9%
42.5%
52.8%
60.4%
1% increase from previous year (2024: 51.8%)
36.0%
0.7% increase from previous year (2024: 39.8%)
Late onset bloodstream infection 5.3% of 9,072 babies born at less than 32 weeks had growth of a clearly pathogenic organism. 0.1% increase from previous year (2024: 5.2%)
Further information and resources
Mortality to discharge home 5.7% of 6,677 babies born at less than 32 weeks died before discharge home. 0.7% decrease from previous year (2024: 6.4%)
Full annual results Full annual results at neonatal unit and network levels, interactive reporting tools and unit posters are available on NNAP Online at: www.rcpch.ac.uk/resources/NNAP-dashboards
Necrotising enterocolitis 4.8% of 6,690 babies born at less than 32 weeks developed necrotising enterocolitis. 0.2% decrease from previous year (2024: 5.0%)
Extended analysis report The NNAP 2025 Data: Extended Analysis Report, provides in-depth results and a summary of findings by audit measure, along with full national recommendations, local quality improvement recommendations and links to case studies and useful resources. It is available at: www.rcpch.ac.uk/resources/NNAP-summary-report-2025-data
Your Baby’s Care guide Parents and families can find more information about the NNAP and the 2025 results in Your Baby’s Care, a guide to the NNAP. NNAP Online also provides more detailed results for each neonatal unit and network. Your Baby’s Care: www.rcpch.ac.uk/resources/your-babys-care NNAP Online: www.rcpch.ac.uk/resources/NNAP-dashboards
How we use information To find out more about how we use information about babies experiencing neonatal care and their mothers, visit www.rcpch.ac.uk/about-us/privacy-hub/ NNAP or scan the QR code to access our parent resources, including our privacy notice.
Preterm brain injury – Intraventricular haemorrhage (IVH) 12.8% of 6,750 babies born at less than 32 weeks experienced IVH grades 3 or 4, or death.
9.5%
12.8%
15.6%
0.7% decrease from previous year (2024: 13.5%)
Preterm brain injury – post-haemorrhagic ventricular dilation (PHVD) 11.2% of 6,807 babies born at less than 32 weeks experienced PHVD or death.
8.0%
11.2%
15.3%
10%
14.3%
0.1% decrease from previous year (2024: 11.3%)
Preterm brain injury – cystic periventricular leukomalacia (cPVL) 10% of 6,807 babies born at less than 32 weeks experienced cPVL or death
6.4%
0.6% decrease from previous year (2024: 10.6%)
Note that all previous years’ results in the 2025 report use the latest metric definitions, methodology and data (as of March 2025) to ensure figures are comparable between years. For this reason, results from previous years may not match previously published NNAP annual results.
© 2026 Healthcare Quality Improvement Partnership (HQIP) 5
National Neonatal Audit Programme Summary report on 2025 data
Key findings & recommendations For the first time, mortality to discharge in babies born at less than 32 weeks is below 6%, and there appears to be improvement this year in the proportion of babies experiencing necrotising enterocolitis (NEC). Progress also continues in the proportion of babies receiving their mother’s milk by day 2, at day 14 and at discharge; these improvements are also seen in the proportions exclusively breastmilk fed. Delivery of most perinatal optimisation interventions has also improved, as has the proportion of babies experiencing an optimal perinatal care journey. While this report highlights opportunities to improve and to reduce variation, it also provides an opportunity to celebrate the achievements of perinatal and neonatal teams, and we hope it provides a catalyst for sharing and learning from exemplary care and improvement interventions. The NNAP Restricted Access Dashboard (RAD) received over 30,000 visits from 1,200 users in 2025. We hope that
1
frequent engagement with NNAP data throughout the year via the RAD has supported, and will continue to support, local improvement. Last year, the NNAP reported some care process and partnership metrics by ethnicity for the first time. Reporting this year has been strengthened by a reduction of missing ethnicity data, from 8.6% in 2024 to 4.7% in 2025 among babies born at less than 34 weeks’ gestation, reflecting considerable efforts by neonatal teams to improve completeness. We report adherence to NNAP measures by reported ethnicity as raw, unadjusted proportions for measures where we have previously demonstrated disparity by ethnicity.1 In the extended analysis, we show proportions standardised for gestation alongside raw results. By applying the national gestational age distribution to each ethnicity, we show proportionate adherence that would be observed if preterm babies of all ethnicities were delivered in the same gestational age distribution.
Partnership in care
Key findings Communication and decision-making Parents had a consultation with a senior member of the neonatal team within 24 hours for 94.5% (53,036 of 56,127) of admissions. Although this is achieved for most admissions, there has been a minor aggregate decline in adherence over the last three years which may reflect that this measure is no longer subject to outlier management.2 A marked decline in adherence in the London South Network, where there are known data flow issues affecting some neonatal units, may also have contributed (NNAP Online, Extended Analysis Report).
We have been very involved throughout the whole process. The doctors check on us throughout the day—even if we miss the ward round. When they pass us in the corridor, they always check to see how we’re doing and if we’re okay. Parent of a neonate
Excellent care is trust, communication and parents being equal. Parent of a neonate
Parental consultation within 24 hours took place for a lower proportion of admissions when the mother was Black (93.3% adherent (CI - 92.6% - 94%)) than for Asian mothers (94.6% adherent (CI - 94.1% - 95.1%)), White mothers (95% adherent (CI - 94.8% - 95.2%)), or those grouped as Mixed/Other (94.9% adherent (CI - 94.1% - 95.7%)) (Extended Analysis Report). These results are unadjusted for background variables, but standardisation for gestational age does not alter the interpretation of the finding. The NNAP looks at whether a parent was involved in the ward round for each day of a baby’s stay. Overall, this was reported for 38% (284,429 of 748,398 baby care days); an improvement since 2024, when the proportion was 36%. There continues to be wide variation in how well daily parent involvement in ward rounds is achieved geographically, ranging from 26.4% to 59.9% between neonatal networks (NNAP Online, Extended Analysis Report).
1. Pettinger K, Pons Perez S, Legge H, Ojha S, Odd D, Oddie S. Does neonatal care delivery in England and Wales vary by deprivation and ethnicity: a retrospective cohort study. BMJ Paediatrics Open. 2025;9:e003585. 2. Cochran-Armitage test for trend, p<0.01.
6
National Neonatal Audit Programme Summary report on 2025 data Parental inclusion on the consultant ward round took place for a lower proportion of baby care days when the mother was Asian (32.1% adherent (CI - 31.9% - 32.3%)), Black (36% adherent (CI - 35.7% - 36.3%)), or Mixed or other ethnic background (36.3% adherent (CI - 35.8% - 36.8%)) than for White mothers (40.4% adherent (CI - 40.3% - 40.5%)) (Extended Analysis Report). These results are unadjusted for background variables, but standardisation for gestational age does not alter the interpretation. Changes to the way that ward round data are recorded in clinical systems make it difficult to compare data over time, and to effectively interpret the impact of missing data, and therefore the NNAP recommends caution when comparing and interpreting results. Feedback to the audit team from some users has indicated that parent partnership could be measured in ways
which better take into account other opportunities for parents’ inclusion. The NNAP is exploring what parent partnership in care means to parents and families, and how to measure it better.
Breastmilk feeding in babies born preterm There has been marked ongoing improvement in the overall proportion of babies born at less than 34 week’s gestational age receiving any of their mother’s milk by day 2 of life, from 54.3% in 2022 to 73.5% (9,209 of 12,531) in 2025 (Figure 1).3 A similar trend is seen in the proportion of babies exclusively receiving breastmilk, from 36.6% in 2022 to 54.4% (6,815 of 12,531) in 2025. However, variation between neonatal units continues to be very wide; from 32.4% to 100% (Extended Analysis Report).
Figure 1: Breastmilk feeding by day two of life, by year.
100
Proportion (%)
80
60
40
20
0 2017
2018
2019
2020
2021
2022
2023
2024
2025
Year National proportion
There continues to be year-on-year improvement in the proportion of babies receiving any of their mothers’ own milk at day 14 and at discharge home. At day 14, the proportion has increased from 78.6% in 2022, to 81.8% (9,173 of 11,211) in 2025. At discharge home, the proportion has increased from 64% in 2022, to 70.7% (7,860 of 11,120) in 2025 (Extended Analysis Report). Improvement is also seen at both time points in the proportion of babies receiving exclusive breastmilk feeding. At day 14, changing from 52.1% in 2022, to 56.8% (6,365 of 11,211) in 2025; and at discharge, from 36.8% in 2022, to 41.8% (4,649 of 11,120) in 2025 (Extended Analysis Report)). This suggests that improvement is not at the expense of exclusive breastmilk feeding. 3
National proportion missing data
At both day 14 and at discharge, a lower proportion of babies received any of their mother’s milk when the mother was White, compared to other ethnic groups. At day 14, 78% (CI - 77% - 79%) of babies born to White mothers received their mother’s own milk, compared to Asian (89.2% (CI - 87.9% - 90.5%)), Black (88.1% (CI 86.2% - 90%)), or those grouped as Mixed/Other (86.5% (CI - 83.9% - 89.1%)). Notably, this difference is not seen in rates of breastmilk feeding by day two, at which time point mothers own milk use is least common among babies born to Black mothers (Mixed/Other – 76.6% (CI - 73.6% - 79.6%); Asian – 75.2% (CI - 73.4% 77%); White – 73.7% (CI - 72.7% - 74.7%); Black – 70.3% (CI - 67.8% - 72.8%)) (Extended Analysis Report). These results are unadjusted for background variables, but
Cochran-Armitage test for trend, p<0.01.
7
National Neonatal Audit Programme Summary report on 2025 data
standardisation for gestational age does not alter the interpretation.
Neurodevelopmental follow-up at two years Overall, there has been a year-on-year improvement in the delivery of neurodevelopmental follow-up at two years of age over the last 5 years, from 70% in 2020, to 80.5% (2,988 of 3,712) in 2025. Proportions of two year follow up are lower where the mother is of Mixed/other ethnicity (69.7% adherent (CI - 62.9% - 76.5%)), than for White (80.5% adherent (CI - 78.9% - 82.1%)), Asian (84% adherent (CI - 81% - 87%)), and Black mothers (81.5% adherent (CI - 77.6% - 85.4%)) (Extended Analysis Report). These differences persist when results are standardised for gestational age, however the analysis is unadjusted for background variables. The NNAP is currently undertaking an exploratory analysis to understand the neurodevelopmental outcome of very preterm babies at two years of age. Fifty-nine units achieving a follow up rate of 90% or higher in 2025 will be included in this exploratory analysis. To support better reporting of neurodevelopmental outcomes, the NNAP will be issuing updated guidance around entering data onto BadgerNet, alongside introducing this reporting into the Restricted Access Dashboard.
Nurse staffing Overall, neonatal nurse staffing levels continue to improve. In 2025, 82.9% (105,199 of 126,898) of shifts were numerically staffed according to guidelines and service specification, compared to 81.5% in 2024 (Extended Analysis Report). This continued improvement is likely to reflect central investment in neonatal nurse staffing in England, Scotland and Wales. 4,5,6
The nurses have really helped me transition to feeding my baby myself and gave me confidence handling my baby when she was so small in the early days. Parent of a neonate
Aman was born at just 24 weeks. This was one of our many precious skin-to-skin moments, but I didn’t get to hold him like this until more than 20 days after giving birth. He was so poorly, so tiny, and so fragile. Moments like this meant everything. Photo courtesy of Zainab Yunus
Recommendations: 1. As recommended in 2024, to monitor and act upon ethnicity disparities, Neonatal networks should work with the perinatal teams in their constituent neonatal units to: •
ensure that staff receive appropriate and consistent training to confidently ask families about their ethnicity and that of their baby, and to accurately record demographic information,
•
use the NNAP dashboard to review how well NNAP partnership in care and care process measures are delivered locally, and then whether this differs by ethnicity
•
where differences exist, seek to understand the underlying causes, and
•
with families, co-design quality improvement programme that directly address those causes.
2. So that early breastmilk feeding is prioritised and achieved equitably for all babies, the Royal College of Paediatrics and Child Health (RCPCH), the Royal College of Obstetricians and Gynaecologists (RCOG), and the Nursing and Midwifery Council (NMC) should review their standards and curricula and, where necessary, strengthen them to ensure that the importance of early breastmilk feeding for preterm babies during neonatal care is embedded in early obstetric, midwifery, neonatal medical and nursing training.
4. NHS England. Three Year Delivery Plan for Maternity and Neonatal Services. March 2023. 5. Scottish Government. Maternity and neonatal care – Best Start five-year plan 2017-2024: report. May 2025. 6. Health Education and Improvement Wales. Strategic perinatal workforce plan. July 2025.
8
National Neonatal Audit Programme Summary report on 2025 data
2
Neonatal care processes
Key findings Optimal perinatal care There has been a reduction in the proportion of mothers receiving a full course of antenatal steroids since 2024, to 50.3% (5,522 of 10,983) (Extended Analysis Report).
This reduction in adherence to the NNAP metrics does not necessarily reflect poorer care and may reflect only that teams are focussing on ensuring that the intervals between doses of antenatal steroids are appropriate and in line with RCOG guidelines. The proportion of mothers given antenatal steroids courses at inappropriate dosing intervals ranges from 2.6% to 27.7% between neonatal networks (Figure 2). This represents unwarranted variation in practice, and opportunities for improvement in the delivery of antenatal steroids in line with guidelines. The NNAP metric will be amended in 2027 to reflect achievement of the appropriate dosing interval.
Figure 2: Antenatal steroid dose timing by neonatal network, 2025.
100
Given - Appropriate Given - Inappropriate Given - Timing missing
Percentage (%)
80
Not given
60
40
20
0
Lo n
Ke Ea Lo Lo We No E T Wa So Sc Yo No ot rk nd nd uth s nt rth ast M ham rt l o on st M Su t En es es nN We land shire hern idl gla n So NW idla Wes V a Hu a s CE rrey nd nd t uth t lle nd Su mb s yW s sse er sx x
do
Overall, there continues to be a steady improvement in the proportion of extremely preterm babies born in a centre with a NICU, with an increase from 79.2% in 2024 to 83.4% (1,551 of 1,859) in 2025 (Extended Analysis Report). Significant geographical variation does remain between regional networks, from 70.5% to 91.7% (NNAP Online, Extended Analysis Report). Ongoing improvement in the delivery of deferred cord clamping continues, with 76.8% (9,727 of 12,663) of eligible babies receiving this important intervention in 2025, compared with 60.6% in 2022 (Extended Analysis Report). Geographical variation appears to have reduced over time, however there is still some evidence of a significant difference between the worst performing network 73% (CI - 69.9% - 76%) and the best performing network 83.9% (CI - 81.4% - 86.4%) (NNAP Online, Extended Analysis Report).
There is a recognisable and important difference in unadjusted and adjusted analyses in the proportion of preterm babies who experience deferred cord clamping between Black babies and White babies in the 2025 data (Black - 71.5% (CI - 69.1% - 73.9%), White - 77.5% (CI - 76.6% - 78.4%)), although not in the babies categorised as Asian (77.8% adherent (CI - 76.1% - 79.5%) (Extended Analysis Report). These results are unadjusted for background variables, but standardisation for gestational age does not alter the interpretation, and the reasons for this disparity remain unexplained. National initiatives, such as the Maternity Disparities Taskforce in England, may wish to explore further the mechanisms underpinning this disparity in neonatal care delivery. A greater proportion of babies are now receiving all relevant measured optimal perinatal care interventions7; 25.4% in 2025 (3,221 of 12,704), an increase 9
National Neonatal Audit Programme Summary report on 2025 data
from 7.7% in 2021 (Figure 3). However, three out of four babies still do not have an optimal perinatal care journey, with evidence of unwarranted geographical variation (network range – 17.5% to 30.2%) in use of these well-established interventions (NNAP Online, Extended Analysis Report). This suggests that reliable,
standardised multidisciplinary processes are not yet embedded consistently. Improvement requires a wholepathway approach spanning obstetrics, neonatology and network configuration.
Figure 3: Perinatal optimisation composite, by year.
100
Proportion (%)
80
60
40
20
0 2017
2018
2019
2020
2021
2022
2023
2024
2025
Year National proportion
Non-invasive breathing support There has been a continued increase, overall, in the proportion of babies born at less than 32 weeks gestational age who only receive non-invasive breathing support in their first week of life, from 47.8% in 2022 to 52.8% in 2025. This reflects wider adoption of less invasive approaches to respiratory support, as recommended in NICE guidance. However, there is wide regional network variation in practice, even after considering the impact of gestational age, with treatment effects ranging from -8.9% to 10.4% (observed proportions: 42.5% to 60.4%).8 NNAP acknowledge that non-invasive breathing support will not be appropriate treatment for all preterm babies and provide benchmarking with this measure only to allow assessment of adherence to NICE guidance.
National proportion missing data
Retinopathy of prematurity (ROP) screening Overall adherence to the national ROP screening guideline continues to increase, from 66.4% in 2022 to 84.4% (5,500 of 6,518) in 2025. There are further opportunities for improvement in on-time screening which could potentially prevent irreversible sight loss, particularly where babies were screened late (548 of 6,518) or not at all (53 of 6,518) (Extended Analysis Report). There are practical challenges to the delivery of ROP screening, particularly in Special Care Units, and known challenges in recruiting paediatric ophthalmologists.9
7. Antenatal steroids, antenatal magnesium sulphate, birth in a centre with a NICU, deferred cord clamping, temperature on admission, breastmilk feeding by day 2. 8. A case mix adjustment process is used to calculate the non-invasive breathing support treatment effect for each unit and network. This shows whether differences in exposure are due to the care provided or the gestational age profile of the babies cared for. A negative treatment effect means babies would have been more likely to receive only non-invasive respiratory support in that unit/network than they would elsewhere. A positive treatment effect means babies would have been less likely to receive non-invasive breathing support than if treated elsewhere. 9. Clough N, Magan T, Jain S. The UK paediatric ophthalmology workforce crisis - a national perspective. Eye (Lond). 2025 Jun;39(9):1793-1796. doi: 10.1038/s41433-025-03755-9. Epub 2025 Mar 18. PMID: 40102569; PMCID: PMC12130465.
10
National Neonatal Audit Programme Summary report on 2025 data
Recommendations:
3
3. So that preterm babies’ crucial first few days more commonly lead to the best outcomes after optimal perinatal care and stabilisation at birth, national governments in England, Scotland, Wales and the Isle of Man should
consider describing a national ambition to double the proportion of very preterm babies exposed to all relevant measured perinatal optimisation interventions over the next 5 years.
Outcomes of neonatal care
babies cared for by the networks (NNAP Online, Extended Analysis Report).11
Key findings Mortality to discharge home Overall, there is an apparent reduction in the proportion of mortality to discharge home (or 44 weeks PMA) in babies born between 24 and 31 weeks gestational age; to 5.7% (379 of 6,677) in 2025.10 Between 2018 and 2024, mortality ranged between 6.2% and 6.6% (Figure 4). Mortality continues to vary by region, ranging from 3.4% to 8.7%. Treatment effect ranges from -2.3% to 2.4%, indicating that variation in mortality is not explained by differences in the background characteristics of the
The number of babies born at 22 weeks and admitted to neonatal care appears to have peaked, and rates of mortality among admitted babies remain similar, ranging between 66.7% and 78.6% over the period 2018-2025. The number of babies admitted at 23 weeks remains relatively stable, as does the mortality rate for admitted babies (50.4 - 54.9% between 2018 and 2025) (Extended Analysis Report).
Bronchopulmonary dysplasia Overall, there has been a further small increase in the proportion of babies born at less than 32 weeks gestational age who experience BPD or death; from 39.8% in 2024, to 40.5% (2,829 of 6,986) in 2025, despite
Figure 4: Mortality to discharge home, babies born at 24-31 weeks’ gestational age, by year.
10
Proportion (%)
8
6
4
2
0 2017
2018
2019
2020
2021
2022
2023
2024
2025
Year National proportion
National proportion missing data
10. Cochran-Armitage test for trend between 2024 and 2025, p=0.067. 11. In reporting outcomes, the NNAP describes the observed number of infants with an outcome, and a “balanced proportion” which is the proportion of that outcome in a matched group of babies with similar baseline characteristics to those in the network of interest. Comparing the balanced proportion to the observed proportion allows calculation of a “treatment effect”. Treatment effect is the difference between the observed and balanced proportion. A negative treatment effect means that the observed proportion is lower than the balanced proportion, and suggests that the babies were more likely to survive/not have a particular outcome in the network than elsewhere in the country. A positive treatment effect means that the observed proportion is higher than the balanced proportion, and suggests that the babies would have been more likely to survive/not have a particular outcome had they been born and treated elsewhere.
11
National Neonatal Audit Programme Summary report on 2025 data
a reduction in deaths over this period. This is consistent with the longer-term trend in the proportion of babies experiencing BPD or death since 2017, when the proportion was 36.7% (Extended Analysis Report).12 This trend could represent a worsening of this outcome, possibly influenced by a fall in mortality in 2025, or could simply indicate a growing willingness to administer oxygen to preterm infants whose underlying physiology does not differ from that in previous years.
Necrotising enterocolitis There is some evidence of a fall in the overall proportion of NEC over the last three years; 4.8% (324 of 6,690 in 2025, 5% in 2024, and 5.5% in 2023.13 Between 2017 and 2022, the proportion ranged between 5.9% and 6.6% (Extended Analysis Report). Network treatment effect, ranging from -2.6% to 3.6%, indicates that variation in NEC cannot be fully explained by differences in the background characteristics of the babies cared for by the networks (NNAP Online, Extended Analysis Report). This year, 92% (164 of 179) of neonatal units gave assurance that their NEC data for 2025 was accurate, however these findings should continue to be interpreted with caution and alongside rates of missing data for a given network or unit. There is evidence that breastmilk feeding can reduce the risk of developing NEC.14 While the NNAP has demonstrated improvements in the proportion of babies receiving any of their mother’s milk, the reasons for the apparent fall in NEC are not known.
Late onset bloodstream infection The overall proportion of babies born at less than 32 weeks who experienced late onset bloodstream infection was 5.3% (364 of 6,804). In previous years, proportions ranged between 4.4 and 5.8 from 2018 to 2024 (Extended Analysis Report).15 Observed proportions vary approximately threefold between neonatal networks, from 2.4% to 7.7%. Treatment effects range from -1.8% to 3.1%, suggesting that opportunities may exist to reduce unwarranted regional variation in proportions of bloodstream infection (NNAP Online, Extended Analysis Report). Following an agreement with the UKHSA to link infection data from the Second-Generation Surveillance System (SGSS) with neonatal data, the NNAP expects to be able to validate historical NNAP infection reporting and to use the linked data to strengthen future reporting of this measure.
Preterm brain injury Over the past few years, NNAP reporting of preterm brain injury has focussed on reducing rates of missing data and driving improvements in data quality. Data completeness continues to improve year on year; for IVH grades 3 or 4, falling from 26% in 2021, to 3.6% in 2025. However, network level variation in missing data remains; between 0.4% and 16.2% for IVH 3 or 4 (Extended Analysis Report). Apparent decreases in the rate of IVH 3 or 4, cPVL and PHVD over time should not confidently be interpreted as real change, given the historically high rates of missing data.
Recommendations: 4. As recommended in the NNAP 2024 data report, Neonatal networks should: a. Review mortality data and, where rates are higher than expected, develop locally prioritised improvement plans. Quality improvement activity should focus on best practices identified in Neonatal Networks with low mortality, with particular attention to differences in network structure, staffing, clinical governance, and clinical practice. (Recommendation repeated from the 2023 data report.) b. With their constituent units, undertake reviews of deaths in accordance with the BAPM Framework for Practice: Neonatal Mortality Governance and engage with statutory death review processes. Shared learning from these reviews should inform network governance and unit level clinical practice. 5. In line with the recommendation made in the NNAP 2024 data report, NHS England16 and health departments in Devolved Governments should work together to: a. issue clear, UK-wide guidance to neonatal services around the correct reporting of preterm brain injury including PHVD, so that robust data collection can support the achievement of the national ambition to reduce neonatal brain injury. b. develop a mandated, UK-wide NHS neonatal information standard to ensure that clinical reporting systems are interoperable, ensuring robust data collection to support effective measurement and reporting of all neonatal processes and outcomes.
12. Cochran-Armitage Test for trend since 2017, p<0.01. 13. Cochran-Armitage test for trend over 3 years, p = 0.068. 14. Margaret G. Parker, Lisa Stellwagen, Emily R. Miller, Lawrence Noble, Mark R. Corkins, Mark L. Hudak, Committee on Fetus and Newborn, Section on Breastfeeding, Committee on Nutrition; Promoting Human Milk and Breastfeeding for the Very Low Birth Weight Infant: Clinical Report. Pediatrics February 2026; 157 (2): e2025073625. 15. Cochran-Armitage test for trend over 3 years, p = 0.632. 16. 16. NHS England, or the succeeding responsible organisation in England.
12
A guide to the National Neonatal Audit Programme Summary report on 2025 data
The National Neonatal Audit Programme is commissioned by the Healthcare Quality Improvement Partnership (HQIP) and funded by NHS England and the Governments of Wales, Northern Ireland, Scotland and the Isle of Man as part of the National Clinical Audit and Patient Outcomes Programme.
RCPCH Royal College of Paediatrics and Child Health
Royal College of Paediatrics and Child Health 5-11 Theobalds Road, London, WC1X 8SH
© 2026 Healthcare Quality Improvement Partnership (HQIP) Royal College of Paediatrics and Child Health. Incorporated by Royal Charter and registered as a Charity in England and Wales: 1057744 and in Scotland: SCO38299. Registered Office 5-11 Theobalds Road, London WC1X 8SH. Patron HRH The Princess Royal. 13