NPDA
RCPCH Audits
National Paediatric Diabetes Audit
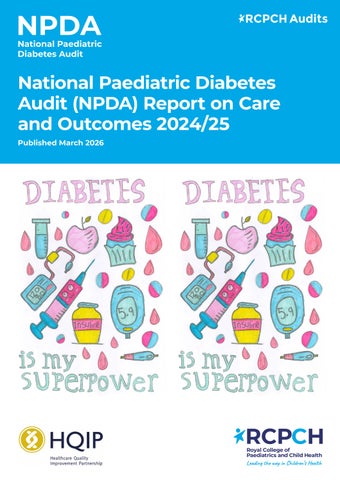
National Paediatric Diabetes Audit (NPDA) Report on Care and Outcomes 2024/25 Published March 2026
RCPCH Royal College of Paediatrics and Child Health
NPDA
National Paediatric Diabetes Audit
Contents Introduction 3 Key messages 4 National recommendations 5 2024/25 Results Summary 6 01. How many children and young people were receiving care from paediatric diabetes services in England, Wales, and Jersey?
6
02. What percentages of children and young people received all six recommended health checks?
7
03. What percentage of the recommended health checks were delivered by PDUs in 2024/25?
8
04. What percentages of children and young people with Type 1 diabetes received recommended checks at diagnosis?
8
05. Has there been improvement in national HbA1c?
9
06. What percentages of children and young people with diabetes were at risk of macrovascular and microvascular complications?
10
07. What percentages of children and young people with Type 1 diabetes were using diabetes-related technologies?
11
08. What was the average HbA1c for children and young people with Type 1 diabetes using different diabetes-related technologies?
12
09. What percentages of children and young people with Type 1 diabetes had diabetes-related hospital admissions?
13
10. How many children and young people with diabetes had a psychological assessment and were assessed as requiring additional psychological support?
13
Spotlight on inequalities 14 Quality improvement resources 15
© Healthcare Quality Improvement Partnership (HQIP) Cite as: National Paediatric Diabetes Audit Annual Report 2024-25: Care Processes and Outcomes. RCPCH: London, 2026. The Royal College of Paediatrics and Child Health is a registered charity in England and Wales (1057744) and Scotland (SCO38299)
2
Front cover artist: Tiana E
National Paediatric Diabetes Audit (NPDA) Report on Care and Outcomes 2024/25
Introduction The National Paediatric Diabetes Audit (NPDA) is managed by the Royal College of Paediatrics and Child Health (RCPCH), commissioned by the Healthcare Quality Improvement Partnership (HQIP) and funded by NHS England and the Governments of Wales and Jersey as part of the National Clinical Audit and Patient Outcomes Programme (NCAPOP).
HQIP is led by a consortium of the Academy of Medical Royal Colleges, and the Royal College of Nursing. Its aim is to promote quality improvement in patient outcomes, and in particular, to increase the impact that clinical audit, outcome review programmes and registries have on healthcare quality. For the NPDA this includes England, Wales, and Jersey. HQIP holds the contract to commission, manage, and develop the National Clinical Audit and Patient Outcomes Programme (NCAPOP), comprising around 40 projects covering care provided to people with a wide range of medical, surgical and mental health conditions. The programme is funded by NHS England, the Welsh Government and, with some individual projects, other devolved administrations and crown dependencies. www.hqip.org.uk/national-programmes The NPDA has been reporting for 22 years. Data is submitted by healthcare professionals in Paediatric Diabetes Units (PDUs) in England, Wales and, for 2024/25, Jersey. The NPDA reports on the outcomes and care experienced and received by children and young people with diabetes accessing these PDU services. Aside from section 01, Jersey are omitted from the Type 2 diabetes analyses to protect patient confidentiality, in line with RCPCH guidance. The effectiveness of diabetes care is measured against NICE guidelines (NG18, 2015 and QS125, 2016) and includes treatment targets, health checks, patient education, psychological wellbeing, and assessment of diabetes-related complications including acute hospital admissions, all of which are vital for monitoring and improving the long term health and wellbeing of children and young people with diabetes. In 2024/25, 100% of PDUs participated in the NPDA.
Further information: Further information on the background, aims, and scope of the NPDA is available at: https://www.rcpch.ac.uk/work-we-do/ clinical-audits/npda/about
Extended analysis: Extended analysis of the 2024/25 data, PDU level reports and posters, a glossary of terms used in this report, and links to Excel files of data at PDU, regional network and integrated/local care/health board (ICB, England/LHB, Wales) levels are available within the annual reports page: https://www.rcpch.ac.uk/resources/ npda-annual-reports The NPDA provides an annual summary of results and quarterly updates on key metrics at PDU, ICB/Health Board, Region, Regional Network, and Country level. https://www.rcpch.ac.uk/resources/ NPDA-dashboard
3
National Paediatric Diabetes Audit (NPDA) Report on Care and Outcomes 2024/25
Key messages Rising Caseloads Across Paediatric Diabetes Services The number of children and young people receiving care from a paediatric diabetes unit rose to 35,801 in England, Wales and Jersey in 2024/25, marking a 29% increase in caseload across England and Wales over the past decade.
Gaps in Health Check Completion for Young People
HbA1c, Microvascular, and Macrovascular Outcomes
Many young people with diabetes are not receiving all 6 annual health checks, as recommended by NICE:
The national median HbA1c for Type 1 diabetes has reduced to 58.0 mmol/mol, a 13 mmol/mol reduction (0.93 mmol/mol/ annum) since 2010/11, when the RCPCH published its first report for the NPDA for children and young people with diabetes.
•
10% of those aged <12 and 28% of those aged 12+ with Type 1 diabetes missed one or more health checks.
•
69% of those aged <12 and 60% of those aged 12+ with Type 2 diabetes missed one or more health checks.
HbA1c
BMI
Blood Pressure
Thyroid Test
Albuminuria
Foot Check
Persistent Variation and Inequalities
Hybrid closed loop (HCL) systems are associated with better HbA1c outcomes, yet uptake ranges from 12% to 94% at PDU level. Children and young people of all ethnic groups have seen an improvement in their use of diabetes technologies. However, Black children and young people experienced the lowest levels of technology use compared to others.
The prevalence of early markers of microvascular and macrovascular disease remains largely unchanged. Children and young people with Type 2 diabetes continue to experience higher rates of albuminuria and hypertension, despite having a lower median HbA1c (49.0 mmol/mol) than those with Type 1 diabetes. •
44% of those with Type 1 diabetes and 94% with Type 2 diabetes had a BMI in the overweight or obese range.
•
14% of those with Type 1 diabetes and 29% with Type 2 diabetes had a blood pressure above the 95th centile.
•
8% of those with Type 1 diabetes and 19% with Type 2 diabetes had a micro- or macro-albuminuria.
DKA at Diagnosis The rate of diabetic ketoacidosis (DKA) at diagnosis remains high at 28%, especially in children aged 0–4 years, although rates of post-diagnosis admissions have declined.
st st te te – – 1c 1c bAbA HH
Whilst the distribution of HbA1c for children and young people with Type 1 diabetes has reduced over time, there remains excessive variation, with the median HbA1c at PDU level ranging from 51.9 mmol/mol to 72.0 mmol/mol. Inequalities in HbA1c outcomes by deprivation and ethnic group have narrowed in 2024/25, but differences still persist.
4
0.1
National Paediatric Diabetes Audit (NPDA) Report on Care and Outcomes 2024/25
Recommendations The improvements in care process completion, access to treatment, and HbA1c outcomes cannot be understated and paediatric diabetes units should be congratulated for their efforts. The recommendations below are targeted at national bodies to take action in order to continue to drive improvements and address areas where standards are not currently met.
1
Commissioners should assess paediatric diabetes workforce capacity against the Workforce Standards for Children and Young People's Diabetes Services published by the National Children and Young People’s Diabetes Network (NCYPDN) in 2024 to support the delivery of minimum standards of care, such as NICE recommended health checks and the optimisation of technology usage, factoring in the 29% increase in the caseloads of paediatric diabetes units over the past decade. Action by: Integrated Care Boards in England, Local Health Boards in Wales, and The Government of Jersey. PDUs should leverage their patient care numbers in business cases to their commissioners to provide equitable workforce across all three nations.
2
Fundings bodies should invest in research to understand the progression from childhood signs of microvascular and macrovascular disease to the development of long-term diabetes complications. Research should examine whether treating early markers during childhood and adolescence (e.g. antihypertensive medication for high blood pressure) reduces future risk. Action by: Research funding bodies such as the NIHR, Diabetes UK, and Breakthrough T1D.
3
Children and young people who are overweight or obese must be offered holistic, non-judgemental, multidisciplinary support, including dietetic and psychological input. Every child or young person with diabetes should receive clear, practical guidance on healthy eating and active lifestyles, including safe diabetes management during exercise, in line with NICE guidance. Action by: National Children and Young People’s Diabetes Network, Integrated Care Boards in England, Local Health Boards in Wales, and The Government of Jersey.
4
Consideration should be given to reviewing current professional guidance and clinical pathways to ensure they adequately highlight the importance of timely detection of early signs of diabetes (thirst, polyuria, tiredness, and/or weight loss – the 4 Ts: Toilet, Thirsty, Tired, Thinner) with an aim to reduce the frequency of new presentations of diabetes with DKA. Those presenting with such signs/symptoms should have an immediate point-of-care blood glucose test performed. More research is required in this area to reduce presentation of Type 1 diabetes in DKA. Action by: National Institute for Health and Care Excellence (NICE), Integrated Care Boards in England, Public Health Teams in Local Health Boards in Wales, and The Government of Jersey.
5
Commissioners should use NPDA data (including the NPDA KPI dashboards and annual reports), alongside other trusted sources, to assess variation in care and outcomes within their areas of responsibility, especially focusing on inequalities by ethnicity and deprivation. This includes identifying barriers to equitable access and take up of diabetes technologies and establishing enablers to reducing inequalities. This relies on complete submission of demographic data into the NPDA by each paediatric diabetes team. Action by: Integrated Care Boards in England, the Getting it Right First Time (GIRFT) programme in England, Local Health Boards in Wales, and The Government of Jersey.
5
National Paediatric Diabetes Audit (NPDA) Report on Care and Outcomes 2024/25
2024/25 Results Summary SECTION 01
How many children and young people were receiving care from paediatric diabetes services in England, Wales, and Jersey?
0.1
There were 35,801 children and young people with diabetes receiving care from 172 PDUs in England, Wales and Jersey during 2024/25 (Table 1):
Country
Total number of children and young people with diabetes
Type 1 diabetes
Type 2 diabetes
Other rare forms*
Overall
35,801
33,478 (93.5%)
1,431 (4.0%)
892 (2.5%)
England
34,083 (95.2%)
31,819 (93.4%)
1,397 (4.1%)
867 (2.5%)
Wales
1,671 (4.7%)
1,614 (96.6%)
33 (2.0%)
24 (1.4%)
Jersey
47 (0.1%)
45 (95.7%)
1 (2.1%)
1 (2.1%)
Table 1: Number of children and young people by type of diabetes in 2024/25. *Includes Cystic Fibrosis Related Diabetes (CFRD), Maturity-Onset Diabetes of the Young (MODY), other specified diabetes mellitus, and “unknown/unspecified” types of diabetes.
The average caseload for each PDU was 208 (range 36 - 588) children and young people with diabetes. For England and Wales, this represents an increase of 29.2% (7,315 extra children and young people) over the last 10 years; from 27,682 in 2014/15 to 35,754 in 2024/25, an average increase of 2.9% per annum (Figure 1). England
Wales 1,750
40,000
30,000
1,700
Jersey 2024/25: 47
1,650 1,600
25,000
1,550
20,000
1,500
15,000
1,450 1,400
10,000
1,350
5,000
1,300
20 20 /2 1 20 21 /2 2 20 22 /2 3 20 23 /2 4 20 24 /2 5
20 19 /2 0*
20 18 /19
20 17 /18
20 16 /17
1,250
20 15 /1 6
20 14 /1 5
0
Figure 1: Total numbers of children and young people receiving care from PDUs in England and Wales, 2015/16 to 2024/25. Overall figures include Jersey from 2024/25 onwards. *166 out of 173 PDUs submitted information to the 2019/20 audit, artificially lowering numbers reported.
The incidence of new cases of Type 1 diabetes (0-15 years) increased from 27.6 new cases per 100,000 in 2023/24 to 28.3 in 2024/25 (Figure 2), with 3,392 new cases diagnosed and managed in PDUs across England, Wales, and Jersey. 6
Number in Wales
35,000 Number in England
Number of children and young people receiving care from a Paediatric Diabetes Unit
Overall
National Paediatric Diabetes Audit (NPDA) Report on Care and Outcomes 2024/25
Incidence per 100,000 general population 0-15 years old
35 30 25 20 15 10 5 0
2013/14
2014/15
2015/16
2016/17
2017/18
2018/19
Boys
24.8
28.0
24.8
25.9
26.0
25.8
2019/20* 2020/21 27.0
33.9
2021/22 34.1
2022/23 2023/24 2024/25 32.3
28.7
29.8
Girls
20.8
24.4
20.8
24.4
24.2
23.3
24.3
27.7
31.3
29.8
26.4
26.8
All
22.8
26.5
22.8
25.4
25.1
24.6
25.6
30.9
32.7
31.1
27.6
28.3
Sex and audit year Figure 2: Incidence of Type 1 diabetes per 100,000 general population 0-15 years old in England, Wales and Jersey, from 2013/14 to 2024/25. Figures include Jersey from 2024/25 onwards. *166 out of 173 PDUs submitted information to the 2019/20 audit, artificially lowering numbers reported.
There were 1,431 children and young people in England, Wales, and Jersey being cared for in PDUs with Type 2 diabetes in 2024/25. This included 302 new cases in 2024/25 compared to 292 new cases recorded in 2023/24. SECTION 02
What percentages of children and young people received the six recommended health checks?
HbA1c
BMI
Blood Pressure
Thyroid Test
Albuminuria
Foot Check
100%
HbA1c
95 %
BMI
90%
Blood pressure*
85%
Thyroid
80%
Foot Exam*
75%
Urinary albumin*
70% 65 % 60% 55%
2024/25
2023/24
2022/23
2021/22
2020/21
2019/20
2018/19
2017/18
2016/17
50%
2015/16
% of children and young people with Type 1 diabetes who completed a full year of care
There were increases in the completion rates for all individual ‘key’ health checks in 2024/25 (HbA1c, BMI, blood pressure, thyroid function test, albuminuria screening, and foot checks), compared to the previous audit years (Figure 3). Completion is greater than 80% for each individual health check, surpassing pre-pandemic rates.
Figure 3: Percentage of children and young people with Type 1 diabetes receiving individual health checks, 2015/16 to 2024/25. *Health checks completed for children and young people aged 12 and older.
7
National Paediatric Diabetes Audit (NPDA) Report on Care and Outcomes 2024/25
72% of those with Type 1 diabetes aged 12 and above received all six ‘key’ annual health checks, compared to 66% in 2023/24. 90% of those aged below 12 received all three ‘key’ annual health checks. 40% of those with Type 2 diabetes aged 12 and above received all six ‘key’ annual health checks, compared to 37% in 2023/24 (England and Wales only). 31% of those aged below 12 received all five ‘key’ annual health checks. 78% of those aged 12 years and above who had an abnormal eye screen* in 2023/24 and who were captured in the 2024/25 dataset had an eye screen in 2024/25. 67% of those aged 12 years and above who had a normal eye screen in 2023/24 and who were also captured in the 2024/25 dataset also received an eye screen in 2024/25. *Eye screening for retinopathy (12 years old and above) was reduced to biennial frequency from 2020/21 (unless an abnormal result was observed in a previous screen) in many NHS Trusts and Health Boards due to changes in national retinopathy screening guidance.
SECTION 03
What percentage of all recommended health checks were delivered by PDUs?
Health check completion rate
In 2024/25, the overall completion rate for ‘key’ annual health checks provided to all children and young people with Type 1 diabetes was 93%*, although completion rates varied from 80% to 100% between PDUs (Figure 4). In 2023/24, the overall completion rate for all children and young people with Type 1 diabetes was 92% (range 75% to 100%). 100% 95%
National average = 93%
90% 85% 80% 75% England
Wales
Jersey
PDUs
Figure 4: Column chart of health check completion rates for all children and young people with Type 1 diabetes per PDU in England, Wales, and Jersey, 2024/25. *The overall completion rate represents the proportion of expected health checks completed. For instance, a unit with 150 patients (100 aged <12yrs, 50 aged 12 years and older) would be expected to complete 600 health checks (3 for each child <12 yrs, 6 for each child aged 12 years and older).
SECTION 04
What percentages of children and young people with Type 1 diabetes received other recommended health checks at diagnosis? 89% received carbohydrate counting education within a fortnight of diagnosis, compared to 88% in 2023/24. 90% received screening for thyroid disease within three months of diagnosis, compared to 92% in 2023/24. 87% received screening for coeliac disease within three months of diagnosis, compared to 87% in 2023/24. 8
National Paediatric Diabetes Audit (NPDA) Report on Care and Outcomes 2024/25
SECTION 05 st st te te – – 1c 1c bAbA HH
Has there been an improvement in national HbA1c? The national overall median HbA1c for children and young people with all types of diabetes was 58.0 mmol/mol. NICE recommends a target of 48.0 mmol/mol or below.
For Type 1 Diabetes alone (Figure 5) the median was also 58.0 mmol/mol (58.0 mmol/mol for England, 58.0 mmol/mol for Wales, and 51.9 mmol/mol for Jersey). This represents an overall reduction of 2.0 mmol/mol from 60.0 mmol/mol in 2023/24 and a 13.0 mmol/mol reduction since 2010/11 when the RCPCH started reporting on the NPDA analysis. The median HbA1c at PDU level ranged from 51.9 mmol/mol to 72.0 mmol/mol. The national median HbA1c for Type 2 diabetes in England and Wales was 49.0 mmol/mol, a reduction from 50.0 mmol/mol in 2023/24. 74
Median HbA1c (mmol/mol) children and young people with Type 1 diabetes
72 70 68 66 64 62 60 58
National median 2024/25
56 54 52 50
2009/10 2010/11
2011/12
2012/13 2013/14 2014/15 2015/16 2016/17 2017/18 2018/19 2019/20 2020/21 2021/22 2022/23 2023/24 2024/25
England
72.7
71.6
70.5
69.0
69.0
66.5
65.0
64.0
64.0
62.0
62.0
61.0
61.0
60.5
60.5
58.0
Wales
71.6
70.5
70.0
70.0
69.0
68.3
65.0
64.0
65.0
62.0
62.0
62.0
62.0
61.0
60.0
58.0
Jersey
51.9
Figure 5: Median HbA1c for children and young people with Type 1 diabetes in England, Wales, and Jersey, 2009/10 to 2024/25.
The national mean HbA1c for Type 1 diabetes was 61.1 mmol/mol. Figure 6 shows considerable variation at PDU level. England Wales Jersey
Mean HbA1c (mmol/mol)
75
70
95% CI (2 SD) 99% CI (3 SD) National mean
65
60
55
50 0
50
100
150
200
250
300
350
400
450
500
Number of children and young people with Type 1 diabetes Figure 6: Funnel plot of mean HbA1c by PDU for those with Type 1 diabetes, 2024/25.
9
National Paediatric Diabetes Audit (NPDA) Report on Care and Outcomes 2024/25
Variation in mean HbA1c has markedly reduced over successive 5-year interval cohorts from 2009/10. The standard deviation around the mean (a marker of variability) has reduced from 18.3 mmol/mol to 14.6 mmol/mol (Figure 7).
Proportion of cohort
4%
Median 72.7 67.0 62.0 58.0
3%
IQR 21.9 19.0 17.4 14.5
Mean SD 75.4 18.3 70.6 18.1 65.0 16.9 61.1 14.6
130
140
2009/10 2014/15 2019/20 2024/25
2%
1%
0% 10
20
30
40
50
60
70
80
90
100
110
120
150
HbA1c (mmol/mol)
Figure 7: Distribution of HbA1c for children and young people with Type 1 diabetes, 2009/10 to 2024/25. In order to compare across groups of different sizes, the density has been calculated.
SECTION 06
What percentages of children and young people with diabetes were at risk of macrovascular and microvascular complications? There has been little change in the percentages of children and young people with diabetes showing early signs associated with future risk of micro and macrovascular complications (Table 2). TYPE 1 DIABETES
TYPE 2 DIABETES
14% (aged 12 and above) had a diastolic or systolic blood pressure in the hypertensive range (>95th centile after correction for age, sex, and height), compared to 15%* in 2023/24.
29% (all ages) had a diastolic or systolic blood pressure in the hypertensive range (>95th centile after correction for age, sex, and height), compared to 30%* in 2023/24.
18% (aged 12 and above) had a total blood cholesterol of 5 mmol/l or higher, compared to 19% in 2023/24.**
31% (all ages) had a total blood cholesterol of 5 mmol/l or higher, compared to 32% in 2023/24.
44% (all ages) were overweight or obese (BMI >85th centile after correction for age and sex, compared to 42% in 2023/24.
94% (all ages) were overweight or obese (BMI >85th centile after correction for age and sex, similarly to 94% in 2023/24.
12% (aged 12 and above) had an abnormal retinopathy screen, compared to 11% in 2023/24.
9% (aged 12 and above) had an abnormal retinopathy screen, compared to 7% in 2023/24.
8% (aged 12 and above) had micro- or macroalbuminuria, compared to 10% in 2023/24.
19% (all ages) had micro- or macroalbuminuria, compared to 21% in 2023/24.
Table 2: Percentages of children and young people with Type 1 in England, Wales and Jersey and Type 2 diabetes in England and Wales with evidence of risk factors for micro- and macro-vascular complications, 2024/25. *For CYP <18 years old, the NPDA has updated its methodology for calculating blood pressure centiles to adjust by height, age, and sex, (National High Blood Pressure Education Programme, 2004). Hypertension rates have been recalculated for 2023/24 to provide a fair comparison.**Cholesterol is no longer included in the health checks specified for type 1 diabetes in children by NICE, however the NPDA continues to collect and report the outcomes of cholesterol tests undertaken and submitted by PDUs.
10
National Paediatric Diabetes Audit (NPDA) Report on Care and Outcomes 2024/25
Figure 8 compares the distributions of body mass index for children and young people with Type 1 and Type 2 diabetes in 2024/25 compared to 2019/20.
Proportion of cohort
50% 40%
2019/20 Type 1 2024/25 Type 1 2019/20 Type 2 2024/25 Type 2 UK-WHO Reference
85th centile
30% 20% 10% 0% 1th
5th 10th
50th
90th 95th
99th
Centile
Figure 8: Distribution of body mass index of children and young people with Type 1 and Type 2 diabetes in 2024/25 and 2019/20 in England and Wales (Jersey excluded). The UK-WHO reference population is shown for comparison.
SECTION 07
What percentages of children and young people with Type 1 were using diabetes-related technologies?
Across England, Wales, and Jersey: 69% were using an insulin pump, including as part of a hybrid closed loop system, compared to 55% in 2023/24. 62% were using a hybrid closed loop system, compared to 36% in 2023/24. There was variation in usage of hybrid closed loop systems by children and young people with Type 1 diabetes across Integrated Care Boards in England and Local Health Boards in Wales, ranging from 34% to 86%. Across paediatric diabetes units, hybrid closed loop usage ranged from 12.2% to 94.4% (Figure 9). 93% were using a real time continuous glucose monitor (rtCGM), either combined with insulin injections or a pump (including as part of a hybrid closed loop system), compared to 79% in 2023/24. 4% were using a flash glucose monitor or a modified flash monitor, compared to 15% in 2023/24. Country
Insulin pump*
Hybrid closed loop system**
rtCGM*
Flash glucose monitor or modified flash monitor*
Overall
69% (22,559/32,486)
62% (20,740/33,478)
93% (29,823/32,229)
4% (1,308/32,229)
England
69% (21,399/30,860)
62% (19,758/31,819)
93% (28,353/30,614)
4% (1,218/30,614)
Wales
71% (1,127/1,582)
58% (949/1,614)
91% (1,426/1,571)
6% (90/1,571)
Jersey
75% (33/44)
73% (33/45)
100% (44/44)
0% (0/44)
Table 3: Percentages and numbers of children and young people with Type 1 diabetes using each technology. *Denominator = the number of children and young people with Type 1 diabetes with a valid recorded treatment regimen. **Proportion of all children and young people with Type 1 diabetes.
11
Hybrid Closed-Loop System Uptake %
National Paediatric Diabetes Audit (NPDA) Report on Care and Outcomes 2024/25
100% 90% 80% National average = 62% 70% 60% 50% 40% 30% 20% 10% 0% England
Wales
PDUs
Jersey
Figure 9: Column chart of HCL uptake for all children and young people with Type 1 diabetes per PDU in England, Wales, and Jersey, 2024/25.
SECTION 08
test
HbA 1c –
HbA 1c –
test
What was the average HbA1c for children and young people with Type 1 diabetes using different diabetes-related technologies?
Figure 10 shows the median HbA1c for children and young people with Type 1 diabetes on each treatment regimen, from insulin injections alone (left side) to the current most advanced technology (HCL, right side). Children and young people using HCL systems had the lowest median HbA1c at 56.5 mmol/mol. Between 2021/22 and 2024/25, the number of children and young people with a valid HbA1c using HCLs had increased from 2,233 to 20,600, whereas the number using insulin injections alone fell from 4,985 to 806. The increasing adoption of more advanced treatment regimens continues to drive an overall reduction in the national median HbA1c over the same period. Injections
Injections & Flash
Injections & CGM
Pump
Pump & Flash
Pump & CGM
Hybrid closed loop system
68.3 67.0
Median HbA1c (mmol/mol)
68 65.0
64.0
65.5
67.8
63.0 63.0
64.0
63
63.0
65.0
62.8
61.0
62.0
62.7 63.0
60.5 61.0 60.0
59.5
60.0
59.0
58
National median 57.5 57.0
53
48
55.0 55.5
57.0
56.5
Total number
Total number
Total number
Total number
Total number
Total number
Total number
2021/22: 4,985 2022/23: 2,904 2023/24: 1,455 2024/25: 806
2021/22: 7,593 2022/23: 6,848 2023/24: 3,130 2024/25: 902
2021/22: 2,463 2022/23: 4,532 2023/24: 8,200 2024/25: 7,174
2021/22: 1,390 2022/23: 673 2023/24: 253 2024/25: 59
2021/22: 3,717 2022/23: 2,985 2023/24: 843 2024/25: 134
2021/22: 3,541 2022/23: 4,789 2023/24: 4,234 2024/25: 1,586
2021/22: 2,233 2022/23: 4,690 2023/24: 11,635 2024/25: 20,600
2021 2022 2023 2024 /22 /23 /24 /25
2021 2022 2023 2024 /22 /23 /24 /25
2021 2022 2023 2024 /22 /23 /24 /25
2021 2022 2023 2024 /22 /23 /24 /25
2021 2022 2023 2024 /22 /23 /24 /25
2021 2022 2023 2024 /22 /23 /24 /25
2021 2022 2023 2024 /22 /23 /24 /25
Figure 10: Median HbA1c for children and young people with Type 1 diabetes using different combinations of treatment regimen and glucose monitoring in 2021/22 to 2024/25. Circle size represents the number of children and young people, while the bars represent the 95% confidence interval for the medians.
12
National Paediatric Diabetes Audit (NPDA) Report on Care and Outcomes 2024/25
SECTION 09
What percentages of children and young people with Type 1 diabetes had diabetes-related hospital admissions?
% of those newly diagnosed with Type 1 admitted to hospital with DKA
28% (n=902) of children and young people of all ages newly diagnosed with Type 1 diabetes presented with DKA at diagnosis in 2024/25, compared to 26% (n=806) in 2023/24 (Figure 11). Please note, rates of DKA at diagnosis in the NPDA are likely an underestimate due to underreporting of admissions. 35% 30% 25% 20% 15% 2017/18
2018/19
2019/20
2020/21
2021/22
2022/23
2023/24
0 to 4 years
29%
28%
30%
26%
31%
28%
31%
2024/25
33%
5 to 9 years
16%
19%
21%
24%
22%
20%
24%
24%
10 to 15 years
21%
20%
22%
27%
26%
24%
26%
29%
Overall
20%
21%
23%
26%
26%
23%
26%
28%
Figure 11: Percentages of children and young people aged 0 to 15 years newly diagnosed with Type 1 diabetes admitted with DKA at diagnosis by age, 2017/18 to 2024/25.
% of those with Type 1 diabetes admitted at least once
There was a continued decrease in post-diagnosis hospital admissions (Figure 12) 2.5% 2.0%
2.2%
2.1%
2.1%
2.0%
1.5%
1.9%
1.9%
2022/23 2023/24
1.0% 0.9%
0.5%
0.8%
0.6%
0.6% 0.7% 0.6%
Hypoglycaemia
Ketosis without acidosis
2024/25
0.0% DKA (not at diagnosis)
Stabilisation
Figure 12: Percentages and numbers of children and young people with Type 1 diabetes admitted at least once for a diabetes related cause not associated with diagnosis, 2022/23 to 2024/25.
SECTION 10
How many children and young people with diabetes had a psychological assessment and were assessed as requiring additional psychological support? All children and young people with a complete year of care should have an annual assessment as to whether additional psychological support is needed. Children and young people with Type 2 diabetes are less likely to receive psychological assessment despite being more likely to be assessed as requiring additional support.
84% of eligible children and young people with Type 1 diabetes had a psychological assessment, compared to 82% in 2023/24. 27% of those with a known outcome of psychological assessment (n = 22,354) were assessed as requiring additional psychological support outside of multidisciplinary team meetings, compared to 28% in 2023/24.
69% of children and young people with Type 2 diabetes had a psychological assessment, compared to 65% in 2023/24. 39% of those with a known outcome of psychological assessment (n = 661) were assessed as requiring additional psychological support outside of multidisciplinary team meetings, compared to 39% in 2023/24. 13
National Paediatric Diabetes Audit (NPDA) Report on Care and Outcomes 2024/25
Spotlight on inequalities The NPDA has reported the finding of persistent inequalities in HbA1c outcomes and use of diabetes related technologies associated with ethnicity and deprivation. For HbA1c, all the different ethnic groups continue to improve (Figure 13), however Black children and young people remain the only ethnic group with HbA1c above 60.0 mmol/mol. The gap between most and least deprived has fallen from 6 mmol/mol to 4 mmol/mol between 2021/22 and 2024/25 (Figure 14). Median HbA1c (mmol/mol)
73 70 68 65 63 60 58 55 White Asian Black Mixed Other
2015/16
2016/17
2017/18
2018/19
2019/20
2020/21
2021/22
2022/23
2023/24
2024/25
64.5 66.1 70.5 67.0 65.5
63.9 66.0 70.5 66.6 63.9
64.0 66.0 70.0 66.0 64.0
61.5 64.0 68.0 64.2 61.0
61.5 63.0 68.0 65.0 60.5
61.0 63.0 68.0 63.5 61.0
60.5 63.0 67.0 63.0 60.0
60.0 62.0 66.5 63.0 61.0
60.0 61.5 67.0 62.0 60.5
58.0 59.5 64.5 60.0 58.0
Figure 13: Median HbA1c by ethnic group for children and young people with Type 1 diabetes, 2013/14 – 2024/15. In 2019/20, 166 out of 173 PDUs submitted information to the audit.
Median HbA1c (mmol/mol)
69 67 65 63 61 59 57 55
2015/16
2016/17
2017/18
2018/19
2019/20
2020/21
2021/22
2022/23
2023/24
2024/25
Most deprived
68.0
67.0
67.0
65.0
64.5
64.0
64.0
63.5
63.0
60.0
Second most deprived
66.5 65.0
65.0 64.0
65.0 64.0
63.0 62.0
62.8 62.0
62.0 61.5
62.0 60.0
62.0 60.0
62.0 60.0
59.0 58.0
63.5
63.0
63.0
60.5
60.0
60.0
59.5
59.0
59.0
57.0
62.3
61.5
61.5
59.5
59.0
58.5
58.0
57.5
58.0
56.0
Third least deprived Second least deprived Least deprived
Figure 14: Median HbA1c by deprivation quintile for children and young people with Type 1 diabetes, 2013/14 – 2024/25. In 2019/20, 166 out of 173 PDUs submitted information to the audit.
14
National Paediatric Diabetes Audit (NPDA) Report on Care and Outcomes 2024/25
% children and young people with Type 1 diabetes using rtCGM
The use of rtCGM and HCL systems has increased dramatically over the last 4 years in all ethnic groups and levels of deprivation with less of a gap in usage between the different groups in 2024/25 (Figure 15 and 16). 100%
National average (2024/25)
90% 80% 70% 60% 50% 40% 30% 20% 10% 0% Black
Most
Second most
15.1%
11.7%
14.0%
17.3%
19.3%
22.3%
25.2%
25.3%
21.9%
23.8%
24.9%
27.8%
29.8%
34.7%
25.7%
31.1%
32.7%
37.7%
45.3%
49.0%
52.1%
54.4%
76.9%
78.5%
81.2%
82.3%
91.4%
92.2%
93.6%
94.5%
White
Mixed
Other
Asian
2019/20
20.2%
18.5%
16.0%
2020/21
28.4%
29.3%
28.1%
2021/22
30.8%
31.3%
26.9%
25.4%
22.2%
23.9%
2022/23
50.2%
47.0%
42.7%
42.8%
36.2%
43.3%
2023/24
79.8%
77.9%
75.4%
76.7%
67.6%
75.3%
2024/25
93.0%
92.0%
91.7%
92.7%
87.7%
91.3%
Ethnicity
Third least
Second least
Least
Deprivation
% of children and young people with Type 1 diabetes using HCLs
Figure 15: Use of rtCGM by ethnic category and deprivation quintile amongst children and young people with Type 1 diabetes, 2019/20 – 2024/25. In 2019/20, 166 out of 173 PDUs submitted information to the audit.
80% 70%
National average (2024/25)
60% 50% 40% 30% 20% 10% 0% White
Mixed
7.9%
7.4%
Other
Asian
Black
Most
Second most
5.5%
5.8%
5.7%
6.0%
Ethnicity 2021/22
5.9%
Third least
Second least
Least
8.8%
9.7%
Deprivation 7.4%
2022/23
15.5%
15.0%
13.0%
11.6%
10.5%
11.8%
12.6%
15.3%
16.8%
18.0%
2023/24
37.4%
33.8%
32.0%
31.4%
25.4%
32.5%
32.8%
36.3%
38.7%
39.0%
2024/25
63.6%
60.9%
58.8%
60.9%
51.7%
60.4%
60.0%
62.0%
63.5%
64.5%
Figure 16: Use of HCL systems by ethnic category and deprivation quintile amongst children and young people with Type 1 diabetes, 2021-22 – 2024/25.
Quality Improvement resources The RCPCH Diabetes Quality Improvement Website provides multidisciplinary teams with the tools to identify, design, and analyse their own interventions specific to the needs of the children and young people and families that they care for. The Getting It Right First Time (GIRFT) programme has provided resources for integrated care boards as part of their national review of services for children and young adults living with diabetes in England. 15
National Paediatric Diabetes Audit (NPDA) Report on Care and Outcomes 2024/25
©2026 Healthcare Quality Improvement Partnership. Published by RCPCH March 2026
Healthcare Quality Improvement Partnership (HQIP) 128 City Road London, EC1V 2NX
RCPCH Royal College of Paediatrics and Child Health
Royal College of Paediatrics and Child Health 5-11 Theobalds Road, London, WC1X 8SH
The Royal College of Paediatrics and Child Health (RCPCH) is a registered charity in England and Wales (1057744) and in Scotland (SCO38299).