Market Intelligence Report · 2025–2035
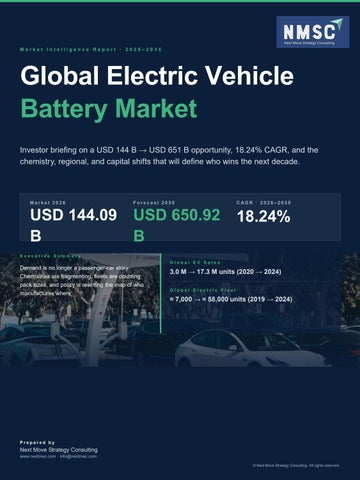
Global Electric Vehicle Battery Market Investor briefing on a USD 144 B → USD 651 B opportunity, 18.24% CAGR, and the chemistry, regional, and capital shifts that will define who wins the next decade.
Market 2026
Forecast 2035
CAGR · 2026–2035
USD 144.09 B
USD 650.92 B
18.24%
Executive Summary
Demand is no longer a passenger-car story. Chemistries are fragmenting, fleets are doubling pack sizes, and policy is rewriting the map of who manufactures where.
Global EV Sales
3.0 M → 17.3 M units (2020 → 2024) Global Electric Fleet
≈ 7,000 → ≈ 58,000 units (2019 → 2024)
Prepared by
Next Move Strategy Consulting www.nextmsc.com · info@nextmsc.com © Next Move Strategy Consulting. All rights reserved.
Slide 02 · Market Landscape
Market Size, Trajectory & Ecosystem A. Headline Economics
Multi-kWh demand curve reshaping investment priorities across mining, midstream, cells, packs and recycling.
2026 Market Size
2035 Forecast
CAGR · 2026–2035
$144.09 B
$650.92 B
18.24%
Up from $121.87 B in 2025
≈ 4.5× today's market
One of the fastest-scaling clean-energy adjacencies
B. Five-Year Demand Curve
Global EV sales the upstream signal for kWh demand grew nearly 6× in five years.
Composite Fleet Signal
17.3M
~8.3×
13.7M
Global electric car fleet expansion (2019→2024), one of the steepest adoption curves in modern transport.
10.5M 6.6M 3.0M
2020
2021
2022
2023
2024
Global EV car sales, millions of units · Source: IEA
C. Value-Chain Ecosystem
Five interlocking layers define who captures economic value margin pools are shifting downstream.
UPSTREAM
MIDSTREAM
CELLS
PACKS
END-OF-LIFE
Mining & Refining
Precursors & Cathode
Cell Manufacturing
Pack, BMS, Thermal
Recycling & 2nd-Life
Lithium, nickel, cobalt,
Active materials — key IRA &
Highest capex intensity;
Software-driven margin &
compliant feedstock.
graphite — concentrated in
EU regulatory choke point.
scale-driven cost play.
recurring service revenue.
EU mandates close the loop; secures
few jurisdictions.
Source: Next Move Strategy Consulting, Electric Vehicle Battery Market Report (2025–2035). © Next Move Strategy Consulting. All rights reserved.
Slide 03 · Growth Drivers & Opportunities
Where the Demand Curve Accelerates Chemistries, fleet electrification, and policy are simultaneously compounding the kWh opportunity.
Driver 01 · Chemistry
Driver 02 · Heavy Mobility
High-energy & long-life cells unlock new duty cycles
Fleet electrification doubles pack sizes
• NMC, NCA, LFP, semi-solid & solid-state chemistries each
• IEA: electric buses & commercial fleets +35% YoY —
reshape cost · safety · energy-density trade-offs. • IEA: +20–40% energy density gains from next-gen chemistries, with materially lower degradation.
strongest growth vector in mobility. • Commercial packs: 200–350 kWh per vehicle vs 50–110 kWh for passenger.
• Sodium-ion (CATL · BYD) opens cost-sensitive passenger & micro-mobility segments.
• Electric trucks' share of global battery demand set to more than double through 2030.
• Fast-charge lithium variants directly address range anxiety & charging convenience.
• Winners will be suppliers with high-cycle, thermal-resilient cells engineered for duty profiles.
High-Growth Segments
Heavy-Duty Trucks
Sodium-Ion
Recycling / 2nd-Life
2× demand by 2030
Early-stage commercialisation
EU mandate by design
200–350 kWh packs, deep-cycle chemistry required
Hydromet recycling capacity scales with EV parc
Lower cost · safer, perfect for cost-sensitive EVs
Where Investors Should Look · Regional Demand Share, 2024 Share of global EV battery demand by region — China still dominant, but U.S. & EU are closing gaps via onshoring.
China
59%
vs 50% in 2020
United States
13%
vs 11% in 2020
European Union
13%
vs 22% in 2020
Rest of World
15%
Selangor, Indonesia ↑
Source: IEA Global EV Outlook 2024 · IEA 2024 Battery Technology Outlook · NMSC analysis. © Next Move Strategy Consulting. All rights reserved.
Slide 04 · Competitive Scenario
Incumbents, Specialists & the M&A Race A. Tiered Player Universe
Scale leaders set the cost curve; specialists compete on IP in sodium-ion, fast-charge & solid-state.
Tier 1 · Incumbents
Tier 2 · Specialists
Multi-GWh scale & OEM lock-ins
Chemistry & JVs — region champions
CATL · FinDreams (BYD) · LG Energy Solution · Panasonic ·
CALB · Gotion High-Tech · EVE Energy · Sunwoda · REPT BATTERO
Samsung SDI · SK On
· SVOLT · Farasis
Vertically integrated long-term offtake, precursor & refining control, deep OEM
Compete on IP in sodium-ion, fast-charge architectures, solid-state. Rising on
partnerships. Set the price & technology cadence for the global market.
the back of IRA / EU regional-champion & JV models.
B. Three Strategic Plays Defining the Decade
Play 01
Play 02
Play 03
Capacity build-out
Vertical integration
M&A & JVs
Multi-hundred-GWh gigafactory pipelines tied to
Upstream mining stakes, midstream precursor &
Acquiring hydromet recyclers, cathode-active IP,
OEM offtakes. CATL's 2025 sodium-ion & fast-
refining capacity, downstream pack/BMS. Locks
US/EU regional capacity. Dec 2025 deals: LG
charge introductions + Panasonic's Kansas
feedstock, qualifies IRA & EU incentive volumes.
Energy $1.4 B Mercedes contract; Samsung SDI
facility ramp define the playbook.
$1.36 B ESS deal.
Tech Differentiation
C. Positioning Matrix · Scale vs. Technology Differentiation
High Tech · Low Scale
High Tech · High Scale
ProLogium · Verkor · Farasis
CATL · LG ES · Samsung SDI · Panasonic
Low Tech · Low Scale
Low Tech · High Scale
Sunwoda · EVE Energy · REPT
BYD/FinDreams · CALB · Lishen
Production Scale (GWh)
Source: NMSC analysis; company financial filings & press releases, 2025–2026. © Next Move Strategy Consulting. All rights reserved.
Slide 05 · Regional Outlook & Investor Lens
Where Capital Should Sit, and Where It Should Wait A. Regional Investment Stance Each bloc is being reshaped by domestic-content, recycling & traceability rules capital follows compliance.
North America
Europe
Asia-Pacific
MEA · LATAM
Trojan-horse: IRA-driven onshoring
Strategic autonomy via regulation
China-led, cost & cargo dominance
Raw-material backbone plays
• G igafactory & precursor build-out • D omestic-mineral & recycling audit • Stance: Allocated
• EU Batteries Regulation & duediligence • Hydromet recycling & midstream • Stance: Selective
• Sodium-ion & LFP cost leadership • Cell & pack export risk to trade rules • Stance: Expanding
• L ithium Triangle, Indonesia Ni • R efining & precursor midstream • S tance: Watchlist
B. Where Allocators Win the Decade
Theme 01
Theme 02
Theme 03
Theme 04
Midstream refining & precursors
Hydromet recycling
BMS / Energymanagement software
JV & minority stakes in gigafactories
Recurring revenue & aftermarket gross margin beyond hardware.
Pair anchor offtake with recycling commitments de-risks capex.
Bottleneck for IRA & EU volumes first dollar of compliant upstream.
EU mandate pulls capacity in; certified recycled feeds qualify for credits.
C. Three Strategic Recommendations for Investors & Operators
01
Lock long-term offtake before committing large-scale capex
02
Build flexible, multi-chemistry lines with validated recycling partnerships
Mitigate execution risk with binding OEM contracts or government-backed anchor orders. Pipeline visibility is the new bond rating.
LFP · NMC · Sodium-ion roadmap flexibility protects against market-mix shifts & raw-material volatility; certified recycling secures policy-eligible feedstock.
03
Engineer full regulatory compliance & traceability from day one Domestic-content, due-diligence & recycling-content thresholds determine qualification for IRA & EU incentive volumes. Treat compliance as core IP.
Source: Next Move Strategy Consulting, EV Battery Market Report (2025–2035); IEA 2024. © Next Move Strategy Consulting. All rights reserved.
Slide 06 · Thank You & Connect
Thank You. Let's engineer your edge in the EV battery market together.
Get the Full Report
33 countries · 15 key companies · 10 market shares · 80 analysthours of free customisation. Visit www.nextmsc.com
Reach the NMSC Team
Website
Phone
nextmsc.com
+1 857 758 5017
info@nextmsc.com
Full reports, customisation requests, executive briefings.
Strategic consultations & analyst support.
Custom scope, partnership & media enquiries.
Follow Us LinkedIn
YouTube
Twitter / X
YouTube
Twitter / X
Next Move Strategy Consulting
Click here for the complete report & bespoke research Visit nextmsc.com · Call +1 857 758 5017 · Mail info@nextmsc.com
© Next Move Strategy Consulting · All rights reserved · nextmsc.com