Market Intelligence Report
Report Code · SE326 · 282 pages
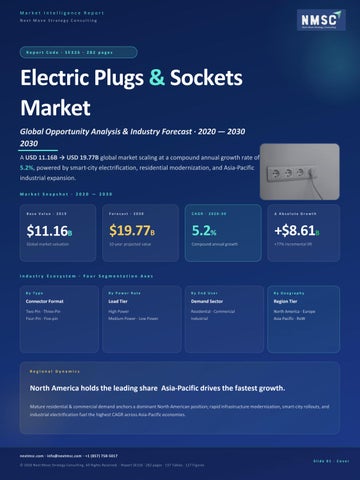
Electric Plugs & Sockets Market
Market Snapshot · 2020 — 2030
Base Value · 2019
Forecast · 2030
CAGR · 2020-30
Δ Absolute Growth
$11.16B
$19.77B
5.2%
+$8.61B
Industry Ecosystem · Four Segmentation Axes
By Type
By Power Rate
By End User
By Geography
Connector Format
Load Tier
Demand Sector
Region Tier
Regional Dynamics
North America holds the leading share Asia-Pacific drives the fastest growth.
Slide 01 · Cover
Market Intelligence · Slide 02
Chapter 02
Growth Drivers & Market Opportunities Three structural demand drivers are reshaping the global plugs & sockets market — and the — and the regions positioned to capture them are pulling decisively ahead.
Driver 01
Driver 02
Driver 03
Construction & Smart Cities
Industrialization & Commercial Expansion
Safety & Aesthetic Innovation
Rapid industrialization, retailer and
Premium fire-proof, splash-proof, and dust-proof
hypermarket penetration, and the proliferation
variants are gaining global momentum, while
of malls are accelerating commercial demand
aesthetic interior-design finishes open higher-
for high-load, multi-pin electrical solutions.
margin residential and hospitality demand.
Booming global construction, interior-design modernization, and the build-out of smart-city digital infrastructure are driving sustained demand for next-generation connecting hardware. Residential retrofits · New urban builds
Industrial plants · Malls & Retail chains
IP-rated · Designer-finish SKUs
High-Growth Segments · 2020-2030
Industrial end-use leads, fire-proof SKUs lead format mix. Industrial End-User High-power, multi-pin demand
Commercial End-User Retail, hospitality, offices
Residential End-User Retrofit and new-build volumes
High-Power Format Industrial-rated connectors Fire/Splash-Proof Innovation IP-rated premium variants
Regional Opportunity
HIGH
Asia-Pacific leads CAGR North America anchors near-term share. MID Asia-Pacific
★ Highest CAGR
North America
★ Largest Share
BSL
HIGH
Europe
Stable
RISE Rest of World
Emerging
Bottom Line
Build industrial-grade, safety-led portfolios for APAC; protect NA share with retrofit SKUs.
nextmsc.com · info@nextmsc.com · +1 (857) 758-5017 Slide 02 · Drivers
Market Intelligence · Slide 03
Chapter 03
Competitive Scenario · Top 10 Players A consolidated yet innovation-driven landscape, led by global Tier-1 electrical majors with regional specialists carving defensible niches in defensible niches in industrial connectors. Tier 1 · Global Majors · Premium Industrial & Commercial
01
02
03
04
05
Schneider Electric
ABB Ltd.
Legrand SA
Eaton Corp.
Emerson Electric
France · Listed (EPA: SU)
Switzerland · Listed (NYSE: ABB)
France · Listed (EPA: LR)
USA · Listed (NYSE: ETN)
USA · Listed (NYSE: EMR)
Energy mgmt + automation
Electrification + motion
Wiring devices leader
Power management
Industrial automation
Tier 2 · Specialist & Regional Champions
06
07
08
09
10
Philips
Amphenol Corp.
Mennekes Elektro
Scame Group
Wenzhou Chmag
USA · Listed (NYSE: APH)
Germany · Private
Italy · Private
China · Private
Interconnect specialist
Industrial plugs (IEC 60309)
Industrial & ATEX specialist
APAC OEM supplier
Netherlands · Listed (NYSE: PHG) Lighting + consumer
Recent Strategic Moves · 2020
Product launches, partnerships, and contract wins. Product Launch · Feb 2020
Partnership · Feb 2020
Major Contract · May 2020
Amphenol HYPERBUSS Family
Schneider × Tricolite Premset
ABB Mets Fibre · €40M Order
Released the Sine Systems HYPERBUSS high-
Schneider licenses its next-gen MV switchgear
performance receptacle connectors (AT and
technology to Tricolite Electrical Industries —
ATV series). Cost-effective bussed-power
combining Schneider's tech R&D with Tricolite's
solutions with superior environmental sealing.
local engineering, assembly, and sales. Mega-project capture
Platform expansion
License-led market entry
Competitive Read
Tier-1 majors compete on portfolio breadth and contract scale; specialists win on technology licensing and format expertise. The next decade will reward players combining technology innovation (HYPERBUSS), licensing partnerships (Schneider-Trilcolite), and industrial mega-projects (ABB Mets) not scale alone.
nextmsc.com · info@nextmsc.com · +1 (857) 758-5017 Slide 03 · Competition
Market Intelligence · Slide 04
Chapter 04
Market Outlook & Strategic Recommendations A 10-year compounding thesis: prioritize Asia-Pacific, premiumize the format mix, and secure government-infrastructure channel access. channel access. 10-Year Horizon Map · 2020 → 2030
Horizon 1 · 2020-2024
Horizon 2 · 2025-2027
Horizon 3 · 2028-2030
$11.16B → $13.5B
$13.5B → $16.7B
$16.7B → $19.77B
Implied CAGR ≈ 4.9%
Implied CAGR ≈ 11.4%
Implied CAGR ≈ 8.7%
Base establishment phase — North America share
Smart-city scale-up — APAC electrification peaks,
consolidation, APAC infrastructure groundbreak,
designer-finish residential SKUs premiumize mix,
fire/splash-proof variants gain share.
government infrastructure spending peaks.
Three Strategic Priorities for Investors Priority 01 · Geographic
Priority 02 · Format Mix
Priority 03 · Channel
Anchor capital in Asia-Pacific scale-up
Premiumize with safety + design SKUs
Lock government-infrastructure sales
APAC delivers the highest CAGR through 2030 —
IP-rated (fire/splash/dust-proof) and designer-finish
favor partners with Chinese, Indian, and Southeast-
residential lines carry superior margin profile and
Asian manufacturing + channel presence.
insulation from commoditization.
Highest growth pocket
Margin expansion
Contract-base resilience
Risk & Headwind Map
Headwind · Mining Slowdown
Watch · Raw-material inflation
Opportunity · Safety regulation
Copper + polymer supply pressure
Government safety mandates
industrial SKUs — diversify end-user exposure to
Input cost swings threaten margin — vertically
Government infrastructure investments raise baseline
commercial and infrastructure verticals.
integrate locks or pursue long-term procurement
safety compliance — IP-rated SKUs convert from
contracts with Tier-1 suppliers.
premium to mainstream specification.
Industrial-grade demand exposure A demotion in mining activity softens high-power
Investment Thesis
A 5.2%-CAGR compounding market, structurally biased to APAC, format premiumization, and government-channel capture.
nextmsc.com · info@nextmsc.com · +1 (857) 758-5017 Slide 04 · Outlook
Closing Slide · Slide 05
End of Briefing
Thank You. Full Report · 282 Pages · 157 Tables · 127 Figures
Electric Plugs & Sockets Market Global Opportunity Analysis & Industry Forecast, 2020-2030
Contact Us
Take Action
Next Move Strategy Consulting W
nextmsc.com
@
info@nextmsc.com
Get the Full Report Today
▶ Request Full Report
☏
+1 (857) 758-5017
Request Full Report
Follow Us
f
gen-dedup-24fa1e51d0ccf0ce8c07f37d67f39335.png
in
in
f
YouTube
𝕏
◉
Twitter / X
nextmsc.com · info@nextmsc.com · +1 (857) 758-5017 Slide 05 · Thank You