Market Research · Investor Briefing
Pharmaceuticals · Life Sciences
Early Toxicity Testing Global Market Outlook 2022 Market Size
Executive Summary
The global Early Toxicity Testing (ETT) market is entering a disciplined, evidence-led expansion phase as pharmaceutical R&D pipelines deepen, food and cosmetic safety regulations harden, and 3D cell-culture + bioinformatics replace legacy animal models.
$8.92B Base year, billion USD
2030 Forecast
$14.39B Projected value
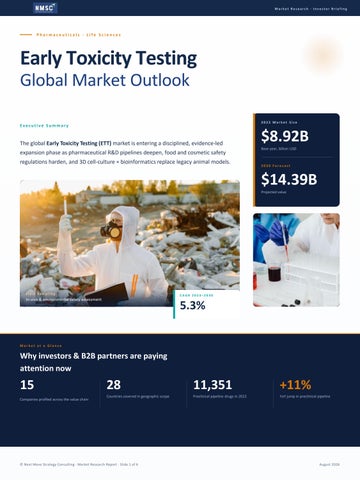
Field Sampling
CAGR 2023–2030
In-vivo & environmental safety assessment
5.3%
Market at a Glance
Why investors & B2B partners are paying attention now
15 Companies profiled across the value chain
28
11,351
+11%
Countries covered in geographic scope
Preclinical pipeline drugs in 2022
YoY jump in preclinical pipeline
© Next Move Strategy Consulting · Market Research Report · Slide 1 of 6
August 2026
Slide 2 · Market Overview
Sizing & Forecast
Market Size, CAGR & Segmentation A $5.47B expansion opportunity between 2022 and 2030, driven by deepening pharma pipelines and tightening safety regulation.
Segmentation Market Trajectory
Absolute Growth
Revenue 2022 → 2030
+61.3%
Where the demand lives By Technique
In Vivo — regulatory gold standard In Vitro — cell culture, PCR, ELISA, Western blot, protein binding assays In Silico — fastest-growing AI-modelling niche
By Toxicity Endpoint
Genotoxicity · Dermal · Skin Ocular · Phototoxicity · Others Cosmetic and skin endpoints rising fastest on consumer awareness.
By End-User Industry
Pharmaceutical dominates
CAGR · 2023–2030
5.3%
Followed by Cosmetics, Chemicals, and Food all tightening test requirements under FDA, EMA, and EU Commission mandates.
Industry Ecosystem
From lab bench to regulatory submission
01 · Sponsors
Pharma, biotech & academic labs
02 · CROs
03 · Platforms
Contract Research Organizations
3D cell culture & bioinformatics
Value chain insight
Outsourced testing via CROs is the highest-margin service layer over 1,100 Canadian SMEs and 10,736 U.S. preclinical programs already route through this funnel. © Next Move Strategy Consulting · Market Research Report · Slide 2 of 6
04 · Regulators
FDA · EMA · EU Commission
$5.47B incremental revenue added across the forecast window
August 2026
Slide 3 · Growth Drivers
Demand & Opportunity
Growth Drivers & High-Value Segments Four mutually reinforcing tailwinds anchored in regulatory pressure, R&D scale, and shifting consumer expectations.
Driver 02
Driver 01 · Demand
Pharmaceutical & biotech R&D expansion
Food safety scrutiny Pesticides, GMOs, additives expanding regulatory oversight across major economies is driving routine pre-market food toxicology.
Preclinical pipeline grew to 11,351 drugs in 2022 from 10,223 in 2021. Chronic-disease burden (diabetes, cancer, CVD) is forcing earlier, stricter
Driver 03
toxicology work to reduce late-stage clinical attrition.
Cosmetic-product awareness
+11%
FDA & EU-mandated irritation, sensitization, phototoxicity assays are now
$1.2B
table-stakes for product launch.
Canadian R&D spend alone (2019)
YoY preclinical pipeline growth
Constraint to Watch
Driver 04 · Technology
Cost & regulatory drag
3D cell culture & bioinformatics
High testing cost deters SMEs; FDA / EMA stringency can lengthen approval timelines and delay launches.
Physiologically relevant in-vitro models + high-throughput biomarker analytics are replacing 2D culture and animal testing faster, cheaper, ethically cleaner, and now regulator-friendly.
Personalized medicine
Patient-specific 3D models
Fewer failed trials Earlier kill of toxic hits
High-Growth Segments
Lower animal use Ethical + cost upside
In-Silico · Phototoxicity · Cosmetic end-use AI-modelled toxicology and safety-endpoint assays are compounding fastest as R&D teams re-platform.
Regional Opportunity Map
Asia-Pacific leads · North America scales · Europe tightens Asia-Pacific
North America
Europe
Dominant
Substantial
Regulatory Anchor
Pharma industry growing 5.8%/yr since 2017;
10,736 U.S. and 2,182 Canadian preclinical
EU cosmetics regulation & EMA stringency
Korea's KDDF tracks 559 new pipelines.
programs anchor CRO demand.
push suppliers toward 3D & in-silico models.
For B2B partners: Asia-Pacific CROs offer scale & cost advantage; North American CROs offer premium pricing and proximity to FDA filings.
© Next Move Strategy Consulting · Market Research Report · Slide 3 of 6
3.4M stroke cases in China (2022, age 40+)
August 2026
Slide 4 · Competitive Landscape
Players & Positioning
Competitive Scenario 15 profiled competitors · consolidated through M&A · competing on capability breadth and geographic reach.
Strategy Playbook
How leaders are moving
Capability × Reach Matrix
Where each major player sits Strategic M&A
Agilent — Avida Biomed April 2023
Acquired ADME/DMPK CRO to expand in-vitro & in-vivo toxicity capability and complement preclinical portfolio.
Capacity Expansion
Inotiv — Rockville, MD July 2022
Added GLP-grade genetic toxicology Ames, micronucleus, chromosomal aberration assays under one roof.
New Facility
WuXi AppTec — Philadelphia November 2021
cGMP lot release, stability testing & analytical services gene & cell-therapy customers gain on-shore capacity.
Competitive Read
Three clusters, three playbooks
Global Full-Stack
Mid-Tier Specialists
Emerging & Regional
Thermo Fisher, Charles River, Danaher
Eurofins, LabCorp, Merck KGaA
WuXi AppTec, Evotec, Medpace, Fortrea
Compete on integrated platforms, broad
Lead with CRO depth, regulatory expertise &
Lean on capacity build-out & regional cost
assay menus & global labs. Highest revenue
therapeutic-area specialization. Buy partners
advantage (APAC) or full-service U.S. CRO
capture but most capital-intensive.
to scale into new modalities.
model. Fastest-growing share.
Tier 1
Tier 1
Tier 2
© Next Move Strategy Consulting · Market Research Report · Slide 4 of 6
August 2026
Slide 5 · Strategic Insights
Investment Thesis
Strategic Insights for Investors Where capital, partnerships and product bets compound most efficiently through 2030.
What to Do Next The Single Bet
Own the capability layer between pharma R&D and regulators. Every additional preclinical program is forced through a longer, more rigorous safety net. Players that combine 3D cell culture, bioinformatics and global GLP labs capture the most value per molecule tested.
Four actions, ranked by leverage
Capital Allocation
01 Acquire 3D & bioinformatics assets Targets with proprietary 3D organoid / microfluidic capability close the largest capability gap and command multiples of 4– 6× revenue.
Capture Opportunity
$5.47B
Geographic Build
02 Lean into Asia-Pacific capacity
incremental revenue pool to be competed for between 2023 and 2030 the
Korea (KDDF: 559 pipelines), China, Japan and India offer
addressable upside every Tier-1 / Tier-2 player is moving to claim.
cost-advantaged pre-clinical bench strength; new U.S. CRO capacity complements FDA proximity.
Risk-Adjusted Lens
Multi-year regulatory lock-in protects incumbents. End-User Pivot
Switching costs are high: validated assays, GLP accreditation & FDA/EMA familiarity take 2–3 years to replicate. The market rewards scale-up moves
03 Capture cosmetic & food verticals
(acquisitions, capacity builds) more than first-mover novel science. Under-penetrated by Tier-1 incumbents. Quicker sales cycles, lower regulatory friction and rising mandate from FDA / EU Commission open defensible niches.
For B2B Decision-Makers
Lock now into strategic CRO partnerships capacity is the binding constraint as the preclinical pipeline crosses 11,000+ programs.
Watch-Out
04 Don't over-pay for growth 5.3% CAGR is steady but unspectacular. Consolidators earn the multiple expansion stand-alone platforms without scale-up roadmap are at risk from tier-down M&A targets.
© Next Move Strategy Consulting · Market Research Report · Slide 5 of 6
August 2026
Slide 6 · Connect With Us
Next Steps
Thank You. Let's map your next move in the Early Toxicity Testing market.
Custom Scope Get the Full Report
Customize and order on nextmsc.com
Customize and order on nextmsc.com www.nextmsc.com
80 analyst-hours of free customization postpurchase add countries, segments, or company profiles on demand.
Direct Lines
Reach the Analyst Team Phone
Website
+1 (857) 758-5017
info@nextmsc.com
nextmsc.com
Mon–Fri · 9:00 AM – 6:00 PM EST
Typical reply within 1 business day
Full report catalog & prior editions
Follow Us
Stay close to the next data drop
gen-dedup-c4b8a4893e3296d7ba6dc91811ae0cd2.png
YouTube
Twitter / X
www.nextmsc.com
"From molecule to market — we make the next move yours."
info@nextmsc.com · +1 (857) 758-5017
Next Move Strategy Consulting · Market Intelligence · Customized Research
© Next Move Strategy Consulting · Market Research Report · Slide 6 of 6
August 2026