MARKET REPORT
Q2 2026 • STAR VALLEY, WYOMING
MARKET REPORT
Q2 • THE STAR VALLEY MARKET
Q2 2026 marked a significant increase in activity across the Star Valley real estate market. The overall table reports 218 transactions, up 42% from 153 one year earlier, while total dollar volume increased 43% to approximately $109.9 million. Active inventory held steady at 460 listings, pending activity declined 17% to 54 transactions, and average market time improved 4% to 148 days. Because the market includes homes, condominiums, land, commercial properties, and farm and ranch assets, each segment provides a clearer picture than a single blended average.
Single-family homes remained the largest contributor to dollar volume, with sales increasing 34% from 71 to 95. Total volume rose 12% to approximately $66.6 million, while the average sale price declined 16% to $701,324 and the median increased 1% to $592,500. Northern Star Valley recorded 35 sales, more than double the prior year, while Southern Star Valley increased from 10 to 27 transactions. Central Star Valley moved in the opposite direction, with sales declining 25% to 33. Active single-family inventory decreased 3% to 201 listings, pending activity fell 24% to 26, and average days on market improved 18% to 145 days.
Condominium and townhome activity remained limited, with only three transactions compared with five in Q2 2025. Total dollar volume increased 111% to approximately $10.6 million, while the average rose to $3.53 million and the median reached $4.4 million. These increases were driven by the specific properties sold, including a $5.6 million high sale, rather than broad appreciation across the attached-housing market. Active inventory remained unchanged at seven listings, pending activity declined from four transactions to one, and average market time decreased 37% to 82 days. With such a small sales sample, quarterly pricing changes should be interpreted cautiously.
Vacant land was the market’s most active property type, with sales increasing 52% from 75 to 114
and accounting for slightly more than half of all Q2 transactions. Total dollar volume rose 58% to approximately $22.7 million, while the average sale price increased 4% to $199,520 and the median climbed 19% to $140,000. Central Star Valley led the segment with 62 sales, up 68%, followed by Northern Star Valley with 32 sales, up 52%. Southern Star Valley recorded 20 transactions, an increase of 18%. Active land inventory remained essentially unchanged at 215 listings, pending sales declined 20% to 24, and average market time improved 22% to 143 days.
Commercial activity declined from six sales to three, although total dollar volume increased 20% to approximately $3.1 million. The average sale price rose to $1.03 million and the median increased to $1.1 million, reflecting fewer but higher-value transactions. Northern Star Valley recorded two commercial sales, while Southern Star Valley contributed one. Active commercial inventory increased 8% to 28 listings, three properties were pending at quarter-end, and average days on market declined 56% to 114 days. Three additional transactions were reported in other property categories, including two farm and ranch sales totaling approximately $6.1 million.
Overall, Q2 2026 reflected a more active but highly segmented Star Valley market. Single-family sales strengthened, vacant land generated the largest increase in transaction volume, and attached-housing results were shaped by a very small number of premium sales. Northern and Southern Star Valley produced the strongest overall growth, while Central Star Valley remained active but recorded a greater concentration of lower-priced land transactions. Stable inventory and shorter marketing times supported the market, although weaker pending activity suggested that momentum could moderate. Successful outcomes continued to depend on property type, location, condition, and realistic pricing rather than uniform appreciation.

TOTAL DOLLAR VOLUME 43% INCREASE YOY $110M
AVG SFH SALES PRICE 16% DECREASE YOY $701K
MEDIAN SFH SALES PRICE 1% INCREASE YOY $593K
TOTAL TRANSACTIONS 42% INCREASE YOY 218
ACTIVE LISTINGS 0% CHANGE YOY 460
TRANSACTION
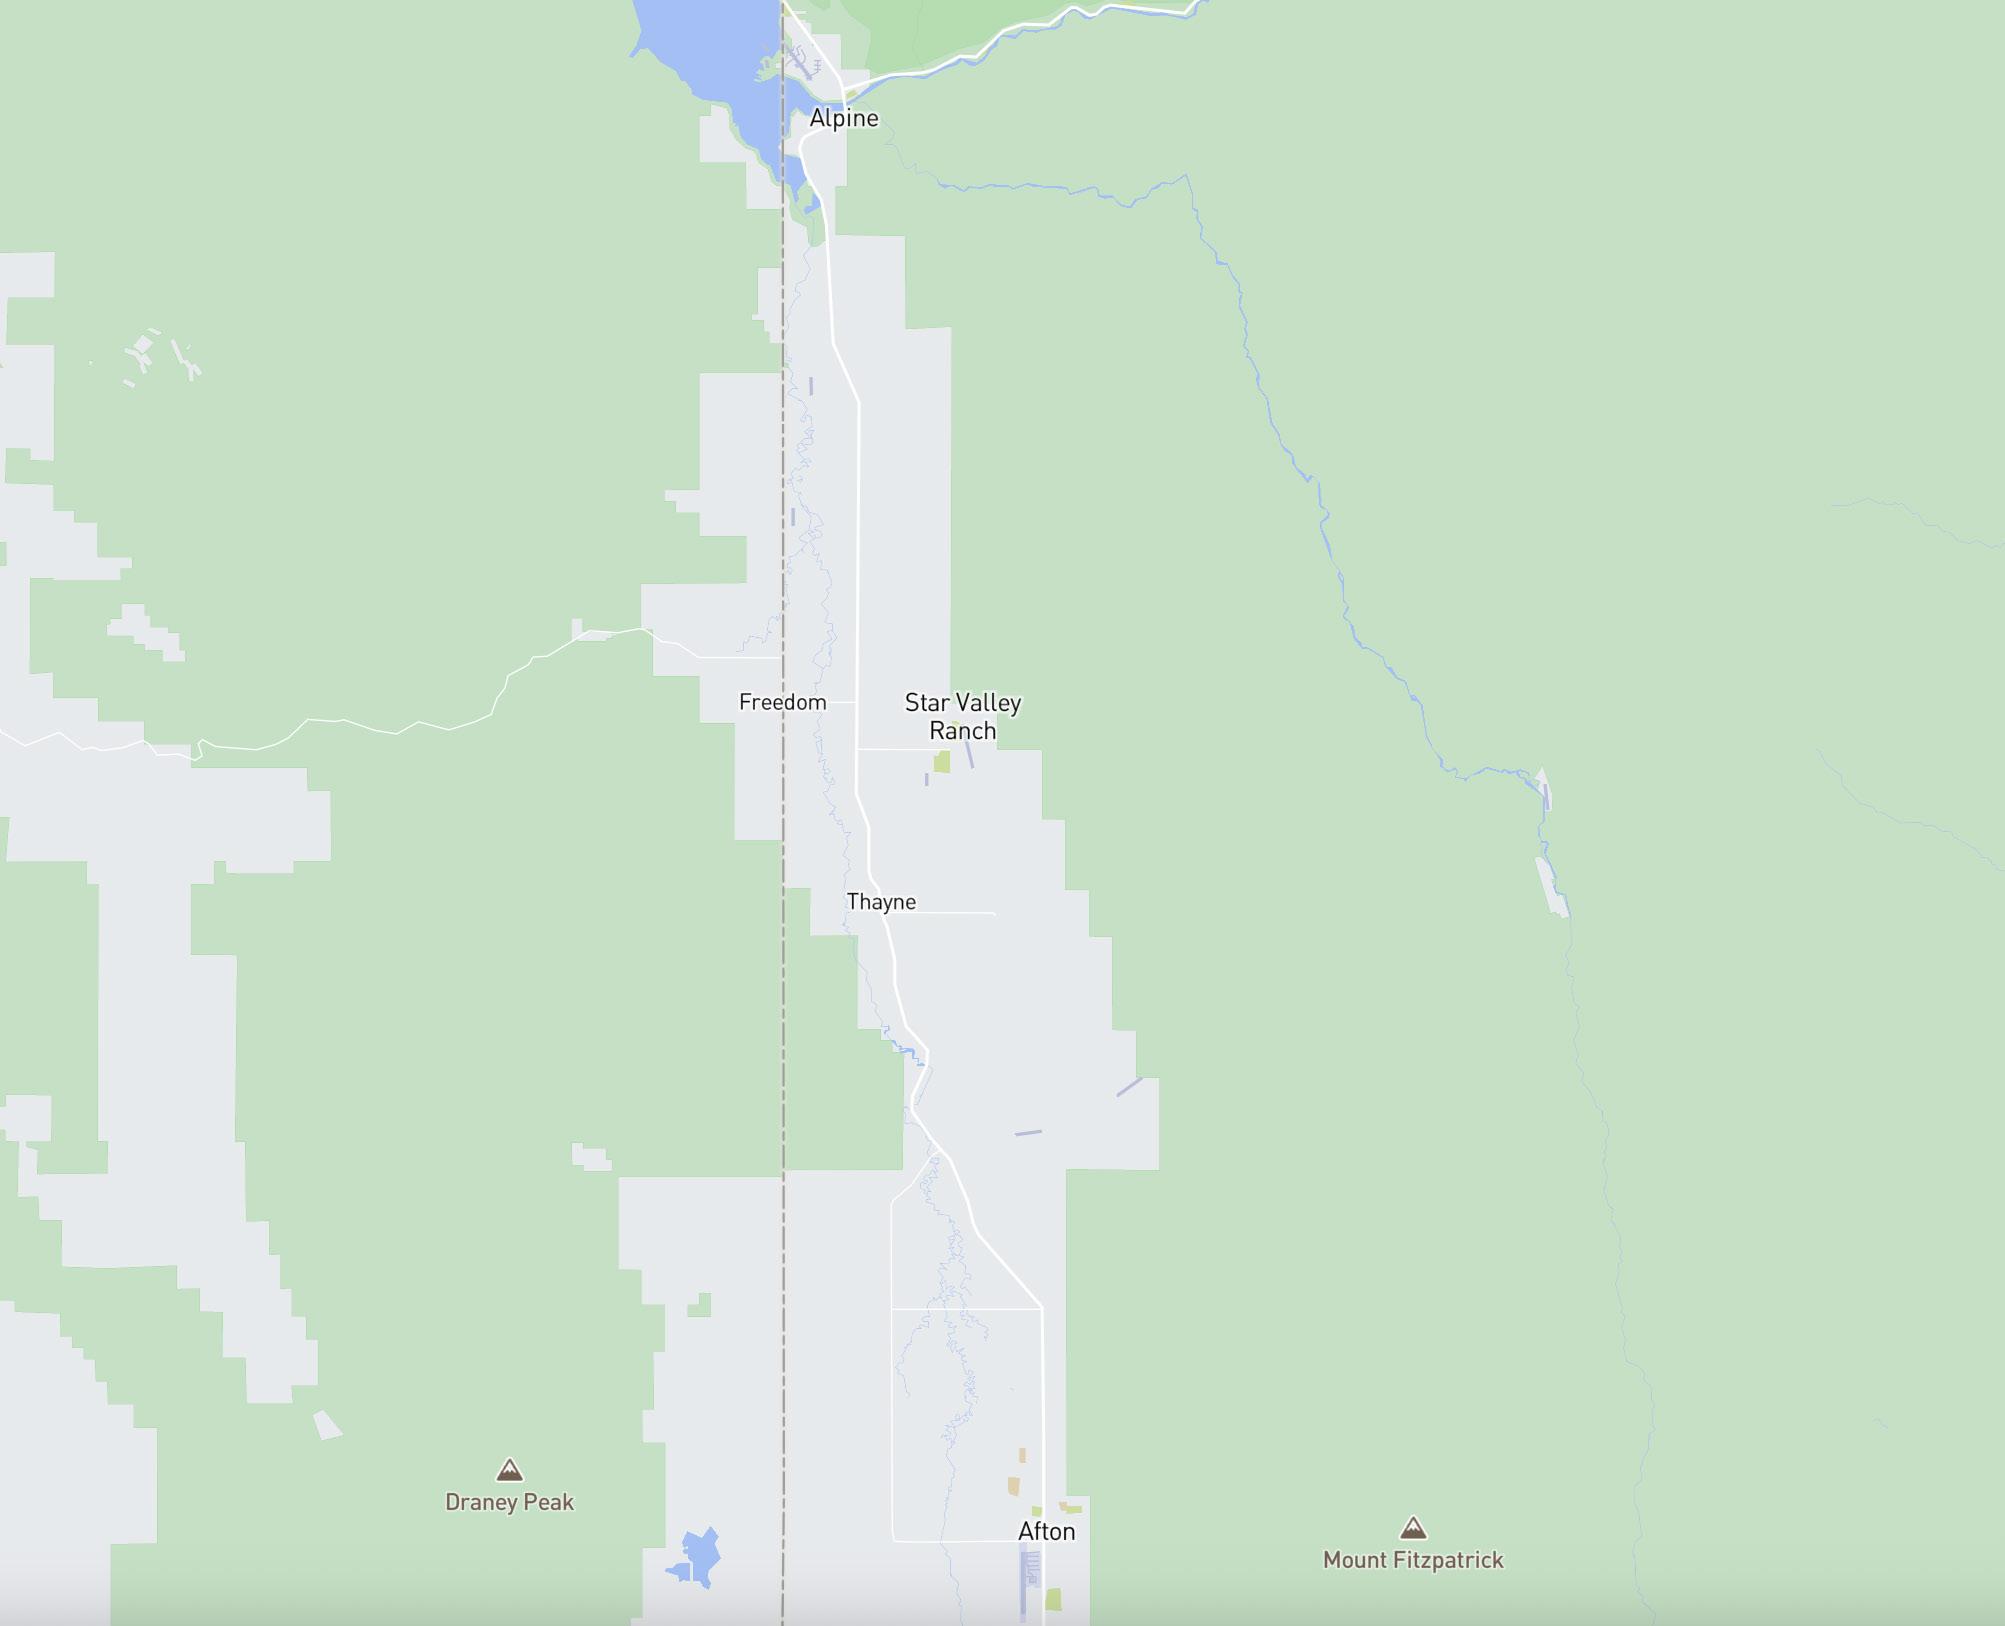
NORTHERN SV (72)
CENTRAL SV (95)
SOUTHERN SV (51)
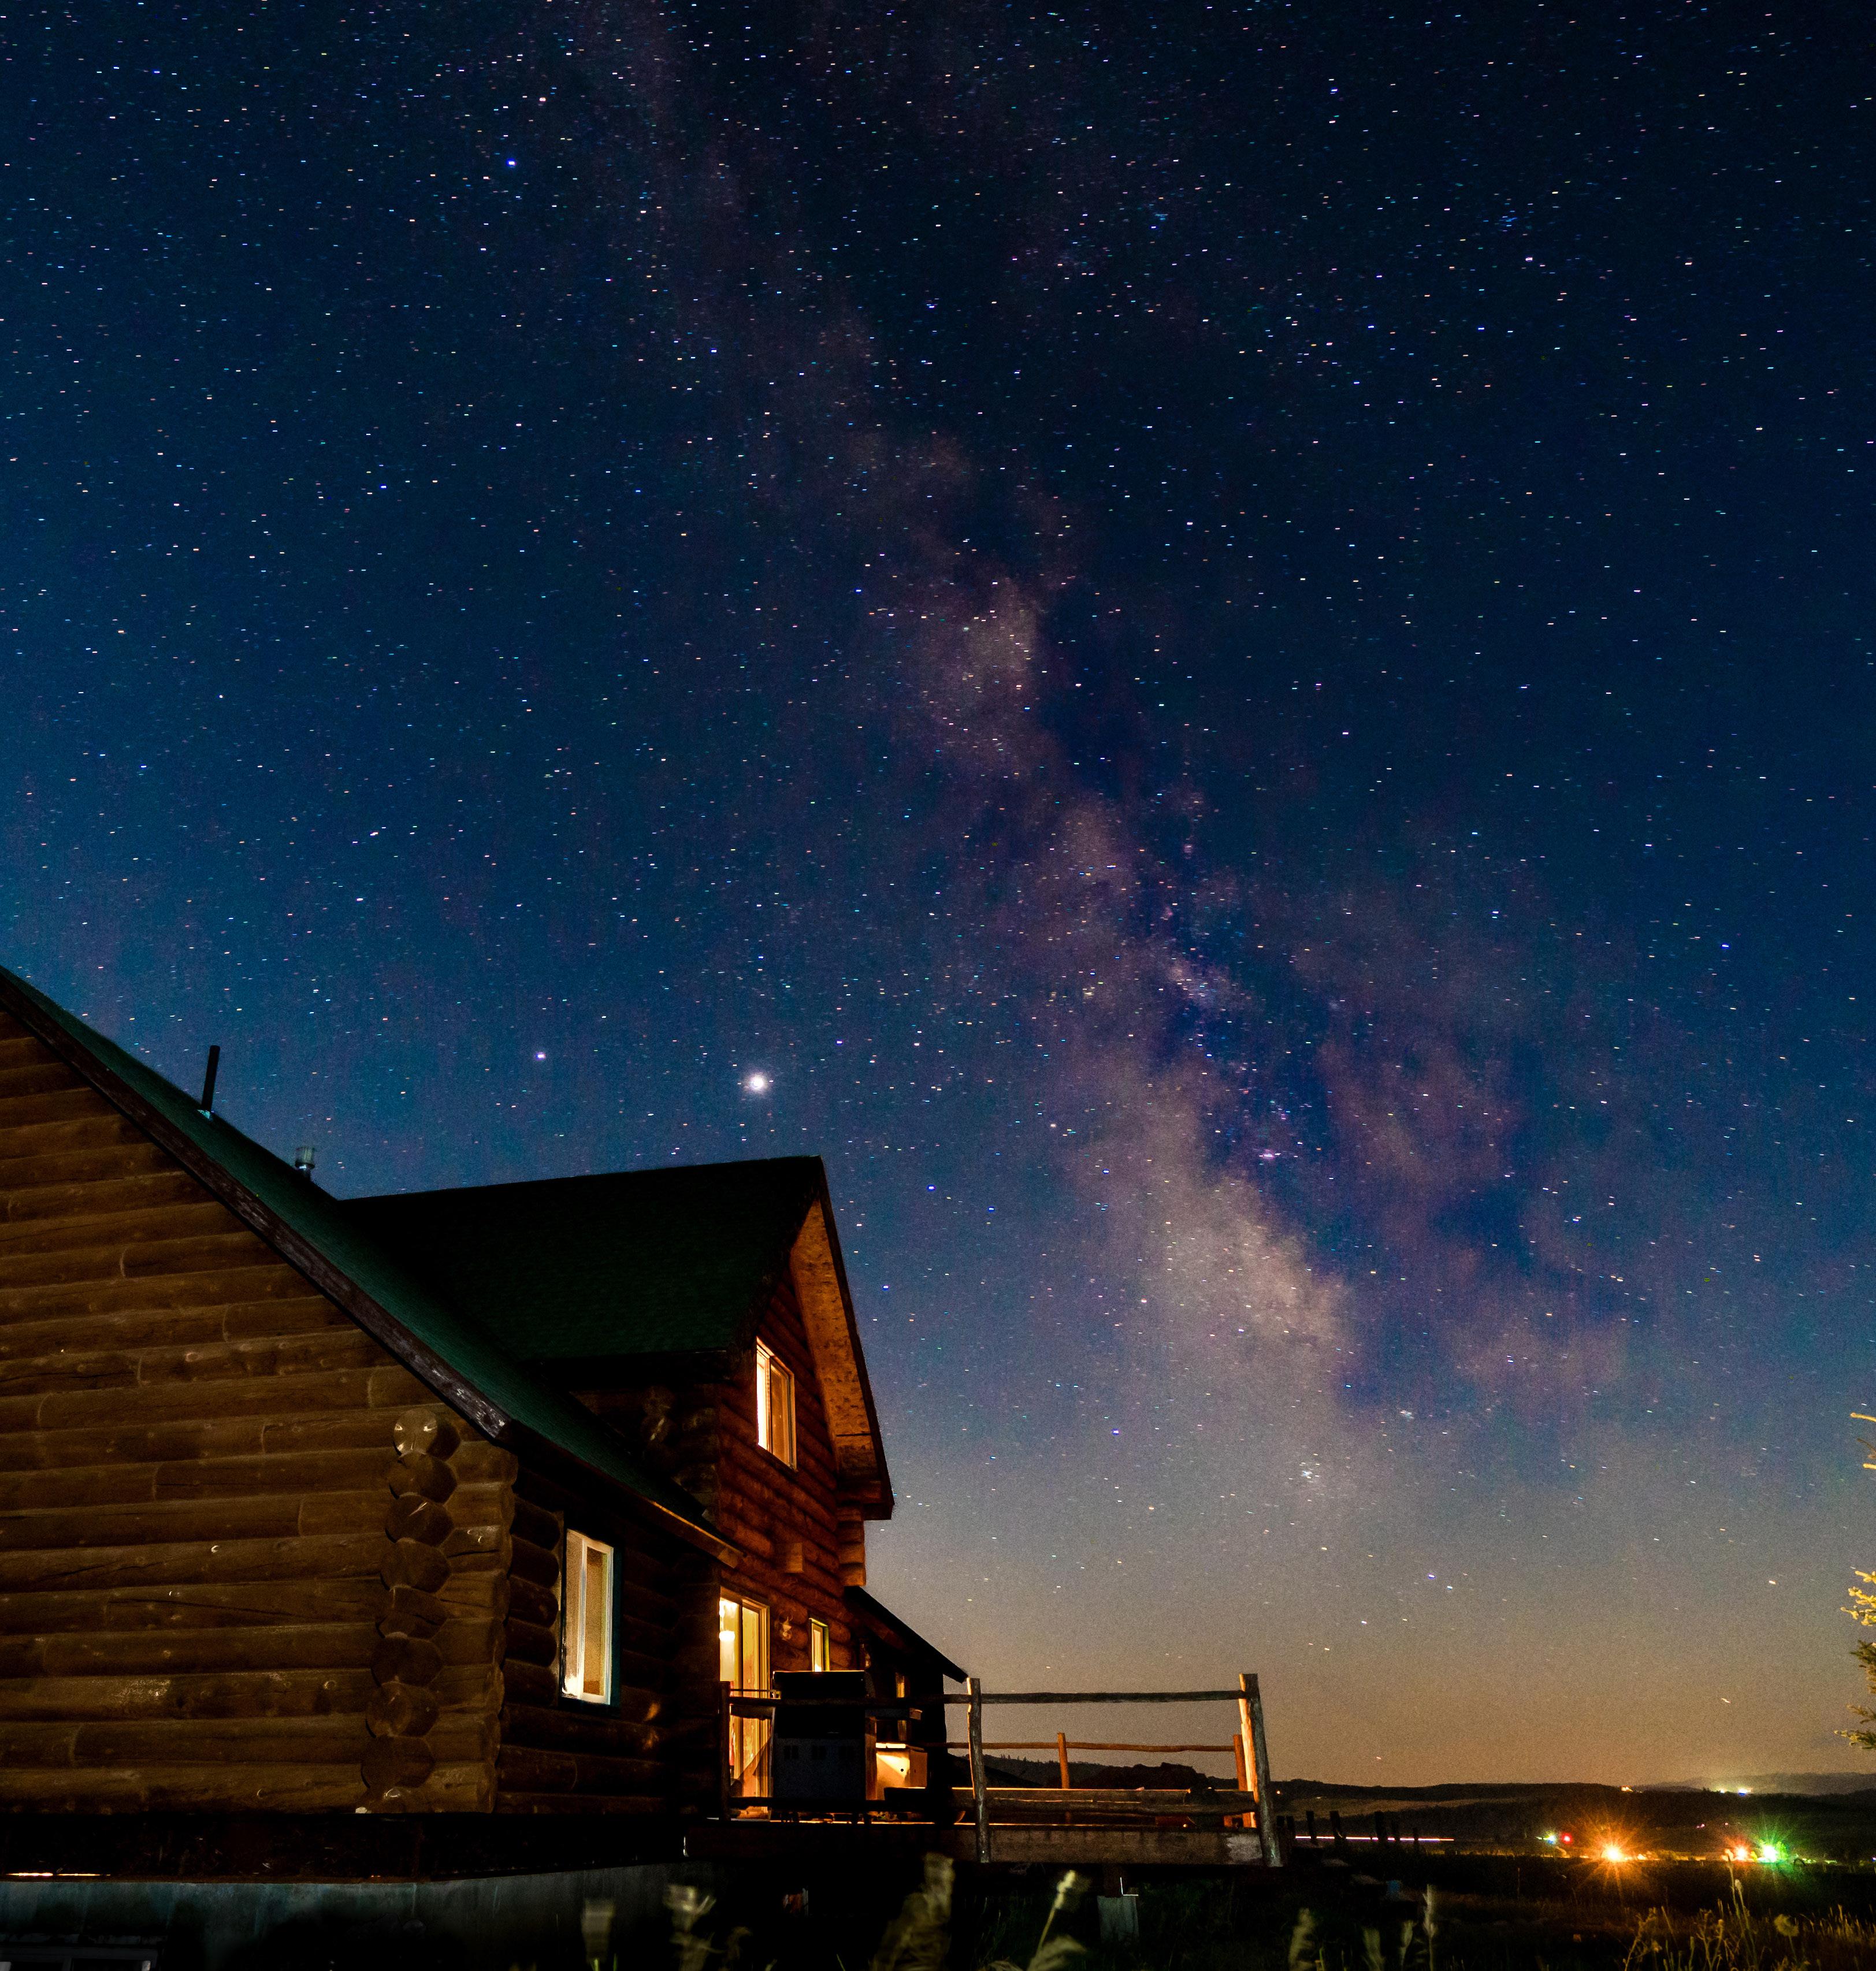
SINGLE FAMILY HOMES
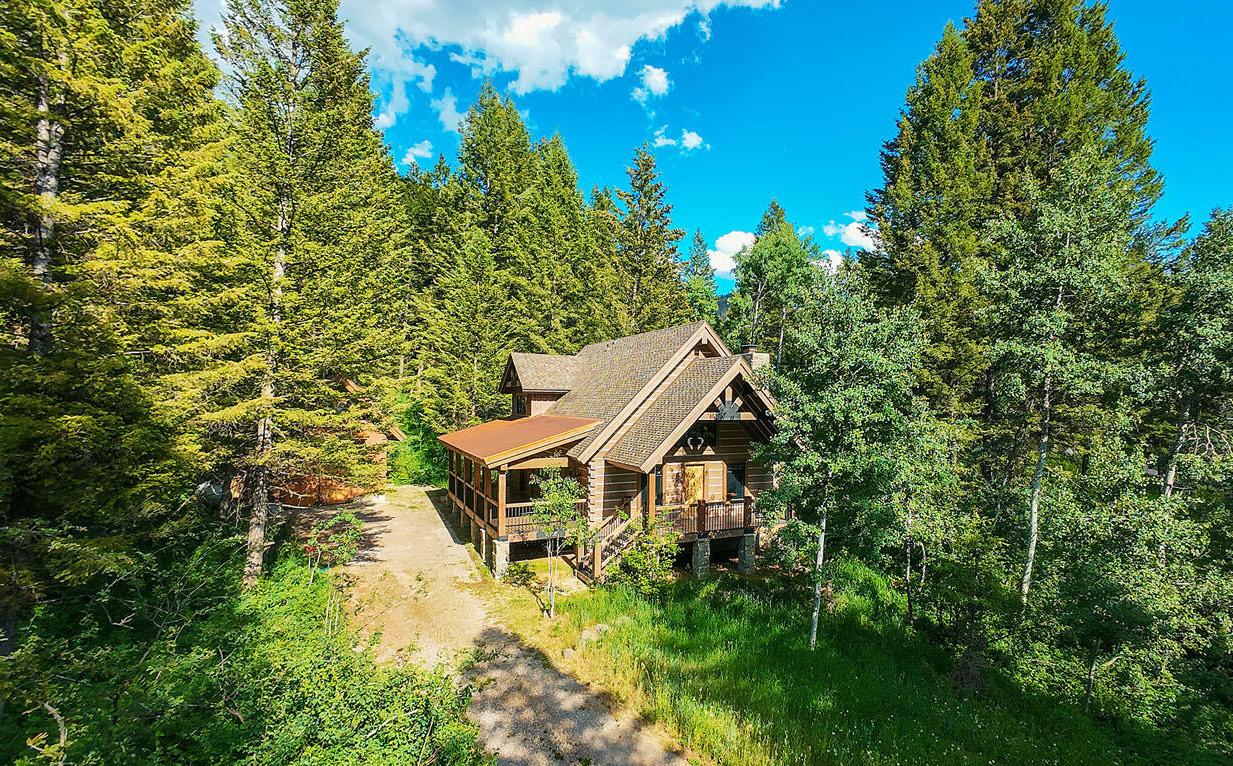
SOLD · LISTED AT $1,199,000 · STAR VALLEY RANCH REPRESENTED BY PATTY SPEAKMAN
The single-family home market in Star Valley gained meaningful momentum in Q2 2026, with total sales increasing 34% year over year to 95 closings. Growth was concentrated in Northern and Southern Star Valley, where transactions rose 106% and 170%, respectively. Central Star Valley moved in the opposite direction, with sales declining 25%, underscoring notable differences in buyer activity across the valley.
Pricing trends were mixed but generally stable at the midpoint of the market. The average sale price declined 16% to approximately $701,000, while the median increased 1% to $592,500. Northern Star Valley recorded a 28% decline in average pricing and a 9% drop in the median, reflecting fewer high-
end transactions. Central Star Valley also softened, with its average down 13% and median down 2%. Southern Star Valley produced the strongest pricing performance, with the average rising 1% and the median increasing 26% to $542,000.
Total dollar volume increased 12% to $66.6 million, supported by strong gains in Northern and Southern Star Valley that offset a 35% decline in Central Star Valley. Market pace improved, with average days on market falling 18% to 145 days. Active listings declined 3% to 201, while pending sales fell 24% to 26. Overall, Q2 reflected stronger completed sales but a more selective forward pipeline, favoring well-priced homes with strong condition, location, and value.
MARKET STATS
MARKET STATS BY AREA
VACANT LAND
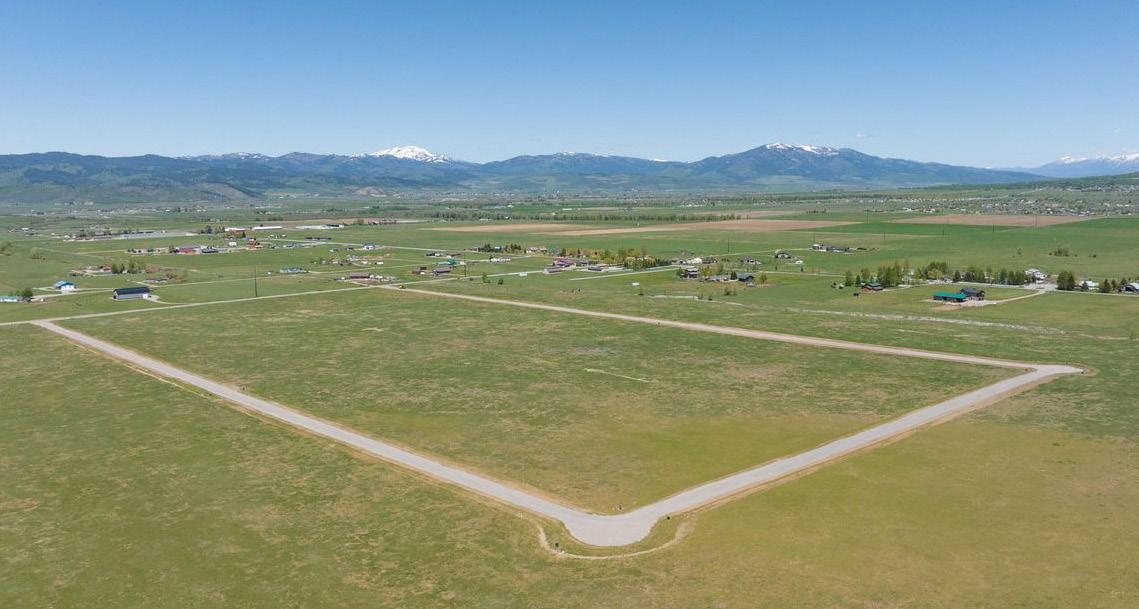
SOLD LISTED AT $195,000 THAYNE REPRESENTED BY CAMILLE THOMAS
The vacant land market in Star Valley gained momentum in Q2 2026, supported by stronger transaction activity across the valley’s primary submarkets. Total land sales increased 52% year over year to 114 transactions, while total dollar volume rose 58% to approximately $22.7 million. The increase demonstrates continued demand for attainable parcels and build-ready opportunities, even as buyers remained attentive to construction costs, infrastructure, and long-term usability.
Pricing trends also moved higher. The average sale price increased 4% to approximately $199,500, while the median rose 19% to $140,000, indicating broader support across entry-level and higher-value parcels. Central Star Valley remained the most active submarket, with sales increasing 68% to 62 and dollar volume rising 81%. Northern Star Valley recorded 32 sales, up 52%, while Southern Star Valley increased 18% to 20 transactions. Pricing improved most
noticeably in Central and Southern Star Valley, while Northern Star Valley’s median declined modestly.
Market pace improved despite a softer forward pipeline. Average days on market declined 22% to 143 days, suggesting that appropriately priced parcels moved more efficiently. Active inventory was essentially unchanged at 215 listings, while pending sales declined 20% to 24, pointing to more measured demand entering the second half of the year. The highest sale increased 22% to $2.1 million, while the lowest rose to $56,000.
Overall, Q2 2026 reflected a more active and broadly supported Star Valley land market. Buyers continued to favor well-located parcels with utilities, access, and clear development potential, while sellers of lessprepared land still needed realistic pricing and strong positioning.
MARKET STATS